
Harry Sit's Blog, page 18
December 27, 2022
Fidelity Full View + GPS: Track Your Portfolio Across All Accounts
Although every financial institution would like to have us use them for everything, most people have accounts at multiple places. It helps to consolidate, but no one institution does the best in everything. Vanguard has some good funds not available anywhere else. Fidelity has good customer service. Bank of America has a good credit card rewards program; the best way to qualify for it is through a Merrill Edge account.
It’s helpful to have a holistic view of all your investments in different accounts at different places. Some brokers offer functionality to track investments held elsewhere. I use the Full View feature from Fidelity.
Many bloggers recommend Personal Capital because Personal Capital pays bloggers for referrals. I’m not paid by Fidelity to write this. I’m only writing as a Fidelity customer.
Table of ContentsHosted by eMoneyActivate Full View(Optional) Add SpouseLink AccountAdd Account Manually(Optional) Link Spending AccountsNet Worth StatementAsset AllocationFidelity GPSStock AnalysisFixed Income AnalysisGPS ReportHosted by eMoneyFidelity’s Full View feature is hosted by eMoney. eMoney is a popular financial planning software used by financial advisors, with the highest market share according to one survey. Because financial advisors need to see the full picture of a client’s investments in multiple accounts before they give advice, eMoney has built features to pull in account and holdings information from a wide array of sources. It analyzes the aggregated data for financial advisors.
Fidelity bought eMoney some years ago. When you activate the Full View feature in your Fidelity online account, Fidelity basically creates a limited account for you on the eMoney platform through single sign-on. Because eMoney already has the account aggregation and portfolio analysis functionality and eMoney maintains it on an ongoing basis for financial advisors anyway, Fidelity gets the features for retail investors at no additional cost.
Full View is hosted by eMoney but the financial planning features of eMoney aren’t accessible in Full View unless you work with a Fidelity advisor.
If you don’t have a Fidelity account, you can open a small account or register a guest login to use Full View.
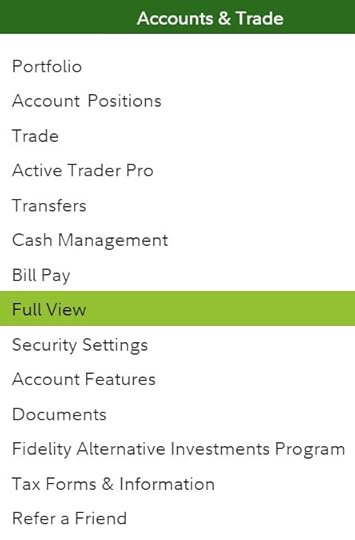
Activate Full ViewTo activate or access Full View, click on Accounts & Trade in the top menu and then Full View.
You’ll be asked to agree to the terms and conditions. You can unsubscribe from Full View in Settings on the top right if you don’t like it after you try it.
(Optional) Add SpouseIf you’re married, you can choose to add an entry for your spouse in Full View. This way you can differentiate accounts owned by you, your spouse, and joint accounts. Skip this part if you don’t care to differentiate account ownership.

Click on Organizer in the menu and then click on your name.
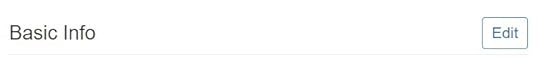
Click on Edit next to Basic Info and change your Marital Status to Married. Then you’ll see a link to add your spouse.
Link AccountFidelity accounts are automatically populated in Full View, including accounts that you’re authorized to access. If you’re married and you’d like to track accounts owned by both of you, it’s best to get authorization from your spouse in Fidelity first. See How to Manage a Family Member’s Fidelity Accounts.
You can link non-Fidelity accounts or you can add them manually. Linking accounts is the most convenient but it depends on where you have your other accounts.
Some financial institutions treat eMoney as an approved application to pull information through a secure read-only interface. Because eMoney is widely used by financial advisors, these financial institutions have vetted eMoney’s security and they’re comfortable providing special access to eMoney.

Choose “I have an online login to this account” to link an account.


When you search for the name of the financial institution, if it says “via Direct Web Service” or “via Direct Web API” it means the accounts can be linked through a special back channel. Charles Schwab and Vanguard fall into this camp. I linked my Vanguard accounts in Full View.
You enter your username and password once in Full View. eMoney pulls data through a secure special channel. Vanguard and Charles Schwab don’t require two-factor authentication (2FA) from eMoney because they treat eMoney as a trusted aggregation service.
When your non-Fidelity accounts are linked in Full View, any changes in the accounts are automatically reflected in Full View. Try linking your accounts first. eMoney has built connections to many financial institutions.
Add Account ManuallyIf you only see “via Direct Web Access” when you search for the financial institution for linking, it means the institution doesn’t provide a special back channel to eMoney.

In that case eMoney logs in online with your username and password. This is problematic when your account requires a security code. It works once but it stops working the next time because eMoney can’t get your security code.
Merrill Edge falls into this camp. I had to add my Merrill Edge account manually.
You can also choose to always add your account manually if you aren’t comfortable entering your password in eMoney.
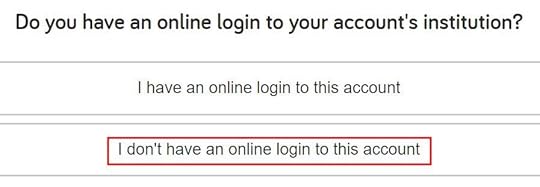
Choose “I don’t have an online login to this account” when you add an account manually.
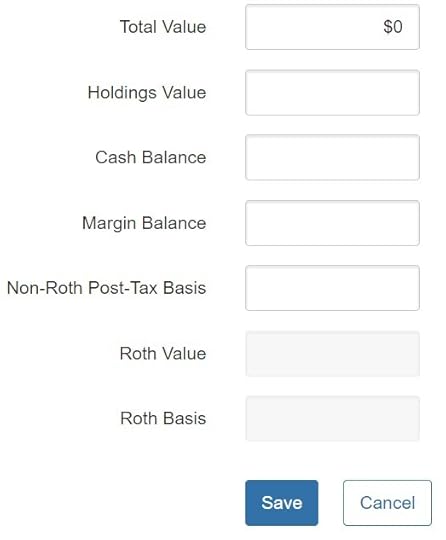
Leave these values blank if you want to use the portfolio analysis feature to look into the holdings in this account.
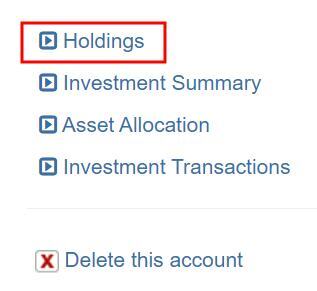
Click on the account you just added and then click on Holdings. Now you can add holdings with the ticker symbols and the numbers of shares. eMoney will update the account values with daily share prices but if the holdings and the numbers of shares change, you’ll have to update them manually, whereas linked accounts are automatically updated daily.
(Optional) Link Spending AccountsFull View also supports linking bank accounts and credit cards to track spending. Because most people don’t go to a financial advisor for advice on budgeting and spending, I suspect these features aren’t a high priority in eMoney. It works, but don’t expect bells and whistles.
I linked my credit cards from Bank of America just to see how it works. Full View pulls in my credit card transactions and puts them into spending categories (groceries, gas, travel, …). Sometimes it categorizes correctly; sometimes it doesn’t. You can correct the category for a transaction and define a rule to help it categorize correctly next time.
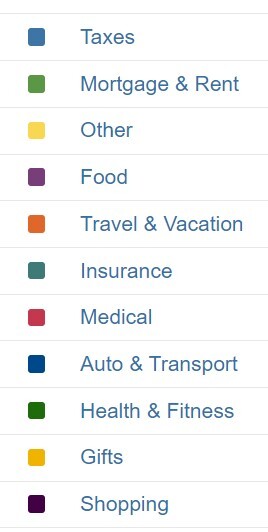
You get a pie chart and a list of how much you spent in each category in a set time period. The spending transactions only live in eMoney. Fidelity personnel can’t see your spending data.
Linking spending accounts is completely optional. It doesn’t affect the portfolio tracking part.
Net Worth StatementAfter you add all your accounts, head over to Reports in the menu.

The Net Worth Statement report shows the values of all your accounts grouped by account type (taxable, pre-tax, Roth, HSA) and by ownership (you, spouse, joint).
YouSpouseJointTaxable Account 1xxxxxPre-tax Account 2xxxxx Account 3xxxxxRoth Account 4xxxxx Account 5xxxxxHSA Account 6xxxxx Account 7xxxxxTotalxxxxxxxxxxxxxxxThis report gives a good summary of your accounts. If some accounts aren’t categorized correctly, you can go back to the list of accounts and edit the account type and ownership.
You can also add real estate and loan accounts in Full View to have them included in this Net Worth Statement report.
I print this report to give my wife a global view of our accounts.
Asset AllocationNow go to Investments in the menu.
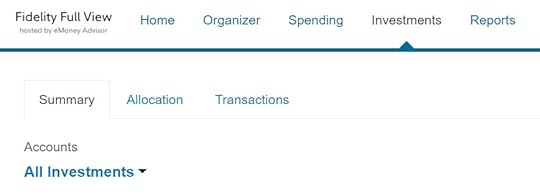
The Summary tab shows the total portfolio value and a breakdown by account.

eMoney categorizes each of your holdings into one or more asset classes. The Allocation tab shows a pie chart and a table of your asset allocation by asset class.
I print the asset allocation page to show my wife how our money is invested.
Fidelity GPSThe limited analysis features exposed in Full View are good for a broad view. You get a summary by account type and ownership, and you get your asset allocation by asset class. More portfolio metrics are back in Fidelity proper, which reads from Full View.
Click on Accounts & Trade -> Portfolio to get back to your Fidelity online account.

Click on the Analysis tab to the right of Summary, Positions, … If you’re using the Beta view, Analysis is under the More tab.

This sends you to Fidelity GPS, which stands for Guided Portfolio Summary. Fidelity GPS analyzes all investment accounts you have in Full View. This makes it worthwhile to add your non-Fidelity accounts in Full View.
The analysis is only based on holdings. It doesn’t include personal investment performance.
Stock Analysis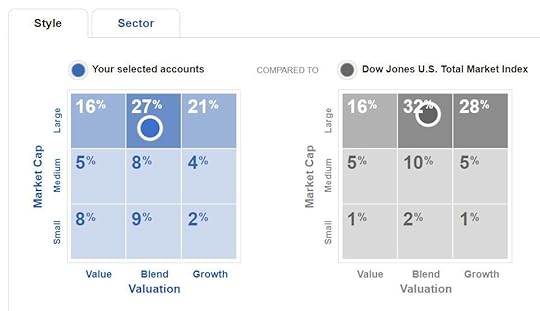
Stock Analysis shows you a Morningstar Instant X-Ray type of style box breakdown compared to the total stock market.
Fixed Income Analysis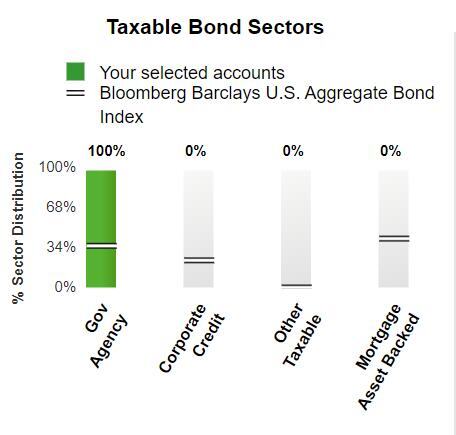
Fixed Income Analysis shows your bond holdings by sector.
GPS Report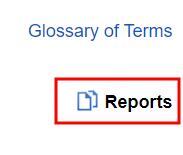
There are a number of other metrics in Fidelity GPS. You can click on the different menu items for more analysis or you can click on Reports on the right to generate a 30-page PDF report that includes all the analysis.
Review the report at your leisure and share it with your spouse.
***
It’s great to have a global view of all your accounts. If your accounts can be linked, having them automatically updated in Full View saves time. Fidelity GPS provides a more in-depth analysis of your entire portfolio, including both Fidelity accounts and non-Fidelity accounts you have in Full View.
Having all accounts in Full View also feeds into Fidelity’s retirement planning tool. I wrote about that tool three years ago. I’ll provide an update shortly.
Learn the Nuts and Bolts I put everything I use to manage my money in a book. My Financial Toolbox guides you to a clear course of action.Read Reviews
The post Fidelity Full View + GPS: Track Your Portfolio Across All Accounts appeared first on The Finance Buff.


December 19, 2022
Security Hardware for Vanguard, Fidelity, and Schwab Accounts
Most financial institutions have some type of two-factor authentication (2FA) now when you log into your account. You need something besides your username and password to access your account.
Using 2FA is better than not using it, but different forms of 2FA aren’t created equal. When you have a choice, use a stronger form of 2FA.
Table of ContentsThe Weakest Link: Password ResetGoogle Voice for SMSSecure Your EmailSymantec VIPBuy Hardware TokenRegister Token with FidelityYubikeyAdd Yubikey to Google AccountRegister Yubikey with VanguardSymantec VIP On YubikeyThe Weakest Link: Password ResetBefore banks and brokers implemented 2FA, the emphasis had been on the strength of your password — make it long and include mixed case letters, numbers, and symbols. With 2FA, the weakest link shifted to the password reset path. Criminals don’t bother cracking your password when they can just reset it.
As a drill, go through the “forgot password” process for your accounts and see which items are needed to reset your password. Those are the things you need to secure.
Google Voice for SMSSome financial institutions send security codes by SMS text message to a mobile phone number on file. This is weak because a mobile phone number can be hijacked through SIM swapping. A criminal can reset your password and gain access to your accounts after they hijack your mobile phone number.
You should get a Google Voice number and only use that number for your financial accounts. A Google Voice number is less prone to getting hijacked. Install the Google Voice app on your phone and read the security codes in the Google Voice app. Don’t forward text messages sent to your Google Voice number.
Your Google Voice number is secure after you secure your Google account. Google supports using a hardware key (see the Yubikey section later in this post) or a mobile authenticator app.
Some places refuse to send security codes to Google Voice numbers. I would avoid using them if they send security codes by SMS text message but they don’t support Google Voice numbers. That’s one reason I closed my account with Ally Bank.
Secure Your EmailSome financial institutions send security codes and password resets by email. That means you must secure your email. If a criminal hacks into your email, they can get the security code and reset the password to your bank or brokerage accounts.
If you Gmail, Google offers Advanced Protection with a hardware key (see the Yubikey section later in this post) or a mobile authenticator app.
Symantec VIPFidelity, Charles Schwab, and E*Trade support the free Symantec VIP mobile app on your phone. The app generates a six-digit security code that you use with your username and password.
A mobile app is more secure than text messages because it’s tied to a physical device, not to a phone number that can be hijacked remotely. However, you won’t be able to log in to your accounts if you lose your phone. Malware on your phone can also potentially read your security codes.
If you upgrade to a different phone, you can reinstall the app but the Symantec VIP credential ID can’t be transferred to your new phone. You’ll have to link a new credential ID to your login.
Buy Hardware TokenMany people don’t know you can actually buy a hardware token for Symantec VIP. The hardware token isn’t connected to the Internet. Malware on your phone can’t read it. You won’t lose it if you lose your phone. You won’t have to change your credential when you upgrade your phone.
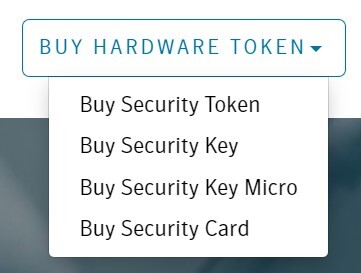
Go to the official Symantec VIP website. Click on “Buy Hardware Token” on the top right. The first link “Buy Security Token” sends you to the token sold on Amazon.
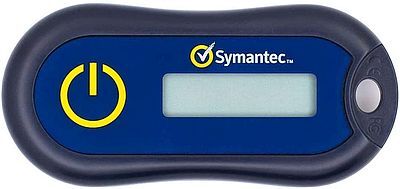
A Symantec VIP hardware token costs only $12.50 as I’m writing this. You can register the same token at Fidelity, Schwab, E*Trade, and anywhere else that also uses Symantec VIP.
Register Token with FidelityYou must call Fidelity customer service to link the serial number of the security token to your login.
Fidelity requires separate tokens for separate logins. Get two tokens if you’re married and both of you have Fidelity accounts.
YubikeyVanguard supports Yubikey, which is a hardware key that you plug into a USB port on your computer.

The least expensive Yubikey costs $25 or $29 on the manufacturer’s website, depending on the type of USB port on your computer. You should buy two Yubikeys. The second key serves as a backup in case you lose one.
Add Yubikey to Google AccountIf you’d like to use Yubikeys to secure your Google account, enroll in Google’s Advanced Protection Program. Google sells Titan Security Keys but Yubikeys will work for both Google and Vanguard.
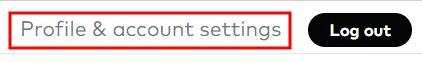
Register Yubikey with VanguardTo register your Yubikeys with Vanguard, click on “Profile & account settings” on the top right after you log in.
Click on the Security tab and then “Security key.”
Repeat the process to add your second key. A married couple can register the same two Yubikeys with Vanguard for their separate logins. This way the two keys can work interchangeably for both logins.
Symantec VIP On YubikeyFor those who are more technically inclined, you can actually put a Symantec VIP credential on a Yubikey. It requires a more expensive version of Yubikey that has two “slots.”
This blog post by engineer Paul Sambolin gives details on putting Symantec VIP on a Yubikey for E*Trade:
After the Symantec VIP credential is put on a Yubikey, it works similarly for Fidelity and Charles Schwab.
This is too much work than it’s worth in my opinion because a Symantec VIP token is both inexpensive and straightforward. Go at it if you enjoy playing with technology.
***
Buying security hardware costs more than using text messages or a mobile app, but the extra security and peace of mind are worth it.
Brokerage firms in general have better support for security hardware because they tend to deal with larger amounts of money. Most banks are still stuck at sending SMS text messages. It’s one reason that I closed my online savings account and favor using a money market fund now.
Learn the Nuts and Bolts
I put everything I use to manage my money in a book. My Financial Toolbox guides you to a clear course of action.Read ReviewsThe post Security Hardware for Vanguard, Fidelity, and Schwab Accounts appeared first on The Finance Buff.
December 7, 2022
How to Manage a Family Member’s Fidelity or Vanguard Accounts
When you have a joint account, either person on the account can transact in the account. As part of our estate planning package, my wife and I created a trust with both of us as co-trustees (see Will and Trust Through Employer Legal Plan). We stated in the trust that each trustee can act alone. Our trust account is set up as such, similar to a joint account.
Table of ContentsNo Joint IRA or Joint HSAPower of Attorney May Not Be RecognizedNot Limited to SpouseNo Sharing Login and PasswordVanguardFidelityBidirectional PermissionsNotarized SignaturesNew AccountsRevoke AuthorizationTrusted ContactsNo Joint IRA or Joint HSAHowever, our IRAs and HSAs can only be in our individual names. It’s not possible to have a joint IRA or a joint HSA.
We have named each other as the beneficiary of our IRAs and HSAs, but the beneficiary only becomes relevant after the account owner dies. When your spouse is living, you don’t have any authority over their IRA or HSA unless they specifically grant you permission.
Power of Attorney May Not Be RecognizedWe also executed a Durable Power of Attorney (DPOA) in our estate planning package. We granted the authority to act on behalf of each other in case we aren’t capable to act ourselves, but we also learned that financial institutions often don’t recognize these generic Powers of Attorney. They want their own language specific to accounts at their institution.
It’ll be a bummer if you’re only told they don’t accept your Power of Attorney when you really need to use it. Most financial institutions have a process to get authorization from someone to transact in their accounts. It’s better to be prepared and go through the process before you need to act on someone’s behalf.
Not Limited to SpouseAlthough it’s most common to get authorization from your spouse, the authorization process doesn’t limit it to a spouse. The account owner can grant authorization to anyone — a sibling, an adult child, or even a non-family member.
Except for a married couple, it’s better in many situations to only get authorization to manage the accounts and not become a joint owner (you can’t be a joint owner of a retirement account anyway). You may be responsible for part of the taxes if you’re a joint owner.
No Sharing Login and PasswordGoing through the official authorization process is the right way to do it. Using another person’s login and password can weaken their protection from the financial institution. It can also put you in a position where you can be accused of identity theft or hacking.
After the account owner gives authorization, you should log in with your own username and password when you manage their accounts.
VanguardWe have IRAs at Vanguard. Vanguard has a process for an account owner to authorize another person to act on their behalf over their accounts. They call it agent authorization or account permissions.
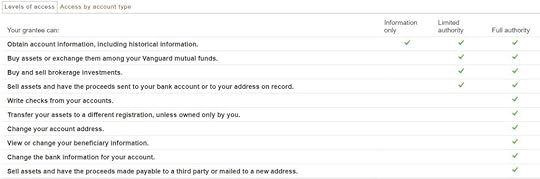
Vanguard allows three levels of access.
If you have Information Only access, you can monitor the account but you can’t do anything.If you have Limited Authority, you can transact within the account or send money out to an already-linked bank account or the address on file. If you have Full Authority, you can do a number of other things.The process has to be initiated by the account owner.
You can grant the Information Only or Limited Authority permission online. It’s not clear how you can grant Full Authority. It looks like there used to be an Agent Authorization form but all the links to the form are dead on Vanguard’s website. Please contact Vanguard customer service to get the form for Full Authority.
Here’s how to grant Information Only or Limited Authority permission online:
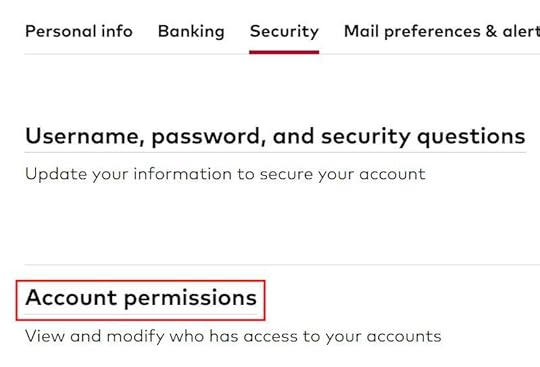
After logging in to Vanguard, click on “Profile & account settings” at the top. Then click on the Security tab and “Account permissions.”
The grantee must also have a Vanguard account. The account owner needs one of the grantee’s Vanguard account numbers. Vanguard will send an email to the grantee to confirm that they will accept the authorization. The permissions are effective only after the grantee accepts. The grantee will see additional accounts listed when they log in.
FidelityWe also have IRAs and HSAs at Fidelity. Fidelity has a similar process for the account owner to grant permissions. They have a clear explanation and a video about their four levels of access:
The account owner can follow the link in the explainer above to start the process to authorize access to their accounts.
Similar to Vanguard, Fidelity will send an email to the person receiving the authorizations. The authorizations are effective only after the grantee accepts.
The grantee will see additional accounts listed when they log into their Fidelity account. The additional accounts will be under a separate account group. They can customize the display name of each account to something that makes more sense to them.
Bidirectional PermissionsIf a married couple would like to grant permission to each other, they need to go through the process separately from each direction.
Notarized SignaturesGranting the highest level of authorization — Full Authority in Vanguard and Power of Attorney in Fidelity — requires notarized signatures from both parties and witnesses. If you’d like to grant access at the highest level, you can grant at the second-highest level online first while you work on the paperwork for the highest level.
New AccountsThe authorizations are for specific accounts. They don’t automatically apply to new accounts. Remember to go through the authorization process again for new accounts.
Revoke AuthorizationThe account owner can revoke the permission at any time. Follow the same process of granting authorization to revoke prior authorizations.
Trusted ContactsIn light of elder financial abuse and scams, new regulations require financial institutions to offer the ability to designate trusted contacts. When a financial institution suspects that a customer is being scammed or the customer has displayed diminished mental capacity, they will reach out to the trusted contacts to make sure the transactions are legit or alert the trusted contacts of potential issues.
Adding a trusted contact by itself does not give the trusted contact any permission to access the accounts but it can be used in conjunction with account access permissions. For instance, if an elderly parent adds an adult child as the trusted contact in addition to giving the adult child permission to view the accounts, the adult child can monitor the parent’s accounts and receive alerts from the financial institution for suspicious activities.
To add trusted contacts:
Fidelity: How to add a trusted contactVanguard: Profile & account settings -> Trusted ContactLearn the Nuts and Bolts
I put everything I use to manage my money in a book. My Financial Toolbox guides you to a clear course of action.Read ReviewsThe post How to Manage a Family Member’s Fidelity or Vanguard Accounts appeared first on The Finance Buff.
How to Let Your Spouse Access Your Fidelity or Vanguard Accounts
When you have a joint account, either person on the account can transact in the account. As part of our estate planning package, my wife and I created a trust with both of us as co-trustees (see Will and Trust Through Employer Legal Plan). We stated in the trust that each trustee can act alone. Our trust account is set up as such, similar to a joint account.
Table of ContentsNo Joint IRA or Joint HSAPower of Attorney May Not Be RecognizedNot Limited to SpouseVanguardFidelityBidirectional PermissionsNotarized SignaturesNew AccountsRevoke AccessNo Sharing Login and PasswordTrusted ContactsNo Joint IRA or Joint HSAHowever, our IRAs and HSAs can only be in our individual names. It’s not possible to have a joint IRA or a joint HSA.
We have named beneficiaries, but the beneficiaries only become relevant after the owner dies. When you are living, a spouse doesn’t have any authority over your IRA or your HSA unless you specifically grant the permissions.
Power of Attorney May Not Be RecognizedWe also executed a Durable Power of Attorney (DPOA) in our estate planning package. We granted the authority to act on behalf of each other in case we aren’t capable to act ourselves, but we also learned that financial institutions often don’t recognize these broad Powers of Attorney. They want their own language.
It’ll be a bummer if you’re only told they don’t accept your Durable Power of Attorney when you really need to use it. Most financial institutions have a process to give someone access to your accounts. It’s better to be prepared and go through the process before you need someone to act on your behalf.
Not Limited to SpouseAlthough it’s most common to give access to your spouse, the authorization process doesn’t limit it to a spouse. You can grant authorization to a sibling, an adult child, or even a non-family member.
VanguardWe have IRAs at Vanguard. Vanguard has a process to authorize another person to act on your behalf over your accounts. They call it agent authorization or account permissions.
Vanguard allows three levels of access.
“Information Only” can monitor the account but can’t do anything. “Limited Authority” can transact within the account or send money out to an already linked bank account or the address on file. “Full Authority” can do a number of other things.You can grant the Information Only or Limited Authority permission online. It’s not clear how you can grant Full Authority. It looks like there used to be a form but all the links to the form are dead on Vanguard’s website. Please contact Vanguard customer service if you’d like to grant Full Authority.
After you log in to your Vanguard account, click on “Profile & account settings” at the top.
Click on the Security tab and then “Account permissions.”
The grantee must also have a Vanguard account. You need one of their Vanguard account numbers. Vanguard will send an email to the grantee to confirm that they will accept the authorization. The permissions are effective only after the grantee accepts. The grantee will see additional accounts listed when they log in.
FidelityWe also have IRAs and HSAs at Fidelity. Fidelity has a similar process to grant permissions. They have a clear explanation and a video about their four levels of access:
Follow the link to start the process to authorize access to your accounts.
Similar to Vanguard, Fidelity will send an email to the person receiving the access authorizations. The authorizations are effective only after the grantee accepts.
The grantee will see additional accounts listed when they log into their Fidelity account. The additional accounts will be under a separate account group. They can customize the display name of each account to something that makes more sense to them.
Bidirectional PermissionsIf a married couple would like to give access to each other, they need to go through the process separately from each direction.
Notarized SignaturesGranting the highest level of access — Full Authority in Vanguard and Power of Attorney in Fidelity — requires notarized signatures. If you’d like to grant access at the highest level, you can grant at the second-highest level online first while you work on the paperwork for the highest level.
New AccountsThe access permissions you grant are for specific accounts. Remember to go through the authorization process again when you open new accounts.
Revoke AccessThe person who granted access can revoke the permission at any time. Follow the same process of granting access to revoke access to your accounts.
No Sharing Login and PasswordGoing through the official process of authorizing access is the right way to do it. Sharing your login and password with another person can weaken your protection from the financial institution. It can also put the other person in a position where they can be accused of identity theft or hacking.
After you authorize access, each person should log in with their own username and password.
Trusted ContactsIn light of elder financial abuse and scams, new regulations require financial institutions to offer the ability to designate trusted contacts. When they suspect a customer is being scammed or the customer has displayed diminished mental capacity, the financial institution will contact the trusted contact(s) to make sure the transactions are legit or alert the trusted contacts of potential issues.
Adding a trusted contact by itself does not give the trusted contact any permission to access the accounts but it can be used in conjunction with account access permissions. For instance, if an elderly parent adds an adult child as the trusted contact in addition to giving the adult child permission to view the accounts, the adult child can monitor the parent’s accounts and receive alerts from the financial institution for suspicious activities.
To add trusted contacts:
Fidelity: How to add a trusted contactVanguard: Profile & account settings -> Trusted ContactLearn the Nuts and Bolts
I put everything I use to manage my money in a book. My Financial Toolbox guides you to a clear course of action.Read ReviewsThe post How to Let Your Spouse Access Your Fidelity or Vanguard Accounts appeared first on The Finance Buff.
December 5, 2022
Roth Conversion with Social Security and Medicare IRMAA
I showed how to estimate the effect of Roth conversion and capital gains when you get health insurance from the ACA marketplace in the previous post Roth Conversion and Capital Gains On ACA Health Insurance. Some readers expressed interest in seeing the same for retirees on Social Security and Medicare.
Table of ContentsRoth Conversion for RetireesCase Study SpreadsheetDownload the SpreadsheetScenario – Married Filing JointlyAge and Filing StatusIncome and MedicareBaseline TaxesExplore Roth ConversionAdjust the Chart ScaleSet the Starting PointExtend the RangeSave the SpreadsheetScenario – SingleLimitationsRoth Conversion for RetireesWhen you do a Roth conversion, you transfer an amount of money from your pre-tax account to your Roth account. This makes you pay taxes on the transferred amount now in the hope of avoiding paying taxes at a higher rate in the future. It’s a form of prepayment.
As in other situations of prepayments, sometimes it makes sense to prepay, and sometimes it doesn’t make sense to prepay. You convert to Roth and prepay taxes now when you think your tax rates in the future will be higher than your tax rates now.
You need to know what tax rate you pay on your Roth conversion in order to judge whether it makes sense to convert. The tax rate you pay on your Roth conversion depends on how much you convert. Conversely, if you set a limit on the tax rate you’re willing to pay on a Roth conversion, you need to know how much you can convert before you hit that maximum tax rate.
Case Study SpreadsheetMy favorite tool for this type of planning calculation is the Case Study Spreadsheet created by user MDM on the Mr. Money Mustache forum. Using downloaded tax software also works, but tax software for the current year usually doesn’t come out until November or December and it’s often incomplete pending updates at that stage. The Case Study Spreadsheet is updated much sooner.
It’s an actual spreadsheet file, not an online one. You will need Microsoft Excel or compatible software to open it. As with anything downloaded from the internet, you will have to trust the source. I had some interaction with the author over email. I trust this spreadsheet.
The spreadsheet does a lot of things. It looks overwhelming if you are only looking for one feature out of many. I will show you how this spreadsheet calculates the effect of Roth conversion when you are on Social Security and Medicare. I used version 22.06a released on November 26, 2022.
Download the SpreadsheetThe link to the most recent version of the spreadsheet is in the first post in the Case Study Spreadsheet updates thread in the Mr. Money Mustache forum. Click on the link and choose File -> Download to save the file to your computer. Make a copy of the spreadsheet and only work with the copy. This way you can always start fresh from another copy of the original spreadsheet to model different inputs.

If your computer uses Windows, right-click on the copy in the file folder and click on Properties. Check the Unblock box to enable macros in the spreadsheet.
Open the copy in Microsoft Excel or a compatible program. Click on Enable Editing in the yellow ribbon you see in Excel.
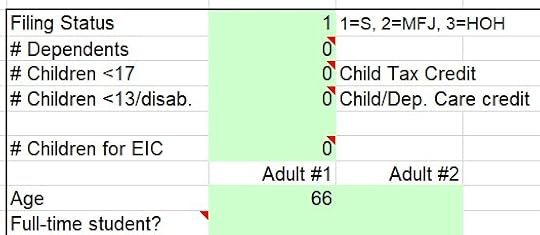
Scenario – Married Filing JointlyI’ll use this scenario of a married couple as the first example.
A retired couple, both age 66, Florida residents, married filing jointly with no dependents. They live on $60,000 of Social Security benefits, $20,000 of Traditional IRA withdrawals, $5,000 of interest income, and $10,000 of qualified dividends. They have no other income or deductions. Both of them enrolled in Medicare Part B and Part D.
They’d like to know how it affects their taxes if they convert different amounts from their Traditional IRA to Roth.
Age and Filing StatusClick on the Calculations tab at the bottom of the spreadsheet. First, you enter your filing status, your number of dependents, and ages in green-shaded cells starting at cell G2.
You go down to cell H37 to enter your state of residency.
 Income and Medicare
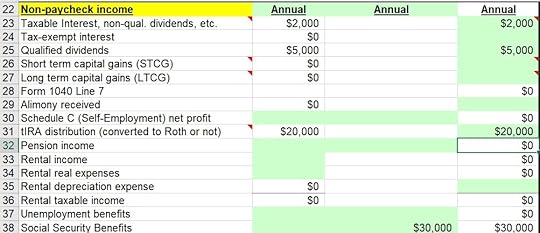
Next, you enter your income. Because the couple in our scenario are both retired, we skip the paycheck items and go down to the non-paycheck income starting at cell D23. You only input into cells shaded in green. Use annual numbers here.
Because they’re both on Medicare, we enter their Medicare Part D premium in cell AF78. This is the monthly premium for one person. If they’re on different Part D plans, use the average premium of the two plans. Here we assume their monthly Part D premium is $40 per person.
 Baseline Taxes
Now we go back to the tax calculation area starting at cell F11. This shows their baseline income taxes.
This retired couple with a gross income of $95,000 pays $2,015 in taxes. That’s only a little over 2% of their gross income.
Explore Roth ConversionThis couple is interested in doing Roth conversion to take advantage of their low tax rates. Scroll down to cell F81 to see a chart like this:
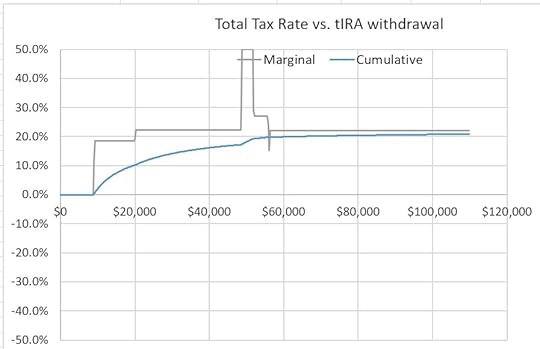
It shows the marginal and cumulative tax rates at different amounts of withdrawals from their Traditional IRA. The number on the X-axis includes the $20,000 they’re already withdrawing from their Traditional IRAs for living expenses.
We make a few tweaks to see the chart better.
Adjust the Chart ScaleBy default, the Y-axis in the chart goes between -50% and +50%. The bottom half of the chart is empty right now. Select the Y-axis in the chart, right-click, and click on Format Axis… Set the minimum to 0 and the maximum to 0.6. It will use the full space for the chart.
Set the Starting PointBecause this couple already withdraws $20,000 from their Traditional IRAs for living expenses, we can set the starting point at $20,000 to evaluate only withdrawals above and beyond $20,000 for a Roth conversion. Enter 20,000 in cell P84. Now the chart looks like this:
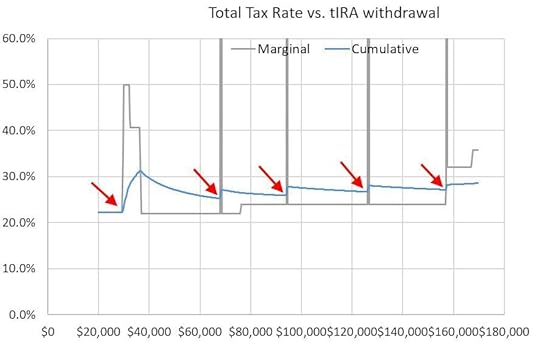
It shows that converting about $25,000 (to take the total withdrawal from Traditional IRAs to $45,000) will incur a marginal tax rate of about 22%. Then the marginal tax rate spikes up to 50% before it settles down to 22% again when the total withdrawals hit about $55,000.
The spike is the so-called tax torpedo, which happens when additional income makes more of the Social Security benefits taxable (see previous post Calculator: How Much of My Social Security Benefits Is Taxable?). Although the 50% marginal tax rate looks scary, it applies to only a sliver of their income. As they increase their Roth conversion to $90,000, the effect of the “tax torpedo” gets spread out. It only causes a slight increase in their cumulative tax rate (the blue line) — from 22% to 23%. The “tax torpedo” is more like a small ding than a torpedo for this couple.
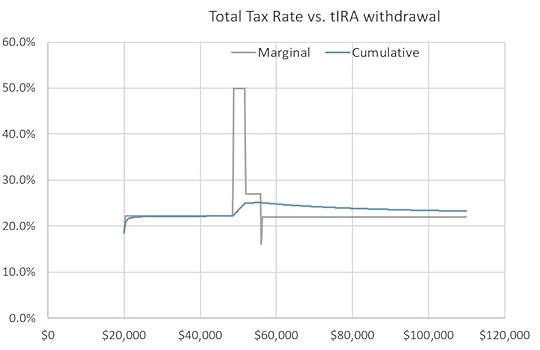
Extend the RangeIncreasing the number in cell P83 will extend the X-axis in the chart to larger numbers. For example, changing cell P83 to $700 makes the chart look like this:
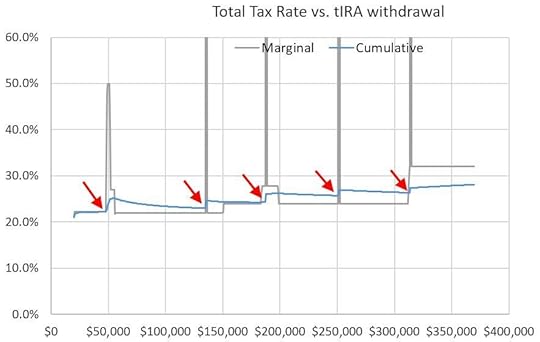
The next four spikes in the marginal tax rate (the gray line) represent Medicare IRMAA. Point your mouse at points before the blue line jumps up. You’ll see the total Traditional IRA withdrawals and the cumulative tax rate associated with each jump. Subtract the baseline Traditional IRA withdrawals for living expenses from the total Traditional IRA withdrawals to get the amount for Roth conversion.
The chart shows they’ll pay about 23% in taxes on their Traditional IRA withdrawals if they convert $115k before their income hits the first threshold for IRMAA. The cumulative tax rate will be 24% if they convert $165,000 and stop before the second IRMAA tier, 26% if they convert $230,000 and stop before the third IRMAA tier, and so on.
Break PointRoth Conversion AmountCumulative Tax RateBefore “tax torpedo”$25,00022%Before the first IRMAA tier$115,00023%Before the second IRMAA tier$165,00024%Before the third IRMAA tier$230,00026%This couple can decide how much to convert based on the size of their pre-tax accounts and their view of tax rates in the future. Convert more if they have large pre-tax accounts and they think tax rates will be high in the future. Convert less if they don’t have large pre-tax accounts and they think tax rates will be low in the future.
The shape and the breakpoints for your specific scenario will be different. You can follow this example and use the chart to map your own breakpoints and tax rates.
Save the SpreadsheetYou may see a warning like this when you save the spreadsheet:
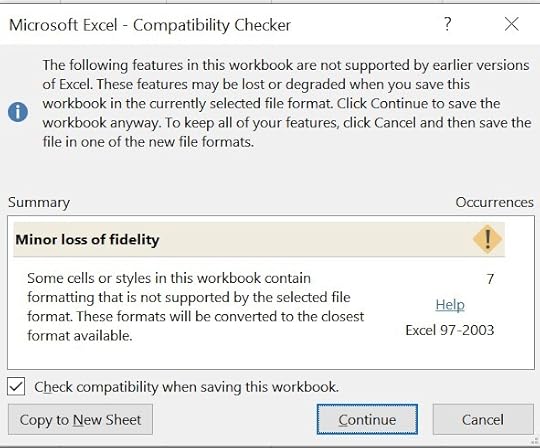
This is normal. Click on Continue and the spreadsheet will be saved.
Scenario – SingleI’ll do another example for someone in the Single filing status.
A retired person, age 66, Florida resident, single with no dependents, enrolled in Medicare Part B and Part D. She lives on $30,000 of Social Security benefits, $20,000 of Traditional IRA withdrawals, $2,000 of interest income, and $5,000 of qualified dividends. She has no other income or deductions.
Entering 1 in cell G2 for the Single filing status and leave adult #2 blank.
Enter the income in the same green-shaded cells starting at cell D23:
After you adjust the chart scale, set the starting point, and extend the range of the X-axis, the chart looks like this:
The first spike in the marginal tax rate (the gray line) is the so-called “tax torpedo.” The next four spikes are due to Medicare IRMAA. Point your mouse at points before each jump in the blue line. You’ll see the total Traditional IRA withdrawals and the cumulative tax rate associated with each jump. Subtract the baseline Traditional IRA withdrawals for living expenses from the total Traditional IRA withdrawals to get the amount for Roth conversion.
Here are the corresponding breakpoints and tax rates:
Break PointRoth Conversion AmountCumulative Tax RateBefore “tax torpedo”$8,50022%Before the first IRMAA tier$48,00025%Before the second IRMAA tier$74,00026%Before the third IRMAA tier$105,00027%Before the fourth IRMAA tier$135,00027%She can decide how much to convert depending on the size of her pre-tax accounts and her view of tax rates in the future. Convert more if she has large pre-tax accounts and she thinks tax rates will be high in the future. Convert less if she doesn’t have large pre-tax accounts and she thinks tax rates will be low in the future.
Again, the shape and the breakpoints for your specific scenario will be different. You can follow this example and use the chart to map your own breakpoints and tax rates.
LimitationsThe Case Study Spreadsheet is an excellent tool to explore how converting different amounts to Roth affects your taxes, but the part of the spreadsheet used in this post shows only the current year. It doesn’t show the effect of doing so over many years.
For example, you see that you will pay X% in taxes if you convert this much now, but you don’t know whether converting more (or less) would be better in the long run when you take into account the size of your pre-tax accounts, your age, your spending needs, investment returns, your Required Minimum Distributions (RMD), etc., etc. You’ll have to decide yourself whether paying X% in taxes on Roth conversion is “worth it.”
Other software tools such as Optimal Retirement Planner (ORP), Retiree Portfolio Model (RPM), and Pralana Gold look across multiple years based on a set of inputs and assumptions to suggest an amount you should convert to Roth each year. The big question is whether those inputs and assumptions will hold true.
Mike Piper, CPA made a good argument against projecting out too many years in his blog post Long-Term Tax Planning Requires Guessing. Focus on the Near-Term. The future can’t be predicted precisely. Your spending needs will change. Investment returns may be strong or weak. Tax laws change. You won’t know what your tax rates will be in the future.
I see a good reason to only look at the current year with the Case Study Spreadsheet. The decision won’t be “optimal” but trying to “optimize” may be only chasing rainbows. I strive to banish the word “optimize” from my financial life and from life in general.
***
The purpose of a Roth conversion is to take advantage of low tax rates. If your retirement is dicey, the best Roth conversion strategy won’t cure it. If your retirement is secure, a reasonable attempt at Roth conversion is only trying to make an already good situation better. So don’t get stressed out when you don’t know how much you should convert. You can use the Case Study Spreadsheet to find a reasonable answer for the current year.
Learn the Nuts and Bolts
I put everything I use to manage my money in a book. My Financial Toolbox guides you to a clear course of action.Read ReviewsThe post Roth Conversion with Social Security and Medicare IRMAA appeared first on The Finance Buff.
November 20, 2022
Two Types of Bond Ladders: When to Replace a Bond Fund or ETF
Both stocks and bonds are down so far this year. As I’m writing this on November 19, the Vanguard Total Stock Market Index Fund is down 17% and the Vanguard Total Bond Market Index Fund is down 14%.
While bonds lost less than stocks, people seem to be more upset about the loss in their bond investments than the loss in their stock investments because they have different expectations for these investments. They know their stock investments are risky and the stock market can go down or crash at times. They expect bonds to be more stable. They also hoped that bonds would go up in value when stocks are down, in an often-cited zig-zag relationship — when stocks zig, bonds zag (“flight to quality”). Investors are disappointed to see bonds going down by almost as much as stocks.
I sympathize with this sentiment. I also wish my bond investments didn’t drop this much but I know the zig-zag relationship is a false expectation. Sometimes they zig-zag and sometimes they don’t. It’s unrealistic to expect bonds to always hold steady or move up when stocks crash.
Because many people invest in bonds through bond funds or ETFs, they wonder whether investing in bonds directly would’ve made a difference because they can avoid the loss by holding the bonds to maturity and getting paid in full when the bonds mature. Specifically, they wonder whether they should replace their bond fund or ETF with a bond ladder going forward.
Table of ContentsWhat Is a Bond LadderReasons for a Bond LadderCollapsing Bond LadderRolling Bond LadderSource of Bond LossReinvest = Hold to MaturityValue of Holding to MaturityPsychological ComfortWhat Is a Bond LadderA bond ladder is a collection of bonds structured to have approximately the same amount mature in approximately equal intervals. The equal amounts and the equal intervals make it look like a ladder.
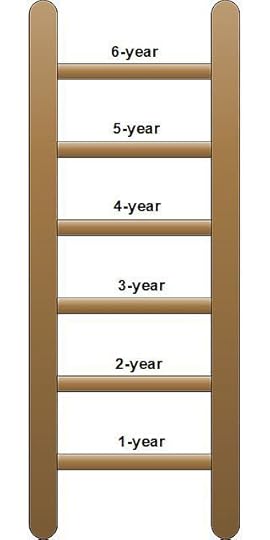
For example, if you have $10,000 of bonds maturing every year in the next 10 years, that’s a 10-year bond ladder. To build this 10-year bond ladder, you buy $10,000 face value of a 1-year bond, $10,000 face value of a 2-year bond, …, and $10,000 face value of a 10-year bond.
It’s easy to build this ladder with Treasuries through a combination of new issues and secondary market purchases. See How To Buy Treasury Bills & Notes Without Fee at Online Brokers and How to Buy Treasury Bills & Notes On the Secondary Market. You can build a ladder with CDs as well.
The amount that matures each year doesn’t have to be exactly the same. You can add a small amount at each interval to account for inflation (or buy TIPS bonds that automatically adjust for inflation).
The first bond doesn’t have to mature in one year. Your first bond can be a 10-year bond followed by an 11-year bond, then a 12-year bond, and so on.
The interval doesn’t have to be one year either. You can have $20,000 maturing every two years or $5,000 maturing every six months.
As long as you have some set amount maturing at some intervals, that’s a bond ladder.
Reasons for a Bond LadderThe primary reason for building a bond ladder is to take advantage of the fact that bonds pay back the full principal when they mature. As long as your bonds don’t default, you’re guaranteed to have your principal back on the maturity date. When each bond is guaranteed not to lose money when it matures, the bond ladder as a whole is also guaranteed not to lose money over its lifetime. It’s perceived to be safer than a bond fund or ETF.
What you do with the cash from a matured bond in a bond ladder distinguishes the type of bond ladder you have.
Collapsing Bond LadderIf you simply spend the money from each matured bond, you have a collapsing bond ladder.
Suppose you started with a 10-year bond ladder with $10,000 maturing each year starting one year from now. After one year, your original one-year bond matures and you get $10,000 paid back as cash. Your original two-year bond has only one year left now and your original 10-year bond has nine years left.
If you spend the $10,000 cash, you’re left with a nine-year bond ladder. If you spend the $10,000 cash again next year, you’re left with an eight-year bond ladder. Your ladder becomes smaller and smaller as time goes by. That’s a collapsing bond ladder. The ladder disappears after the last bond matures.
Rolling Bond LadderIf you reinvest the cash from the matured bond to the far end of the ladder, you have a rolling bond ladder.
Suppose you started with the same 10-year bond ladder with $10,000 maturing each year starting one year from now. After one year, your original one-year bond matures and you get $10,000 paid back as cash. Your original two-year bond has only one year left now and your original 10-year bond has nine years left. So far you have the same $10,000 cash and a nine-year bond ladder as in a collapsing bond ladder.
If you reinvest the $10,000 cash in a new 10-year bond, you will extend your nine-year bond ladder into a 10-year bond ladder. If you reinvest the $10,000 cash again next year, you’re keeping your 10-year bond ladder intact. Your ladder keeps going and going. That’s a rolling bond ladder. The ladder is maintained until you stop reinvesting and convert it into a collapsing bond ladder.
Source of Bond LossWe need to understand the source of losses in bonds to answer the question of whether it’s better to replace a bond fund or ETF with a bond ladder.
Bond funds and ETFs hold bonds. Prices of bond funds and ETFs are determined by the prices of their underlying holdings. Investors lost money in bond funds and ETFs this year because the values of bonds held in those bond funds and ETFs dropped.
Bonds don’t know or care whether you’re holding them in a bond ladder or through a bond fund or ETF. Their values will drop by the same amount when interest rates go up. If you would hold only bonds of a certain type in a ladder (for instance, short-term Treasuries), you can invest in a bond fund or ETF that holds that type of bonds as well.
If you hate seeing a lower value in your account statement, only holding bonds in a bond ladder won’t help. If you can ignore the lower market value reported in your brokerage account for your bonds in a ladder because you’re not selling them, you can ignore the lower reported market value for your bond fund or ETF as well when you’re not selling it either.
I bought some bonds two years ago. The interest rates on those bonds were good at that time, relatively speaking. After interest rates went up this year, the values of those bonds dropped. I still had a loss in those bonds even though I’m holding them to maturity.
Reinvest = Hold to MaturityActually it doesn’t matter whether I hold those bonds to maturity or not. If I sell them now at a loss and I reinvest the proceeds at the current rates, I’ll have exactly the same amount as holding the bonds to maturity. That’s the definition of their market value. Someone else investing a smaller amount today will grow their investment to the same amount as my bonds when they mature. It makes no difference whether I sell at a loss now and reinvest or I keep my bonds and languish while earning lower rates. I get to the same place either way.
My bonds lost value because I bought them too early. The only way to avoid the loss is not to buy those bonds two years ago. If I had kept the money in a savings account and I only buy the bonds now, I would’ve avoided the loss, but that requires knowing that interest rates would go up and bond prices would come down if I only waited. No one could’ve known that. If interest rates continue going up as much as they have this year, bond investors will lose money whether they buy bonds in a bond fund or in a bond ladder.
Bond funds and ETFs continuously reinvest. It doesn’t matter whether the bond fund managers hold their bonds to maturity or not. Growing the lower value in a bond fund or ETF at today’s higher rates will get to the same place as holding last year’s bonds to maturity in a rolling bond ladder. If you’re going to do a rolling bond ladder, in which you will continuously reinvest proceeds from matured bonds, you might as well invest in a bond fund or ETF.
Value of Holding to MaturityHolding to maturity makes a difference when you don’t reinvest. You make up for the loss in a bad year when you reinvest at higher rates, but if you must spend the money, you lock in the loss and lose the opportunity to make up for it. Holding to maturity avoids the loss in this case.
If you’re liquidating a bond fund to cover anticipated expenses, a collapsing bond ladder helps with matching matured bonds to orderly withdrawals. This is helpful especially when the withdrawal period is short and the amount to be withdrawn is relatively predictable.
For example, if you’re paying your child’s college tuition, having a four-year collapsing bond ladder matches the cash flow from the matured bonds to the tuition bills. You pay the bill each year with a bond that matures in that year. The ladder is gone when the final tuition bill is paid.
Someone retiring at age 54 can also use a collapsing bond ladder to cover living expenses until they start withdrawing from their IRA when they’re age 59-1/2.
Someone saving money to buy a car in five years can use a reverse ladder. Instead of paying a lump sum now to have a set amount mature each year, they keep buying a bond that matures when they need the money for a car — a five-year bond now, a four-year bond next year, and so on. They’ll have a lump sum to buy the car when the bonds mature.
These are all good cases for investing in a bond ladder. The value of holding to maturity gets diluted when you have a long withdrawal period and the amount to be withdrawn each year is uncertain. If you just retired and will take withdrawals over the next 30 years, the amount to be withdrawn is small relative to the whole portfolio. Bonds don’t lose 15% every year. Not reinvesting only 3% of your bond holdings in a bad year doesn’t make that much difference.
Psychological ComfortBond funds and ETFs can feel like a black box. You only see fluctuating prices, which stress you out when the prices keep going down.
Bonds in a ladder feel more transparent. They pay interest like clockwork and they pay back the principal as promised. This feels more orderly. It may still be worth doing when you continuously reinvest or when you withdraw only a small amount each year from your bonds even if the end results are not much different than investing in a bond fund or ETF. Feeling more comfortable psychologically helps you stay with your investments.
Just don’t pay fees to someone who sells you on managing a bond ladder for you. Some brokers sell muni bonds or corporate bonds to retirees for large hidden fees. Some financial advisors create bond ladders to justify their asset management fees by “adding value.” These are all dubious practices. If you want a bond ladder for psychological comfort, do it yourself.
***
The value of doing a bond ladder is in matching withdrawals with matured bonds. The shorter the time span in which you will liquidate your bond holdings, the more valuable it is to do a [collapsing] bond ladder. If you’re not withdrawing anything from your bonds and you’re only continuously reinvesting, there isn’t a financial advantage in doing a bond ladder over investing in a bond fund or ETF. When you have a long time span and you’re only withdrawing a small amount each year, a long ladder doesn’t make that much of a difference from a bond fund or ETF.
You may still choose to do a rolling bond ladder or a long ladder for psychological comfort. Just don’t think it’s worth paying someone to do it for you. If doing a rolling bond ladder or a super-long ladder becomes too much work for what it’s worth, just invest in a bond fund or ETF.
Learn the Nuts and Bolts
I put everything I use to manage my money in a book. My Financial Toolbox guides you to a clear course of action.Read ReviewsThe post Two Types of Bond Ladders: When to Replace a Bond Fund or ETF appeared first on The Finance Buff.
Two Types of Bond Ladders: When to Use In Place of a Bond Fund
Both stocks and bonds are down so far this year. As I’m writing this on November 19, the Vanguard Total Stock Market Index Fund is down 17% and the Vanguard Total Bond Market Index Fund is down 14%.
While bonds lost less than stocks, people seem to be more upset about the loss in their bond investments than the loss in their stock investments because they have different expectations for these investments. They know their stock investments are risky and the stock market can go down or crash at times. They expect bonds to be more stable. They also hoped that bonds would go up in value when stocks are down, in an often-cited zig-zag relationship — when stocks zig, bonds zag (“flight to quality”). Investors are disappointed to see bonds going down by almost as much as stocks.
I sympathize with this sentiment. I also wish my bond investments didn’t drop this much but I know the zig-zag relationship is a false expectation. Sometimes they zig-zag and sometimes they don’t. It’s unrealistic to expect bonds to always hold steady or move up when stocks crash.
Because many people invest in bonds through bond funds or ETFs, they wonder whether investing in bonds directly would’ve made a difference because they can avoid the loss by holding the bonds to maturity and getting paid in full when the bonds mature. Specifically, they wonder whether they should replace their bond fund with a bond ladder going forward.
Table of ContentsWhat Is a Bond LadderReasons for a Bond LadderCollapsing Bond LadderRolling Bond LadderSource of Bond LossReinvest = Hold to MaturityValue of Holding to MaturityPsychological ComfortWhat Is a Bond LadderA bond ladder is a collection of bonds structured to have approximately the same amount mature in approximately equal intervals. The equal amounts and the equal intervals make it look like a ladder.
For example, if you have $10,000 of bonds maturing every year in the next 10 years, that’s a 10-year bond ladder. To build this 10-year bond ladder, you buy $10,000 face value of a 1-year bond, $10,000 face value of a 2-year bond, …, and $10,000 face value of a 10-year bond.
It’s easy to build this ladder with Treasuries through a combination of new issues and secondary market purchases. See How To Buy Treasury Bills & Notes Without Fee at Online Brokers and How to Buy Treasury Bills & Notes On the Secondary Market. You can build a ladder with CDs as well.
The amount that matures each year doesn’t have to be exactly the same. You can add a small amount at each interval to account for inflation (or buy TIPS bonds that automatically adjust for inflation).
The first bond doesn’t have to mature in one year. Your first bond can be a 10-year bond followed by an 11-year bond, then a 12-year bond, and so on.
The interval doesn’t have to be one year either. You can have $20,000 maturing every two years or $5,000 maturing every six months.
As long as you have some set amount maturing at some intervals, that’s a bond ladder.
Reasons for a Bond LadderThe primary reason for building a bond ladder is to take advantage of the fact that bonds pay back the full principal when they mature. As long as your bonds don’t default, you’re guaranteed to have your principal back on the maturity date. When each bond is guaranteed not to lose money when it matures, the bond ladder as a whole is also guaranteed not to lose money over its lifetime. It’s perceived to be safer than a bond fund or ETF.
What you do with the cash from a matured bond in a bond ladder distinguishes the type of bond ladder you have.
Collapsing Bond LadderIf you simply spend the money from each matured bond, you have a collapsing bond ladder.
Suppose you started with a 10-year bond ladder with $10,000 maturing each year starting one year from now. After one year, your original 1-year bond matures and you get $10,000 paid back as cash. Your original two-year bond has only one year left now and your original 10-year bond has nine years left.
If you spend the $10,000 cash, you’re left with a nine-year bond ladder. If you spend the $10,000 cash again next year, you’re left with an eight-year bond ladder. Your ladder becomes smaller and smaller as time goes by. That’s a collapsing bond ladder. The ladder disappears after the last bond matures.
Rolling Bond LadderIf you reinvest the cash from the matured bond to the far end of the ladder, you have a rolling bond ladder.
Suppose you started with the same 10-year bond ladder with $10,000 maturing each year starting one year from now. After one year, your original 1-year bond matures and you get $10,000 paid back as cash. Your original two-year bond has only one year left now and your original 10-year bond has nine years left. So far you have the same $10,000 cash and a nine-year bond ladder as in a collapsing bond ladder.
If you reinvest the $10,000 cash in a new 10-year bond, you will extend your nine-year bond ladder into a 10-year bond ladder. If you reinvest the $10,000 cash again next year, you keep your 10-year bond ladder intact. Your ladder keeps going and going. That’s a rolling bond ladder. The ladder is maintained until you stop reinvesting and convert it into a collapsing bond ladder.
Source of Bond LossWe need to understand the source of losses in bonds to answer the question of whether it’s better to replace a bond fund or ETF with a bond ladder.
Bond funds and ETFs hold bonds. Prices of bond funds and ETFs are determined by the prices of their underlying holdings. Investors lost money in bond funds and ETFs this year because the values of bonds held in those bond funds and ETFs dropped.
Bonds don’t know or care whether you’re holding them in a bond ladder or through a bond fund or ETF. Their values will drop by the same amount when interest rates go up. If you hate seeing a lower value in your account statement, only holding bonds in a bond ladder won’t help. If you can ignore the lower market value reported in your brokerage account for your bonds because you’re not selling them, you can ignore the lower reported market value for your bond funds and ETFs as well when you’re not selling them either.
I bought some bonds two years ago. The interest rates on those bonds were good at that time, relatively speaking. After interest rates went up this year, the values of those bonds dropped. I still had a loss in those bonds even though I’m holding them to maturity.
Reinvest = Hold to MaturityActually it doesn’t matter whether I hold those bonds to maturity or not. If I sell them now at a loss and I reinvest the proceeds at the current rates, I’ll have exactly the same amount as holding the bonds to maturity. That’s the definition of their market value. Someone else investing a smaller amount today will grow their investment to the same amount as my bonds when they mature. It makes no difference whether I sell at a loss now and reinvest or I keep my bonds and languish while earning lower rates. I get to the same place either way.
My bonds lost value because I bought them too early. The only way to avoid the loss is not to buy those bonds two years ago. If I had kept the money in a savings account and I only buy the bonds now, I would’ve avoided the loss, but that requires knowing that interest rates would go up and bond prices would come down if I only waited. No one could’ve known that. If interest rates continue going up as much as they have this year, bond investors will lose money whether they buy bonds in a bond fund or in a bond ladder.
Bond funds and ETFs continuously reinvest. It doesn’t matter whether the bond fund managers hold their bonds to maturity or not. Growing the lower value in a bond fund or ETF at today’s higher rates will get to the same place as holding bonds to maturity in a rolling bond ladder. If you’re going to do a rolling bond ladder, in which you will continuously reinvest proceeds from matured bonds, you might as well invest in a bond fund.
Value of Holding to MaturityHolding to maturity makes a difference when you don’t reinvest. You make up for the loss in a bad year when you reinvest at higher rates, but if you must spend the money, you lock in the loss and lose the opportunity to make up for it. Holding to maturity avoids the loss in this case.
If you’re liquidating a bond fund to cover anticipated expenses, a collapsing bond ladder helps with matching matured bonds to orderly withdrawals. This is helpful especially when the withdrawal period is short and the amount to be withdrawn is relatively predictable.
For example, if you’re paying your child’s college tuition, having a four-year collapsing bond ladder matches the cash flow from the matured bonds to the tuition bills. You pay the bill each year with a bond that matures in that year. The ladder is gone when the final tuition bill is paid.
Someone retiring at age 54 can also use a collapsing bond ladder to cover living expenses until they start withdrawing from their IRA when they’re age 59-1/2.
Someone saving money to buy a car in five years can use a reverse ladder. Instead of paying a lump sum now to have a set amount mature each year, they keep buying a bond that matures when they need the money for a car — a five-year bond now, a four-year bond next year, and so on. They’ll have a lump sum to buy the car when the bonds mature.
These are all good cases for investing in a bond ladder. The value of holding to maturity gets diluted when you have a long withdrawal period and the amount to be withdrawn each year is uncertain. If you just retired and will take withdrawals over the next 30 years, the amount to be withdrawn is small relative to the whole portfolio. Bonds don’t lose 15% every year. Not reinvesting only 3% of your bond holdings in a bad year doesn’t make that much difference.
Psychological ComfortBond funds and ETFs can feel like a black box. You only see fluctuating prices, which stress you out when the prices keep going down.
Bonds in a ladder feel more transparent. They pay interest like clockwork and they pay back the principal as promised. This feels more orderly. Even if the end results are not much different than investing in a bond fund or ETF when you continuously reinvest or when you withdraw only a small amount each year from your bonds, it may still be worth doing. Feeling more comfortable psychologically helps you stay with your investments.
Just don’t pay fees to someone who sells you on managing a bond ladder for you. Some brokers sell muni bonds or corporate bonds to retirees for large hidden fees. Some financial advisors create bond ladders to justify their asset management fees by “adding value.” These are all dubious practices. If you want a bond ladder for psychological comfort, do it yourself.
***
The value of doing a bond ladder is in matching withdrawals with matured bonds. The shorter the time span in which you will liquidate your bond holdings, the more valuable it is to do a [collapsing] bond ladder. If you’re not withdrawing anything from your bonds and you’re only continuously reinvesting, there isn’t a financial advantage in doing a bond ladder over investing in a bond fund or ETF. When you have a long time span and you’re only withdrawing a small amount each year, a long ladder doesn’t make that much of a difference from a bond fund or ETF.
You may still choose to do a rolling bond ladder or a super-long ladder for psychological comfort. Just don’t think it’s worth paying someone to do it for you. If doing a rolling bond ladder or a super-long ladder becomes too much work for what it’s worth, just invest in a bond fund or ETF.
Learn the Nuts and Bolts
I put everything I use to manage my money in a book. My Financial Toolbox guides you to a clear course of action.Read ReviewsThe post Two Types of Bond Ladders: When to Use In Place of a Bond Fund appeared first on The Finance Buff.
November 7, 2022
How to Buy Treasury Bills & Notes On the Secondary Market
I showed how to buy new-issue Treasury bills and notes in the previous post How To Buy Treasury Bills & Notes Without Fee at Online Brokers. Buying a new issue is the easiest and the least expensive way for most people. You should try to stay with new issues for the most part.
However, sometimes it’s necessary to buy Treasuries on the secondary market. Major online brokers such as Fidelity, Vanguard, and Charles Schwab don’t charge fees for buying Treasuries on the secondary market either. I show you how to do it in this post.
Table of ContentsWhat Is the Secondary MarketReasons to Buy on the Secondary MarketTerm Not Available As New IssueDon’t Want to WaitTIPSKnown Price and YieldNot All Brokers Offer New IssuesDisadvantages of the Secondary MarketBid/Ask SpreadComplicates TaxesMust Place Order When the Market Is OpenNo Auto RollOnline BrokersFidelityVanguardCharles SchwabWhat Is the Secondary MarketBuying on the secondary market is like buying a used car. Someone bought the Treasuries when they first came out as a new issue. Now they’re reselling them. You’re buying these “pre-owned” Treasuries when you buy on the secondary market.
You’re not getting an inferior product when you buy “pre-owned” Treasuries on the secondary market. The U.S. government still guarantees full payments of both principal and interest. As such, you’re not getting a bargain either when you buy on the secondary market as opposed to buying new issues.
Reasons to Buy on the Secondary MarketTwo scenarios make it necessary to buy on the secondary market.
Term Not Available As New IssueNew issue Treasuries come in these maturities:
1-month (4-week)2-month (8-week)3-month (13-week)4-month (17-week)6-month (26-week)1-year (52-week)2-year3-year5-year7-year10-year20-year30-yearIf you want a Treasury that matures in 9 months, 18 months, or 4 years, you won’t be able to get it as a new issue. Your only option is to buy it on the secondary market. A 1-year Treasury issued 3 months ago has 9 months to run by now. It’ll be your 9-month Treasury if you buy it on the secondary market.
Don’t Want to WaitNew-issue Treasuries come out on a preset schedule. Short-term Treasury Bills come out weekly. Longer maturities (1-year and up) come out only once a month. If you’d like to buy it today and don’t want to wait until the scheduled sale, your only option is to buy on the secondary market.
For example, as I’m writing this, the next scheduled sale for a 1-year (52-week) Treasury will be on November 29 and the one after that will be on December 27. If you miss the November 29 sale and you don’t want to wait until December 27, you’ll have to buy it on the secondary market.
TIPSNew issues of the inflation-protected TIPS only come in these maturities and frequencies currently:
MaturityNew Issue Frequency5-year4 times a year (April, June, October, December)10-year6 times a year (January, March, May, July, September, November)30-yearTwice a year (February, August)If you want a 2-year TIPS or if you want a 5-year TIPS in November, you’ll have to buy it on the secondary market.
Known Price and YieldWhen you buy a new issue, you place your order without knowing exactly what the price and yield will be, because the price and yield are determined by an auction. You’re trusting you’re getting a good price and yield because you’re paying the same price on your small order as banks buying $100 million. Prices can move between the time you place the order and the time the auction completes. The actual yield you get may be higher or lower than the going yield you see when you place the order.
You get a quote when you buy on the secondary market. You know exactly what yield you’re getting. Some people prefer this certainty as opposed to not knowing what price and yield they’ll get when they buy new issues.
This third reason to buy on the secondary market is only personal preference.
Not All Brokers Offer New IssuesAnother reason to buy on the secondary market is that not all brokers offer new-issue Treasuries. Merrill Edge, for example, doesn’t offer new-issue Treasuries online. You have to call and pay a fee to have a representative place the order for a new issue, but you can buy on the secondary market online without a fee. If you must use Merrill Edge, buying on the secondary market probably still beats paying a fee every time to buy a new issue.
You can buy new-issue Treasuries online without a fee at Vanguard, Fidelity, Charles Schwab, and E*Trade. See detailed steps with screenshots in the previous post.
Disadvantages of the Secondary MarketI focused on buying new issues in the previous post because buying on the secondary market has some disadvantages.
Bid/Ask SpreadThe biggest disadvantage is the bid/ask spread. Bond dealers offer to buy and sell Treasuries on the secondary market. The difference between the price you pay when you buy and the price you receive when you sell is the bid/ask spread. The true price is somewhere in between. You’re paying a slightly higher price than the true price when you buy on the secondary market.
For example, here’s a quote for a 1-year Treasury on the secondary market:
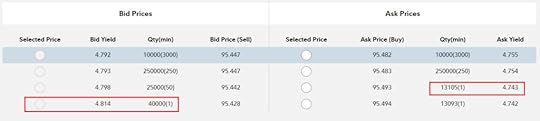
You get a yield of 4.74% when you buy but you must pay a yield of 4.81% when you sell. The true price is somewhere in between. Suppose it’s 4.77%, which means you’re getting a yield that’s about 0.03% less than the fair value when you buy on the secondary market.
Everyone pays the same price and gets the same yield when they buy a new issue. There’s no bid/ask spread. It may be OK if you pay a bid/ask spread to buy a 10-year bond and hold it for 10 years but if you pay a bid/ask spread every month on a 1-month Treasury bill, it adds up fast.
Complicates TaxesWhen you buy Treasuries in a taxable account, buying them on the secondary market adds more complications to your taxes than buying new issues. You’ll need to know what to do with accrued interest and, if applicable, amortizable bond premium (see IRS Schedule B Instructions). They’re not impossible to deal with but it’s still extra work.
Selling Treasuries in a taxable account on the secondary market before they mature adds yet more complications to your taxes. If you must buy Treasuries on the secondary market in a taxable account, at least hold them to maturity and don’t sell them on the secondary market.
Buying or selling on the secondary market in an IRA doesn’t affect your taxes.
Must Place Order When the Market Is OpenWhen you buy a new issue, you need to place your order during an order window but you can do it in the evening or on weekends. You’re good to go as long as your order goes in by the night before the auction date.
When you buy on the secondary market, you must place your order when the bond market is open. That’s typically Monday through Friday, 8:00 a.m. to 5:00 p.m. Eastern Time. This may interfere with your schedule.
No Auto RollSome brokers such as Fidelity and Charles Schwab offer an optional “auto roll” feature when you buy new-issue Treasuries. If you enable the feature when you buy, they will automatically place a new order for the same term and face value when this Treasury matures. It’s especially helpful for short-term Treasuries.
This feature is only available for new issues. You can’t “auto roll” when you buy on the secondary market.
Online BrokersIf you have good reasons to buy Treasuries on the secondary market and you understand and accept the downside, here’s how to do it at some major online brokers.
FidelityHere are the steps to buy Treasuries on the secondary market in a Fidelity account. Fidelity doesn’t charge fees for buying Treasuries on the secondary market.
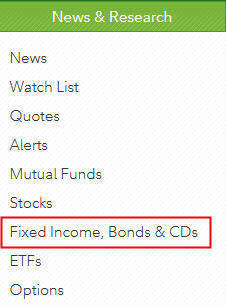
Under News & Research on the top, click on Fixed Income, Bonds & CDs.
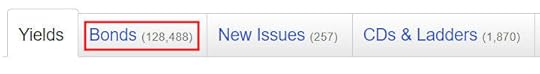
Click on the Bonds tab.
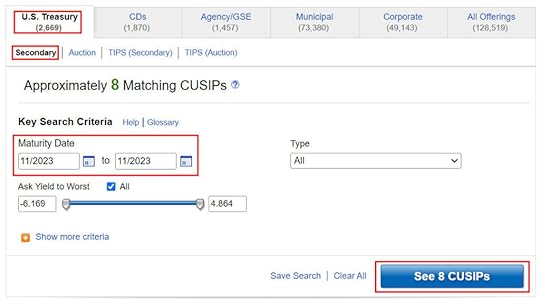
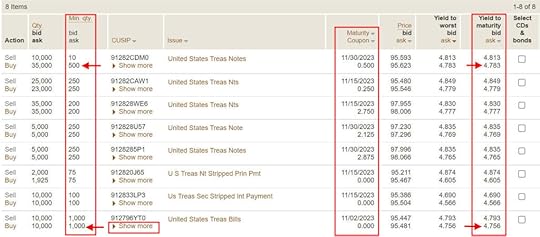
U.S. Treasury and Secondary are selected by default. Suppose you want a Treasury that matures in November 2023. Enter the from-and-to months in the maturity range fields. The button tells you how many Treasuries fit your search. A CUSIP for bonds is like the ticker symbol for stocks.
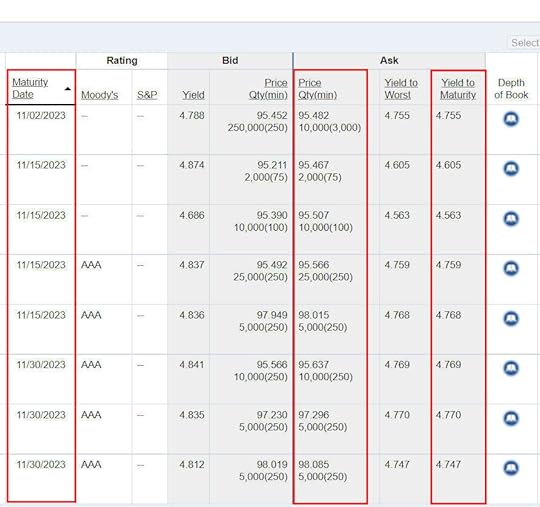
You see a list of Treasuries available. Look at the Ask columns when you’re buying. The Yield to Maturity and Yield to Worst numbers are always the same for Treasuries.
You won’t necessarily get the quoted Yield to Maturity in this table because those yields are for the minimum quantity in the Price | Qty(min) column. For example, you’ll have to buy $3 million of face value in the Treasury Bill maturing on 11/02/2023 to get the 4.755% yield to maturity (3,000 in the parenthesis means $3 million because 1 bond is $1,000 of face value).
The $3 million minimum is only the minimum for the quoted price and yield. You can still buy a smaller quantity. You’ll just have to pay slightly more and get a slightly lower yield than a $3 million order.
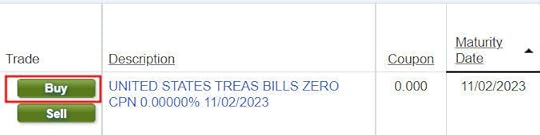
After scanning the results table, suppose you’re interested in the Treasury bill that matures on 11/02/2023. Click on the Buy button next to this Treasury.
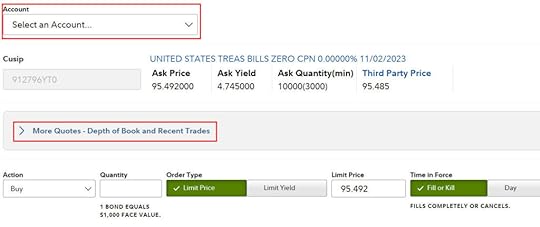
Click on the Account dropdown to select the account in which you will buy this Treasury. Click on More Quotes – Depth of Book and Recent Trades to see the price and yield for the quantity you’ll buy.
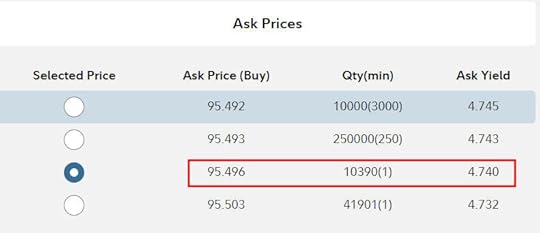
Look at the Ask Prices when you’re buying. Find the quote for the minimum quantity you’re buying. If you’re buying $10,000 face value, you won’t get the price and yield for the $3 million minimum or the $250,000 minimum. You’ll pay a slightly higher price and get the yield for a $1,000 minimum order size, which is 4.740% in the screenshot.
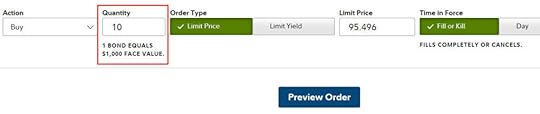
If you’re satisfied with the quoted yield, enter the quantity you’d like to buy. 1 bond is $1,000 face value. To buy $10,000 face value, enter a quantity of 10. The minimum order size is 1 for $1,000 face value.
This final screen shows how much you’ll pay for this order. The money will come out of your cash balance and money market funds. Principal and interest payments will automatically go into your cash balance. You can’t “auto-roll” when you buy on the secondary market.
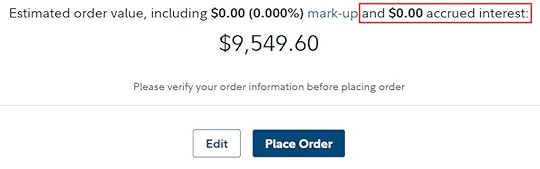
This specific Treasury doesn’t have any accrued interest but some others do. You pay the accrued interest to the current owner and you get it back in the next interest payment. If you’re buying in a taxable account, you’ll have to remember to subtract the accrued interest when you do your taxes. Otherwise you’ll pay more taxes than you really owe.
VanguardFollow these steps to buy Treasuries on the secondary market in a Vanguard brokerage account. Vanguard doesn’t charge fees for buying Treasuries on the secondary market.
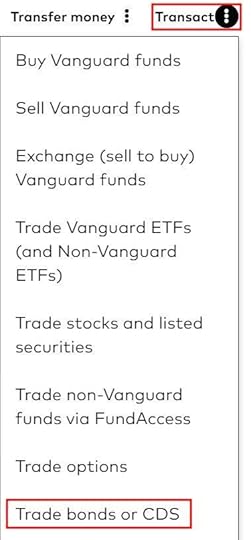
Click on the three dots next to Transact near the top right of your account and scroll toward the bottom. Click on Trade bonds or CDs.
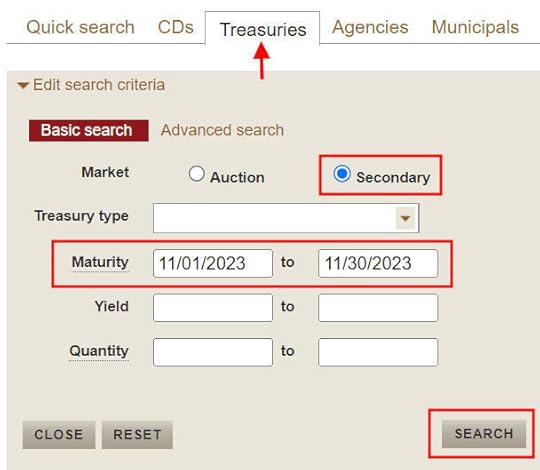
Click on the Treasuries tab. The Secondary radio button is selected by default. Enter the range of maturity dates you’re interested in and click on Search.
You get a list of available Treasuries. You can click on the heading to sort by maturity or yield. Look at the second line in each row when you’re buying.
You won’t necessarily get the quoted Yield to Maturity in this table because those yields are for the minimum quantity in the Min. qty column. For example, you’ll have to buy $1 million of face value in the Treasury Bill maturing on 11/02/2023 to get the 4.756% yield to maturity (1,000 means $1 million face value because 1 bond is $1,000 face value).
The $1 million minimum is only the minimum for the quoted price and yield. You can still buy a smaller quantity. You’ll just have to pay slightly more and get a slightly lower yield than a $1 million order.
Suppose you’re interested in the Treasury maturing on 11/02/2023. Click on Show more in that row.
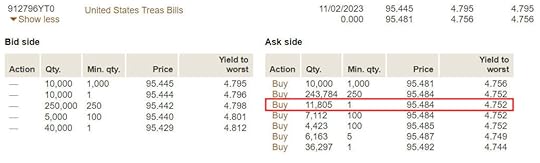
Now you will see the price and yield for smaller orders. Look at the Ask side when you’re buying. Find the quote for the minimum quantity applicable to you. If you’re buying $10,000 face value, you won’t get the price and yield for the $1 million minimum or the $250,000 minimum. You’ll pay a slightly higher price and get the yield for a $1,000 minimum order size, which is 4.752% in the screenshot. Click on the Buy link next to the applicable minimum order size.
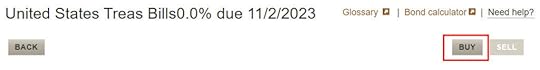
You’ll see a page full of information about this Treasury. Click on the Buy button if you’re still interested in buying it.
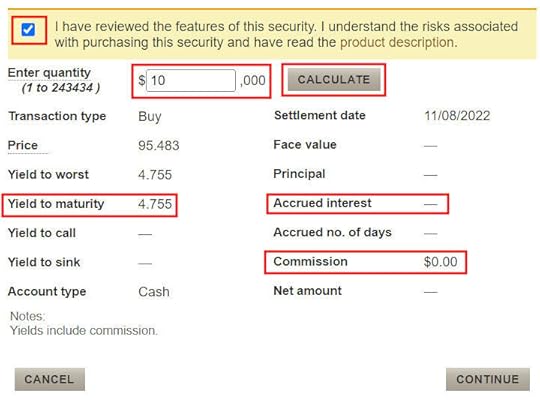
You have to check the box to say you know what you’re doing. Enter a quantity of 10 to buy $10,000 face value. Click on Calculate to see the yield again.

You see a big warning on the top saying you’re paying a higher price for your small order. Nothing you can do here unless you can afford to buy $250,000 or $1 million.
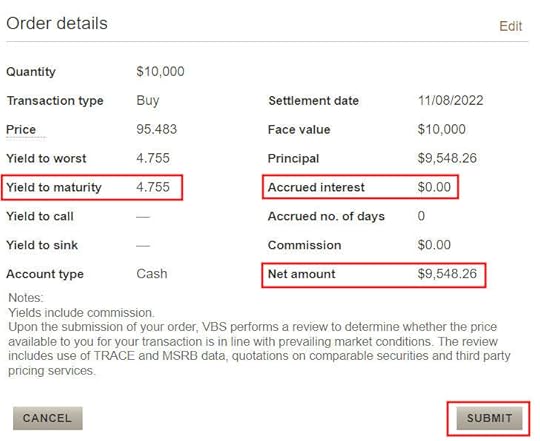
Now comes the final screen before you submit the order or cancel. You see the yield, the accrued interest if applicable, and the net amount that’ll come out of your settlement fund. Principal and interest payments will automatically go into your settlement fund. You’ll have to reinvest those payments on your own.
This specific Treasury doesn’t have any accrued interest but some others do. You pay the accrued interest to the current owner and you get it back in the next interest payment. If you’re buying in a taxable account, you’ll have to remember to subtract the accrued interest when you do your taxes. Otherwise you’ll pay more taxes than you really owe.
Charles SchwabYou can buy Treasuries on the secondary market in a Charles Schwab account as well. Schwab also doesn’t charge fees on buying Treasuries on the secondary market.
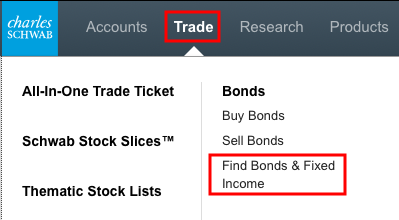
Click on Trade in the top menu and then Find Bonds & Fixed Income.
I don’t have more screenshots for Charles Schwab at this moment but the process should be similar to Fidelity and Vanguard. I’ll add screenshots here when I have them.
***
Buying Treasuries on the secondary market fills gaps when the term you want isn’t available as a new issue or when the next new-issue auction is too far ahead. It’s a viable option if you understand and accept the downside of buying on the secondary market. Buying them in an IRA removes the tax complications.
The need to buy on the secondary market is especially applicable to TIPS because new-issue TIPS don’t come in as many maturities as nominal Treasuries and they come out much less frequently.
Bond prices change by the minute. New issues won’t always have a higher yield. If a new issue is coming out shortly, you may decide to wait, but you can buy on the secondary market now and lock in the current yield if the auction for the next new issue is quite far ahead.
Learn the Nuts and Bolts
I put everything I use to manage my money in a book. My Financial Toolbox guides you to a clear course of action.Read ReviewsThe post How to Buy Treasury Bills & Notes On the Secondary Market appeared first on The Finance Buff.
November 3, 2022
When to Stop Buying I Bonds or Cash Out and Buy TIPS
[Rewritten on November 3, 2022. Older comments were from 2018 when this same issue came up.]
The Treasury Department announced rates for new I Bonds sold between November 1, 2022 and April 30, 2023. These new I Bonds will have a fixed rate of 0.4% for life, plus a variable rate that adjusts with inflation every six months. The variable rate in the first six months will be 6.48%. When the fixed rate and the variable rate are combined, the composite rate for these new I Bonds is 6.89% in the first six months.
I Bonds for the Short TermAll existing I Bonds bought between May 2020 and October 2022 will continue to have a 0% fixed rate for life. They will earn a 6.48% variable rate for six months after they finish earning 9.62% for six months. The 6.48% rate is still higher than anything you can find in a safe investment.
If you maxed out on I Bonds in 2022, you’ll have an opportunity to buy I Bonds again in January 2023. All the reasons to buy I Bonds in 2022 are still valid in 2023. I Bonds remain a flexible principal-guaranteed investment. They’re great for short-term money that you might spend or reinvest into something else at any time after holding for one year.
TIPS for the Long TermHowever, as long-term holdings, I Bonds now face strong competition from TIPS, which are another type of inflation-protected government bond (see Better Inflation Protection with TIPS After Maxing Out I Bonds for more background on TIPS). The Treasury Department raised the fixed rate on I Bonds because the yield on TIPS is much higher now.
As I’m writing this in November 2022, the yield on TIPS is about 1.6% for all maturities whereas the fixed rate on I Bonds is only 0.4%. In other words, TIPS pay 1.6% above inflation while I Bonds pay 0.4% above inflation. TIPS win over a longer holding period.
I Bonds AdvantagesThere are still valid reasons for continuing to buy I Bonds in 2023 and keeping the existing I Bonds despite their low fixed rates:
1. There is a limit on how much new I Bonds you can buy each year. If you don’t buy them, you won’t accumulate as much in these flexible inflation-protected investments.
2. I Bonds are guaranteed never to lose value.
3. The existing I Bonds already accrued some interest. Cashing them out will trigger paying federal income tax on the accrued interest. I Bonds are exempt from state and local taxes.
4. Cashing out I Bonds before five years will forfeit interest earned in the last three months.
5. I Bonds are tax-deferred. If your tax rate is high now and it will be lower when you retire, holding on to them until you retire will arbitrage the difference in tax rates.
These factors in favor of buying more I Bonds in 2023 and holding on to the existing 0%-fixed-rate I Bonds are all true. Still, there has to be a point when it’s better to switch to TIPS. If 1.6% real yield versus 0.4% fixed rate doesn’t do it, what if the gap grows bigger?
Quantify the DifferenceWe need to quantify the advantages of buying more and holding on to the low-rate I Bonds. Then we will see whether the advantages overcome the yield difference. I created a spreadsheet for comparing two scenarios:
A) Hold on to an existing I Bond. Defer tax to the future when the tax rate is potentially lower.
B) Pay any tax and penalty now. Invest the proceeds in TIPS in a taxable account. Pay tax on interest every year.
The spreadsheet is interactive. Assumptions are in blue. Please feel free to change those to numbers applicable to you. The other cells are calculated. Please don’t overwrite those.
You get the current value and the composite interest rate of your I Bond from the Savings Bond Calculator. If the bond hasn’t been held for five years, the value displayed by the Savings Bond Calculator already reflects the 3-month interest penalty.
In the scenario shown, I have an I Bond bought in May 2021 with a 0% fixed rate. It’s still subject to the early withdrawal penalty. In Scenario A, I would hold it for another 10 years. The average inflation in the next 10 years is assumed to be 3%. Finally, suppose I pay a higher tax rate in the next 10 years than the tax rate afterward.
Under these assumptions, I’m still better off switching to TIPS and just paying taxes every year at a higher tax rate. If my tax rates are more or less equal between now and the future, it will be even better to switch to TIPS because there isn’t much tax rate arbitrage. If I have room for TIPS in an IRA, it will be better still.
The result may be different under a different set of assumptions. So play with the spreadsheet with your own assumptions and different scenarios and see how it goes for you.
When to Cash Out 0% I BondsThe early withdrawal penalty on I Bonds is the interest earned in the last three months. If you decide to cash out and switch to TIPS, you may want to wait until your I Bonds finish earning the 9.62% rate plus another three months for the early withdrawal penalty. If you find the 6.48% rate attractive, you may want to wait until you fully pocket the 6.48% rate as well.
When your I Bonds fully capture the 9.62% rate or the 6.48% rate depends on when the I Bonds were issued. I made this table as a handy reference:
Issue Month3 months after 9.62%3 months after 6.48%January or July4/1/202310/1/2023February or August5/1/202311/1/2023March or September6/1/202312/1/2023April or October7/1/20231/1/2024May or November2/1/20238/1/2023June or December3/1/20239/1/2023Because I already have enough for short-term flexible spending (“emergency fund” type of usage), here’s my plan for 2023:
1. Check the Daily Treasury Par Real Yield Curve Rates (use the second heading on the webpage). If TIPS yields are still high in January 2023, skip buying I Bonds and buy TIPS for the long term.
2. Check again on the dates in the table above. If TIPS yields are still high at that time and the I Bonds with a 0% fixed rate have been held for at least one year, cash them out to buy TIPS.
Learn the Nuts and Bolts
I put everything I use to manage my money in a book. My Financial Toolbox guides you to a clear course of action.Read ReviewsThe post When to Stop Buying I Bonds or Cash Out and Buy TIPS appeared first on The Finance Buff.
October 18, 2022
2022 2023 Tax Brackets, Standard Deduction, Capital Gains, etc.
My other post listed 2022 2023 401k and IRA contribution and income limits. I also calculated the inflation-adjusted tax brackets and some of the most commonly used numbers in tax planning for 2023 using the published inflation numbers and the same formula prescribed in the tax law. The official numbers announced by the IRS confirmed my calculations.
Table of Contents2022 2023 Standard Deduction2022 2023 Tax Brackets2022 2023 Capital Gains Tax2022 2023 Estate and Trust Tax Brackets2022 2023 Gift Tax Exclusion2022 2023 Savings Bonds Tax-Free Redemption for College Expenses2022 2023 Standard DeductionYou don’t pay federal income tax on every dollar of your income. You deduct an amount from your income before you calculate taxes. About 90% of all taxpayers take the standard deduction. The other ~10% itemize deductions when their total deductions exceed the standard deduction. In other words, you’re deducting a larger amount than your allowed deductions when you take the standard deduction. Don’t feel bad about taking the standard deduction!
The basic standard deduction in 2022 and 2023 are:
20222023Single or Married Filing Separately$12,950$13,850Head of Household$19,400$20,800Married Filing Jointly$25,900$27,700Basic Standard DeductionSource: IRS Rev. Proc. 2021-45, Rev. Proc. 2022-38.
People who are age 65 and over have a higher standard deduction than the basic standard deduction.
20222023Single, age 65 and over$14,700$15,700Head of Household, age 65 and over$21,150$22,650Married Filing Jointly, one person age 65 and over$27,300$29,200Married Filing Jointly, both age 65 and over$28,700$30,700Standard Deduction for age 65 and overSource: IRS Rev. Proc. 2021-45, Rev. Proc. 2022-38.
People who are blind have an additional standard deduction.
20222023Single or Head of Household, blind+$1,750+$1,850Married Filing Jointly, one person is blind+$1,400+$1,500Married Filing Jointly, both are blind+$2,800+$3,000Additional Standard Deduction for BlindnessSource: IRS Rev. Proc. 2021-45, Rev. Proc. 2022-38.
2022 2023 Tax BracketsThe tax brackets are based on taxable income, which is AGI minus various deductions. The tax brackets in 2022 are:
SingleHead of HouseholdMarried Filing Jointly10%$0 – $10,275$0 – $14,650$0 – $20,55012%$10,275- $41,775$14,650 – $55,900$20,550 – $83,55022%$41,775 – $89,075$55,900 – $89,050$83,550 – $178,15024%$89,075 – $170,050$89,050 – $170,050$178,150 – $340,10032%$170,050 – $215,950$170,050 – $215,950$340,100 – $431,90035%$215,950 – $539,900$215,950 – $539,900$431,900 – $647,85037%Over $539,900Over $539,900Over $647,8502022 Tax BracketsSource: IRS Rev. Proc. 2021-45.
The 2023 tax brackets are:
SingleHead of HouseholdMarried Filing Jointly10%$0 – $11,000$0 – $15,700$0 – $22,00012%$11,000 – $44,725$15,700 – $59,850$22,000 – $89,45022%$44,725 – $95,375$59,850 – $95,350$89,450 – $190,75024%$95,375 – $182,100$95,350 – $182,100$190,750 – $364,20032%$182,100 – $231,250$182,100 – $231,250$364,200 – $462,50035%$231,250 – $578,125$231,250 – $578,100$462,500 – $693,75037%Over $578,125Over $578,100Over $693,7502023 Tax BracketsSource: IRS Rev. Proc. 2022-38.
A common misconception is that when you get into a higher tax bracket, all your income is taxed at the higher rate, and you’re better off not having the extra income. That’s not true. Tax brackets work incrementally. If you’re $1,000 into the next tax bracket, only $1,000 is taxed at the higher rate. It doesn’t affect the income in the previous brackets.
For example, someone single with a $60,000 AGI in 2022 will pay:
First 12,950 (the standard deduction)0%Next $10,27510%Next $31,500 ($41,775 – $10,275)12%Final $5,27522%Progressive Tax RatesThis person is in the 22% tax bracket but only less than 10% of the $60,000 AGI is really taxed at 22%. The bulk of the income is taxed at 0%, 10%, and 12%. The blended tax rate is only 9.9%. If this person doesn’t earn the final $5,275, he or she is in the 12% bracket instead of the 22% bracket, but the blended tax rate only goes down slightly from 9.9% to 8.8%. Making the extra income doesn’t cost this person more in taxes than the extra income.
Don’t be afraid of going into the next tax bracket.
2022 2023 Capital Gains TaxWhen your other taxable income (after deductions) plus your qualified dividends and long-term capital gains are below a cutoff, you will pay 0% federal income tax on your qualified dividends and long-term capital gains under this cutoff.
This is illustrated by the chart below. Taxable income is the part above the black line, after subtracting deductions. A portion of the qualified dividends and long-term capital gains is taxed at 0% when the other taxable income plus these qualified dividends and long-term capital gains are under the red line.
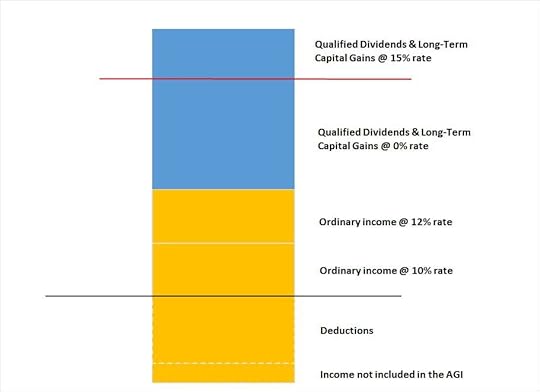
The red line is close to the top of the 12% tax bracket but they don’t line up exactly.
20222023Single or Married Filing Separately$41,675$44,625Head of Household$55,800$59,750Married Filing Jointly$83,350$89,250Maximum Zero Rate Amount for Qualified Dividends and Long-term Capital GainsSource: IRS Rev. Proc. 2021-45, Rev. Proc. 2022-38.
For example, suppose a married couple filing jointly has $70,000 in other taxable income (after deductions) and $20,000 in qualified dividends and long-term capital gains in 2022. The maximum zero rate amount cutoff is $83,350. $13,350 of the qualified dividends and long-term capital gains ($83,350 – $70,000) is taxed at 0%. The remaining $20,000 – $13,350 = $6,650 is taxed at 15%.
A similar threshold exists on the upper end for qualified dividends and long-term capital gains. When your other taxable income (after deductions) plus your qualified dividends and long-term capital gains are above a cutoff, you will pay 20% federal income tax instead of 15% on your qualified dividends and long-term capital gains above this cutoff.
20222023Single$459,750$492,300Head of Household$488,500$523,050Married Filing Jointly$517,200$553,850Married Filing Separately$258,600$276,900Maximum 15% Rate Amount for Qualified Dividends and Long-term Capital GainsSource: IRS Rev. Proc. 2021-45, Rev. Proc. 2022-38.
2022 2023 Estate and Trust Tax BracketsEstates and trusts have different tax brackets than individuals. These apply to non-grantor trusts and estates that retain income as opposed to distributing the income to beneficiaries. Grantor trusts (including the most common revocable living trusts) don’t pay taxes separately. The income of a grantor trust is taxed to the grantor at the grantor’s tax brackets.
Here are the tax brackets for estates and trusts in 2022 and 2023:
2022202310%$0 – $2,750$0 – $2,90024%$2,750 – $9,850$2,900 – $10,55035%$9,850 – $13,450$10,550 – $14,45037%over $13,450over $14,450Estate and Trust Tax BracketsSource: IRS Rev. Proc. 2021-45, Rev. Proc. 2022-38.
2022 2023 Gift Tax ExclusionEach person can give another person up to a set amount in a calendar year without having to file a gift tax form. Not that filing a gift tax form is onerous, but many people avoid it if they can. In 2023, this gift tax exclusion amount will likely increase from $16,000 to $17,000.
20222023Gift Tax Exclusion$16,000$17,000Gift Tax ExclusionSource: IRS Rev. Proc. 2021-45, Rev. Proc. 2022-38.
The gift tax exclusion is counted by each giver to each recipient. As a giver, you can give up to $16,000 each in 2022 to an unlimited number of people without having to file a gift tax form. If you give $16,000 to each of your 10 grandkids in 2022 for a total of $160,000, you still won’t be required to file a gift tax form. Any recipient can also receive a gift from an unlimited number of people. If a grandchild receives $16,000 from each of his or her four grandparents in 2022, no taxes or tax forms will be required.
2022 2023 Savings Bonds Tax-Free Redemption for College ExpensesIf you cash out U.S. Savings Bonds (Series I or Series EE) for college expenses or transfer to a 529 plan, your modified adjusted gross income must be under certain limits to get a tax exemption on the interest. See Cash Out I Bonds Tax Free For College Expenses Or 529 Plan. Here are the income limits in 2022 and 2023:
20222023Single, Head of Household$85,800 – $100,800$91,850 – $106,850Married Filing Jointly$128,650 – $158,650$137,800 – $167,800Income Limit for Tax-Free Savings Bond Redemption for Higher EducationSource: IRS Rev. Proc. 2021-45, Rev. Proc. 2022-38.
Learn the Nuts and Bolts
I put everything I use to manage my money in a book. My Financial Toolbox guides you to a clear course of action.Read ReviewsThe post 2022 2023 Tax Brackets, Standard Deduction, Capital Gains, etc. appeared first on The Finance Buff.
Harry Sit's Blog

- Harry Sit's profile
- 1 follower

