
Aswath Damodaran's Blog, page 16
August 28, 2019
From Shareholder wealth to Stakeholder interests: CEO Capitulation or Empty Doublespeak?
Last week. the Business Roundtable, composed of the CEOs of some of America’s largest companies, put out a press release that hinted at a fundamental, perhaps revolutionary, shift in corporate focus. In the statement, the CEOs seemed to be saying that corporations should be run to protect all corporate stakeholders, defined to include customers, society and employees, rather than hew to its conventional objective of maximizing shareholder wealth. The reason that I say “seemed to” is because the document was written in CEO-speak, full of platitudes and open to interpretation. I will confess that I have a personal interest in this debate since I teach and write about corporate finance, a discipline built around shareholder wealth maximization, and valuation, which is about measuring it.
The Business Roundtable Speaks: A flawed message from a flawed messenger The Business Roundtable, tracing it history back to 1972, and restricting its membership to CEOs of major corporations, lobbies for business-friendly legislation and has a history of making statements about corporate purpose that are usually completely predictable and not very newsworthy. This year’s statement, at least on the surface, breaks with this past with its talk of stakeholder interests and rather than give you my interpretation of the statement, I will quote directly from it:
While each of our individual companies serves its own corporate purpose, we share a fundamental commitment to all of our stakeholders. We commit to: Delivering value to our customers. We will further the tradition of American companies leading the way in meeting or exceeding customer expectations. Investing in our employees. This starts with compensating them fairly and providing important benefits. It also includes supporting them through training and education that help develop new skills for a rapidly changing world. We foster diversity and inclusion, dignity and respect. Dealing fairly and ethically with our suppliers. We are dedicated to serving as good partners to the other companies, large and small, that help us meet our missions. Supporting the communities in which we work. We respect the people in our communities and protect the environment by embracing sustainable practices across our businesses. Generating long-term value for shareholders, who provide the capital that allows companies to invest, grow and innovate. We are committed to transparency and effective engagement with shareholders. The use of the word “stakeholders: and an explicit listing of how corporations should act in each of their interests has drawn extensive attention from a diverse group of individuals, each drawing its own conclusions and making its own criticisms. Critics of shareholder wealth maximization viewed this statement as vindication, an acceptance of their long-term tenet that focusing on shareholder wealth has given rise to income inequality, loss of good manufacturing jobs and societal costs. Supporters of shareholder wealth maximization considered the statement to be not only ill-advised but also a craven concession to populist forces. Cynics argued that it was more political document than restatement of purpose, smoke and noise that signified nothing. Journalists have concluded that this statement is, in fact, a fundamental restatement of corporate purpose, driven by political pressures.
While the statement was signed by 181 CEOs, including Bezos (Amazon), Tim Cook (Apple), Brian Moynihan (B of A) and Mary Barra (GM), I found it odd that Jamie Dimon, the CEO of JP Morgan Chase, was the person who was chosen to deliver the message. To give Mr. Dimon his due, he is a very good banker and has excellent political skills, a plus at the top of a money center bank, but he is definitely not someone that I would view as putting shareholder interests first. Over the last decade, Jamie Dimon has repeatedly clashed with his own stockholders, first over his decision to chair the board of directors that is supposed to oversee him and multiple times about his compensation. He has technically won these fights at annual meetings, but with some of the highest opposition among large, widely held public companies, and he has been well protected by his ineffectual and mostly rubber stamp board of directors. Jamie Dimon talking about shareholder wealth is about as believable as Madonna singing “like a virgin” or Kim Kardashian speaking about the importance of privacy.
The Stakeholders in a Corporation To most laymen, the debate about whether to focus on shareholders or stakeholders may seem like an obscure one that has few consequences for their lives, but it is of huge import and the best way to get perspective is to see who these stakeholders in the modern corporation are and what their relationship is with public companies:
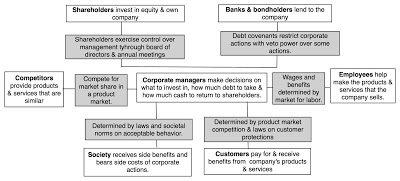
Stakeholders therefore have different legal relationships with the company and divergent interests, implying that actions that make one stakeholder group better off may make other stakeholder groups worse. It is this conflict that makes the discussion of which group has primacy in decision making so heated and political.
Versions of CorporatismIn the section below, I will present five different perspectives on how corporations are run, and I will let you draw your own conclusions on which one best describes current corporate behavior and argue that your that choice will determine, in large part, what you think should be the norm.
1. Cutthroat Corporatism
The most extreme view of corporations is what describe as cutthroat capitalism, where the strong companies drive out the weak and the end game is stockholder wealth maximization (often with a founder/family being the prime beneficiary) at almost any cost: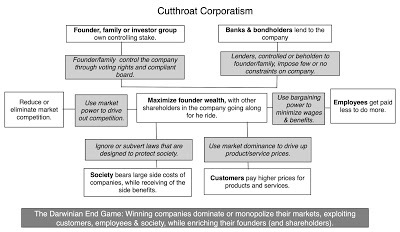
In the late nineteenth century, the robber barons of the age (Andrew Carnegie, John D. Rockefeller and others) hewed to this template to build some of the greatest companies of the time, some of which survive to this day. They were ruthless in their march towards domination, crushing competitors through fair means or foul, bending society to their will and exploiting customers and employees. Their overreach led to Teddy Roosevelt’s election and the subsequent passage of antitrust laws, but much as we tend to view these corporate chieftains as villains, they played a major role in making the US a global economic power. In the century since, there are other companies that have aspired for dominance, using what many critics have viewed as ruthless and perhaps even illegal ways to exercise market dominance. Lest you view this model of corporate behavior as a historical artifact, many of today's companies have, at least in some aspects of their behavior, have been accused of following this model.
2. Crony Corporatism A variant of this win-at-all-costs corporatism is crony corporatism, where the end game is still market dominance but the base is built less on economies of scale, efficient operations and product differentiation, and more on connections to government and rule writers, with the objective being tilting the scales of competition in the company’s favor: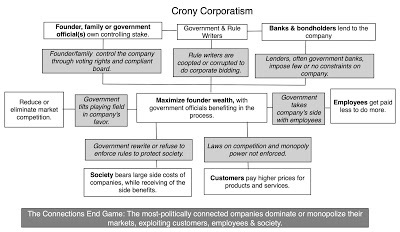 While the end result of cutthroat and crony capitalism is the same, i.e., large market-dominating companies that give short shrift to employees and customers, it can be argued that since the winners are the most connected, not the most efficient, crony capitalism offers all of the costs of cutthroat capitalism, with none of the benefits. While family group companies in some emerging markets obviously fit this mould, I think that an argument can be made that there is an element of cronyism in many developed markets.
3. Managerial CorporatismThere is a third version of corporatism that comes to the forefront, especially as public companies age, founders/families are replaced with professional managers and shareholdings get dispersed among lots of shareholders with small (percent) stakes. In this version, it is the professional managers whose interests drive decision making in the company, with other stakeholders viewed as side players.
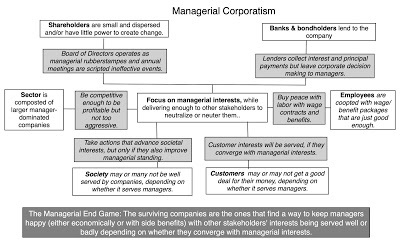
Note that the managers who make corporate decisions often own little equity in the company, or if they do, get it as part of compensation packages, often determined by boards of directors that operate less as checks and more as rubber stamps. The question of how well other stakeholders do in this version depends in large part on whether their interests converge on those of managers; if there is convergence, their interests will be advanced, but only because it happens to advance managerial interests as well, and if not, they will find themselves paying the price to make managers better off. This was the default for US companies in the decades after the second world war, with long tenures for CEOs and little or no shareholder activism, and overall economic prosperity allowing for a coopting of other stakeholder: solid wage gains for employees, corporate charity and restrained competition.
4. Constrained Corporatism I suspect that there are very few people, even among true believers in free markets and capitalism, who will defend cutthroat or crony capitalism. There are some who are nostalgic for managerial corporatism, pointing to the solid stock returns, well-paying jobs and societal side benefits that came with it, not seeing that these stakeholder benefits were made possible by US economic dominance during the period, and the ease with US companies could make money. It is no coincidence that shareholder activism rose to the surface in the 1980s, as US economic power slipped and managerial interests were served at the expense of not just shareholders, but other stakeholders. While this activism resulted in leveraged buyouts in some companies, it also gave rise to a version of shareholder wealth maximization that I center my corporate finance decision making, that I call constrained corporatism, where companies preserve the primacy of shareholders, while constraining how they interact with other stakeholder groups: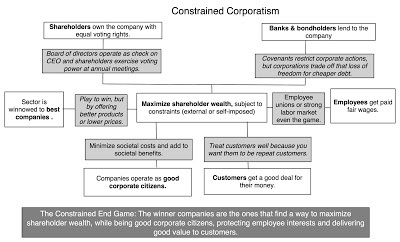 The efficacy of this version of corporatism depends largely on how well the constraints protect other stakeholders and what drives companies to adopt the constraints in the first place, with three possible drivers for the latter:Government-imposed constraints: Governments can write laws or draw up rules that constrain how corporations treat stakeholders, with labor laws determining not only how much workers get paid but also conditions under which they can be hired or fired, product laws capping prices on some products and protecting customer interests in others and anti-trust laws determining whether product markets stay competitive. European governments have been far more aggressive with this approach than the US, but the globalization of businesses has not only weakened the protections offered by these laws, but also put companies covered by them at a competitive disadvantage, relative to companies that operate in countries without these laws and restrictions.Self-imposed constraints: In this variant, companies voluntarily adopt constraints on their interactions with other stakeholder groups, often choosing to pay higher wages (than they could get away paying) to their employees, charging customers less for products/services than they could have, given their pricing power, and turning away investments that they could pursue legally, for profits, because of the costs that it will create for society. In effect, the essence of these constraints is that the profit settles for less profit than it could have made if it have as an unconstrained player. The problem with self-imposed constraints is that your capacity to adopt them will be correlated with how profitable you are to begin with, with companies with more slack built into their business models being in a better position than companies facing profit pressures in an intensely competitive market. Market-driven constraints: In this final variation, companies adopt constraints on how they treat stakeholders because it makes them more valuable companies, even as they settle for less profits, at least in the near term. That seeming contradiction can be explained by two factors. The first is that whatever costs the company faces in the short term from imposing the constraints may be overwhelmed by benefits in the long term; paying employees more may yield more loyal and better employees, offering customers better deals may lead to more repeat business and being a good corporate citizen may operate as advertising, attracting more customers to the company. To top it all off, investors who care about any or all of these behaviors may be more inclined to invest in your shares, pushing up stock prices. The second is that companies that exploit customers and employees or acquire a reputation for being bad corporate citizens will have few defenders when it does make a mistake or have a problem, inevitable in the long term, leading to potentially catastrophic costs.As an advocate for shareholder wealth maximization, I would love to live in a world where the market rewarded companies that try to do the right thing, since it would make good behavior entirely consistent with value maximization. That said, I am a realist and accept that some constraints have to be imposed by governments, regulators and rule writers, and that some companies, especially ones with strong profitability and substantial slack in their business models, may accept self constraints.
5. Confused Corporatism
In some sectors and in some markets and during some time periods, markets will not do the job, leaving us as the mercy of bad behavior by some or many corporate players. It is therefore not surprising that stakeholder wealth maximization is seen as an alternative corporate model: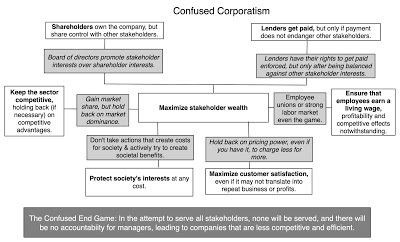
It is quite clear that the corporate mission in this version of corporatism has been enlarged to cover all stakeholders, often with very different interests at heart. On the surface, it may look like constrained capitalism, but unlike it, in this version, you have multiple objectives, with no clear sense of which one dominates. Your job as a top manager or CEO is to pay not just a fair, but a living wage, even if you cannot afford it as a company, but also deliver maximum value to your customer, preserve society’s best interests and ensure that your business stays competitive, while also making sure that you deliver the returns your stockholders and lenders desire. In my view, it is destined to fail for three reasons:Conflicting interests: By treating the interests of all stakeholders as equivalent, it ignores the reality that decisions in companies, almost by definition, will make stakeholders better off and others worse off. Since some of these costs and benefits will be not easily translated into numbers, it is not clear how managers will be able to decide what investments to take, what businesses to enter and exit, how to finance these businesses and when and how much cash to return to shareholders. No accountability: The fact that there are multiple stakeholders with conflicting interests also leaves CEOs and top managers accountable to none of them, with the excuse with any group that was ill-served during a period being that other group’s interests had to be met. Decision paralysis: If one of the problems at large companies has been the time it takes to make decisions, I will predict that expanding decision making to take into account the interests of all stakeholders will create decision paralysis, as the “on the one hand, and on the other” arguments will multiply, often with no way to resolve them, since some stakeholder interests will remain fuzzy and non-measurable.To those who believe that stakeholder wealth maximization will usher in a period of common good, with society, customers and employees benefiting from more compassionate corporatism, I offer you two cautionary counter examples. First, you may want to take a look at government-owned and run companies not just in the socialist economies but in many capitalist ones. The managers of these companies were given a laundry list of objectives, resembling in large part the listing of stakeholder objectives, and told to deliver on them all. The end results were some of the most inefficient companies on the face of the earth, with every stakeholder group feeling ill-served in the process. Second, let me use a second illustration not from the corporate sector, but s setting that I am intimately familiar with, because I have spent almost four decades of my life in it. Research universities in the United States are entities built without a central focus, where the stakeholder group being served and the objective is different, depending on who in the university administration you talk to, and when. The end result is not just economically inefficient operations, capable of running a deficit no matter how much tuition is collection, but one where every stakeholder group feels aggrieved; students feel that they pay too much in tuition and have too little say in their education, faculty believe that their rights are being chipped away by no-nothing administrators and the communities feel disrespected and cheated. If you want publicly traded companies to look like research universities in terms of economic efficiency or taking care of stakeholder group interests, confused capitalism is your answer.
Revisiting the MessageTo be fair to the CEOs, there is enough ambiguity in the Business Roundtable statement for readers to read into it whatever they want it to mean, but there are three possible interpretations:A Public Relations Move: It is undeniable that the public perception of corporations has become more negative over the last few decades, and politicians have noticed. Populists on both sides of the political divide have found that the public buys into their framing as corporations as self-interested entities that don’t care about employees, customers or society, with their focus on shareholders being the reason. CEOs have noticed, and the Business Roundtable’s statement may be just a restatement of constrained corporatism.A Return to the Past: Since the business roundtable is composed of CEOs, many of whom have felt the heat of activist investors and pushy shareholders, the cynic in you may lead you to conclude that what the CEOs in the Roundtable would like to see is a return to the good old days of managerial corporatism, where they could rule their companies with little push back, and that this push for stakeholder interests is a diversionary tactic.The Conspiratorial Twist: There is a third twist, and it does require a conspiratorial mindset. Note that the CEOs who are in the Roundtable represent the status quo, large and established companies, many of which find their business models being disrupted by young, start-ups. One way to preempt disruption is to increase the costs of doing business and having to take care of all stakeholders does that, but it is a cost that established companies may be able to bear better right now than their disruptive competitors. ( If you are skeptical, remember I said that you need a conspiratorial mindset. Conclusion I know that this is a trying time to be a corporate CEO, with people demanding that you cure society’s ills and the economy’s problems, with the threat of punitive actions, if you don’t change. That said, I don’t believe that you can win this battle or even recoup some of your lost standing by giving up on the focus on shareholder wealth and replacing it with an ill-thought through and potentially destructive objective of advancing stakeholder interests. In my view, a much healthier discussion would be centered on creating more transparency about how corporations treat different stakeholder groups and linking that information with how they get valued in the market. I think that we are making strides on the first, with better information disclosure from companies and CSR measures, and I hope to help on the second front by connecting these disclosures to intrinsic value. As I noted earlier, if we want companies to behave better in their interactions with society, customers and employees, we have to make it in their financial best interests to do so, buying products and services from companies that treat other stakeholders better and paying higher prices for their shares.
YouTube Video<!-- /* Style Definitions */ p.MsoNormal, li.MsoNormal, div.MsoNormal {mso-style-unhide:no; mso-style-qformat:yes; mso-style-parent:""; margin:0in; margin-bottom:.0001pt; mso-pagination:widow-orphan; font-size:12.0pt; font-family:"Calibri",sans-serif; mso-ascii-font-family:Calibri; mso-ascii-theme-font:minor-latin; mso-fareast-font-family:Calibri; mso-fareast-theme-font:minor-latin; mso-hansi-font-family:Calibri; mso-hansi-theme-font:minor-latin; mso-bidi-font-family:"Times New Roman"; mso-bidi-theme-font:minor-bidi;} p.MsoListParagraph, li.MsoListParagraph, div.MsoListParagraph {mso-style-priority:34; mso-style-unhide:no; mso-style-qformat:yes; margin-top:0in; margin-right:0in; margin-bottom:0in; margin-left:.5in; margin-bottom:.0001pt; mso-add-space:auto; mso-pagination:widow-orphan; font-size:12.0pt; font-family:"Calibri",sans-serif; mso-ascii-font-family:Calibri; mso-ascii-theme-font:minor-latin; mso-fareast-font-family:Calibri; mso-fareast-theme-font:minor-latin; mso-hansi-font-family:Calibri; mso-hansi-theme-font:minor-latin; mso-bidi-font-family:"Times New Roman"; mso-bidi-theme-font:minor-bidi;} p.MsoListParagraphCxSpFirst, li.MsoListParagraphCxSpFirst, div.MsoListParagraphCxSpFirst {mso-style-priority:34; mso-style-unhide:no; mso-style-qformat:yes; mso-style-type:export-only; margin-top:0in; margin-right:0in; margin-bottom:0in; margin-left:.5in; margin-bottom:.0001pt; mso-add-space:auto; mso-pagination:widow-orphan; font-size:12.0pt; font-family:"Calibri",sans-serif; mso-ascii-font-family:Calibri; mso-ascii-theme-font:minor-latin; mso-fareast-font-family:Calibri; mso-fareast-theme-font:minor-latin; mso-hansi-font-family:Calibri; mso-hansi-theme-font:minor-latin; mso-bidi-font-family:"Times New Roman"; mso-bidi-theme-font:minor-bidi;} p.MsoListParagraphCxSpMiddle, li.MsoListParagraphCxSpMiddle, div.MsoListParagraphCxSpMiddle {mso-style-priority:34; mso-style-unhide:no; mso-style-qformat:yes; mso-style-type:export-only; margin-top:0in; margin-right:0in; margin-bottom:0in; margin-left:.5in; margin-bottom:.0001pt; mso-add-space:auto; mso-pagination:widow-orphan; font-size:12.0pt; font-family:"Calibri",sans-serif; mso-ascii-font-family:Calibri; mso-ascii-theme-font:minor-latin; mso-fareast-font-family:Calibri; mso-fareast-theme-font:minor-latin; mso-hansi-font-family:Calibri; mso-hansi-theme-font:minor-latin; mso-bidi-font-family:"Times New Roman"; mso-bidi-theme-font:minor-bidi;} p.MsoListParagraphCxSpLast, li.MsoListParagraphCxSpLast, div.MsoListParagraphCxSpLast {mso-style-priority:34; mso-style-unhide:no; mso-style-qformat:yes; mso-style-type:export-only; margin-top:0in; margin-right:0in; margin-bottom:0in; margin-left:.5in; margin-bottom:.0001pt; mso-add-space:auto; mso-pagination:widow-orphan; font-size:12.0pt; font-family:"Calibri",sans-serif; mso-ascii-font-family:Calibri; mso-ascii-theme-font:minor-latin; mso-fareast-font-family:Calibri; mso-fareast-theme-font:minor-latin; mso-hansi-font-family:Calibri; mso-hansi-theme-font:minor-latin; mso-bidi-font-family:"Times New Roman"; mso-bidi-theme-font:minor-bidi;} .MsoChpDefault {mso-style-type:export-only; mso-default-props:yes; font-family:"Calibri",sans-serif; mso-ascii-font-family:Calibri; mso-ascii-theme-font:minor-latin; mso-fareast-font-family:Calibri; mso-fareast-theme-font:minor-latin; mso-hansi-font-family:Calibri; mso-hansi-theme-font:minor-latin; mso-bidi-font-family:"Times New Roman"; mso-bidi-theme-font:minor-bidi;} @page WordSection1 {size:8.5in 11.0in; margin:1.0in 1.0in 1.0in 1.0in; mso-header-margin:.5in; mso-footer-margin:.5in; mso-paper-source:0;} div.WordSection1 {page:WordSection1;} /* List Definitions */ @list l0 {mso-list-id:107892614; mso-list-type:hybrid; mso-list-template-ids:-1051446148 -136563048 67698691 67698693 67698689 67698691 67698693 67698689 67698691 67698693;} @list l0:level1 {mso-level-start-at:0; mso-level-number-format:bullet; mso-level-text:-; mso-level-tab-stop:none; mso-level-number-position:left; text-indent:-.25in; font-family:"Times New Roman",serif; mso-fareast-font-family:Calibri; mso-fareast-theme-font:minor-latin;} @list l0:level2 {mso-level-number-format:bullet; mso-level-text:o; mso-level-tab-stop:none; mso-level-number-position:left; text-indent:-.25in; font-family:"Courier New";} @list l0:level3 {mso-level-number-format:bullet; mso-level-text:; mso-level-tab-stop:none; mso-level-number-position:left; text-indent:-.25in; font-family:Wingdings;} @list l0:level4 {mso-level-number-format:bullet; mso-level-text:; mso-level-tab-stop:none; mso-level-number-position:left; text-indent:-.25in; font-family:Symbol;} @list l0:level5 {mso-level-number-format:bullet; mso-level-text:o; mso-level-tab-stop:none; mso-level-number-position:left; text-indent:-.25in; font-family:"Courier New";} @list l0:level6 {mso-level-number-format:bullet; mso-level-text:; mso-level-tab-stop:none; mso-level-number-position:left; text-indent:-.25in; font-family:Wingdings;} @list l0:level7 {mso-level-number-format:bullet; mso-level-text:; mso-level-tab-stop:none; mso-level-number-position:left; text-indent:-.25in; font-family:Symbol;} @list l0:level8 {mso-level-number-format:bullet; mso-level-text:o; mso-level-tab-stop:none; mso-level-number-position:left; text-indent:-.25in; font-family:"Courier New";} @list l0:level9 {mso-level-number-format:bullet; mso-level-text:; mso-level-tab-stop:none; mso-level-number-position:left; text-indent:-.25in; font-family:Wingdings;} @list l1 {mso-list-id:1225413654; mso-list-type:hybrid; mso-list-template-ids:32023186 67698703 67698713 67698715 67698703 67698713 67698715 67698703 67698713 67698715;} @list l1:level1 {mso-level-tab-stop:none; mso-level-number-position:left; text-indent:-.25in;} @list l1:level2 {mso-level-number-format:alpha-lower; mso-level-tab-stop:none; mso-level-number-position:left; text-indent:-.25in;} @list l1:level3 {mso-level-number-format:roman-lower; mso-level-tab-stop:none; mso-level-number-position:right; text-indent:-9.0pt;} @list l1:level4 {mso-level-tab-stop:none; mso-level-number-position:left; text-indent:-.25in;} @list l1:level5 {mso-level-number-format:alpha-lower; mso-level-tab-stop:none; mso-level-number-position:left; text-indent:-.25in;} @list l1:level6 {mso-level-number-format:roman-lower; mso-level-tab-stop:none; mso-level-number-position:right; text-indent:-9.0pt;} @list l1:level7 {mso-level-tab-stop:none; mso-level-number-position:left; text-indent:-.25in;} @list l1:level8 {mso-level-number-format:alpha-lower; mso-level-tab-stop:none; mso-level-number-position:left; text-indent:-.25in;} @list l1:level9 {mso-level-number-format:roman-lower; mso-level-tab-stop:none; mso-level-number-position:right; text-indent:-9.0pt;} @list l2 {mso-list-id:1374112990; mso-list-type:hybrid; mso-list-template-ids:1719568348 67698703 67698713 67698715 67698703 67698713 67698715 67698703 67698713 67698715;} @list l2:level1 {mso-level-tab-stop:none; mso-level-number-position:left; text-indent:-.25in;} @list l2:level2 {mso-level-number-format:alpha-lower; mso-level-tab-stop:none; mso-level-number-position:left; text-indent:-.25in;} @list l2:level3 {mso-level-number-format:roman-lower; mso-level-tab-stop:none; mso-level-number-position:right; text-indent:-9.0pt;} @list l2:level4 {mso-level-tab-stop:none; mso-level-number-position:left; text-indent:-.25in;} @list l2:level5 {mso-level-number-format:alpha-lower; mso-level-tab-stop:none; mso-level-number-position:left; text-indent:-.25in;} @list l2:level6 {mso-level-number-format:roman-lower; mso-level-tab-stop:none; mso-level-number-position:right; text-indent:-9.0pt;} @list l2:level7 {mso-level-tab-stop:none; mso-level-number-position:left; text-indent:-.25in;} @list l2:level8 {mso-level-number-format:alpha-lower; mso-level-tab-stop:none; mso-level-number-position:left; text-indent:-.25in;} @list l2:level9 {mso-level-number-format:roman-lower; mso-level-tab-stop:none; mso-level-number-position:right; text-indent:-9.0pt;} </style></div></div></div></div>--><style class="WebKit-mso-list-quirks-style"><!-- /* Style Definitions */ p.MsoNormal, li.MsoNormal, div.MsoNormal {mso-style-unhide:no; mso-style-qformat:yes; mso-style-parent:""; margin:0in; margin-bottom:.0001pt; mso-pagination:widow-orphan; font-size:12.0pt; font-family:"Calibri",sans-serif; mso-ascii-font-family:Calibri; mso-ascii-theme-font:minor-latin; mso-fareast-font-family:Calibri; mso-fareast-theme-font:minor-latin; mso-hansi-font-family:Calibri; mso-hansi-theme-font:minor-latin; mso-bidi-font-family:"Times New Roman"; mso-bidi-theme-font:minor-bidi;} p.MsoListParagraph, li.MsoListParagraph, div.MsoListParagraph {mso-style-priority:34; mso-style-unhide:no; mso-style-qformat:yes; margin-top:0in; margin-right:0in; margin-bottom:0in; margin-left:.5in; margin-bottom:.0001pt; mso-add-space:auto; mso-pagination:widow-orphan; font-size:12.0pt; font-family:"Calibri",sans-serif; mso-ascii-font-family:Calibri; mso-ascii-theme-font:minor-latin; mso-fareast-font-family:Calibri; mso-fareast-theme-font:minor-latin; mso-hansi-font-family:Calibri; mso-hansi-theme-font:minor-latin; mso-bidi-font-family:"Times New Roman"; mso-bidi-theme-font:minor-bidi;} p.MsoListParagraphCxSpFirst, li.MsoListParagraphCxSpFirst, div.MsoListParagraphCxSpFirst {mso-style-priority:34; mso-style-unhide:no; mso-style-qformat:yes; mso-style-type:export-only; margin-top:0in; margin-right:0in; margin-bottom:0in; margin-left:.5in; margin-bottom:.0001pt; mso-add-space:auto; mso-pagination:widow-orphan; font-size:12.0pt; font-family:"Calibri",sans-serif; mso-ascii-font-family:Calibri; mso-ascii-theme-font:minor-latin; mso-fareast-font-family:Calibri; mso-fareast-theme-font:minor-latin; mso-hansi-font-family:Calibri; mso-hansi-theme-font:minor-latin; mso-bidi-font-family:"Times New Roman"; mso-bidi-theme-font:minor-bidi;} p.MsoListParagraphCxSpMiddle, li.MsoListParagraphCxSpMiddle, div.MsoListParagraphCxSpMiddle {mso-style-priority:34; mso-style-unhide:no; mso-style-qformat:yes; mso-style-type:export-only; margin-top:0in; margin-right:0in; margin-bottom:0in; margin-left:.5in; margin-bottom:.0001pt; mso-add-space:auto; mso-pagination:widow-orphan; font-size:12.0pt; font-family:"Calibri",sans-serif; mso-ascii-font-family:Calibri; mso-ascii-theme-font:minor-latin; mso-fareast-font-family:Calibri; mso-fareast-theme-font:minor-latin; mso-hansi-font-family:Calibri; mso-hansi-theme-font:minor-latin; mso-bidi-font-family:"Times New Roman"; mso-bidi-theme-font:minor-bidi;} p.MsoListParagraphCxSpLast, li.MsoListParagraphCxSpLast, div.MsoListParagraphCxSpLast {mso-style-priority:34; mso-style-unhide:no; mso-style-qformat:yes; mso-style-type:export-only; margin-top:0in; margin-right:0in; margin-bottom:0in; margin-left:.5in; margin-bottom:.0001pt; mso-add-space:auto; mso-pagination:widow-orphan; font-size:12.0pt; font-family:"Calibri",sans-serif; mso-ascii-font-family:Calibri; mso-ascii-theme-font:minor-latin; mso-fareast-font-family:Calibri; mso-fareast-theme-font:minor-latin; mso-hansi-font-family:Calibri; mso-hansi-theme-font:minor-latin; mso-bidi-font-family:"Times New Roman"; mso-bidi-theme-font:minor-bidi;} .MsoChpDefault {mso-style-type:export-only; mso-default-props:yes; font-family:"Calibri",sans-serif; mso-ascii-font-family:Calibri; mso-ascii-theme-font:minor-latin; mso-fareast-font-family:Calibri; mso-fareast-theme-font:minor-latin; mso-hansi-font-family:Calibri; mso-hansi-theme-font:minor-latin; mso-bidi-font-family:"Times New Roman"; mso-bidi-theme-font:minor-bidi;} @page WordSection1 {size:8.5in 11.0in; margin:1.0in 1.0in 1.0in 1.0in; mso-header-margin:.5in; mso-footer-margin:.5in; mso-paper-source:0;} div.WordSection1 {page:WordSection1;} /* List Definitions */ @list l0 {mso-list-id:727152184; mso-list-type:hybrid; mso-list-template-ids:88906506 67698703 67698713 67698715 67698703 67698713 67698715 67698703 67698713 67698715;} @list l0:level1 {mso-level-tab-stop:none; mso-level-number-position:left; text-indent:-.25in;} @list l0:level2 {mso-level-number-format:alpha-lower; mso-level-tab-stop:none; mso-level-number-position:left; text-indent:-.25in;} @list l0:level3 {mso-level-number-format:roman-lower; mso-level-tab-stop:none; mso-level-number-position:right; text-indent:-9.0pt;} @list l0:level4 {mso-level-tab-stop:none; mso-level-number-position:left; text-indent:-.25in;} @list l0:level5 {mso-level-number-format:alpha-lower; mso-level-tab-stop:none; mso-level-number-position:left; text-indent:-.25in;} @list l0:level6 {mso-level-number-format:roman-lower; mso-level-tab-stop:none; mso-level-number-position:right; text-indent:-9.0pt;} @list l0:level7 {mso-level-tab-stop:none; mso-level-number-position:left; text-indent:-.25in;} @list l0:level8 {mso-level-number-format:alpha-lower; mso-level-tab-stop:none; mso-level-number-position:left; text-indent:-.25in;} @list l0:level9 {mso-level-number-format:roman-lower; mso-level-tab-stop:none; mso-level-number-position:right; text-indent:-9.0pt;} </style></div>-->
The Business Roundtable Speaks: A flawed message from a flawed messenger The Business Roundtable, tracing it history back to 1972, and restricting its membership to CEOs of major corporations, lobbies for business-friendly legislation and has a history of making statements about corporate purpose that are usually completely predictable and not very newsworthy. This year’s statement, at least on the surface, breaks with this past with its talk of stakeholder interests and rather than give you my interpretation of the statement, I will quote directly from it:
While each of our individual companies serves its own corporate purpose, we share a fundamental commitment to all of our stakeholders. We commit to: Delivering value to our customers. We will further the tradition of American companies leading the way in meeting or exceeding customer expectations. Investing in our employees. This starts with compensating them fairly and providing important benefits. It also includes supporting them through training and education that help develop new skills for a rapidly changing world. We foster diversity and inclusion, dignity and respect. Dealing fairly and ethically with our suppliers. We are dedicated to serving as good partners to the other companies, large and small, that help us meet our missions. Supporting the communities in which we work. We respect the people in our communities and protect the environment by embracing sustainable practices across our businesses. Generating long-term value for shareholders, who provide the capital that allows companies to invest, grow and innovate. We are committed to transparency and effective engagement with shareholders. The use of the word “stakeholders: and an explicit listing of how corporations should act in each of their interests has drawn extensive attention from a diverse group of individuals, each drawing its own conclusions and making its own criticisms. Critics of shareholder wealth maximization viewed this statement as vindication, an acceptance of their long-term tenet that focusing on shareholder wealth has given rise to income inequality, loss of good manufacturing jobs and societal costs. Supporters of shareholder wealth maximization considered the statement to be not only ill-advised but also a craven concession to populist forces. Cynics argued that it was more political document than restatement of purpose, smoke and noise that signified nothing. Journalists have concluded that this statement is, in fact, a fundamental restatement of corporate purpose, driven by political pressures.
While the statement was signed by 181 CEOs, including Bezos (Amazon), Tim Cook (Apple), Brian Moynihan (B of A) and Mary Barra (GM), I found it odd that Jamie Dimon, the CEO of JP Morgan Chase, was the person who was chosen to deliver the message. To give Mr. Dimon his due, he is a very good banker and has excellent political skills, a plus at the top of a money center bank, but he is definitely not someone that I would view as putting shareholder interests first. Over the last decade, Jamie Dimon has repeatedly clashed with his own stockholders, first over his decision to chair the board of directors that is supposed to oversee him and multiple times about his compensation. He has technically won these fights at annual meetings, but with some of the highest opposition among large, widely held public companies, and he has been well protected by his ineffectual and mostly rubber stamp board of directors. Jamie Dimon talking about shareholder wealth is about as believable as Madonna singing “like a virgin” or Kim Kardashian speaking about the importance of privacy.
The Stakeholders in a Corporation To most laymen, the debate about whether to focus on shareholders or stakeholders may seem like an obscure one that has few consequences for their lives, but it is of huge import and the best way to get perspective is to see who these stakeholders in the modern corporation are and what their relationship is with public companies:

Stakeholders therefore have different legal relationships with the company and divergent interests, implying that actions that make one stakeholder group better off may make other stakeholder groups worse. It is this conflict that makes the discussion of which group has primacy in decision making so heated and political.
Versions of CorporatismIn the section below, I will present five different perspectives on how corporations are run, and I will let you draw your own conclusions on which one best describes current corporate behavior and argue that your that choice will determine, in large part, what you think should be the norm.
1. Cutthroat Corporatism
The most extreme view of corporations is what describe as cutthroat capitalism, where the strong companies drive out the weak and the end game is stockholder wealth maximization (often with a founder/family being the prime beneficiary) at almost any cost:

In the late nineteenth century, the robber barons of the age (Andrew Carnegie, John D. Rockefeller and others) hewed to this template to build some of the greatest companies of the time, some of which survive to this day. They were ruthless in their march towards domination, crushing competitors through fair means or foul, bending society to their will and exploiting customers and employees. Their overreach led to Teddy Roosevelt’s election and the subsequent passage of antitrust laws, but much as we tend to view these corporate chieftains as villains, they played a major role in making the US a global economic power. In the century since, there are other companies that have aspired for dominance, using what many critics have viewed as ruthless and perhaps even illegal ways to exercise market dominance. Lest you view this model of corporate behavior as a historical artifact, many of today's companies have, at least in some aspects of their behavior, have been accused of following this model.
2. Crony Corporatism A variant of this win-at-all-costs corporatism is crony corporatism, where the end game is still market dominance but the base is built less on economies of scale, efficient operations and product differentiation, and more on connections to government and rule writers, with the objective being tilting the scales of competition in the company’s favor:
 While the end result of cutthroat and crony capitalism is the same, i.e., large market-dominating companies that give short shrift to employees and customers, it can be argued that since the winners are the most connected, not the most efficient, crony capitalism offers all of the costs of cutthroat capitalism, with none of the benefits. While family group companies in some emerging markets obviously fit this mould, I think that an argument can be made that there is an element of cronyism in many developed markets.
3. Managerial CorporatismThere is a third version of corporatism that comes to the forefront, especially as public companies age, founders/families are replaced with professional managers and shareholdings get dispersed among lots of shareholders with small (percent) stakes. In this version, it is the professional managers whose interests drive decision making in the company, with other stakeholders viewed as side players.

Note that the managers who make corporate decisions often own little equity in the company, or if they do, get it as part of compensation packages, often determined by boards of directors that operate less as checks and more as rubber stamps. The question of how well other stakeholders do in this version depends in large part on whether their interests converge on those of managers; if there is convergence, their interests will be advanced, but only because it happens to advance managerial interests as well, and if not, they will find themselves paying the price to make managers better off. This was the default for US companies in the decades after the second world war, with long tenures for CEOs and little or no shareholder activism, and overall economic prosperity allowing for a coopting of other stakeholder: solid wage gains for employees, corporate charity and restrained competition.
4. Constrained Corporatism I suspect that there are very few people, even among true believers in free markets and capitalism, who will defend cutthroat or crony capitalism. There are some who are nostalgic for managerial corporatism, pointing to the solid stock returns, well-paying jobs and societal side benefits that came with it, not seeing that these stakeholder benefits were made possible by US economic dominance during the period, and the ease with US companies could make money. It is no coincidence that shareholder activism rose to the surface in the 1980s, as US economic power slipped and managerial interests were served at the expense of not just shareholders, but other stakeholders. While this activism resulted in leveraged buyouts in some companies, it also gave rise to a version of shareholder wealth maximization that I center my corporate finance decision making, that I call constrained corporatism, where companies preserve the primacy of shareholders, while constraining how they interact with other stakeholder groups:
 The efficacy of this version of corporatism depends largely on how well the constraints protect other stakeholders and what drives companies to adopt the constraints in the first place, with three possible drivers for the latter:Government-imposed constraints: Governments can write laws or draw up rules that constrain how corporations treat stakeholders, with labor laws determining not only how much workers get paid but also conditions under which they can be hired or fired, product laws capping prices on some products and protecting customer interests in others and anti-trust laws determining whether product markets stay competitive. European governments have been far more aggressive with this approach than the US, but the globalization of businesses has not only weakened the protections offered by these laws, but also put companies covered by them at a competitive disadvantage, relative to companies that operate in countries without these laws and restrictions.Self-imposed constraints: In this variant, companies voluntarily adopt constraints on their interactions with other stakeholder groups, often choosing to pay higher wages (than they could get away paying) to their employees, charging customers less for products/services than they could have, given their pricing power, and turning away investments that they could pursue legally, for profits, because of the costs that it will create for society. In effect, the essence of these constraints is that the profit settles for less profit than it could have made if it have as an unconstrained player. The problem with self-imposed constraints is that your capacity to adopt them will be correlated with how profitable you are to begin with, with companies with more slack built into their business models being in a better position than companies facing profit pressures in an intensely competitive market. Market-driven constraints: In this final variation, companies adopt constraints on how they treat stakeholders because it makes them more valuable companies, even as they settle for less profits, at least in the near term. That seeming contradiction can be explained by two factors. The first is that whatever costs the company faces in the short term from imposing the constraints may be overwhelmed by benefits in the long term; paying employees more may yield more loyal and better employees, offering customers better deals may lead to more repeat business and being a good corporate citizen may operate as advertising, attracting more customers to the company. To top it all off, investors who care about any or all of these behaviors may be more inclined to invest in your shares, pushing up stock prices. The second is that companies that exploit customers and employees or acquire a reputation for being bad corporate citizens will have few defenders when it does make a mistake or have a problem, inevitable in the long term, leading to potentially catastrophic costs.As an advocate for shareholder wealth maximization, I would love to live in a world where the market rewarded companies that try to do the right thing, since it would make good behavior entirely consistent with value maximization. That said, I am a realist and accept that some constraints have to be imposed by governments, regulators and rule writers, and that some companies, especially ones with strong profitability and substantial slack in their business models, may accept self constraints.
5. Confused Corporatism
In some sectors and in some markets and during some time periods, markets will not do the job, leaving us as the mercy of bad behavior by some or many corporate players. It is therefore not surprising that stakeholder wealth maximization is seen as an alternative corporate model:

It is quite clear that the corporate mission in this version of corporatism has been enlarged to cover all stakeholders, often with very different interests at heart. On the surface, it may look like constrained capitalism, but unlike it, in this version, you have multiple objectives, with no clear sense of which one dominates. Your job as a top manager or CEO is to pay not just a fair, but a living wage, even if you cannot afford it as a company, but also deliver maximum value to your customer, preserve society’s best interests and ensure that your business stays competitive, while also making sure that you deliver the returns your stockholders and lenders desire. In my view, it is destined to fail for three reasons:Conflicting interests: By treating the interests of all stakeholders as equivalent, it ignores the reality that decisions in companies, almost by definition, will make stakeholders better off and others worse off. Since some of these costs and benefits will be not easily translated into numbers, it is not clear how managers will be able to decide what investments to take, what businesses to enter and exit, how to finance these businesses and when and how much cash to return to shareholders. No accountability: The fact that there are multiple stakeholders with conflicting interests also leaves CEOs and top managers accountable to none of them, with the excuse with any group that was ill-served during a period being that other group’s interests had to be met. Decision paralysis: If one of the problems at large companies has been the time it takes to make decisions, I will predict that expanding decision making to take into account the interests of all stakeholders will create decision paralysis, as the “on the one hand, and on the other” arguments will multiply, often with no way to resolve them, since some stakeholder interests will remain fuzzy and non-measurable.To those who believe that stakeholder wealth maximization will usher in a period of common good, with society, customers and employees benefiting from more compassionate corporatism, I offer you two cautionary counter examples. First, you may want to take a look at government-owned and run companies not just in the socialist economies but in many capitalist ones. The managers of these companies were given a laundry list of objectives, resembling in large part the listing of stakeholder objectives, and told to deliver on them all. The end results were some of the most inefficient companies on the face of the earth, with every stakeholder group feeling ill-served in the process. Second, let me use a second illustration not from the corporate sector, but s setting that I am intimately familiar with, because I have spent almost four decades of my life in it. Research universities in the United States are entities built without a central focus, where the stakeholder group being served and the objective is different, depending on who in the university administration you talk to, and when. The end result is not just economically inefficient operations, capable of running a deficit no matter how much tuition is collection, but one where every stakeholder group feels aggrieved; students feel that they pay too much in tuition and have too little say in their education, faculty believe that their rights are being chipped away by no-nothing administrators and the communities feel disrespected and cheated. If you want publicly traded companies to look like research universities in terms of economic efficiency or taking care of stakeholder group interests, confused capitalism is your answer.
Revisiting the MessageTo be fair to the CEOs, there is enough ambiguity in the Business Roundtable statement for readers to read into it whatever they want it to mean, but there are three possible interpretations:A Public Relations Move: It is undeniable that the public perception of corporations has become more negative over the last few decades, and politicians have noticed. Populists on both sides of the political divide have found that the public buys into their framing as corporations as self-interested entities that don’t care about employees, customers or society, with their focus on shareholders being the reason. CEOs have noticed, and the Business Roundtable’s statement may be just a restatement of constrained corporatism.A Return to the Past: Since the business roundtable is composed of CEOs, many of whom have felt the heat of activist investors and pushy shareholders, the cynic in you may lead you to conclude that what the CEOs in the Roundtable would like to see is a return to the good old days of managerial corporatism, where they could rule their companies with little push back, and that this push for stakeholder interests is a diversionary tactic.The Conspiratorial Twist: There is a third twist, and it does require a conspiratorial mindset. Note that the CEOs who are in the Roundtable represent the status quo, large and established companies, many of which find their business models being disrupted by young, start-ups. One way to preempt disruption is to increase the costs of doing business and having to take care of all stakeholders does that, but it is a cost that established companies may be able to bear better right now than their disruptive competitors. ( If you are skeptical, remember I said that you need a conspiratorial mindset. Conclusion I know that this is a trying time to be a corporate CEO, with people demanding that you cure society’s ills and the economy’s problems, with the threat of punitive actions, if you don’t change. That said, I don’t believe that you can win this battle or even recoup some of your lost standing by giving up on the focus on shareholder wealth and replacing it with an ill-thought through and potentially destructive objective of advancing stakeholder interests. In my view, a much healthier discussion would be centered on creating more transparency about how corporations treat different stakeholder groups and linking that information with how they get valued in the market. I think that we are making strides on the first, with better information disclosure from companies and CSR measures, and I hope to help on the second front by connecting these disclosures to intrinsic value. As I noted earlier, if we want companies to behave better in their interactions with society, customers and employees, we have to make it in their financial best interests to do so, buying products and services from companies that treat other stakeholders better and paying higher prices for their shares.
YouTube Video<!-- /* Style Definitions */ p.MsoNormal, li.MsoNormal, div.MsoNormal {mso-style-unhide:no; mso-style-qformat:yes; mso-style-parent:""; margin:0in; margin-bottom:.0001pt; mso-pagination:widow-orphan; font-size:12.0pt; font-family:"Calibri",sans-serif; mso-ascii-font-family:Calibri; mso-ascii-theme-font:minor-latin; mso-fareast-font-family:Calibri; mso-fareast-theme-font:minor-latin; mso-hansi-font-family:Calibri; mso-hansi-theme-font:minor-latin; mso-bidi-font-family:"Times New Roman"; mso-bidi-theme-font:minor-bidi;} p.MsoListParagraph, li.MsoListParagraph, div.MsoListParagraph {mso-style-priority:34; mso-style-unhide:no; mso-style-qformat:yes; margin-top:0in; margin-right:0in; margin-bottom:0in; margin-left:.5in; margin-bottom:.0001pt; mso-add-space:auto; mso-pagination:widow-orphan; font-size:12.0pt; font-family:"Calibri",sans-serif; mso-ascii-font-family:Calibri; mso-ascii-theme-font:minor-latin; mso-fareast-font-family:Calibri; mso-fareast-theme-font:minor-latin; mso-hansi-font-family:Calibri; mso-hansi-theme-font:minor-latin; mso-bidi-font-family:"Times New Roman"; mso-bidi-theme-font:minor-bidi;} p.MsoListParagraphCxSpFirst, li.MsoListParagraphCxSpFirst, div.MsoListParagraphCxSpFirst {mso-style-priority:34; mso-style-unhide:no; mso-style-qformat:yes; mso-style-type:export-only; margin-top:0in; margin-right:0in; margin-bottom:0in; margin-left:.5in; margin-bottom:.0001pt; mso-add-space:auto; mso-pagination:widow-orphan; font-size:12.0pt; font-family:"Calibri",sans-serif; mso-ascii-font-family:Calibri; mso-ascii-theme-font:minor-latin; mso-fareast-font-family:Calibri; mso-fareast-theme-font:minor-latin; mso-hansi-font-family:Calibri; mso-hansi-theme-font:minor-latin; mso-bidi-font-family:"Times New Roman"; mso-bidi-theme-font:minor-bidi;} p.MsoListParagraphCxSpMiddle, li.MsoListParagraphCxSpMiddle, div.MsoListParagraphCxSpMiddle {mso-style-priority:34; mso-style-unhide:no; mso-style-qformat:yes; mso-style-type:export-only; margin-top:0in; margin-right:0in; margin-bottom:0in; margin-left:.5in; margin-bottom:.0001pt; mso-add-space:auto; mso-pagination:widow-orphan; font-size:12.0pt; font-family:"Calibri",sans-serif; mso-ascii-font-family:Calibri; mso-ascii-theme-font:minor-latin; mso-fareast-font-family:Calibri; mso-fareast-theme-font:minor-latin; mso-hansi-font-family:Calibri; mso-hansi-theme-font:minor-latin; mso-bidi-font-family:"Times New Roman"; mso-bidi-theme-font:minor-bidi;} p.MsoListParagraphCxSpLast, li.MsoListParagraphCxSpLast, div.MsoListParagraphCxSpLast {mso-style-priority:34; mso-style-unhide:no; mso-style-qformat:yes; mso-style-type:export-only; margin-top:0in; margin-right:0in; margin-bottom:0in; margin-left:.5in; margin-bottom:.0001pt; mso-add-space:auto; mso-pagination:widow-orphan; font-size:12.0pt; font-family:"Calibri",sans-serif; mso-ascii-font-family:Calibri; mso-ascii-theme-font:minor-latin; mso-fareast-font-family:Calibri; mso-fareast-theme-font:minor-latin; mso-hansi-font-family:Calibri; mso-hansi-theme-font:minor-latin; mso-bidi-font-family:"Times New Roman"; mso-bidi-theme-font:minor-bidi;} .MsoChpDefault {mso-style-type:export-only; mso-default-props:yes; font-family:"Calibri",sans-serif; mso-ascii-font-family:Calibri; mso-ascii-theme-font:minor-latin; mso-fareast-font-family:Calibri; mso-fareast-theme-font:minor-latin; mso-hansi-font-family:Calibri; mso-hansi-theme-font:minor-latin; mso-bidi-font-family:"Times New Roman"; mso-bidi-theme-font:minor-bidi;} @page WordSection1 {size:8.5in 11.0in; margin:1.0in 1.0in 1.0in 1.0in; mso-header-margin:.5in; mso-footer-margin:.5in; mso-paper-source:0;} div.WordSection1 {page:WordSection1;} /* List Definitions */ @list l0 {mso-list-id:107892614; mso-list-type:hybrid; mso-list-template-ids:-1051446148 -136563048 67698691 67698693 67698689 67698691 67698693 67698689 67698691 67698693;} @list l0:level1 {mso-level-start-at:0; mso-level-number-format:bullet; mso-level-text:-; mso-level-tab-stop:none; mso-level-number-position:left; text-indent:-.25in; font-family:"Times New Roman",serif; mso-fareast-font-family:Calibri; mso-fareast-theme-font:minor-latin;} @list l0:level2 {mso-level-number-format:bullet; mso-level-text:o; mso-level-tab-stop:none; mso-level-number-position:left; text-indent:-.25in; font-family:"Courier New";} @list l0:level3 {mso-level-number-format:bullet; mso-level-text:; mso-level-tab-stop:none; mso-level-number-position:left; text-indent:-.25in; font-family:Wingdings;} @list l0:level4 {mso-level-number-format:bullet; mso-level-text:; mso-level-tab-stop:none; mso-level-number-position:left; text-indent:-.25in; font-family:Symbol;} @list l0:level5 {mso-level-number-format:bullet; mso-level-text:o; mso-level-tab-stop:none; mso-level-number-position:left; text-indent:-.25in; font-family:"Courier New";} @list l0:level6 {mso-level-number-format:bullet; mso-level-text:; mso-level-tab-stop:none; mso-level-number-position:left; text-indent:-.25in; font-family:Wingdings;} @list l0:level7 {mso-level-number-format:bullet; mso-level-text:; mso-level-tab-stop:none; mso-level-number-position:left; text-indent:-.25in; font-family:Symbol;} @list l0:level8 {mso-level-number-format:bullet; mso-level-text:o; mso-level-tab-stop:none; mso-level-number-position:left; text-indent:-.25in; font-family:"Courier New";} @list l0:level9 {mso-level-number-format:bullet; mso-level-text:; mso-level-tab-stop:none; mso-level-number-position:left; text-indent:-.25in; font-family:Wingdings;} @list l1 {mso-list-id:1225413654; mso-list-type:hybrid; mso-list-template-ids:32023186 67698703 67698713 67698715 67698703 67698713 67698715 67698703 67698713 67698715;} @list l1:level1 {mso-level-tab-stop:none; mso-level-number-position:left; text-indent:-.25in;} @list l1:level2 {mso-level-number-format:alpha-lower; mso-level-tab-stop:none; mso-level-number-position:left; text-indent:-.25in;} @list l1:level3 {mso-level-number-format:roman-lower; mso-level-tab-stop:none; mso-level-number-position:right; text-indent:-9.0pt;} @list l1:level4 {mso-level-tab-stop:none; mso-level-number-position:left; text-indent:-.25in;} @list l1:level5 {mso-level-number-format:alpha-lower; mso-level-tab-stop:none; mso-level-number-position:left; text-indent:-.25in;} @list l1:level6 {mso-level-number-format:roman-lower; mso-level-tab-stop:none; mso-level-number-position:right; text-indent:-9.0pt;} @list l1:level7 {mso-level-tab-stop:none; mso-level-number-position:left; text-indent:-.25in;} @list l1:level8 {mso-level-number-format:alpha-lower; mso-level-tab-stop:none; mso-level-number-position:left; text-indent:-.25in;} @list l1:level9 {mso-level-number-format:roman-lower; mso-level-tab-stop:none; mso-level-number-position:right; text-indent:-9.0pt;} @list l2 {mso-list-id:1374112990; mso-list-type:hybrid; mso-list-template-ids:1719568348 67698703 67698713 67698715 67698703 67698713 67698715 67698703 67698713 67698715;} @list l2:level1 {mso-level-tab-stop:none; mso-level-number-position:left; text-indent:-.25in;} @list l2:level2 {mso-level-number-format:alpha-lower; mso-level-tab-stop:none; mso-level-number-position:left; text-indent:-.25in;} @list l2:level3 {mso-level-number-format:roman-lower; mso-level-tab-stop:none; mso-level-number-position:right; text-indent:-9.0pt;} @list l2:level4 {mso-level-tab-stop:none; mso-level-number-position:left; text-indent:-.25in;} @list l2:level5 {mso-level-number-format:alpha-lower; mso-level-tab-stop:none; mso-level-number-position:left; text-indent:-.25in;} @list l2:level6 {mso-level-number-format:roman-lower; mso-level-tab-stop:none; mso-level-number-position:right; text-indent:-9.0pt;} @list l2:level7 {mso-level-tab-stop:none; mso-level-number-position:left; text-indent:-.25in;} @list l2:level8 {mso-level-number-format:alpha-lower; mso-level-tab-stop:none; mso-level-number-position:left; text-indent:-.25in;} @list l2:level9 {mso-level-number-format:roman-lower; mso-level-tab-stop:none; mso-level-number-position:right; text-indent:-9.0pt;} </style></div></div></div></div>--><style class="WebKit-mso-list-quirks-style"><!-- /* Style Definitions */ p.MsoNormal, li.MsoNormal, div.MsoNormal {mso-style-unhide:no; mso-style-qformat:yes; mso-style-parent:""; margin:0in; margin-bottom:.0001pt; mso-pagination:widow-orphan; font-size:12.0pt; font-family:"Calibri",sans-serif; mso-ascii-font-family:Calibri; mso-ascii-theme-font:minor-latin; mso-fareast-font-family:Calibri; mso-fareast-theme-font:minor-latin; mso-hansi-font-family:Calibri; mso-hansi-theme-font:minor-latin; mso-bidi-font-family:"Times New Roman"; mso-bidi-theme-font:minor-bidi;} p.MsoListParagraph, li.MsoListParagraph, div.MsoListParagraph {mso-style-priority:34; mso-style-unhide:no; mso-style-qformat:yes; margin-top:0in; margin-right:0in; margin-bottom:0in; margin-left:.5in; margin-bottom:.0001pt; mso-add-space:auto; mso-pagination:widow-orphan; font-size:12.0pt; font-family:"Calibri",sans-serif; mso-ascii-font-family:Calibri; mso-ascii-theme-font:minor-latin; mso-fareast-font-family:Calibri; mso-fareast-theme-font:minor-latin; mso-hansi-font-family:Calibri; mso-hansi-theme-font:minor-latin; mso-bidi-font-family:"Times New Roman"; mso-bidi-theme-font:minor-bidi;} p.MsoListParagraphCxSpFirst, li.MsoListParagraphCxSpFirst, div.MsoListParagraphCxSpFirst {mso-style-priority:34; mso-style-unhide:no; mso-style-qformat:yes; mso-style-type:export-only; margin-top:0in; margin-right:0in; margin-bottom:0in; margin-left:.5in; margin-bottom:.0001pt; mso-add-space:auto; mso-pagination:widow-orphan; font-size:12.0pt; font-family:"Calibri",sans-serif; mso-ascii-font-family:Calibri; mso-ascii-theme-font:minor-latin; mso-fareast-font-family:Calibri; mso-fareast-theme-font:minor-latin; mso-hansi-font-family:Calibri; mso-hansi-theme-font:minor-latin; mso-bidi-font-family:"Times New Roman"; mso-bidi-theme-font:minor-bidi;} p.MsoListParagraphCxSpMiddle, li.MsoListParagraphCxSpMiddle, div.MsoListParagraphCxSpMiddle {mso-style-priority:34; mso-style-unhide:no; mso-style-qformat:yes; mso-style-type:export-only; margin-top:0in; margin-right:0in; margin-bottom:0in; margin-left:.5in; margin-bottom:.0001pt; mso-add-space:auto; mso-pagination:widow-orphan; font-size:12.0pt; font-family:"Calibri",sans-serif; mso-ascii-font-family:Calibri; mso-ascii-theme-font:minor-latin; mso-fareast-font-family:Calibri; mso-fareast-theme-font:minor-latin; mso-hansi-font-family:Calibri; mso-hansi-theme-font:minor-latin; mso-bidi-font-family:"Times New Roman"; mso-bidi-theme-font:minor-bidi;} p.MsoListParagraphCxSpLast, li.MsoListParagraphCxSpLast, div.MsoListParagraphCxSpLast {mso-style-priority:34; mso-style-unhide:no; mso-style-qformat:yes; mso-style-type:export-only; margin-top:0in; margin-right:0in; margin-bottom:0in; margin-left:.5in; margin-bottom:.0001pt; mso-add-space:auto; mso-pagination:widow-orphan; font-size:12.0pt; font-family:"Calibri",sans-serif; mso-ascii-font-family:Calibri; mso-ascii-theme-font:minor-latin; mso-fareast-font-family:Calibri; mso-fareast-theme-font:minor-latin; mso-hansi-font-family:Calibri; mso-hansi-theme-font:minor-latin; mso-bidi-font-family:"Times New Roman"; mso-bidi-theme-font:minor-bidi;} .MsoChpDefault {mso-style-type:export-only; mso-default-props:yes; font-family:"Calibri",sans-serif; mso-ascii-font-family:Calibri; mso-ascii-theme-font:minor-latin; mso-fareast-font-family:Calibri; mso-fareast-theme-font:minor-latin; mso-hansi-font-family:Calibri; mso-hansi-theme-font:minor-latin; mso-bidi-font-family:"Times New Roman"; mso-bidi-theme-font:minor-bidi;} @page WordSection1 {size:8.5in 11.0in; margin:1.0in 1.0in 1.0in 1.0in; mso-header-margin:.5in; mso-footer-margin:.5in; mso-paper-source:0;} div.WordSection1 {page:WordSection1;} /* List Definitions */ @list l0 {mso-list-id:727152184; mso-list-type:hybrid; mso-list-template-ids:88906506 67698703 67698713 67698715 67698703 67698713 67698715 67698703 67698713 67698715;} @list l0:level1 {mso-level-tab-stop:none; mso-level-number-position:left; text-indent:-.25in;} @list l0:level2 {mso-level-number-format:alpha-lower; mso-level-tab-stop:none; mso-level-number-position:left; text-indent:-.25in;} @list l0:level3 {mso-level-number-format:roman-lower; mso-level-tab-stop:none; mso-level-number-position:right; text-indent:-9.0pt;} @list l0:level4 {mso-level-tab-stop:none; mso-level-number-position:left; text-indent:-.25in;} @list l0:level5 {mso-level-number-format:alpha-lower; mso-level-tab-stop:none; mso-level-number-position:left; text-indent:-.25in;} @list l0:level6 {mso-level-number-format:roman-lower; mso-level-tab-stop:none; mso-level-number-position:right; text-indent:-9.0pt;} @list l0:level7 {mso-level-tab-stop:none; mso-level-number-position:left; text-indent:-.25in;} @list l0:level8 {mso-level-number-format:alpha-lower; mso-level-tab-stop:none; mso-level-number-position:left; text-indent:-.25in;} @list l0:level9 {mso-level-number-format:roman-lower; mso-level-tab-stop:none; mso-level-number-position:right; text-indent:-9.0pt;} </style></div>-->


August 13, 2019
Country Risk: A Mid-year 2019 Update
One of the consequences of globalization is that investors, analysts and companies can no longer stay focused on just their domestic markets, but have to also understand the risks and opportunities elsewhere in the world. When developed market companies first embarked on the journey of expanding into emerging market growth economies, investors pushed up their stock prices, primarily because of the potential that they saw in these markets for expansion. Over time, though, we have learned that, as with much else in business, this strategy comes with additional risk, not just from changing exchange rates, but from unstable economic and political forces. This growth/risk trade off explains why some companies have gained from value from globalizing and others have lost. In this post, I look at country risk through many lens, but with the end game of being able to incorporate it into decision making both for investors and businesses.
The Sources of Country Risk
When companies invest outside their domestic markets, the most immediate risk that they are exposed to is exchange rate risk, since revenues, profits and cash flows are affected by changing exchange rates. That risk, though, is but a piece of the puzzle, a symptom of economic fundamentals and affected by political crises. Digging deeper, the factors that make some countries riskier than others can be broadly classified into the following groups:
1. Life Cycle: I have used the construct of a corporate life cycle to talk about companies at different stages in the life cycle, and how they differ on cash flow generation and growth potential. It is also generally true that younger companies, deriving more or most of their value from future growth, are riskier than more mature companies, where the bulk of their value coming from investments already made. The same construct can be applied to countries, with emerging economies that are growing rapidly being more exposed to global shocks than mature countries. It should come as no surprise, therefore, that in almost every market crisis over the last decade, emerging markets have paid a much large price in terms of lost economic growth and lower market value than developed markets.
2. Political Risk: If the last few years have taught us a lesson, it is that politics can affect economic and market risk, not just in emerging markets, but also in developed ones. While there are many forms of political risk, ranging from abrupt changes in fiscal and monetary policy to regime change, there are at least two measurable manifestations of this risk in the form of corruption risk and exposure to violence.Corruption Risk: There are parts of the world where the costs of doing business include greasing palms and paying off intermediaries, and the roots lie deep, resisting feel-good quick fixes. While anecdotal stories of corruption and its consequences are plentiful, there are services to try to measure corruption levels across countries. Transparency International, for instance, derives a corruption score, by country, and in its 2019 report, provides a listing of the ten least and most corrupt countries in the world in the figure below, with higher scores indicating less corruption) for 2018.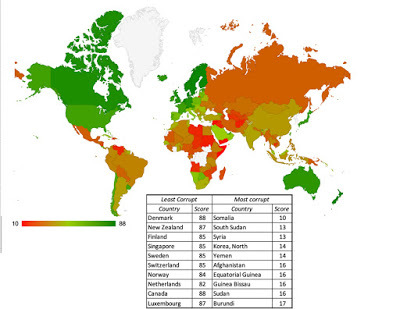 Source: Transparency InternationalThe effect of corruption upon business is insidious, making winners of those most willing to play the bribery game and losers of those who resist. In an earlier post, I argued that corruption creates the equivalent of an informal tax, pushing down after-tax income to companies.Physical Violence: When talking about risk in investing or business, we tend to focus on financial risk, but it is undeniable that adding the threat of physical violence, from war, terrorism or crime, makes it more difficult to operate a business. There are services again that measure exposure to violence in different countries, and while each brings its own biases, the Institute of Economics and Peace has created and reports on a Global Peace Index, measuring exposure to violence, by country.
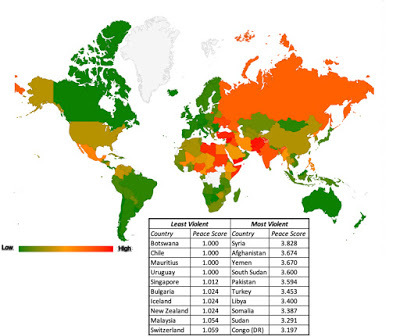 Source: Institute of Economics and PeaceThe map summarizes their findings from the most recent year. I must confess that I am surprised to see Botswana at the top of the list, but having never been there, that may be a reflection of my regional biases.3. Legal Risk: A business derives its value from the assets it owns, physical ord intangible, and to continue to derive value, it has to not only preserve its ownership but have a legal system that enforces it’s rights. The quality of this protection varies across countries, either because property rights have fewer protections in some countries or because those rights are not enforced in a timely manner in others. A group of non-government organizations has created an international property rights index, measuring the protection provided for property rights in different countries. The results in 2018, by region, are provided in the table below:
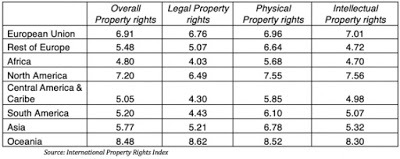
4. Economic Structure: Just as diversification helps investors spread their bets and reduce risk exposure, countries with more diversified economies are less exposed to global macroeconomic shocks than countries that derive their value from one or two industries, or as is often the case from one or two commodities. In a comprehensive study of commodity dependent countries, the United National Conference on Trade and Development (UNCTAD) measures the degree of dependence upon commodities across emerging markets and the figure reports the results.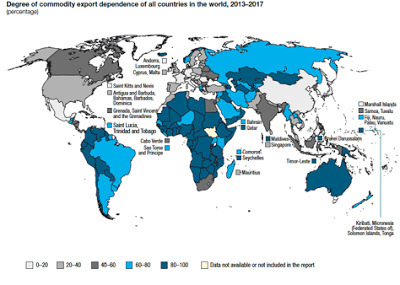 Source: UNCTADNote the disproportional dependence on commodity exports that countries in Africa and Latin America have, making their economies and markets very sensitive to changes in commodity prices.
Measures of Country Risk
To the extent that country risk comes from different sources, you need composite measures of risk to help in decision making. This section begins with a look at country risk scores, where services, using proprietary factors, measure country risk with a number, followed with financial measures of country risk, primarily designed to measure default risk.
Country Risk Scores There are services, ranging from the World Bank to the Economist that measure country risk with scores, though each one uses different criteria and scalars. The PRS Group provides numerical measures of country risk for more than a hundred countries, using twenty variables on three dimensions: political, financial and economic. The scores range from zero to one hundred, with high scores (80-100) indicating low risk and low scores indicating high risk. The figure below captures the June 2019 update, as well as the 10 countries that emerged as safest and riskiest in that update.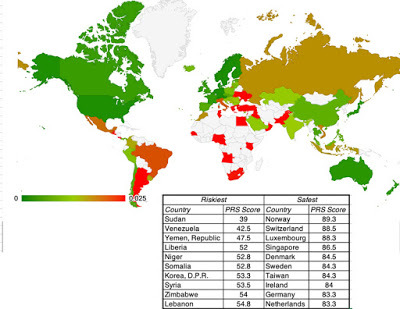 Source: Political Risk Services (PRS)
Default Risk Measures Country risk scores have the benefit of being comprehensive, but they are also difficult to translate into business-friendly metrics. There are country risk measures in markets, albeit focused primarily on default risk, and the most public of these are sovereign ratings, there are now also market based measures, sovereign CDS spreads.
Sovereign Ratings
Moody’s, S&P and Fitch all estimate and publish ratings for countries, ranging from Aaa (AAA) for countries they view has having no default risk to D for countries already in default. The figure below provides a map of sovereign ratings across the world in July 2019, using Moody’s ratings where available and S&P to fill in some gaps. While the sovereign ratings themselves are alphabetical (and thus are difficult to incorporate into financial analysis), they can be converted to default spreads by looking at traded bonds in the market.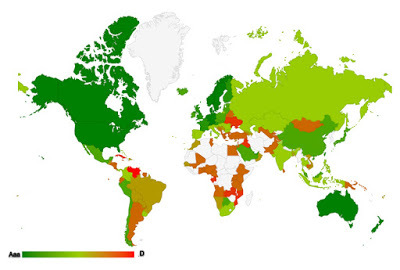 Source: Moody's Sovereign RatingsNote that while the Aaa rated countries (in dark green) are predominantly in North America and Northern Europe, there are shades of green in Asia, reflecting the region's improvement on risk and that much of Africa remains unrated.
Sovereign CDS SpreadsRatings agencies have come under fire, especially since the 2008 crisis, with one of the primary critiques being their perceived bias. I am not being dismissive of that critique, but I believe that their bigger sin is that they are slow to respond to changing fundamentals, causing rating changes to lag real changes on the ground. In the last two decades, a market has risen to fill in the gap, where investors can buy protection against default risk by buying sovereign credit default swaps (CDS). If the insurance against default is complete, the price of a sovereign CDS can be viewed as a default spread for the country. On July 23, 2019, the map below summarizes the sovereign CDS spreads for the 81 countries that they were available for.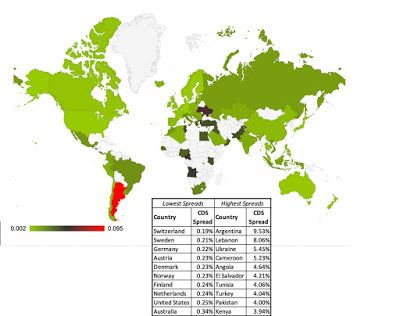 Source: Bloomberg (10-year $ Sovereign Spreads)While these market-set default spreads provide more timely readings of sovereign default risk than the sovereign ratings, they suffer from the standard problems that all market-set numbers are exposed to. They are volatile, affected by momentum and mood and can give misguiding signals on risk.
Equity Risk
While default spreads may represent adequate measures of country risk if you intend to lend to a sovereign or buy bonds issued by it, you are exposed to more and sometimes different risks, if you plan to expand your business into a country, or invest in equities in that country, and you need equity risk premiums that capture that risk. It is true that many practitioners use default spreads as proxies of additional country equity risk and add it to a mature market premium (often a historical US premium) to arrive at country-specific equity risk premiums. As readers of this blog know, I use a mild variation on this approach, replacing the historical equity risk premium with an implied premium for the US and augmenting the default spread by a scaling factor, to reflect the higher risk of equity: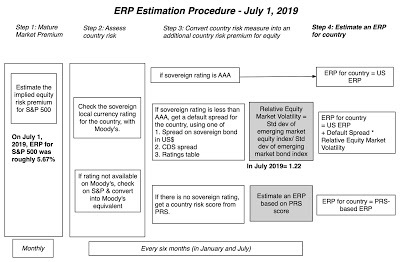
The equity risk premiums that result from this process in July 2019 are reported in the picture below, with the implied equity risk premium of 5.67% for the S&P 500 on July 1, 2019, representing the base number.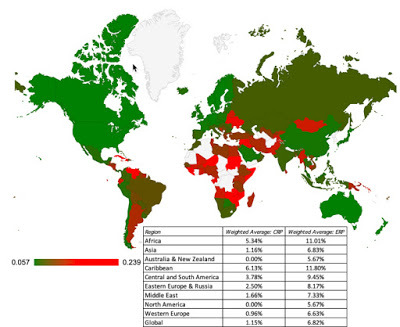 Source: Damodaran Online (Current Data)The picture continues a story that has been building over the last decade. While Africa and Latin America remain hotbeds of country risk, Asia has become safer over time and parts of Southern Europe have regressed.
If you are a developed market company or investor, and believe that risk in Africa, Latin America or parts of Asia don’t apply to you, you may want to think again. The risk exposure of a company does not come from where it is incorporated but from where it does business. Thus, Coca Cola and Royal Dutch may be US and UK-listed companies respectively, but their business models expose them to risk around the world. With Coca Cola, that risk comes primarily from where it sells its products. With Royal Dutch, the risk is derived from where it extracts its oil and gas, making it more exposed to emerging markets than many emerging market companies. By the same token, Vale and Infosys may be Brazil and India-based companies, but there are both global companies that are exposed to risk in the rest of the globe. In addition, when multinationals try to estimate hurdle rates for projects, it should reflect not just the currency you do the analysis in but also the country in which the project will be located. A Royal Dutch refinery investment in Nigeria will have a higher hurdle rate than an otherwise similar refinery investment in the United States. If you find these concepts intriguing, I have my annual update on country risk available for download at this link. Be warned! It may operate as a narcoleptic to those who are sleep deprived.
Conclusion
There was a time a few decades ago when the line between developed and emerging markets was a clear one. On one side were developed markets, with independent central banks, rule-following governments and stable fiscal policies, and on the other side were emerging markets, with unstable and unpredictable political leadership and central banks that did their bidding. The last decade has seen a blurring of lines, as some “developed markets” mimic emerging market behavior and some emerging markets mature. There are some (companies and investors) who have decided that this convergence is a reason to ignore country risk, but I think that they do so at their own peril. Notwithstanding globalization and convergence on some dimensions of risk, we face wide variations in risk across the world, and prudence and good sense demand that we incorporate these differences into our decisions.
YouTube Video
Paper on Country Risk
Country Risk: Determinants, Measures and Implications - The 2019 Edition
Data Links
Measures of Corruption, by Country (Transparency International)Measures of Violence, by Country (Institute for Peace and Economics)International Property Rights Index Commodity Dependence, by country (UNCTAD)Country Risk Scores (PRS Group)Sovereign Ratings, by Country (Moody's, S&P)Sovereign CDS Spreads (10-year) on 7/21/2019Equity Risk Premium, by country (Damodaran Online)<!-- /* Style Definitions */ p.MsoNormal, li.MsoNormal, div.MsoNormal {mso-style-unhide:no; mso-style-qformat:yes; mso-style-parent:""; margin:0in; margin-bottom:.0001pt; mso-pagination:widow-orphan; font-size:12.0pt; font-family:"Calibri",sans-serif; mso-ascii-font-family:Calibri; mso-ascii-theme-font:minor-latin; mso-fareast-font-family:Calibri; mso-fareast-theme-font:minor-latin; mso-hansi-font-family:Calibri; mso-hansi-theme-font:minor-latin; mso-bidi-font-family:"Times New Roman"; mso-bidi-theme-font:minor-bidi;} p.MsoFootnoteText, li.MsoFootnoteText, div.MsoFootnoteText {mso-style-unhide:no; mso-style-link:"Footnote Text Char"; margin:0in; margin-bottom:.0001pt; text-align:justify; text-indent:.25in; mso-pagination:widow-orphan; font-size:10.0pt; mso-bidi-font-size:11.0pt; font-family:"Times New Roman",serif; mso-fareast-font-family:"Times New Roman"; mso-bidi-font-family:"Times New Roman"; mso-bidi-theme-font:minor-bidi;} span.MsoFootnoteReference {mso-style-unhide:no; mso-ansi-font-size:8.0pt; position:relative; top:-3.0pt; mso-text-raise:3.0pt;} a:link, span.MsoHyperlink {mso-style-priority:99; mso-style-unhide:no; color:blue; text-decoration:underline; text-underline:single;} a:visited, span.MsoHyperlinkFollowed {mso-style-noshow:yes; mso-style-priority:99; color:#954F72; mso-themecolor:followedhyperlink; text-decoration:underline; text-underline:single;} p.MsoListParagraph, li.MsoListParagraph, div.MsoListParagraph {mso-style-priority:34; mso-style-unhide:no; mso-style-qformat:yes; margin-top:0in; margin-right:0in; margin-bottom:0in; margin-left:.5in; margin-bottom:.0001pt; mso-add-space:auto; mso-pagination:widow-orphan; font-size:12.0pt; font-family:"Calibri",sans-serif; mso-ascii-font-family:Calibri; mso-ascii-theme-font:minor-latin; mso-fareast-font-family:Calibri; mso-fareast-theme-font:minor-latin; mso-hansi-font-family:Calibri; mso-hansi-theme-font:minor-latin; mso-bidi-font-family:"Times New Roman"; mso-bidi-theme-font:minor-bidi;} p.MsoListParagraphCxSpFirst, li.MsoListParagraphCxSpFirst, div.MsoListParagraphCxSpFirst {mso-style-priority:34; mso-style-unhide:no; mso-style-qformat:yes; mso-style-type:export-only; margin-top:0in; margin-right:0in; margin-bottom:0in; margin-left:.5in; margin-bottom:.0001pt; mso-add-space:auto; mso-pagination:widow-orphan; font-size:12.0pt; font-family:"Calibri",sans-serif; mso-ascii-font-family:Calibri; mso-ascii-theme-font:minor-latin; mso-fareast-font-family:Calibri; mso-fareast-theme-font:minor-latin; mso-hansi-font-family:Calibri; mso-hansi-theme-font:minor-latin; mso-bidi-font-family:"Times New Roman"; mso-bidi-theme-font:minor-bidi;} p.MsoListParagraphCxSpMiddle, li.MsoListParagraphCxSpMiddle, div.MsoListParagraphCxSpMiddle {mso-style-priority:34; mso-style-unhide:no; mso-style-qformat:yes; mso-style-type:export-only; margin-top:0in; margin-right:0in; margin-bottom:0in; margin-left:.5in; margin-bottom:.0001pt; mso-add-space:auto; mso-pagination:widow-orphan; font-size:12.0pt; font-family:"Calibri",sans-serif; mso-ascii-font-family:Calibri; mso-ascii-theme-font:minor-latin; mso-fareast-font-family:Calibri; mso-fareast-theme-font:minor-latin; mso-hansi-font-family:Calibri; mso-hansi-theme-font:minor-latin; mso-bidi-font-family:"Times New Roman"; mso-bidi-theme-font:minor-bidi;} p.MsoListParagraphCxSpLast, li.MsoListParagraphCxSpLast, div.MsoListParagraphCxSpLast {mso-style-priority:34; mso-style-unhide:no; mso-style-qformat:yes; mso-style-type:export-only; margin-top:0in; margin-right:0in; margin-bottom:0in; margin-left:.5in; margin-bottom:.0001pt; mso-add-space:auto; mso-pagination:widow-orphan; font-size:12.0pt; font-family:"Calibri",sans-serif; mso-ascii-font-family:Calibri; mso-ascii-theme-font:minor-latin; mso-fareast-font-family:Calibri; mso-fareast-theme-font:minor-latin; mso-hansi-font-family:Calibri; mso-hansi-theme-font:minor-latin; mso-bidi-font-family:"Times New Roman"; mso-bidi-theme-font:minor-bidi;} span.FootnoteTextChar {mso-style-name:"Footnote Text Char"; mso-style-unhide:no; mso-style-locked:yes; mso-style-link:"Footnote Text"; mso-ansi-font-size:10.0pt; mso-bidi-font-size:11.0pt; font-family:"Times New Roman",serif; mso-ascii-font-family:"Times New Roman"; mso-fareast-font-family:"Times New Roman"; mso-hansi-font-family:"Times New Roman";} .MsoChpDefault {mso-style-type:export-only; mso-default-props:yes; font-family:"Calibri",sans-serif; mso-ascii-font-family:Calibri; mso-ascii-theme-font:minor-latin; mso-fareast-font-family:Calibri; mso-fareast-theme-font:minor-latin; mso-hansi-font-family:Calibri; mso-hansi-theme-font:minor-latin; mso-bidi-font-family:"Times New Roman"; mso-bidi-theme-font:minor-bidi;} /* Page Definitions */ @page {mso-footnote-separator:url("/Users/aswathdamodaran/Library/Group Containers/UBF8T346G9.Office/TemporaryItems/msoh...") fs; mso-footnote-continuation-separator:url("/Users/aswathdamodaran/Library/Group Containers/UBF8T346G9.Office/TemporaryItems/msoh...") fcs; mso-endnote-separator:url("/Users/aswathdamodaran/Library/Group Containers/UBF8T346G9.Office/TemporaryItems/msoh...") es; mso-endnote-continuation-separator:url("/Users/aswathdamodaran/Library/Group Containers/UBF8T346G9.Office/TemporaryItems/msoh...") ecs;} @page WordSection1 {size:8.5in 11.0in; margin:1.0in 1.0in 1.0in 1.0in; mso-header-margin:.5in; mso-footer-margin:.5in; mso-paper-source:0;} div.WordSection1 {page:WordSection1;} /* List Definitions */ @list l0 {mso-list-id:583343042; mso-list-type:hybrid; mso-list-template-ids:1382057134 534643328 67698691 67698693 67698689 67698691 67698693 67698689 67698691 67698693;} @list l0:level1 {mso-level-number-format:bullet; mso-level-text:-; mso-level-tab-stop:none; mso-level-number-position:left; text-indent:-.25in; font-family:"Calibri",sans-serif; mso-fareast-font-family:Calibri; mso-fareast-theme-font:minor-latin;} @list l0:level2 {mso-level-number-format:bullet; mso-level-text:o; mso-level-tab-stop:none; mso-level-number-position:left; text-indent:-.25in; font-family:"Courier New";} @list l0:level3 {mso-level-number-format:bullet; mso-level-text:; mso-level-tab-stop:none; mso-level-number-position:left; text-indent:-.25in; font-family:Wingdings;} @list l0:level4 {mso-level-number-format:bullet; mso-level-text:; mso-level-tab-stop:none; mso-level-number-position:left; text-indent:-.25in; font-family:Symbol;} @list l0:level5 {mso-level-number-format:bullet; mso-level-text:o; mso-level-tab-stop:none; mso-level-number-position:left; text-indent:-.25in; font-family:"Courier New";} @list l0:level6 {mso-level-number-format:bullet; mso-level-text:; mso-level-tab-stop:none; mso-level-number-position:left; text-indent:-.25in; font-family:Wingdings;} @list l0:level7 {mso-level-number-format:bullet; mso-level-text:; mso-level-tab-stop:none; mso-level-number-position:left; text-indent:-.25in; font-family:Symbol;} @list l0:level8 {mso-level-number-format:bullet; mso-level-text:o; mso-level-tab-stop:none; mso-level-number-position:left; text-indent:-.25in; font-family:"Courier New";} @list l0:level9 {mso-level-number-format:bullet; mso-level-text:; mso-level-tab-stop:none; mso-level-number-position:left; text-indent:-.25in; font-family:Wingdings;} @list l1 {mso-list-id:992180830; mso-list-type:hybrid; mso-list-template-ids:67163314 67698713 67698713 67698715 67698703 67698713 67698715 67698703 67698713 67698715;} @list l1:level1 {mso-level-number-format:alpha-lower; mso-level-tab-stop:none; mso-level-number-position:left; text-indent:-.25in;} @list l1:level2 {mso-level-number-format:alpha-lower; mso-level-tab-stop:none; mso-level-number-position:left; text-indent:-.25in;} @list l1:level3 {mso-level-number-format:roman-lower; mso-level-tab-stop:none; mso-level-number-position:right; text-indent:-9.0pt;} @list l1:level4 {mso-level-tab-stop:none; mso-level-number-position:left; text-indent:-.25in;} @list l1:level5 {mso-level-number-format:alpha-lower; mso-level-tab-stop:none; mso-level-number-position:left; text-indent:-.25in;} @list l1:level6 {mso-level-number-format:roman-lower; mso-level-tab-stop:none; mso-level-number-position:right; text-indent:-9.0pt;} @list l1:level7 {mso-level-tab-stop:none; mso-level-number-position:left; text-indent:-.25in;} @list l1:level8 {mso-level-number-format:alpha-lower; mso-level-tab-stop:none; mso-level-number-position:left; text-indent:-.25in;} @list l1:level9 {mso-level-number-format:roman-lower; mso-level-tab-stop:none; mso-level-number-position:right; text-indent:-9.0pt;} @list l2 {mso-list-id:1474448801; mso-list-type:hybrid; mso-list-template-ids:712015588 -2014049558 67698713 67698715 67698703 67698713 67698715 67698703 67698713 67698715;} @list l2:level1 {mso-level-tab-stop:none; mso-level-number-position:left; text-indent:-.25in; mso-ansi-font-size:12.0pt; mso-bidi-font-size:12.0pt; font-family:"Times New Roman",serif; mso-fareast-font-family:"Times New Roman"; mso-font-width:100%;} @list l2:level2 {mso-level-number-format:alpha-lower; mso-level-tab-stop:none; mso-level-number-position:left; text-indent:-.25in;} @list l2:level3 {mso-level-number-format:roman-lower; mso-level-tab-stop:none; mso-level-number-position:right; text-indent:-9.0pt;} @list l2:level4 {mso-level-tab-stop:none; mso-level-number-position:left; text-indent:-.25in;} @list l2:level5 {mso-level-number-format:alpha-lower; mso-level-tab-stop:none; mso-level-number-position:left; text-indent:-.25in;} @list l2:level6 {mso-level-number-format:roman-lower; mso-level-tab-stop:none; mso-level-number-position:right; text-indent:-9.0pt;} @list l2:level7 {mso-level-tab-stop:none; mso-level-number-position:left; text-indent:-.25in;} @list l2:level8 {mso-level-number-format:alpha-lower; mso-level-tab-stop:none; mso-level-number-position:left; text-indent:-.25in;} @list l2:level9 {mso-level-number-format:roman-lower; mso-level-tab-stop:none; mso-level-number-position:right; text-indent:-9.0pt;} @list l3 {mso-list-id:1766536614; mso-list-type:hybrid; mso-list-template-ids:675555888 1797955000 67698713 67698715 67698703 67698713 67698715 67698703 67698713 67698715;} @list l3:level1 {mso-level-start-at:3; mso-level-tab-stop:none; mso-level-number-position:left; margin-left:.75in; text-indent:-.25in; mso-ansi-font-size:12.0pt; mso-bidi-font-size:12.0pt; font-family:"Times New Roman",serif; mso-fareast-font-family:"Times New Roman"; mso-font-width:100%;} @list l3:level2 {mso-level-number-format:alpha-lower; mso-level-tab-stop:none; mso-level-number-position:left; margin-left:1.25in; text-indent:-.25in;} @list l3:level3 {mso-level-number-format:roman-lower; mso-level-tab-stop:none; mso-level-number-position:right; margin-left:1.75in; text-indent:-9.0pt;} @list l3:level4 {mso-level-tab-stop:none; mso-level-number-position:left; margin-left:2.25in; text-indent:-.25in;} @list l3:level5 {mso-level-number-format:alpha-lower; mso-level-tab-stop:none; mso-level-number-position:left; margin-left:2.75in; text-indent:-.25in;} @list l3:level6 {mso-level-number-format:roman-lower; mso-level-tab-stop:none; mso-level-number-position:right; margin-left:3.25in; text-indent:-9.0pt;} @list l3:level7 {mso-level-tab-stop:none; mso-level-number-position:left; margin-left:3.75in; text-indent:-.25in;} @list l3:level8 {mso-level-number-format:alpha-lower; mso-level-tab-stop:none; mso-level-number-position:left; margin-left:4.25in; text-indent:-.25in;} @list l3:level9 {mso-level-number-format:roman-lower; mso-level-tab-stop:none; mso-level-number-position:right; margin-left:4.75in; text-indent:-9.0pt;} </style></div>--></div>
The Sources of Country Risk
When companies invest outside their domestic markets, the most immediate risk that they are exposed to is exchange rate risk, since revenues, profits and cash flows are affected by changing exchange rates. That risk, though, is but a piece of the puzzle, a symptom of economic fundamentals and affected by political crises. Digging deeper, the factors that make some countries riskier than others can be broadly classified into the following groups:
1. Life Cycle: I have used the construct of a corporate life cycle to talk about companies at different stages in the life cycle, and how they differ on cash flow generation and growth potential. It is also generally true that younger companies, deriving more or most of their value from future growth, are riskier than more mature companies, where the bulk of their value coming from investments already made. The same construct can be applied to countries, with emerging economies that are growing rapidly being more exposed to global shocks than mature countries. It should come as no surprise, therefore, that in almost every market crisis over the last decade, emerging markets have paid a much large price in terms of lost economic growth and lower market value than developed markets.
2. Political Risk: If the last few years have taught us a lesson, it is that politics can affect economic and market risk, not just in emerging markets, but also in developed ones. While there are many forms of political risk, ranging from abrupt changes in fiscal and monetary policy to regime change, there are at least two measurable manifestations of this risk in the form of corruption risk and exposure to violence.Corruption Risk: There are parts of the world where the costs of doing business include greasing palms and paying off intermediaries, and the roots lie deep, resisting feel-good quick fixes. While anecdotal stories of corruption and its consequences are plentiful, there are services to try to measure corruption levels across countries. Transparency International, for instance, derives a corruption score, by country, and in its 2019 report, provides a listing of the ten least and most corrupt countries in the world in the figure below, with higher scores indicating less corruption) for 2018.
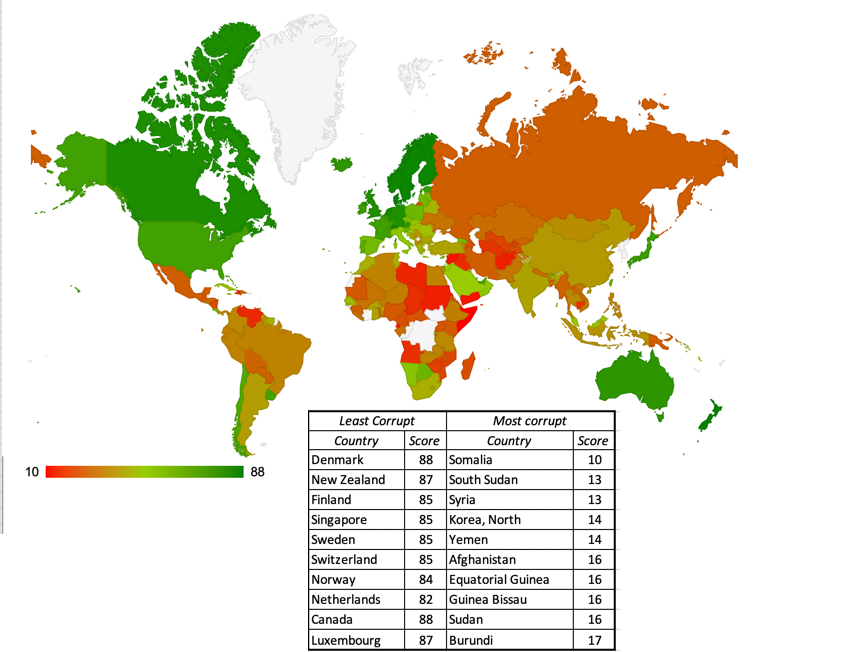 Source: Transparency InternationalThe effect of corruption upon business is insidious, making winners of those most willing to play the bribery game and losers of those who resist. In an earlier post, I argued that corruption creates the equivalent of an informal tax, pushing down after-tax income to companies.Physical Violence: When talking about risk in investing or business, we tend to focus on financial risk, but it is undeniable that adding the threat of physical violence, from war, terrorism or crime, makes it more difficult to operate a business. There are services again that measure exposure to violence in different countries, and while each brings its own biases, the Institute of Economics and Peace has created and reports on a Global Peace Index, measuring exposure to violence, by country.
 Source: Institute of Economics and PeaceThe map summarizes their findings from the most recent year. I must confess that I am surprised to see Botswana at the top of the list, but having never been there, that may be a reflection of my regional biases.3. Legal Risk: A business derives its value from the assets it owns, physical ord intangible, and to continue to derive value, it has to not only preserve its ownership but have a legal system that enforces it’s rights. The quality of this protection varies across countries, either because property rights have fewer protections in some countries or because those rights are not enforced in a timely manner in others. A group of non-government organizations has created an international property rights index, measuring the protection provided for property rights in different countries. The results in 2018, by region, are provided in the table below:
4. Economic Structure: Just as diversification helps investors spread their bets and reduce risk exposure, countries with more diversified economies are less exposed to global macroeconomic shocks than countries that derive their value from one or two industries, or as is often the case from one or two commodities. In a comprehensive study of commodity dependent countries, the United National Conference on Trade and Development (UNCTAD) measures the degree of dependence upon commodities across emerging markets and the figure reports the results.
 Source: UNCTADNote the disproportional dependence on commodity exports that countries in Africa and Latin America have, making their economies and markets very sensitive to changes in commodity prices.
Measures of Country Risk
To the extent that country risk comes from different sources, you need composite measures of risk to help in decision making. This section begins with a look at country risk scores, where services, using proprietary factors, measure country risk with a number, followed with financial measures of country risk, primarily designed to measure default risk.
Country Risk Scores There are services, ranging from the World Bank to the Economist that measure country risk with scores, though each one uses different criteria and scalars. The PRS Group provides numerical measures of country risk for more than a hundred countries, using twenty variables on three dimensions: political, financial and economic. The scores range from zero to one hundred, with high scores (80-100) indicating low risk and low scores indicating high risk. The figure below captures the June 2019 update, as well as the 10 countries that emerged as safest and riskiest in that update.
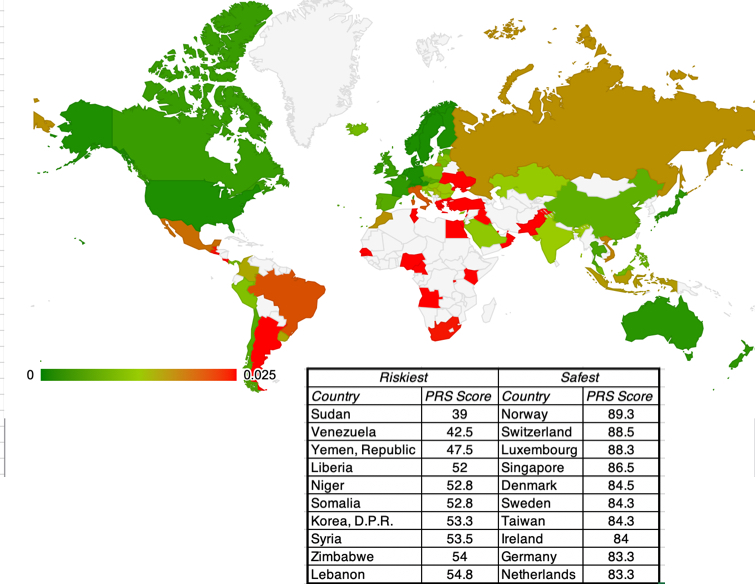 Source: Political Risk Services (PRS)
Default Risk Measures Country risk scores have the benefit of being comprehensive, but they are also difficult to translate into business-friendly metrics. There are country risk measures in markets, albeit focused primarily on default risk, and the most public of these are sovereign ratings, there are now also market based measures, sovereign CDS spreads.
Sovereign Ratings
Moody’s, S&P and Fitch all estimate and publish ratings for countries, ranging from Aaa (AAA) for countries they view has having no default risk to D for countries already in default. The figure below provides a map of sovereign ratings across the world in July 2019, using Moody’s ratings where available and S&P to fill in some gaps. While the sovereign ratings themselves are alphabetical (and thus are difficult to incorporate into financial analysis), they can be converted to default spreads by looking at traded bonds in the market.
 Source: Moody's Sovereign RatingsNote that while the Aaa rated countries (in dark green) are predominantly in North America and Northern Europe, there are shades of green in Asia, reflecting the region's improvement on risk and that much of Africa remains unrated.
Sovereign CDS SpreadsRatings agencies have come under fire, especially since the 2008 crisis, with one of the primary critiques being their perceived bias. I am not being dismissive of that critique, but I believe that their bigger sin is that they are slow to respond to changing fundamentals, causing rating changes to lag real changes on the ground. In the last two decades, a market has risen to fill in the gap, where investors can buy protection against default risk by buying sovereign credit default swaps (CDS). If the insurance against default is complete, the price of a sovereign CDS can be viewed as a default spread for the country. On July 23, 2019, the map below summarizes the sovereign CDS spreads for the 81 countries that they were available for.
 Source: Bloomberg (10-year $ Sovereign Spreads)While these market-set default spreads provide more timely readings of sovereign default risk than the sovereign ratings, they suffer from the standard problems that all market-set numbers are exposed to. They are volatile, affected by momentum and mood and can give misguiding signals on risk.
Equity Risk
While default spreads may represent adequate measures of country risk if you intend to lend to a sovereign or buy bonds issued by it, you are exposed to more and sometimes different risks, if you plan to expand your business into a country, or invest in equities in that country, and you need equity risk premiums that capture that risk. It is true that many practitioners use default spreads as proxies of additional country equity risk and add it to a mature market premium (often a historical US premium) to arrive at country-specific equity risk premiums. As readers of this blog know, I use a mild variation on this approach, replacing the historical equity risk premium with an implied premium for the US and augmenting the default spread by a scaling factor, to reflect the higher risk of equity:

The equity risk premiums that result from this process in July 2019 are reported in the picture below, with the implied equity risk premium of 5.67% for the S&P 500 on July 1, 2019, representing the base number.
 Source: Damodaran Online (Current Data)The picture continues a story that has been building over the last decade. While Africa and Latin America remain hotbeds of country risk, Asia has become safer over time and parts of Southern Europe have regressed.
 If you are a developed market company or investor, and believe that risk in Africa, Latin America or parts of Asia don’t apply to you, you may want to think again. The risk exposure of a company does not come from where it is incorporated but from where it does business. Thus, Coca Cola and Royal Dutch may be US and UK-listed companies respectively, but their business models expose them to risk around the world. With Coca Cola, that risk comes primarily from where it sells its products. With Royal Dutch, the risk is derived from where it extracts its oil and gas, making it more exposed to emerging markets than many emerging market companies. By the same token, Vale and Infosys may be Brazil and India-based companies, but there are both global companies that are exposed to risk in the rest of the globe. In addition, when multinationals try to estimate hurdle rates for projects, it should reflect not just the currency you do the analysis in but also the country in which the project will be located. A Royal Dutch refinery investment in Nigeria will have a higher hurdle rate than an otherwise similar refinery investment in the United States. If you find these concepts intriguing, I have my annual update on country risk available for download at this link. Be warned! It may operate as a narcoleptic to those who are sleep deprived.
Conclusion
There was a time a few decades ago when the line between developed and emerging markets was a clear one. On one side were developed markets, with independent central banks, rule-following governments and stable fiscal policies, and on the other side were emerging markets, with unstable and unpredictable political leadership and central banks that did their bidding. The last decade has seen a blurring of lines, as some “developed markets” mimic emerging market behavior and some emerging markets mature. There are some (companies and investors) who have decided that this convergence is a reason to ignore country risk, but I think that they do so at their own peril. Notwithstanding globalization and convergence on some dimensions of risk, we face wide variations in risk across the world, and prudence and good sense demand that we incorporate these differences into our decisions.
YouTube Video
Paper on Country Risk
Country Risk: Determinants, Measures and Implications - The 2019 Edition
Data Links
Measures of Corruption, by Country (Transparency International)Measures of Violence, by Country (Institute for Peace and Economics)International Property Rights Index Commodity Dependence, by country (UNCTAD)Country Risk Scores (PRS Group)Sovereign Ratings, by Country (Moody's, S&P)Sovereign CDS Spreads (10-year) on 7/21/2019Equity Risk Premium, by country (Damodaran Online)<!-- /* Style Definitions */ p.MsoNormal, li.MsoNormal, div.MsoNormal {mso-style-unhide:no; mso-style-qformat:yes; mso-style-parent:""; margin:0in; margin-bottom:.0001pt; mso-pagination:widow-orphan; font-size:12.0pt; font-family:"Calibri",sans-serif; mso-ascii-font-family:Calibri; mso-ascii-theme-font:minor-latin; mso-fareast-font-family:Calibri; mso-fareast-theme-font:minor-latin; mso-hansi-font-family:Calibri; mso-hansi-theme-font:minor-latin; mso-bidi-font-family:"Times New Roman"; mso-bidi-theme-font:minor-bidi;} p.MsoFootnoteText, li.MsoFootnoteText, div.MsoFootnoteText {mso-style-unhide:no; mso-style-link:"Footnote Text Char"; margin:0in; margin-bottom:.0001pt; text-align:justify; text-indent:.25in; mso-pagination:widow-orphan; font-size:10.0pt; mso-bidi-font-size:11.0pt; font-family:"Times New Roman",serif; mso-fareast-font-family:"Times New Roman"; mso-bidi-font-family:"Times New Roman"; mso-bidi-theme-font:minor-bidi;} span.MsoFootnoteReference {mso-style-unhide:no; mso-ansi-font-size:8.0pt; position:relative; top:-3.0pt; mso-text-raise:3.0pt;} a:link, span.MsoHyperlink {mso-style-priority:99; mso-style-unhide:no; color:blue; text-decoration:underline; text-underline:single;} a:visited, span.MsoHyperlinkFollowed {mso-style-noshow:yes; mso-style-priority:99; color:#954F72; mso-themecolor:followedhyperlink; text-decoration:underline; text-underline:single;} p.MsoListParagraph, li.MsoListParagraph, div.MsoListParagraph {mso-style-priority:34; mso-style-unhide:no; mso-style-qformat:yes; margin-top:0in; margin-right:0in; margin-bottom:0in; margin-left:.5in; margin-bottom:.0001pt; mso-add-space:auto; mso-pagination:widow-orphan; font-size:12.0pt; font-family:"Calibri",sans-serif; mso-ascii-font-family:Calibri; mso-ascii-theme-font:minor-latin; mso-fareast-font-family:Calibri; mso-fareast-theme-font:minor-latin; mso-hansi-font-family:Calibri; mso-hansi-theme-font:minor-latin; mso-bidi-font-family:"Times New Roman"; mso-bidi-theme-font:minor-bidi;} p.MsoListParagraphCxSpFirst, li.MsoListParagraphCxSpFirst, div.MsoListParagraphCxSpFirst {mso-style-priority:34; mso-style-unhide:no; mso-style-qformat:yes; mso-style-type:export-only; margin-top:0in; margin-right:0in; margin-bottom:0in; margin-left:.5in; margin-bottom:.0001pt; mso-add-space:auto; mso-pagination:widow-orphan; font-size:12.0pt; font-family:"Calibri",sans-serif; mso-ascii-font-family:Calibri; mso-ascii-theme-font:minor-latin; mso-fareast-font-family:Calibri; mso-fareast-theme-font:minor-latin; mso-hansi-font-family:Calibri; mso-hansi-theme-font:minor-latin; mso-bidi-font-family:"Times New Roman"; mso-bidi-theme-font:minor-bidi;} p.MsoListParagraphCxSpMiddle, li.MsoListParagraphCxSpMiddle, div.MsoListParagraphCxSpMiddle {mso-style-priority:34; mso-style-unhide:no; mso-style-qformat:yes; mso-style-type:export-only; margin-top:0in; margin-right:0in; margin-bottom:0in; margin-left:.5in; margin-bottom:.0001pt; mso-add-space:auto; mso-pagination:widow-orphan; font-size:12.0pt; font-family:"Calibri",sans-serif; mso-ascii-font-family:Calibri; mso-ascii-theme-font:minor-latin; mso-fareast-font-family:Calibri; mso-fareast-theme-font:minor-latin; mso-hansi-font-family:Calibri; mso-hansi-theme-font:minor-latin; mso-bidi-font-family:"Times New Roman"; mso-bidi-theme-font:minor-bidi;} p.MsoListParagraphCxSpLast, li.MsoListParagraphCxSpLast, div.MsoListParagraphCxSpLast {mso-style-priority:34; mso-style-unhide:no; mso-style-qformat:yes; mso-style-type:export-only; margin-top:0in; margin-right:0in; margin-bottom:0in; margin-left:.5in; margin-bottom:.0001pt; mso-add-space:auto; mso-pagination:widow-orphan; font-size:12.0pt; font-family:"Calibri",sans-serif; mso-ascii-font-family:Calibri; mso-ascii-theme-font:minor-latin; mso-fareast-font-family:Calibri; mso-fareast-theme-font:minor-latin; mso-hansi-font-family:Calibri; mso-hansi-theme-font:minor-latin; mso-bidi-font-family:"Times New Roman"; mso-bidi-theme-font:minor-bidi;} span.FootnoteTextChar {mso-style-name:"Footnote Text Char"; mso-style-unhide:no; mso-style-locked:yes; mso-style-link:"Footnote Text"; mso-ansi-font-size:10.0pt; mso-bidi-font-size:11.0pt; font-family:"Times New Roman",serif; mso-ascii-font-family:"Times New Roman"; mso-fareast-font-family:"Times New Roman"; mso-hansi-font-family:"Times New Roman";} .MsoChpDefault {mso-style-type:export-only; mso-default-props:yes; font-family:"Calibri",sans-serif; mso-ascii-font-family:Calibri; mso-ascii-theme-font:minor-latin; mso-fareast-font-family:Calibri; mso-fareast-theme-font:minor-latin; mso-hansi-font-family:Calibri; mso-hansi-theme-font:minor-latin; mso-bidi-font-family:"Times New Roman"; mso-bidi-theme-font:minor-bidi;} /* Page Definitions */ @page {mso-footnote-separator:url("/Users/aswathdamodaran/Library/Group Containers/UBF8T346G9.Office/TemporaryItems/msoh...") fs; mso-footnote-continuation-separator:url("/Users/aswathdamodaran/Library/Group Containers/UBF8T346G9.Office/TemporaryItems/msoh...") fcs; mso-endnote-separator:url("/Users/aswathdamodaran/Library/Group Containers/UBF8T346G9.Office/TemporaryItems/msoh...") es; mso-endnote-continuation-separator:url("/Users/aswathdamodaran/Library/Group Containers/UBF8T346G9.Office/TemporaryItems/msoh...") ecs;} @page WordSection1 {size:8.5in 11.0in; margin:1.0in 1.0in 1.0in 1.0in; mso-header-margin:.5in; mso-footer-margin:.5in; mso-paper-source:0;} div.WordSection1 {page:WordSection1;} /* List Definitions */ @list l0 {mso-list-id:583343042; mso-list-type:hybrid; mso-list-template-ids:1382057134 534643328 67698691 67698693 67698689 67698691 67698693 67698689 67698691 67698693;} @list l0:level1 {mso-level-number-format:bullet; mso-level-text:-; mso-level-tab-stop:none; mso-level-number-position:left; text-indent:-.25in; font-family:"Calibri",sans-serif; mso-fareast-font-family:Calibri; mso-fareast-theme-font:minor-latin;} @list l0:level2 {mso-level-number-format:bullet; mso-level-text:o; mso-level-tab-stop:none; mso-level-number-position:left; text-indent:-.25in; font-family:"Courier New";} @list l0:level3 {mso-level-number-format:bullet; mso-level-text:; mso-level-tab-stop:none; mso-level-number-position:left; text-indent:-.25in; font-family:Wingdings;} @list l0:level4 {mso-level-number-format:bullet; mso-level-text:; mso-level-tab-stop:none; mso-level-number-position:left; text-indent:-.25in; font-family:Symbol;} @list l0:level5 {mso-level-number-format:bullet; mso-level-text:o; mso-level-tab-stop:none; mso-level-number-position:left; text-indent:-.25in; font-family:"Courier New";} @list l0:level6 {mso-level-number-format:bullet; mso-level-text:; mso-level-tab-stop:none; mso-level-number-position:left; text-indent:-.25in; font-family:Wingdings;} @list l0:level7 {mso-level-number-format:bullet; mso-level-text:; mso-level-tab-stop:none; mso-level-number-position:left; text-indent:-.25in; font-family:Symbol;} @list l0:level8 {mso-level-number-format:bullet; mso-level-text:o; mso-level-tab-stop:none; mso-level-number-position:left; text-indent:-.25in; font-family:"Courier New";} @list l0:level9 {mso-level-number-format:bullet; mso-level-text:; mso-level-tab-stop:none; mso-level-number-position:left; text-indent:-.25in; font-family:Wingdings;} @list l1 {mso-list-id:992180830; mso-list-type:hybrid; mso-list-template-ids:67163314 67698713 67698713 67698715 67698703 67698713 67698715 67698703 67698713 67698715;} @list l1:level1 {mso-level-number-format:alpha-lower; mso-level-tab-stop:none; mso-level-number-position:left; text-indent:-.25in;} @list l1:level2 {mso-level-number-format:alpha-lower; mso-level-tab-stop:none; mso-level-number-position:left; text-indent:-.25in;} @list l1:level3 {mso-level-number-format:roman-lower; mso-level-tab-stop:none; mso-level-number-position:right; text-indent:-9.0pt;} @list l1:level4 {mso-level-tab-stop:none; mso-level-number-position:left; text-indent:-.25in;} @list l1:level5 {mso-level-number-format:alpha-lower; mso-level-tab-stop:none; mso-level-number-position:left; text-indent:-.25in;} @list l1:level6 {mso-level-number-format:roman-lower; mso-level-tab-stop:none; mso-level-number-position:right; text-indent:-9.0pt;} @list l1:level7 {mso-level-tab-stop:none; mso-level-number-position:left; text-indent:-.25in;} @list l1:level8 {mso-level-number-format:alpha-lower; mso-level-tab-stop:none; mso-level-number-position:left; text-indent:-.25in;} @list l1:level9 {mso-level-number-format:roman-lower; mso-level-tab-stop:none; mso-level-number-position:right; text-indent:-9.0pt;} @list l2 {mso-list-id:1474448801; mso-list-type:hybrid; mso-list-template-ids:712015588 -2014049558 67698713 67698715 67698703 67698713 67698715 67698703 67698713 67698715;} @list l2:level1 {mso-level-tab-stop:none; mso-level-number-position:left; text-indent:-.25in; mso-ansi-font-size:12.0pt; mso-bidi-font-size:12.0pt; font-family:"Times New Roman",serif; mso-fareast-font-family:"Times New Roman"; mso-font-width:100%;} @list l2:level2 {mso-level-number-format:alpha-lower; mso-level-tab-stop:none; mso-level-number-position:left; text-indent:-.25in;} @list l2:level3 {mso-level-number-format:roman-lower; mso-level-tab-stop:none; mso-level-number-position:right; text-indent:-9.0pt;} @list l2:level4 {mso-level-tab-stop:none; mso-level-number-position:left; text-indent:-.25in;} @list l2:level5 {mso-level-number-format:alpha-lower; mso-level-tab-stop:none; mso-level-number-position:left; text-indent:-.25in;} @list l2:level6 {mso-level-number-format:roman-lower; mso-level-tab-stop:none; mso-level-number-position:right; text-indent:-9.0pt;} @list l2:level7 {mso-level-tab-stop:none; mso-level-number-position:left; text-indent:-.25in;} @list l2:level8 {mso-level-number-format:alpha-lower; mso-level-tab-stop:none; mso-level-number-position:left; text-indent:-.25in;} @list l2:level9 {mso-level-number-format:roman-lower; mso-level-tab-stop:none; mso-level-number-position:right; text-indent:-9.0pt;} @list l3 {mso-list-id:1766536614; mso-list-type:hybrid; mso-list-template-ids:675555888 1797955000 67698713 67698715 67698703 67698713 67698715 67698703 67698713 67698715;} @list l3:level1 {mso-level-start-at:3; mso-level-tab-stop:none; mso-level-number-position:left; margin-left:.75in; text-indent:-.25in; mso-ansi-font-size:12.0pt; mso-bidi-font-size:12.0pt; font-family:"Times New Roman",serif; mso-fareast-font-family:"Times New Roman"; mso-font-width:100%;} @list l3:level2 {mso-level-number-format:alpha-lower; mso-level-tab-stop:none; mso-level-number-position:left; margin-left:1.25in; text-indent:-.25in;} @list l3:level3 {mso-level-number-format:roman-lower; mso-level-tab-stop:none; mso-level-number-position:right; margin-left:1.75in; text-indent:-9.0pt;} @list l3:level4 {mso-level-tab-stop:none; mso-level-number-position:left; margin-left:2.25in; text-indent:-.25in;} @list l3:level5 {mso-level-number-format:alpha-lower; mso-level-tab-stop:none; mso-level-number-position:left; margin-left:2.75in; text-indent:-.25in;} @list l3:level6 {mso-level-number-format:roman-lower; mso-level-tab-stop:none; mso-level-number-position:right; margin-left:3.25in; text-indent:-9.0pt;} @list l3:level7 {mso-level-tab-stop:none; mso-level-number-position:left; margin-left:3.75in; text-indent:-.25in;} @list l3:level8 {mso-level-number-format:alpha-lower; mso-level-tab-stop:none; mso-level-number-position:left; margin-left:4.25in; text-indent:-.25in;} @list l3:level9 {mso-level-number-format:roman-lower; mso-level-tab-stop:none; mso-level-number-position:right; margin-left:4.75in; text-indent:-9.0pt;} </style></div>--></div>
June 12, 2019
Meatless Future or Vegan Delusions? The Beyond Meat Valuation
In a big year for initial public offerings (IPOs), with Uber, Lyft, Pinterest and Zoom, to name just a few, already having gone public and more companies waiting in the wings, it is ironic that it is not a tech company, but a food company, Beyond Meat, that has managed to deliver the most dazzling post-IPO performance of any of the listings. As the stock increased seven-fold, investors who were able to get into the stock at the offering price have been enriched, but those who jumped on the bandwagon later have also reaped extraordinary returns. The speed and magnitude of the stock price rise has left many wondering whether investors have over reached and whether a correction is around the corner.
The Meatless Meat Company!The Company: Let's take a look at what Beyond Meat's products are and the market opening it is exploiting, before diving into a story and valuation for the company. The company, headquartered in Southern California, and founded in 2009, makes makes plant-based (pea protein) products that mimic burgers and ground meat in taste, texture and aroma. In the prospectus that it filed leading up to its IPO, the company argues that its production process is revolutionary and new, and is responsible for its capacity to replicate animal-based meats.
The Competitors: While Beyond Meat is a leader right now in the specialized sub-category of meatless meats, it faces a formidable competitor in Impossible Foods, another young start-up producing its own plant-based versions of meat-like products. Since it is very likely, especially after Beyond Meat's explosive market debut, that Impossible Foods will be going public soon, it is inevitable that there will be comparisons between the two companies. While I have done my own taste test, taste is in the mouth of the beholder, and this article perhaps has the most even-handed comparison of the two companies' products. Both companies have also adopted similar strategies of enlisting fast-food companies as product adopters, with Impossible Foods showing up on Burger King (Impossible Whopper) and White Castle menus, and Beyond Meat countering with TGI Friday's, Carl's Jr. and Red Robin. Other companies are taking note, including companies like Amy's Kitchen, a long standing producer of organic and vegan offerings, and companies like Tyson Foods and Perdue that derive the bulk of their revenues from meat, but see opportunity in this new market.
The Drivers: Both Beyond Meat and Impossible Foods have been helped by a shift away from meat to meatless alternatives, and that trend has been driven by three factors:Health: While the research on the health consequences of eating meat continues, it has become part of conventional wisdom that meat-based diets (and red meat in particular) are associated with a greater risk of cardiovascular disease and cancer. This link provides a fairly balanced account of whether this belief is true, but for better or worse, it has led some meat eaters to cut back and sometimes top consuming meat. Environment: As climate change and environmental concerns rise to the top of concerns for some, they are feeling the pressure to shift away from meat, in general, and beef, in particular, because of its environmental footprint. I am not an environmental scold, but I don't think that there is any debate that meat-based diets puts a greater pressure on the environment Taste: Until recently, shifting away from a meat-based diet also meant giving up the taste and texture of meat, since most meat substitutes did not come close. As companies like Beyond Meat and Impossible Foods are showing, plant-based alternatives are getting better at mimicking real meat, and for those who are attached to the texture and taste of meat, that is making a difference in their diet decisions.None of these three factors are likely to fade away. In fact, I think that we can safely assume that they will only get stronger over time, accelerating the shift from meat to meatless alternatives.
Market SizingAll of the talk about the shift to vegan and vegetarian diets can sometimes obscure two basic facts about this market and its underlying trends:The meatless meat market is still small, relative to the overall meat market: In 2018, the meatless meat market had sales of $1-$5 billion, depending on how broadly you define meatless markets and the geographies that you look at. Defined as meatless meats, i.e., the products that Beyond Meat and Impossible Foods offer, it is closer to the lower end of the range, but inclusive of other meat alternatives (tofu, tempeh etc.) is at the upper end. No matter which end of the range you go with, it is small relative to the overall meat market that is in excess of $250 billion, just in the US, and closer to a trillion, if you expand it globally, in 2018. In fact, while the meat market has seen slow growth in the US and Europe, with a shift from beef to chicken, the global meat market has been growing, as increasing affluence in Asia, in general, and China, in particular, has increased meat consumption, Depending on your perspective on Beyond Meats, that can be bad news or good news, since it can be taken by detractors as a sign that the overall market for meatless meats is not very big and by optimists that there is plenty of room to grow.It is still a niche market: Meatless meat products have made their deepest inroads in urban and affluent populations and its allure is greatest with former meat-eaters rather than lifelong vegetarians, who don't crave either the taste or texture of meat. The plus is that this market has significant buying power, but the minus is that urban, well-to-do millennials can eat only so much. The big question that we face is in estimating how much the shift towards vegan and vegetarian diets will continue, driven by health reasons or environmental concern (or guilt). There is also a question of whether some governments may accelerate the shift away from meat-based diets, with policies and subsidies. Given this uncertainty, it is not surprising that the forecasts for the size of the meatless meat market vary widely across forecasters. While they all agree that the market will grow, they disagree about the end number, with forecasts for 2023 ranging from $5 billion at the low end to $8 billion at the other extreme. Beyond Meat, in its prospectus, uses the expansion of non-dairy milk(soy, flax, almond mild) in the milk market as its basis, to estimate the market for meatless meat to be $35 billion in the long term.
Beyond Meat: Story and ValuationHistory: At the time of its public offering, Beyond Meat had all of the characteristics of a young company, not much separated from its start up days, with revenues of $87.9 million, operating losses of $26.5 million and a common equity of -$121.8 million. Its first earnings report, delivered to a rapturous market response, reported a tripling of revenues and a narrowing of operating losses, but even with it incorporated, the company remains a small, money losing company.
The Story: To value young companies, I first have to put my optimist hat on, and with it firmly in place, my story for Beyond Meat is that it is catching the front end of a significant shift towards vegan and vegetarian-based diets. The key parts of my story are below:Total market for meatless meats will grow significantly: I see the total market for meatless meats growing from just over $1 billion in 2018 to $12 billion by 2028. While that is less than the $35 billion that Beyond Meat's back-of-the-envelope estimate delivers, it is closer to the upper end of the range of forecasts that you have for this market.With Beyond Meat capturing a significant market share: As the market grows, the number of players will increase, but I see Beyond Meats capturing a 25% market share of this market, building on its early entry into the market and brand name recognition, partly from its fast food connections.While delivering operating profits similar to the large US food processing companies: Over the next five years, I see pre-tax operating margins improving towards the 13.22% that US food processing business delivered in 2018, built largely on economies of scale and pricing power. And reinvesting a lot less, in delivering that growth: While Beyond Meat generates about a dollar in revenue per dollar in invested capital right now, I will assume that it will be able to use technology as its ally to invest more efficiently in the future. Specifically, I will assume that the company will generate $3 in revenue for every dollar in invested capital, about double what the typical US food processing company is able to generate.Is there risk in this investment? Absolutely, and you may be surprised that my cost of capital is only 7.46%, but that reflects my assessment of risk in this investment, as a going concern and as part of a diversified portfolio. As a money-losing company that will require about $500 million in capital over the next four years to deliver on its potential, there remains a significant chance of failure, and I estimate the probability of failure to be 15%.
The Valuation: With the story in place, the valuation follows and the picture below captures the ingredients of value: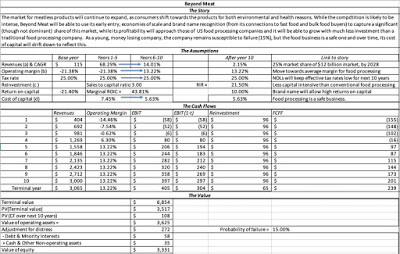 Download spreadsheetWith my story, which I believe reflects an upbeat story for the company, the value that I obtain for its equity is $3.3 billion, yielding a value per share of about $47. At the end of June 10, when I completed my valuation, the stock price was close to $170, well above my estimated value. What the stock dropped almost $41 on June 11 to $127/share, it still remained over valued.
What if? As with any young company, the value of Beyond Meat is driven almost entirely by the story you tell about the company, and in this case, that story revolves around two key inputs. The first is the revenue that you believe the company can generate, once mature, and that reflects how big you think the market for meatless meats will get and Beyond Meat's market share of the market. The second is its profitability at that point, which is a function of how much pricing power you believe the company will have. While I have assumed that Beyond Meat will deliver about $3 billion in revenues in 2028, with an operating margin of 13.22%, your story for the company can lead you to very different estimates for one or both numbers: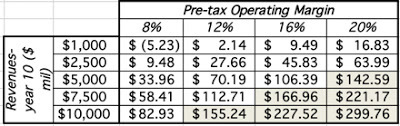 The shaded cells represent break even points, where you could justify buying Beyond Meat at the price ($127) it was trading at on June 11, 2019. Put differently, if your story for the meatless meat market and Beyond Meat's place in it leads you to revenues of $5 billion or higher with an operating margin of 20%, you should be a value investor in the company.
Macro Bets and Micro ValueAs you can see from the what-if analysis on Beyond Meat's value, the value that you obtain for Beyond Meat is determined mostly by how large you believe that market for meatless meats will end up being. In fact, there are some investors whose primary reason for investing in Beyond Meat is as a bet on a macro trend towards vegan and vegetarian diets. That said, it is worth remembering that investors don't get pay offs from making the right macro bets, but from the micro vehicles (individual investments) that they use as proxies for those bets. To get the pay off from a correct macro call, there are two additional assessments that investors have to make:Industry structure: A growing market may not translate into high value businesses, if it is crowded and intensely competitive. That market will deliver high revenue growth, but with low or no profitability, and no pathway to sustainable profits and value added. In contrast, a growing market where there are significant barriers to entry and a few big winners can result in high-value companies with large market share and unscalable moats. Winners and Losers: Assuming that there is potential for value creation in a market, investors have to pick the companies that are most likely to win in that market. That is difficult to do, when you are looking at young companies in a young market, but there is no way around making that judgment. In a post from 2015, I argued that in big (or potentially big) markets, you can expect companies to be collectively over valued early in the game. In my Beyond Meat valuation, I have implicitly made assumptions about both these components, by first allowing operating margins to converge on those of large food processing companies and then making Beyond Meat one of the winners in the meatless meat market, by giving it a 25% market share. My defense of these assumptions is simple. I believe that the meatless meat market will evolve like the broader food business, with a few big players dominating, with similar competitive advantages including brand name, economies of scale and access to distribution systems. I also believe that Beyond Meat and Impossible Foods, as front runners in this market, will use their access to capital to scale up quickly. Their use of fast food chains feeds into this strategy, with bulk sales increasing revenues quickly, allowing for economies of scale, and name-brand offerings (Impossible Whopper at Burger Kind, Beyond Famous Star burger at Carl's Jr.) helping improve brand name recognition. I will undoubtedly have to revisit these assumptions as the market evolves and some of you may disagree with me strongly on one or both assumptions. If so, please do download the spreadsheet and make your best judgments to derive your value for the company.
A Trading PlayEarly in a company's life, it is the pricing game that dominates and it is futile to use fundamentals to try to explain a stock price or day-to-day changes. This table, from one of my presentations on corporate life cycles, illustrates how investors and trades view companies as they move through the life cycle.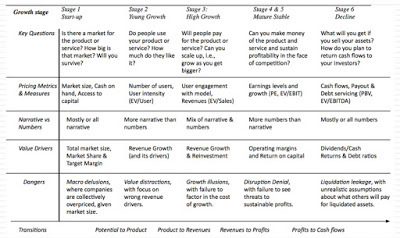
For a young company like Beyond Meat, making the transition from start-up to young growth, it is all pricing all the time, with stories about market size driving the pricing,. This trading phenomenon is exacerbated by the fact that it is one of the few pure plays on a macro trend, i.e., a shift in diets away from meat to plant-based options. That leads me to two conclusions. The first is an unexceptional one and it is that you will see wide swings in the stock price on a day to day basis, for little or no reason. That is a feature of priced stocks, not a bug, as mood and momentum shift for no perceptible reasons. The second is that selling short on a stock like this one (small, with a small float) is a dangerous game, since you are unlikely to have time as your ally, and while you may be right in the long term, you may bankrupt yourself before you are vindicated.
YouTube Video
LinksBeyond Meat: Prospectus for IPOValuation of Beyond Meat (June 2019)Past PostsBig Markets, Over Confidence and the Big Market Delusion (August 2015)
The Meatless Meat Company!The Company: Let's take a look at what Beyond Meat's products are and the market opening it is exploiting, before diving into a story and valuation for the company. The company, headquartered in Southern California, and founded in 2009, makes makes plant-based (pea protein) products that mimic burgers and ground meat in taste, texture and aroma. In the prospectus that it filed leading up to its IPO, the company argues that its production process is revolutionary and new, and is responsible for its capacity to replicate animal-based meats.
The Competitors: While Beyond Meat is a leader right now in the specialized sub-category of meatless meats, it faces a formidable competitor in Impossible Foods, another young start-up producing its own plant-based versions of meat-like products. Since it is very likely, especially after Beyond Meat's explosive market debut, that Impossible Foods will be going public soon, it is inevitable that there will be comparisons between the two companies. While I have done my own taste test, taste is in the mouth of the beholder, and this article perhaps has the most even-handed comparison of the two companies' products. Both companies have also adopted similar strategies of enlisting fast-food companies as product adopters, with Impossible Foods showing up on Burger King (Impossible Whopper) and White Castle menus, and Beyond Meat countering with TGI Friday's, Carl's Jr. and Red Robin. Other companies are taking note, including companies like Amy's Kitchen, a long standing producer of organic and vegan offerings, and companies like Tyson Foods and Perdue that derive the bulk of their revenues from meat, but see opportunity in this new market.
The Drivers: Both Beyond Meat and Impossible Foods have been helped by a shift away from meat to meatless alternatives, and that trend has been driven by three factors:Health: While the research on the health consequences of eating meat continues, it has become part of conventional wisdom that meat-based diets (and red meat in particular) are associated with a greater risk of cardiovascular disease and cancer. This link provides a fairly balanced account of whether this belief is true, but for better or worse, it has led some meat eaters to cut back and sometimes top consuming meat. Environment: As climate change and environmental concerns rise to the top of concerns for some, they are feeling the pressure to shift away from meat, in general, and beef, in particular, because of its environmental footprint. I am not an environmental scold, but I don't think that there is any debate that meat-based diets puts a greater pressure on the environment Taste: Until recently, shifting away from a meat-based diet also meant giving up the taste and texture of meat, since most meat substitutes did not come close. As companies like Beyond Meat and Impossible Foods are showing, plant-based alternatives are getting better at mimicking real meat, and for those who are attached to the texture and taste of meat, that is making a difference in their diet decisions.None of these three factors are likely to fade away. In fact, I think that we can safely assume that they will only get stronger over time, accelerating the shift from meat to meatless alternatives.
Market SizingAll of the talk about the shift to vegan and vegetarian diets can sometimes obscure two basic facts about this market and its underlying trends:The meatless meat market is still small, relative to the overall meat market: In 2018, the meatless meat market had sales of $1-$5 billion, depending on how broadly you define meatless markets and the geographies that you look at. Defined as meatless meats, i.e., the products that Beyond Meat and Impossible Foods offer, it is closer to the lower end of the range, but inclusive of other meat alternatives (tofu, tempeh etc.) is at the upper end. No matter which end of the range you go with, it is small relative to the overall meat market that is in excess of $250 billion, just in the US, and closer to a trillion, if you expand it globally, in 2018. In fact, while the meat market has seen slow growth in the US and Europe, with a shift from beef to chicken, the global meat market has been growing, as increasing affluence in Asia, in general, and China, in particular, has increased meat consumption, Depending on your perspective on Beyond Meats, that can be bad news or good news, since it can be taken by detractors as a sign that the overall market for meatless meats is not very big and by optimists that there is plenty of room to grow.It is still a niche market: Meatless meat products have made their deepest inroads in urban and affluent populations and its allure is greatest with former meat-eaters rather than lifelong vegetarians, who don't crave either the taste or texture of meat. The plus is that this market has significant buying power, but the minus is that urban, well-to-do millennials can eat only so much. The big question that we face is in estimating how much the shift towards vegan and vegetarian diets will continue, driven by health reasons or environmental concern (or guilt). There is also a question of whether some governments may accelerate the shift away from meat-based diets, with policies and subsidies. Given this uncertainty, it is not surprising that the forecasts for the size of the meatless meat market vary widely across forecasters. While they all agree that the market will grow, they disagree about the end number, with forecasts for 2023 ranging from $5 billion at the low end to $8 billion at the other extreme. Beyond Meat, in its prospectus, uses the expansion of non-dairy milk(soy, flax, almond mild) in the milk market as its basis, to estimate the market for meatless meat to be $35 billion in the long term.
Beyond Meat: Story and ValuationHistory: At the time of its public offering, Beyond Meat had all of the characteristics of a young company, not much separated from its start up days, with revenues of $87.9 million, operating losses of $26.5 million and a common equity of -$121.8 million. Its first earnings report, delivered to a rapturous market response, reported a tripling of revenues and a narrowing of operating losses, but even with it incorporated, the company remains a small, money losing company.
The Story: To value young companies, I first have to put my optimist hat on, and with it firmly in place, my story for Beyond Meat is that it is catching the front end of a significant shift towards vegan and vegetarian-based diets. The key parts of my story are below:Total market for meatless meats will grow significantly: I see the total market for meatless meats growing from just over $1 billion in 2018 to $12 billion by 2028. While that is less than the $35 billion that Beyond Meat's back-of-the-envelope estimate delivers, it is closer to the upper end of the range of forecasts that you have for this market.With Beyond Meat capturing a significant market share: As the market grows, the number of players will increase, but I see Beyond Meats capturing a 25% market share of this market, building on its early entry into the market and brand name recognition, partly from its fast food connections.While delivering operating profits similar to the large US food processing companies: Over the next five years, I see pre-tax operating margins improving towards the 13.22% that US food processing business delivered in 2018, built largely on economies of scale and pricing power. And reinvesting a lot less, in delivering that growth: While Beyond Meat generates about a dollar in revenue per dollar in invested capital right now, I will assume that it will be able to use technology as its ally to invest more efficiently in the future. Specifically, I will assume that the company will generate $3 in revenue for every dollar in invested capital, about double what the typical US food processing company is able to generate.Is there risk in this investment? Absolutely, and you may be surprised that my cost of capital is only 7.46%, but that reflects my assessment of risk in this investment, as a going concern and as part of a diversified portfolio. As a money-losing company that will require about $500 million in capital over the next four years to deliver on its potential, there remains a significant chance of failure, and I estimate the probability of failure to be 15%.
The Valuation: With the story in place, the valuation follows and the picture below captures the ingredients of value:
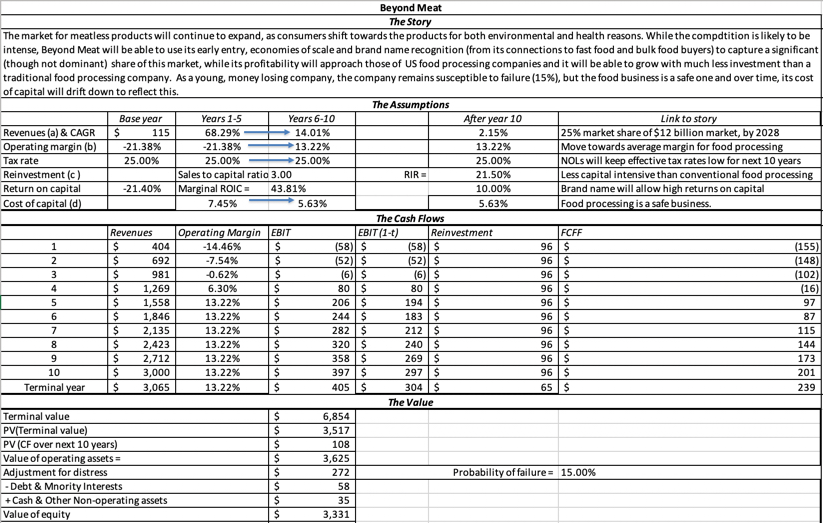 Download spreadsheetWith my story, which I believe reflects an upbeat story for the company, the value that I obtain for its equity is $3.3 billion, yielding a value per share of about $47. At the end of June 10, when I completed my valuation, the stock price was close to $170, well above my estimated value. What the stock dropped almost $41 on June 11 to $127/share, it still remained over valued.
What if? As with any young company, the value of Beyond Meat is driven almost entirely by the story you tell about the company, and in this case, that story revolves around two key inputs. The first is the revenue that you believe the company can generate, once mature, and that reflects how big you think the market for meatless meats will get and Beyond Meat's market share of the market. The second is its profitability at that point, which is a function of how much pricing power you believe the company will have. While I have assumed that Beyond Meat will deliver about $3 billion in revenues in 2028, with an operating margin of 13.22%, your story for the company can lead you to very different estimates for one or both numbers:
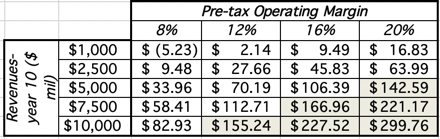 The shaded cells represent break even points, where you could justify buying Beyond Meat at the price ($127) it was trading at on June 11, 2019. Put differently, if your story for the meatless meat market and Beyond Meat's place in it leads you to revenues of $5 billion or higher with an operating margin of 20%, you should be a value investor in the company.
Macro Bets and Micro ValueAs you can see from the what-if analysis on Beyond Meat's value, the value that you obtain for Beyond Meat is determined mostly by how large you believe that market for meatless meats will end up being. In fact, there are some investors whose primary reason for investing in Beyond Meat is as a bet on a macro trend towards vegan and vegetarian diets. That said, it is worth remembering that investors don't get pay offs from making the right macro bets, but from the micro vehicles (individual investments) that they use as proxies for those bets. To get the pay off from a correct macro call, there are two additional assessments that investors have to make:Industry structure: A growing market may not translate into high value businesses, if it is crowded and intensely competitive. That market will deliver high revenue growth, but with low or no profitability, and no pathway to sustainable profits and value added. In contrast, a growing market where there are significant barriers to entry and a few big winners can result in high-value companies with large market share and unscalable moats. Winners and Losers: Assuming that there is potential for value creation in a market, investors have to pick the companies that are most likely to win in that market. That is difficult to do, when you are looking at young companies in a young market, but there is no way around making that judgment. In a post from 2015, I argued that in big (or potentially big) markets, you can expect companies to be collectively over valued early in the game. In my Beyond Meat valuation, I have implicitly made assumptions about both these components, by first allowing operating margins to converge on those of large food processing companies and then making Beyond Meat one of the winners in the meatless meat market, by giving it a 25% market share. My defense of these assumptions is simple. I believe that the meatless meat market will evolve like the broader food business, with a few big players dominating, with similar competitive advantages including brand name, economies of scale and access to distribution systems. I also believe that Beyond Meat and Impossible Foods, as front runners in this market, will use their access to capital to scale up quickly. Their use of fast food chains feeds into this strategy, with bulk sales increasing revenues quickly, allowing for economies of scale, and name-brand offerings (Impossible Whopper at Burger Kind, Beyond Famous Star burger at Carl's Jr.) helping improve brand name recognition. I will undoubtedly have to revisit these assumptions as the market evolves and some of you may disagree with me strongly on one or both assumptions. If so, please do download the spreadsheet and make your best judgments to derive your value for the company.
A Trading PlayEarly in a company's life, it is the pricing game that dominates and it is futile to use fundamentals to try to explain a stock price or day-to-day changes. This table, from one of my presentations on corporate life cycles, illustrates how investors and trades view companies as they move through the life cycle.

For a young company like Beyond Meat, making the transition from start-up to young growth, it is all pricing all the time, with stories about market size driving the pricing,. This trading phenomenon is exacerbated by the fact that it is one of the few pure plays on a macro trend, i.e., a shift in diets away from meat to plant-based options. That leads me to two conclusions. The first is an unexceptional one and it is that you will see wide swings in the stock price on a day to day basis, for little or no reason. That is a feature of priced stocks, not a bug, as mood and momentum shift for no perceptible reasons. The second is that selling short on a stock like this one (small, with a small float) is a dangerous game, since you are unlikely to have time as your ally, and while you may be right in the long term, you may bankrupt yourself before you are vindicated.
YouTube Video
LinksBeyond Meat: Prospectus for IPOValuation of Beyond Meat (June 2019)Past PostsBig Markets, Over Confidence and the Big Market Delusion (August 2015)
June 3, 2019
Tesla's Travails: Curfew for a Corporate Teenager?
It should come as no surprise to anyone that Tesla is back in the news, though it seems to be for all of the wrong reasons. From Musk's Twitter escapades with the SEC, to talk about electric lawn blowers to concerns about a debt death spiral, the company has managed, yet again, to get in its own way, and this time, it has paid a price in the market, as its stock price tests lows not seen in a couple of years. I would be lying if I said that I do not find the company fascinating, and as has been my pattern for the last six years, it is time for a Tesla valuation update.
Looking Back: My Tesla Posts in 2018In my last valuation of Tesla, set in June 2018, I considered possible, plausible and probable valuations for the company. In my story, which I admitted was an optimistic one, I mapped out a pathway for the company to deliver $100 billion in revenues in 2028, while pushing pre-tax operating margins to 10% by 2023. The value that I obtained for the stock was $170-$180 per share, depending on how the very generous option package (20.2 million options) granted to Musk were treated, and is in the picture below: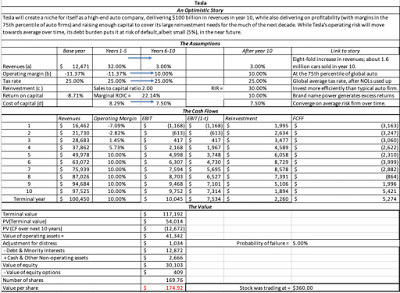 Download spreadsheetIn that post, I also listed possible, perhaps even plausible, scenarios where Tesla's value per share could be higher than $400/share, but argued that it would require the equivalent of a royal flush for the company to get there, a combination of a ten-fold increase in revenues, an operating margin of 12% and reinvesting more like a technology than an automotive company. Since the stock was trading at close $360 at the time of the valuation, I concluded that it was significantly over valued. True to form, Elon Musk roiled the waters in August 2018 with his now infamous tweet about funding being secured for a $420 buyout of the stock, causing a surge in the stock price, before questions arose about both how secured the funding actually was and whether the $420 price itself was fiction. In my post on the topic, I argued that if you were a private equity investor interested in taking a company private, Tesla would be a poor target, given its need for capital to keep growing, its heavy debt burden and the presence of Elon Musk as CEO. In the months after, both Musk and Tesla paid hefty prices for the indiscreet tweet, with the former in the SEC crosshairs for alleged stock price manipulation and the latter having to fight through the fog to get its story heard.
Catching up with the newsIf you are wondering how much can happen in a year, you obviously don't follow Tesla, since the company is a magnet for newsworthy events. Borrowing a movie title to categorize what's happened to the company in the last year, I would break the news down into the good, the bad and what I can only term as gobsmacking, where you whack your head and say "what the heck was that?"
1. The GoodThe market momentum has clearly shifted against Tesla, and all the news about the company seems to skew "bad", it is worth noting that there are good things that have happened at the company over the last year:Revenue Surge: In the drama around production targets and logistical misses, it is easy to lose sight of the fact that the Tesla 3 has caused the company to almost double revenues over the course of the last year, while easily winning the race for best selling electric car in the world. Improving Profitability: While Musk's tweets about Tesla turning earnings positive may have been premature, the company has moved down the pathway to profitability, reducing operating losses and with R&D capitalized, perhaps even turning the corner on operating profitability. In short, the operating base on which I will be building my Tesla valuation in June 2019 will be a more solid one than the one that I was using in 2018.
2. The BadWith Tesla, good news is always bundled with bad, some of it caused by macro events but much of it the consequence of self inflicted wounds:Debt load and Distress: When Tesla chose to add to its debt burden by borrowing $5 billion in 2017, I argued that there was no good reason for Tesla to borrow money, since money losing companies gain no tax benefits and debt put growth potential at risk. Tesla has since added to that debt, using the false logic that it needed to borrow money to fund its growth; a much better option would have been to raise equity, the dilution bogeyman notwithstanding. In June 2019, that debt, now close to $14 billion, is revealing its dark side, as a bond price plunge and ratings downgrades threaten to put Tesla's growth story at risk.Reinvestment Lags: Growth requires reinvestment, and especially so for automobile companies, where assembly lines and logistical infrastructure need to be put in place for cars to be delivered to customers. It is both frustrating and puzzling that Tesla, a company with a loyal customer base that is willing to wait, has been unwilling to make the investments that it needs to meet the demand. Instead, the company seems to lurch from one production crisis to another one (remember the tents that had to be put up to reach the 5,000 cars/week target) while its CEO muddies the water further by arguing that the company is not just earnings positive but cash flow positive. At the moment, the Fremont plant remains Tesla's major production facility, and while a plant in China is supposedly set for production late in 2019, the US/China trade war and Tesla's own tangled history on operating delays leads to skepticism.It is also worth noting that a significant part of Tesla's time has been spent extracting itself from another unforced error, its acquisition of Solar City in 2016, with cost cuts and employee layoffs that are incongruent with a company claiming to tell a great growth story.
3. The GobsmackingAn investor in Tesla should earn a special premium for having to endure news stories about the company that are so unusual that they would be considered fiction at other companies. Just to give a sampling, here are the other items that added to the smoke around the stock:SEC Oversight: If there has been a recurring story over the past year, it has to do with the aftermath of Elon Musk's "funding secured" tweet, which led to a SEC investigation and a threat of sanctions on the company. While the company came to a settlement wit the SEC, that settlement requires restraint on the part of Musk on future disclosures to the market (especially in the form on tweets), and restrain is not a Musk strong point.Autonomous Cars: In April 2019, Musk unveiled a plan to roll out autonomous taxis, with Tesla owners being allowed to add to the network, in the near future, with the promise that Tesla's technology on auto driving was well ahead of the competition. There is a debate worth having about autonomous cars and how they will change the ride sharing business, but it is almost certain that this will not happen smoothly or soon.The Rest: This being Tesla, there were the weekly distractions as Musk muddied the waters with talk of electric leaf blowers and insurance products.
An Updated Tesla ValuationFor the bulk of its existence, Tesla has been a story stock. That remains true, but as the company ages and acquires substance, you can argue that the story is getting more bounded. In this section, I will update my Tesla story and valuation first, then look at the uncertainty around the valuation and close with a comment on a "valuation" by ARK Invest, one of Tesla's biggest institutional cheerleaders.
1. The Story: Tesla, Corporate Teenager?Bringing together everything that has happened at Tesla over the last year, I find myself telling the same story that I told about Tesla a year ago, of a company that would find a pathway to revenues of $100 billion in 2028, with strong operating margins, remains intact, with one notable change. The company's debt overhang, already a concern a year ago, has become a clear and present danger to the company. In effect, on an operating basis, the company is in better shape than it was a year ago but on a financial leverage basis, it faces more truncation risk (a chance of failure of 20%). The value per share that I get with both effects built in is about $190/share: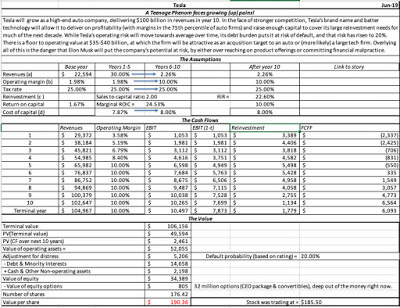 Download spreadsheetIf there is a modification to my story, it would be this. As I watched Musk repeatedly put Tesla's story and value at risk with his distractions, I was reminded of teenagers around the world, with immense potential and intelligence, who risk it all for momentary and often meaningless rushes. In fact, I am tempted to add a corporate teenage phase in my corporate life cycle framework and put Tesla in it, a corporate teenager with immense potential, who repeated puts it all at risk for distractions.
To provide perspective on why the value per share today is higher, even with a much greater chance of failure, I compared the numbers that I used in my valuation in June 2018 to June 2019: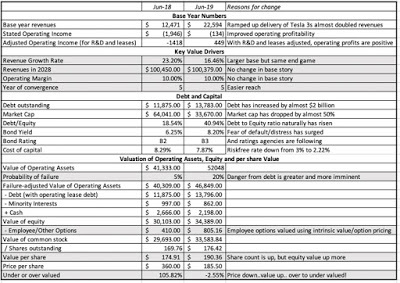
Note that while my end game on revenues ($100 billion by 2028) and operating margins (10% in 5 years) has not changed, the base numbers make both easier reaches. The rise in failure risk (from 5% in 2018 to 20% in 2019) is at least partially offset by a lower risk free rate and a cost of capital. In truth, the value per share is close enough that I would argue that there really has been little change, but the price per share has dropped by almost 50%, making the stock go from being significantly over valued to close to fairly valued now.
2. Facing up to UncertaintyAs with every Tesla valuation that I have done over the last six years, this one comes with caveats and uncertainties, and the contrasting views that bulls and bears have about the company are captured in the table below: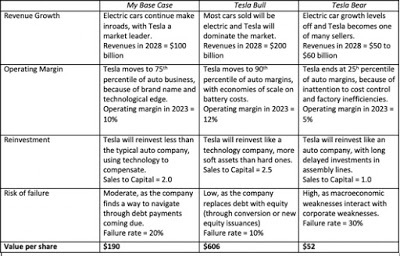 As you can see, I borrow from both sides of this debate, and I am sure that Tesla bulls will be disappointed that I don't have higher revenues for the company and Tesla bears will take issue with my reinvestment assumptions and expectations that the company will eventually deliver solid margins. Using a technique that I find useful, when confronted with divergent views, to deal with uncertainties, I computed Tesla's values in a simulation, with the results below:
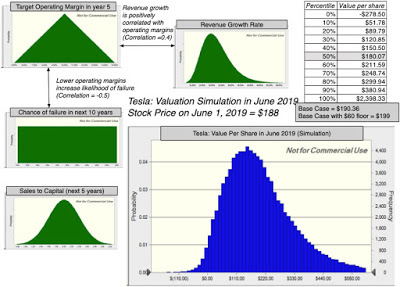
in summary, the median value across the 100,000 simulations is $180/share, the 10th percentile delivering a $52 value/share and the 90th yielding $380/share. In this simulation, I have assumed that Tesla will remain a stand alone, going concern, and that the equity value could drop to zero, if there is a shock to the value of operating assets, given the debt load. There is talk, however, that Tesla could become an acquisition target, to an automobile company or a tech company (see this rumor about Apple being interested in 2014). While there are some entanglements (such as the one with Panasonic in the battery factories) that will have to be worked out, there have generally been two impediments on this path. One is that Tesla has been an expensive target, especially when its market capitalization exceeded $50 billion. That will become less of a barrier, as the stock price drops, and at a market cap of less than $15 billion, it could be much more affordable. The other is a bigger and more intractable problem. With Elon Musk as part of the package, Tesla has a poison pill that few companies will want to imbibe, and it is likely that the relationship will have to be severed or at least significantly weakened for an acquisition to occur. I remain skeptical on the odds of an acquisition, precisely because I don't see Musk going quietly into the night, but adding an acquisition floor at a $15 billion value for equity (about $60/share) increases the simulated value for the stock by about $10/share.
3. The ARK Tesla PricingIt is not my role to be an arbiter of other people's valuations, and I generally avoid commenting on them unless they are in the public domain, as was the case with the Tesla/Solar City fairness opinions, or seek public comment. I will make an exception with the ARK "valuation" of Tesla, partly because they are among the stock's strongest boosters and partly because they put their model up for public comments, for which I commend them. In summary, here are the ARK numbers: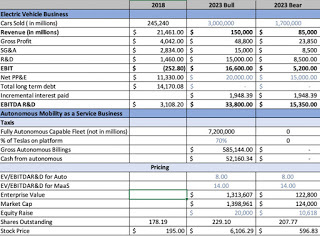 Download ARK pricing from Github
This is a pricing, not a valuation: I know that this will strike some as nitpicking but what ARK has produced is a forward pricing for Tesla, not a valuation. An intrinsic valuation requires forecasting cash flows over time, after taxes and reinvestment, and then discounting those cash flows back at a rate that reflects the risk in the investment. A pricing usually involves picking a metric (revenues, earnings, EBITDA), picking a forecast year for the metric and applying a multiple based upon what other companies in the peer group trade at. ARK's basic model forecasts revenues, earnings and other metrics in 2023, and applies a multiple to estimated EBITDAR&D in 2023, making it a forward pricing.The ARK bear is bullish: The ARK bear case requires that Tesla will sell 1.7 million cars in 2023, at an average price of $50,000/car and generate an operating margin of 6.1% on those revenues. Each of these assumptions is plausible, and the combination is possible, though to call a seven fold increase in revenues over five years, with a concurrent improvement to industry average profitability, a bear case seems to be stretching the definition of bear.The weakest link: The model's weakest link is on cash flows, since to sell 1.7 million cars, you have to make them first, and Tesla's production capacity, even if you count the China plant as functional and about the same capacity as the Fremont plant, brings you only about half way to the goal. It will be magical, if adding another $3.7 billion to net PP&E (as ARK seems to be assuming) and $1.2 billion to working capital will allow you to increase revenues by $63.5 billion, but it gets even more stretched, when you assume that Tesla also pays off $14 billion in debt (as ARK seems to) over the five years. In sum, the bear case will require at the very least $25 to $30 billion in cash flows, even with ARK's own assumptions, over the next five years, and since the operating cash flows at the company are still a trickle, this will require equity issuances in massive proportions fairly soon. ARK does allow for an equity capital raise of $10.6 billion which strikes me as too little to fill the gap, but in the absence of a balance sheet or statements of cash flows, I may be missing something (and it has to be very big).Share count issue: Even for the equity capital raise of $10.6 billion, ARK reduces the impact on share count by assuming a stock price of $360/share (market cap will be $70 billion) at the time of the raise. Since this capital will have to be raised soon, there is an element of wishful thinking here, i.e., that stock prices will double in short order and the capital raise will follow. In addition, if stock prices do climb, as ARK assumes, there will there is an overhang of 20 million options that have been granted to Musk by the board of directors that will become actual shares. In short, for the ARK bear case to unfold, the share count will have to double over the next five years.There is a time value question: Applying a multiple to EBITDAR&D in 2023 gives you a value in 2023, and to make it comparable to today's stock price, you will have to discount it back to today, at a risk adjusted rate. In fact, if you bring in the probability of failure embedded in Tesla bonds, there will an additional discounting on value.
Even if you take the ARK bear case as realistic, with Tesla projected to sell 1.7 million cars in 2023 and earn operating margins close to the auto sector, the pricing per share that you get will be closer to $250/share, with a more realistic share count and time value adjustments, not the $560 that you see on the ARK spreadsheet. As for the bull case, I will leave it untouched, since it strikes me as more fairy tale than valuation, a world where there will be 7.2 autonomous cars on the road in 2023, with Tesla controlling a 70% market share, and generating $52 billion in annual cash flows. I am willing to accept the argument that Tesla is closer to mastering the autonomous car technology than its competitors, but I see a business that is further in the future than 2023, less dominated by Tesla and much less profitable than ARK is assuming it to be. In short, right now, it is more option than conventional going concern value, and even if I believed it, I would make more money selling short on Uber and Lyft, than buying Tesla.
Bottom LineI did my first valuation of Tesla in 2013, and undershot the mark, partly because I saw its potential market as luxury cars (smaller), and partly because I under estimated how much it would be able to extract in production from the Fremont plant. Over time, I have compensated for both mistakes, giving Tesla access to a bigger (albeit, still upscale) market and more growth, while reinvesting less than the typical auto company. In spite of these adjustments, I have consistently come up with valuations well below the price, finding the stock to be valued at about half its price only a year ago. This year marks a turning point, as I find Tesla to be under valued, albeit by only a small fraction. Even in the midst of my most negative posts on Tesla, I confessed that I like the company (though not Elon Musk's antics as CEO and financial choices) and that I would one day own the stock. That day may be here, as I put in a limit buy order at $180/share, knowing fully well that, if I do end up as a shareholder, this company will test my patience and sanity. (Update: My limit buy just executed. As a shareholder my risks would be much lower, if Musk was banned from tweeting...)
YouTube Video
Spreadsheet linksTesla Valuation in June 2018Tesla Valuation in June 2019ARK's Tesla Pricing - May 2019Blog Post LinksTwists and Turns in the Tesla Story: A Boring, Boneheaded UpdateThe Privatization of Tesla: Stray Tweet or Game Changing News
Looking Back: My Tesla Posts in 2018In my last valuation of Tesla, set in June 2018, I considered possible, plausible and probable valuations for the company. In my story, which I admitted was an optimistic one, I mapped out a pathway for the company to deliver $100 billion in revenues in 2028, while pushing pre-tax operating margins to 10% by 2023. The value that I obtained for the stock was $170-$180 per share, depending on how the very generous option package (20.2 million options) granted to Musk were treated, and is in the picture below:
 Download spreadsheetIn that post, I also listed possible, perhaps even plausible, scenarios where Tesla's value per share could be higher than $400/share, but argued that it would require the equivalent of a royal flush for the company to get there, a combination of a ten-fold increase in revenues, an operating margin of 12% and reinvesting more like a technology than an automotive company. Since the stock was trading at close $360 at the time of the valuation, I concluded that it was significantly over valued. True to form, Elon Musk roiled the waters in August 2018 with his now infamous tweet about funding being secured for a $420 buyout of the stock, causing a surge in the stock price, before questions arose about both how secured the funding actually was and whether the $420 price itself was fiction. In my post on the topic, I argued that if you were a private equity investor interested in taking a company private, Tesla would be a poor target, given its need for capital to keep growing, its heavy debt burden and the presence of Elon Musk as CEO. In the months after, both Musk and Tesla paid hefty prices for the indiscreet tweet, with the former in the SEC crosshairs for alleged stock price manipulation and the latter having to fight through the fog to get its story heard.
Catching up with the newsIf you are wondering how much can happen in a year, you obviously don't follow Tesla, since the company is a magnet for newsworthy events. Borrowing a movie title to categorize what's happened to the company in the last year, I would break the news down into the good, the bad and what I can only term as gobsmacking, where you whack your head and say "what the heck was that?"
1. The GoodThe market momentum has clearly shifted against Tesla, and all the news about the company seems to skew "bad", it is worth noting that there are good things that have happened at the company over the last year:Revenue Surge: In the drama around production targets and logistical misses, it is easy to lose sight of the fact that the Tesla 3 has caused the company to almost double revenues over the course of the last year, while easily winning the race for best selling electric car in the world. Improving Profitability: While Musk's tweets about Tesla turning earnings positive may have been premature, the company has moved down the pathway to profitability, reducing operating losses and with R&D capitalized, perhaps even turning the corner on operating profitability. In short, the operating base on which I will be building my Tesla valuation in June 2019 will be a more solid one than the one that I was using in 2018.
2. The BadWith Tesla, good news is always bundled with bad, some of it caused by macro events but much of it the consequence of self inflicted wounds:Debt load and Distress: When Tesla chose to add to its debt burden by borrowing $5 billion in 2017, I argued that there was no good reason for Tesla to borrow money, since money losing companies gain no tax benefits and debt put growth potential at risk. Tesla has since added to that debt, using the false logic that it needed to borrow money to fund its growth; a much better option would have been to raise equity, the dilution bogeyman notwithstanding. In June 2019, that debt, now close to $14 billion, is revealing its dark side, as a bond price plunge and ratings downgrades threaten to put Tesla's growth story at risk.Reinvestment Lags: Growth requires reinvestment, and especially so for automobile companies, where assembly lines and logistical infrastructure need to be put in place for cars to be delivered to customers. It is both frustrating and puzzling that Tesla, a company with a loyal customer base that is willing to wait, has been unwilling to make the investments that it needs to meet the demand. Instead, the company seems to lurch from one production crisis to another one (remember the tents that had to be put up to reach the 5,000 cars/week target) while its CEO muddies the water further by arguing that the company is not just earnings positive but cash flow positive. At the moment, the Fremont plant remains Tesla's major production facility, and while a plant in China is supposedly set for production late in 2019, the US/China trade war and Tesla's own tangled history on operating delays leads to skepticism.It is also worth noting that a significant part of Tesla's time has been spent extracting itself from another unforced error, its acquisition of Solar City in 2016, with cost cuts and employee layoffs that are incongruent with a company claiming to tell a great growth story.
3. The GobsmackingAn investor in Tesla should earn a special premium for having to endure news stories about the company that are so unusual that they would be considered fiction at other companies. Just to give a sampling, here are the other items that added to the smoke around the stock:SEC Oversight: If there has been a recurring story over the past year, it has to do with the aftermath of Elon Musk's "funding secured" tweet, which led to a SEC investigation and a threat of sanctions on the company. While the company came to a settlement wit the SEC, that settlement requires restraint on the part of Musk on future disclosures to the market (especially in the form on tweets), and restrain is not a Musk strong point.Autonomous Cars: In April 2019, Musk unveiled a plan to roll out autonomous taxis, with Tesla owners being allowed to add to the network, in the near future, with the promise that Tesla's technology on auto driving was well ahead of the competition. There is a debate worth having about autonomous cars and how they will change the ride sharing business, but it is almost certain that this will not happen smoothly or soon.The Rest: This being Tesla, there were the weekly distractions as Musk muddied the waters with talk of electric leaf blowers and insurance products.
An Updated Tesla ValuationFor the bulk of its existence, Tesla has been a story stock. That remains true, but as the company ages and acquires substance, you can argue that the story is getting more bounded. In this section, I will update my Tesla story and valuation first, then look at the uncertainty around the valuation and close with a comment on a "valuation" by ARK Invest, one of Tesla's biggest institutional cheerleaders.
1. The Story: Tesla, Corporate Teenager?Bringing together everything that has happened at Tesla over the last year, I find myself telling the same story that I told about Tesla a year ago, of a company that would find a pathway to revenues of $100 billion in 2028, with strong operating margins, remains intact, with one notable change. The company's debt overhang, already a concern a year ago, has become a clear and present danger to the company. In effect, on an operating basis, the company is in better shape than it was a year ago but on a financial leverage basis, it faces more truncation risk (a chance of failure of 20%). The value per share that I get with both effects built in is about $190/share:
 Download spreadsheetIf there is a modification to my story, it would be this. As I watched Musk repeatedly put Tesla's story and value at risk with his distractions, I was reminded of teenagers around the world, with immense potential and intelligence, who risk it all for momentary and often meaningless rushes. In fact, I am tempted to add a corporate teenage phase in my corporate life cycle framework and put Tesla in it, a corporate teenager with immense potential, who repeated puts it all at risk for distractions.
 To provide perspective on why the value per share today is higher, even with a much greater chance of failure, I compared the numbers that I used in my valuation in June 2018 to June 2019:
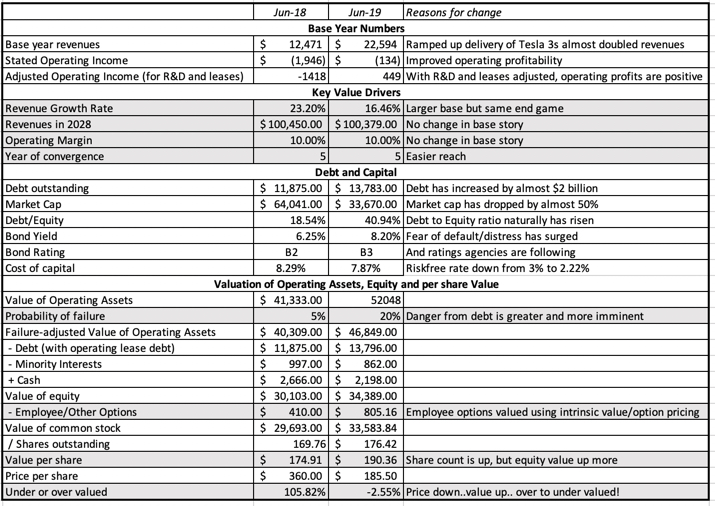
Note that while my end game on revenues ($100 billion by 2028) and operating margins (10% in 5 years) has not changed, the base numbers make both easier reaches. The rise in failure risk (from 5% in 2018 to 20% in 2019) is at least partially offset by a lower risk free rate and a cost of capital. In truth, the value per share is close enough that I would argue that there really has been little change, but the price per share has dropped by almost 50%, making the stock go from being significantly over valued to close to fairly valued now.
2. Facing up to UncertaintyAs with every Tesla valuation that I have done over the last six years, this one comes with caveats and uncertainties, and the contrasting views that bulls and bears have about the company are captured in the table below:
 As you can see, I borrow from both sides of this debate, and I am sure that Tesla bulls will be disappointed that I don't have higher revenues for the company and Tesla bears will take issue with my reinvestment assumptions and expectations that the company will eventually deliver solid margins. Using a technique that I find useful, when confronted with divergent views, to deal with uncertainties, I computed Tesla's values in a simulation, with the results below:
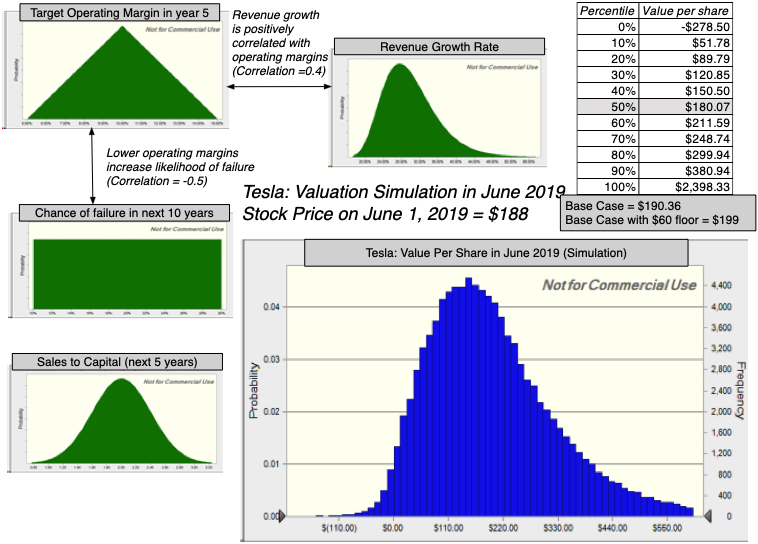
in summary, the median value across the 100,000 simulations is $180/share, the 10th percentile delivering a $52 value/share and the 90th yielding $380/share. In this simulation, I have assumed that Tesla will remain a stand alone, going concern, and that the equity value could drop to zero, if there is a shock to the value of operating assets, given the debt load. There is talk, however, that Tesla could become an acquisition target, to an automobile company or a tech company (see this rumor about Apple being interested in 2014). While there are some entanglements (such as the one with Panasonic in the battery factories) that will have to be worked out, there have generally been two impediments on this path. One is that Tesla has been an expensive target, especially when its market capitalization exceeded $50 billion. That will become less of a barrier, as the stock price drops, and at a market cap of less than $15 billion, it could be much more affordable. The other is a bigger and more intractable problem. With Elon Musk as part of the package, Tesla has a poison pill that few companies will want to imbibe, and it is likely that the relationship will have to be severed or at least significantly weakened for an acquisition to occur. I remain skeptical on the odds of an acquisition, precisely because I don't see Musk going quietly into the night, but adding an acquisition floor at a $15 billion value for equity (about $60/share) increases the simulated value for the stock by about $10/share.
3. The ARK Tesla PricingIt is not my role to be an arbiter of other people's valuations, and I generally avoid commenting on them unless they are in the public domain, as was the case with the Tesla/Solar City fairness opinions, or seek public comment. I will make an exception with the ARK "valuation" of Tesla, partly because they are among the stock's strongest boosters and partly because they put their model up for public comments, for which I commend them. In summary, here are the ARK numbers:
 Download ARK pricing from Github
This is a pricing, not a valuation: I know that this will strike some as nitpicking but what ARK has produced is a forward pricing for Tesla, not a valuation. An intrinsic valuation requires forecasting cash flows over time, after taxes and reinvestment, and then discounting those cash flows back at a rate that reflects the risk in the investment. A pricing usually involves picking a metric (revenues, earnings, EBITDA), picking a forecast year for the metric and applying a multiple based upon what other companies in the peer group trade at. ARK's basic model forecasts revenues, earnings and other metrics in 2023, and applies a multiple to estimated EBITDAR&D in 2023, making it a forward pricing.The ARK bear is bullish: The ARK bear case requires that Tesla will sell 1.7 million cars in 2023, at an average price of $50,000/car and generate an operating margin of 6.1% on those revenues. Each of these assumptions is plausible, and the combination is possible, though to call a seven fold increase in revenues over five years, with a concurrent improvement to industry average profitability, a bear case seems to be stretching the definition of bear.The weakest link: The model's weakest link is on cash flows, since to sell 1.7 million cars, you have to make them first, and Tesla's production capacity, even if you count the China plant as functional and about the same capacity as the Fremont plant, brings you only about half way to the goal. It will be magical, if adding another $3.7 billion to net PP&E (as ARK seems to be assuming) and $1.2 billion to working capital will allow you to increase revenues by $63.5 billion, but it gets even more stretched, when you assume that Tesla also pays off $14 billion in debt (as ARK seems to) over the five years. In sum, the bear case will require at the very least $25 to $30 billion in cash flows, even with ARK's own assumptions, over the next five years, and since the operating cash flows at the company are still a trickle, this will require equity issuances in massive proportions fairly soon. ARK does allow for an equity capital raise of $10.6 billion which strikes me as too little to fill the gap, but in the absence of a balance sheet or statements of cash flows, I may be missing something (and it has to be very big).Share count issue: Even for the equity capital raise of $10.6 billion, ARK reduces the impact on share count by assuming a stock price of $360/share (market cap will be $70 billion) at the time of the raise. Since this capital will have to be raised soon, there is an element of wishful thinking here, i.e., that stock prices will double in short order and the capital raise will follow. In addition, if stock prices do climb, as ARK assumes, there will there is an overhang of 20 million options that have been granted to Musk by the board of directors that will become actual shares. In short, for the ARK bear case to unfold, the share count will have to double over the next five years.There is a time value question: Applying a multiple to EBITDAR&D in 2023 gives you a value in 2023, and to make it comparable to today's stock price, you will have to discount it back to today, at a risk adjusted rate. In fact, if you bring in the probability of failure embedded in Tesla bonds, there will an additional discounting on value.
Even if you take the ARK bear case as realistic, with Tesla projected to sell 1.7 million cars in 2023 and earn operating margins close to the auto sector, the pricing per share that you get will be closer to $250/share, with a more realistic share count and time value adjustments, not the $560 that you see on the ARK spreadsheet. As for the bull case, I will leave it untouched, since it strikes me as more fairy tale than valuation, a world where there will be 7.2 autonomous cars on the road in 2023, with Tesla controlling a 70% market share, and generating $52 billion in annual cash flows. I am willing to accept the argument that Tesla is closer to mastering the autonomous car technology than its competitors, but I see a business that is further in the future than 2023, less dominated by Tesla and much less profitable than ARK is assuming it to be. In short, right now, it is more option than conventional going concern value, and even if I believed it, I would make more money selling short on Uber and Lyft, than buying Tesla.
Bottom LineI did my first valuation of Tesla in 2013, and undershot the mark, partly because I saw its potential market as luxury cars (smaller), and partly because I under estimated how much it would be able to extract in production from the Fremont plant. Over time, I have compensated for both mistakes, giving Tesla access to a bigger (albeit, still upscale) market and more growth, while reinvesting less than the typical auto company. In spite of these adjustments, I have consistently come up with valuations well below the price, finding the stock to be valued at about half its price only a year ago. This year marks a turning point, as I find Tesla to be under valued, albeit by only a small fraction. Even in the midst of my most negative posts on Tesla, I confessed that I like the company (though not Elon Musk's antics as CEO and financial choices) and that I would one day own the stock. That day may be here, as I put in a limit buy order at $180/share, knowing fully well that, if I do end up as a shareholder, this company will test my patience and sanity. (Update: My limit buy just executed. As a shareholder my risks would be much lower, if Musk was banned from tweeting...)
YouTube Video
Spreadsheet linksTesla Valuation in June 2018Tesla Valuation in June 2019ARK's Tesla Pricing - May 2019Blog Post LinksTwists and Turns in the Tesla Story: A Boring, Boneheaded UpdateThe Privatization of Tesla: Stray Tweet or Game Changing News
April 15, 2019
Uber's Coming out Party: Personal Mobility Pioneer or Car Service on Steroids?
After Lyft’s IPO on March 29, 2019, it was only a matter of time before Uber threw its hat in the public market ring, and on Friday, April 12, 2019, the company filed its prospectus. It is the first time that this company, which has been in the news more frequently in the last few years than almost any publicly traded company, has opened its books for investors, journalists and curiosity seekers. As someone who has valued Uber with the tidbits of information that have hitherto been available about the company, mostly leaked and unofficial, I was interested in seeing how much my perspective would change, when confronted with a fuller accounting of its performance.
Backing up!
To get a sense of where Uber stands now, just ahead of its IPO, I started with the prospectus, which weighing in at 285 pages, not counting appendices, and filled with pages of details, can be daunting. It is a testimonial to how information disclosure requirements have had the perverse consequence of making the disclosures useless, by drowning investors in data and meaningless legalese. I know that there are many who have latched on to the statement that "we may not achieve profitability" that Uber makes in the prospectus (on page 27) as an indication of its worthlessness, but I view it more as evidence that lawyers should never be allowed to write about investing risk.
Uber's Business
Just as Lyft did everything it could, in its prospectus, to relabel itself as a transportation services (not just car services) company, Uber's catchword, repeatedly multiple times in its prospectus, is that it is a personal mobility business, with the tantalizing follow up that its total market could be as large as $2 trillion, if you count the cost of all money spent on transportation (cars, public transit etc.)
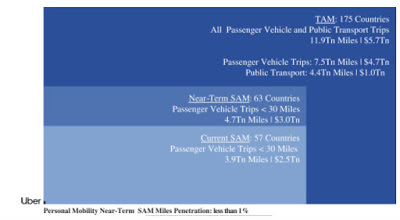 Uber Prospectus: Page 11While the cynic in me pushes me back on this over reach (I am surprised that they did not include the calories burnt by the most common transportation mode on the face of the earth, which is walking from point A to point B, as part of the total market), I understand why both Lyft and Uber have to relabel themselves as more than car service companies. Big market stories generally yield higher valuation and pricing than small market stories!
The Operating History
Uber went through some major restructuring in the three years leading into the IPO, as it exited cash burning investments in China (settling for a 20% stake in Didi), South East Asia (receiving a 23.2% share of Grab) and Russia (with 38% of Yandex Taxi the prize received for that exit). It is thus not surprising that there are large distortions in the financial statements during the last three years, with losses in the billions flowing from these divestitures. In the last few weeks, Uber announced a major acquisition, spending $3.1 billion to acquire Careem, a Middle Eastern ride sharing firm. Taking the company at its word, i.e., that the large divestiture-related losses are truly divestiture-related, let’s start by tracing the growth of Uber in the parts of the world where it had continuing operations in 2016, 2017 and 2018: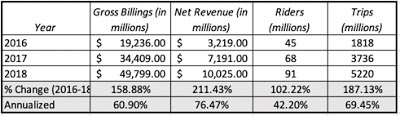 Uber Prospectus: Page 21The numbers in this table are the strongest backing for Uber’s growth story, with gross billings, net revenues, riders and rides all increasing strongly between 2016 and 2018. That good news on growing operations has to be tempered by the recognition that Uber has been unable to make money, as the table below indicates:
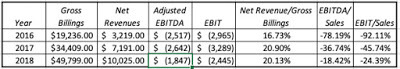 Uber Prospectus: Pages 21 & 24The adjusted EBITDA column contains numbers estimated and reported for the company, with a list of adjustments they made to even bigger losses to arrive at the reported values. I convert this adjusted EBITDA to an operating income (loss) by first netting out depreciation and amortization (for obvious reasons) and
then reversing the company’s attempt to add back stock based compensation
. The company is clearly a money loser, but if there is anything positive that can be extracted from this table, it is that the losses are decreasing as a percent of sales, over time.
Uber Prospectus: Pages 21 & 24The adjusted EBITDA column contains numbers estimated and reported for the company, with a list of adjustments they made to even bigger losses to arrive at the reported values. I convert this adjusted EBITDA to an operating income (loss) by first netting out depreciation and amortization (for obvious reasons) and
then reversing the company’s attempt to add back stock based compensation
. The company is clearly a money loser, but if there is anything positive that can be extracted from this table, it is that the losses are decreasing as a percent of sales, over time.
The Rider Numbers
One of Uber’s selling points lies in its non-accounting numbers, as the company reported having 91 million monthly riders (defined as riders who used either Uber or Uber delivery at least once in a month) and completing 5.2 billion rides. To break down those daunting numbers, I focus on the per rider statistics to see the engines driving Uber’s growth over time: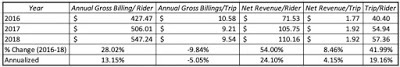 Uber Prospectus: Page 21There is good and bad news in this table. The good news is that Uber’s annual gross billings per rider rose almost 28% over the three year period, but the sobering companion finding is that the billings/ride are decreasing. Boiled down to basics, it suggests that the growth in overall billings for the company is at least partially driven by existing riders using more of the service, albeit for shorter rides. It could also reflect the fact the new riders for the company are coming from parts of the world (Latin America, for instance), where rides are less expensive. Finally, I took Uber’s expense breakdown in their income statement, and used it to extract information about what the company is spending money on, and how effectively:
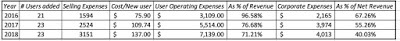 Uber Prospectus: F-4 (income statement in appendix)I make some assumptions here which will play out in the valuation that you will see below.
User Acquisition costs: Using the assumption that user change over a year can be attributed to selling expenses during the year, I computed the user acquisition cost each year by dividing the selling expenses by the number of riders added during the year.Operating Expenses for Existing Rides: I have included the cost of revenues (not including depreciation) and operations and support as expenses associated with current riders. Corporate Expenses; These are expenses that I assume are general expenses, not directly related to either servicing existing users or acquiring new ones and I include R&D, G&A and depreciation in this grouping.The good news is that the expenses associated with servicing existing users has been decreasing, as a percent of revenues, indicating that not all of these costs are variable or at least directly linked to more rider usage. Also, corporate expenses are showing evidence of economies of scale, decreasing as a percent of revenues. The bad new is that the cost of acquiring new users has been increasing, at least over this time period, suggesting that the ride sharing market is maturing or that competition is picking up for riders.
More than ride sharing?
Uber is a more complicated company to value than Lyft, for two reasons. The first is that Uber is not a pure ride sharing company, since it derives revenues from its food delivery service (Uber Eats) and an assortment of other smaller bets (like Uber Freight). In the graph below, you can see the evolution of these businesses: Uber Prospectus: Page 114
It is worth noting this table while suggests that while some of Uber’s more ambitious reaches into logistics have not borne fruit, its foray into food delivery seems to be picking up steam. Uber Eats has expanded from 2.68% of Uber’s net revenues to 13.12%. There is some additional information in another portion of the prospectus, where Uber reports its "adjusted" net revenue and gross Billings by business, and it does look like Uber's net take from Uber Eats is lower than its take from ride sharing:
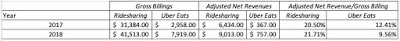 Uber Prospectus: Pages 102 & 103While it is clear that Uber's ride sharing customers have been quick to adopt Uber Eats, there are subtle differences in the economics of the two businesses that will play out in future profitability, especially if Uber Eats continues to grow at a disproportionate rate.
Unlike Lyft, which has kept its focus on the US and Canadian markets, Uber's ambitions have been more global, though reality has put a crimp on some of its expansion plans. While Uber's initial plans were to be everywhere in the world, large losses have led Uber to abandon much of Asia, leaving China to Didi and South East Asia to Grab, with India being the one big market where Uber has stayed, fighting Ola for market share and who can lose more money. The fastest growing overseas market for Uber has been Latin America, as you can see in the graph below:
Uber does not provide a breakdown of profitability by geographical region, but the magnitude of the losses that they wrote off when they closed their Chinese and South East Asian operations suggests that the US remains their most lucrative ride sharing market, in terms of profitability.
The Road Ahead : Crafting a story and value for Uber 1. A Top Down Valuation
In valuing Lyft, I used a top-down approach, starting with US transportation services as my total accessible market and working down through market share, margins and reinvestment to derive a value of $13.9 billion for its operating assets and $16.4 billion with the IPO proceeds counted in. Using a similar approach is trickier for Uber, since its decision to be in multiple parts of the logistics business and its global ambitions require assessment of a global logistics market, a challenge. I did an initial assessment of Uber, using a much larger total market and arrived at a value of $44.4 billion for its operating assets, but adding the portions of Didi, Grab and Yandex Taxi pushed this number up to $55.3 billion. Adding the cash balance on hand as well as the IPO proceeds that will remain in the firm (rumored to be $9 billion), before subtracting out debt yields a value for equity of about $61.7 billion.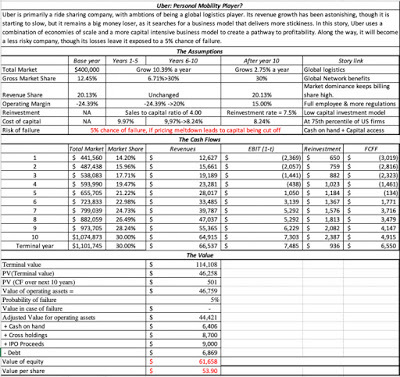 Download spreadsheetThe share count is still hazy (as the multiple blank areas in the prospectus indicate) but starting with the 903.6 million shares of common stock that will result from the conversion of redeemable convertible preferred shares at the time of the IPO, and adding in additional shares that will result from option exercises, RSUs (restricted stock units issued to employees) and new shares being issued to raise approximately $10 billion in proceeds, I arrive at a value per share of about $54/share, though that the updated version of the prospectus, which should come out with the offering price, should allow for more precision on the share count.
2. A Rider-based Valuation
The uncertainty about the total accessible market, though, makes me uneasy with my top down valuation. So, I decided to try another route. In June 2017, I presented a different approach to valuing companies like Uber, that derive their value from users, subcribers or members. In that approach, I began by valuing an existing user (rider), by looking at the revenues and cash flows that Uber would generate over the user’s lifetime and then extended the approach to valuing a new user, where the cost of user acquisition has to be netted out against the user value. I completed the assessment by computing the value drag created by non-rider related costs (like G&A and R&D). In the June 2017 valuation, I had to make do with minimalist detail on expenses but the prospectus provides a much richer break down, allowing me to update my user-based valuation of Uber. The valuation picture is below: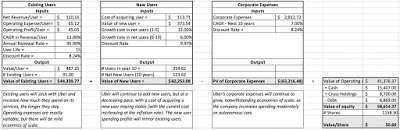 Download spreadsheet
This approach yields a value for the equity of about $58.6 billion for Uber’s equity, which again depending on the share count would translate into a share price of $51/share.
Value Dynamics
The benefits of the rider-based valuation is that it allows us to isolate the variables that will determine whether Uber turns the corner quickly and can make enough money to justify the rumored $100 billion value. The value of existing riders is determined by the growth rate in per-user revenues and the cost of servicing a user, with increases in the former and decreases in the latter driving up user value. The value of new riders, in the aggregate, is determined by the increase in rider count and the cost of acquiring a new rider. One troubling aspect of the growth in users over the last three years has been the increase in user acquisition costs, perhaps reflecting a more saturated market. In the table below, I estimate the value of Uber's equity, using a range of assumptions for the growth rate in per user revenues and the cost of acquiring a new user: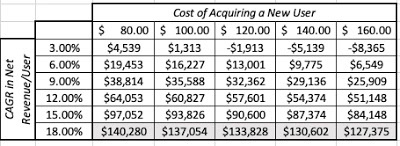 Download spreadsheetThere are two ways that you can read this table. If you are a trader, deeply suspicious of intrinsic value, you may look at this table as confirmation that intrinsic value models can be used to deliver whatever value you want them to, and your suspicions would be well founded. I am a believer in value and I see this table in a different light.
First, I view it as a reminder that my estimate of value is just mine, based on my story and inputs, and that there are others with different stories for the company that may explain why they would pay much more or much less than I would for the company. Second, this table suggests to me that Uber is a company that is poised on a knife's edge. If it just continues to just add to its rider count, but pushes up its cost of acquiring riders as it goes along, and existing riders do not increase the usage of the service, its value implodes. If it can get riders to significantly increase usage (either in the form of more rides or other add on services), it can find a way to justify a value that exceeds $100 billion. Third, the table also indicates that if Uber has to pick between spending money on acquiring more riders or getting existing riders to buy more of its services, the latter provides a much bigger bang for the buck than the former. Put simply, I hope Dara Khoshrowshahi means it when he says that Uber has to show a pathway to profitability, but I think that is what is more critical is that he acts on those words. In my view, this remains a business, whether you define it to be ride sharing, transportation services or personal mobility, without a business model that can generate sustained profits, precisely because the existing model was designed to deliver exponential growth and little else, and Uber, and the other players in this game), have only a limited window to fix it.
Refreshing the Pricing
Having spent all of this time on Uber's valuation, let me concede to the reality that Uber will be priced by the market, and it will be priced relative to Lyft. That is why Uber has probably been pulling harder than almost any one else in the market for the Lyft IPO to be well received and for its stock to continue to do well in the aftermarket. In the table below, I compare key operating numbers for Uber and Lyft, with Lyft's pricing in the market in place:
 In computing the metrics, it is worth remembering that Uber and Lyft use different definitions for basic metrics and I have tried to adjust. For instance, Uber defines riders as those who use the service at least once a month and the closest number that I can get for Lyft is their estimate that they had 18.6 million active quarterly riders. Uber is bigger on every single dimension, including losses, then Lyft. I convert Lyft's current market pricing (on April 12, 2019) into multiples, scaling them to different metrics and applying these metrics to Uber:
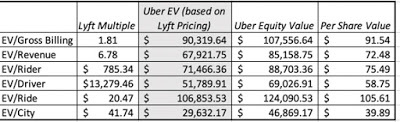 Download pricing spreadsheetIn computing Uber's equity value from its enterprise value, I have added the cash ($6.4 billion of cash on hand plus the $9 billion in expected IPO proceeds) $ and Uber's cross holdings ($8.7 billion) to the value and netted out debt ($6.5 billion). To get the value per share, I have used the estimated 1175 million shares that I believe will be outstanding, including options and RSUs, after the offering. Depending on the metric that I can scale it to, you can get values ranging from $47 billion to $124 billion for Uber's equity, though each comes with a catch. If you believe that there are no games that are played with pricing, you should think again! Also, as Lyft's price moves, so will Uber's, and I am sure that there are many at Uber (and its investment banks) who are hoping and praying that Lyft's stock does not have many more days like last Thursday, before the Uber IPO hits the market.
Conclusion
I am sure that there are many who understand the ride sharing business much better than I do, and see obvious limitations and pitfalls in my valuations of both Uber and Lyft. In fact, I have been wrong before on Uber, as Bill Gurley (who knows more about Uber than I ever will) publicly pointed out, and I am sure that I will be wrong again. I hope that even if you disagree with me on my numbers, the spreadsheets that are linked are flexible enough for you to take your stories about these companies to arrive at your value judgments.
YouTube Video
Spreadsheets (for valuation)
Uber Valuation - Top DownUber Valuation - User-basedUber Pricing
Other Links
Uber Prospectus (April 2019)My first and fatally flawed valuation of Uber (June 2014)Bill Gurley's take down of my Uber valuation (July 2014)My post on the future of ride sharing (August 2016)My first user-based valuation of Uber (June 2017)
Backing up!
To get a sense of where Uber stands now, just ahead of its IPO, I started with the prospectus, which weighing in at 285 pages, not counting appendices, and filled with pages of details, can be daunting. It is a testimonial to how information disclosure requirements have had the perverse consequence of making the disclosures useless, by drowning investors in data and meaningless legalese. I know that there are many who have latched on to the statement that "we may not achieve profitability" that Uber makes in the prospectus (on page 27) as an indication of its worthlessness, but I view it more as evidence that lawyers should never be allowed to write about investing risk.
Uber's Business
Just as Lyft did everything it could, in its prospectus, to relabel itself as a transportation services (not just car services) company, Uber's catchword, repeatedly multiple times in its prospectus, is that it is a personal mobility business, with the tantalizing follow up that its total market could be as large as $2 trillion, if you count the cost of all money spent on transportation (cars, public transit etc.)
 Uber Prospectus: Page 11While the cynic in me pushes me back on this over reach (I am surprised that they did not include the calories burnt by the most common transportation mode on the face of the earth, which is walking from point A to point B, as part of the total market), I understand why both Lyft and Uber have to relabel themselves as more than car service companies. Big market stories generally yield higher valuation and pricing than small market stories!
The Operating History
Uber went through some major restructuring in the three years leading into the IPO, as it exited cash burning investments in China (settling for a 20% stake in Didi), South East Asia (receiving a 23.2% share of Grab) and Russia (with 38% of Yandex Taxi the prize received for that exit). It is thus not surprising that there are large distortions in the financial statements during the last three years, with losses in the billions flowing from these divestitures. In the last few weeks, Uber announced a major acquisition, spending $3.1 billion to acquire Careem, a Middle Eastern ride sharing firm. Taking the company at its word, i.e., that the large divestiture-related losses are truly divestiture-related, let’s start by tracing the growth of Uber in the parts of the world where it had continuing operations in 2016, 2017 and 2018:
 Uber Prospectus: Page 21The numbers in this table are the strongest backing for Uber’s growth story, with gross billings, net revenues, riders and rides all increasing strongly between 2016 and 2018. That good news on growing operations has to be tempered by the recognition that Uber has been unable to make money, as the table below indicates:
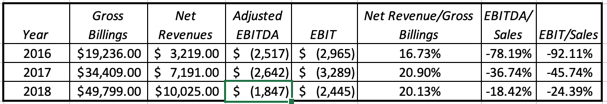 Uber Prospectus: Pages 21 & 24The adjusted EBITDA column contains numbers estimated and reported for the company, with a list of adjustments they made to even bigger losses to arrive at the reported values. I convert this adjusted EBITDA to an operating income (loss) by first netting out depreciation and amortization (for obvious reasons) and
then reversing the company’s attempt to add back stock based compensation
. The company is clearly a money loser, but if there is anything positive that can be extracted from this table, it is that the losses are decreasing as a percent of sales, over time.
Uber Prospectus: Pages 21 & 24The adjusted EBITDA column contains numbers estimated and reported for the company, with a list of adjustments they made to even bigger losses to arrive at the reported values. I convert this adjusted EBITDA to an operating income (loss) by first netting out depreciation and amortization (for obvious reasons) and
then reversing the company’s attempt to add back stock based compensation
. The company is clearly a money loser, but if there is anything positive that can be extracted from this table, it is that the losses are decreasing as a percent of sales, over time.The Rider Numbers
One of Uber’s selling points lies in its non-accounting numbers, as the company reported having 91 million monthly riders (defined as riders who used either Uber or Uber delivery at least once in a month) and completing 5.2 billion rides. To break down those daunting numbers, I focus on the per rider statistics to see the engines driving Uber’s growth over time:
 Uber Prospectus: Page 21There is good and bad news in this table. The good news is that Uber’s annual gross billings per rider rose almost 28% over the three year period, but the sobering companion finding is that the billings/ride are decreasing. Boiled down to basics, it suggests that the growth in overall billings for the company is at least partially driven by existing riders using more of the service, albeit for shorter rides. It could also reflect the fact the new riders for the company are coming from parts of the world (Latin America, for instance), where rides are less expensive. Finally, I took Uber’s expense breakdown in their income statement, and used it to extract information about what the company is spending money on, and how effectively:
 Uber Prospectus: F-4 (income statement in appendix)I make some assumptions here which will play out in the valuation that you will see below.
User Acquisition costs: Using the assumption that user change over a year can be attributed to selling expenses during the year, I computed the user acquisition cost each year by dividing the selling expenses by the number of riders added during the year.Operating Expenses for Existing Rides: I have included the cost of revenues (not including depreciation) and operations and support as expenses associated with current riders. Corporate Expenses; These are expenses that I assume are general expenses, not directly related to either servicing existing users or acquiring new ones and I include R&D, G&A and depreciation in this grouping.The good news is that the expenses associated with servicing existing users has been decreasing, as a percent of revenues, indicating that not all of these costs are variable or at least directly linked to more rider usage. Also, corporate expenses are showing evidence of economies of scale, decreasing as a percent of revenues. The bad new is that the cost of acquiring new users has been increasing, at least over this time period, suggesting that the ride sharing market is maturing or that competition is picking up for riders.
More than ride sharing?
Uber is a more complicated company to value than Lyft, for two reasons. The first is that Uber is not a pure ride sharing company, since it derives revenues from its food delivery service (Uber Eats) and an assortment of other smaller bets (like Uber Freight). In the graph below, you can see the evolution of these businesses:
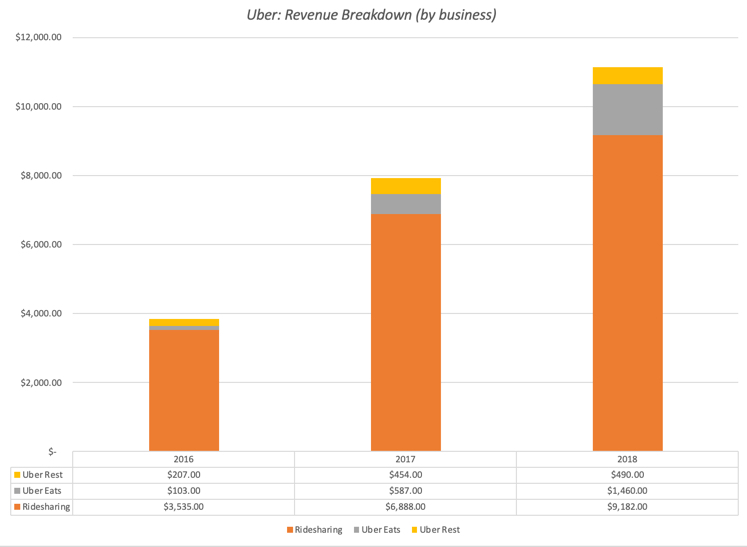 Uber Prospectus: Page 114
It is worth noting this table while suggests that while some of Uber’s more ambitious reaches into logistics have not borne fruit, its foray into food delivery seems to be picking up steam. Uber Eats has expanded from 2.68% of Uber’s net revenues to 13.12%. There is some additional information in another portion of the prospectus, where Uber reports its "adjusted" net revenue and gross Billings by business, and it does look like Uber's net take from Uber Eats is lower than its take from ride sharing:
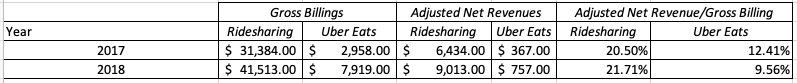 Uber Prospectus: Pages 102 & 103While it is clear that Uber's ride sharing customers have been quick to adopt Uber Eats, there are subtle differences in the economics of the two businesses that will play out in future profitability, especially if Uber Eats continues to grow at a disproportionate rate.
Unlike Lyft, which has kept its focus on the US and Canadian markets, Uber's ambitions have been more global, though reality has put a crimp on some of its expansion plans. While Uber's initial plans were to be everywhere in the world, large losses have led Uber to abandon much of Asia, leaving China to Didi and South East Asia to Grab, with India being the one big market where Uber has stayed, fighting Ola for market share and who can lose more money. The fastest growing overseas market for Uber has been Latin America, as you can see in the graph below:
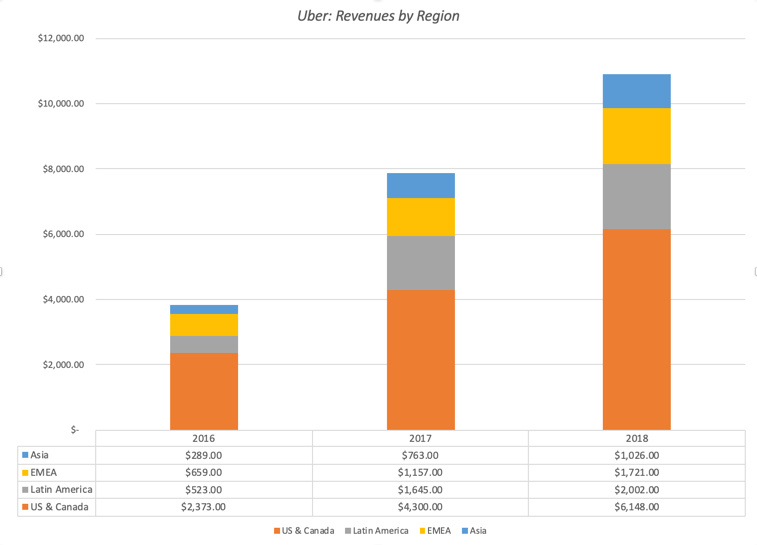
Uber does not provide a breakdown of profitability by geographical region, but the magnitude of the losses that they wrote off when they closed their Chinese and South East Asian operations suggests that the US remains their most lucrative ride sharing market, in terms of profitability.
The Road Ahead : Crafting a story and value for Uber 1. A Top Down Valuation
In valuing Lyft, I used a top-down approach, starting with US transportation services as my total accessible market and working down through market share, margins and reinvestment to derive a value of $13.9 billion for its operating assets and $16.4 billion with the IPO proceeds counted in. Using a similar approach is trickier for Uber, since its decision to be in multiple parts of the logistics business and its global ambitions require assessment of a global logistics market, a challenge. I did an initial assessment of Uber, using a much larger total market and arrived at a value of $44.4 billion for its operating assets, but adding the portions of Didi, Grab and Yandex Taxi pushed this number up to $55.3 billion. Adding the cash balance on hand as well as the IPO proceeds that will remain in the firm (rumored to be $9 billion), before subtracting out debt yields a value for equity of about $61.7 billion.
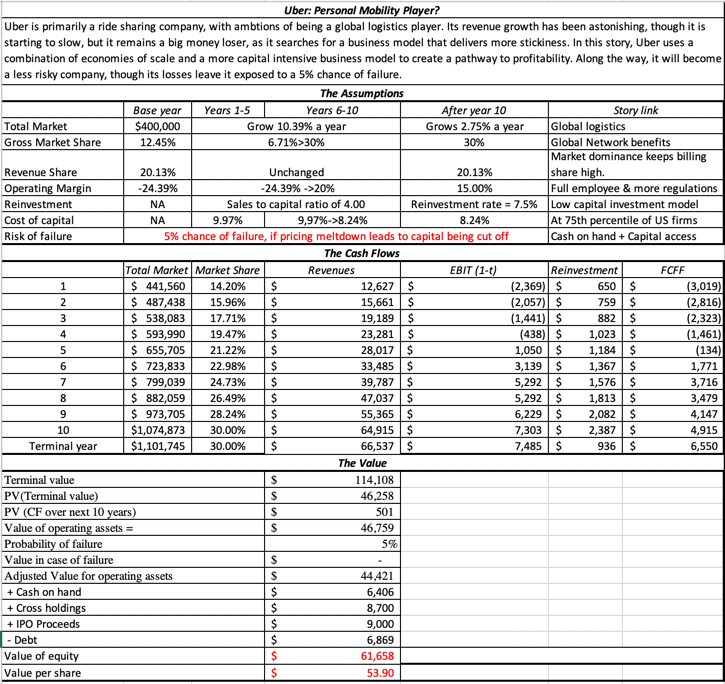 Download spreadsheetThe share count is still hazy (as the multiple blank areas in the prospectus indicate) but starting with the 903.6 million shares of common stock that will result from the conversion of redeemable convertible preferred shares at the time of the IPO, and adding in additional shares that will result from option exercises, RSUs (restricted stock units issued to employees) and new shares being issued to raise approximately $10 billion in proceeds, I arrive at a value per share of about $54/share, though that the updated version of the prospectus, which should come out with the offering price, should allow for more precision on the share count.
2. A Rider-based Valuation
The uncertainty about the total accessible market, though, makes me uneasy with my top down valuation. So, I decided to try another route. In June 2017, I presented a different approach to valuing companies like Uber, that derive their value from users, subcribers or members. In that approach, I began by valuing an existing user (rider), by looking at the revenues and cash flows that Uber would generate over the user’s lifetime and then extended the approach to valuing a new user, where the cost of user acquisition has to be netted out against the user value. I completed the assessment by computing the value drag created by non-rider related costs (like G&A and R&D). In the June 2017 valuation, I had to make do with minimalist detail on expenses but the prospectus provides a much richer break down, allowing me to update my user-based valuation of Uber. The valuation picture is below:
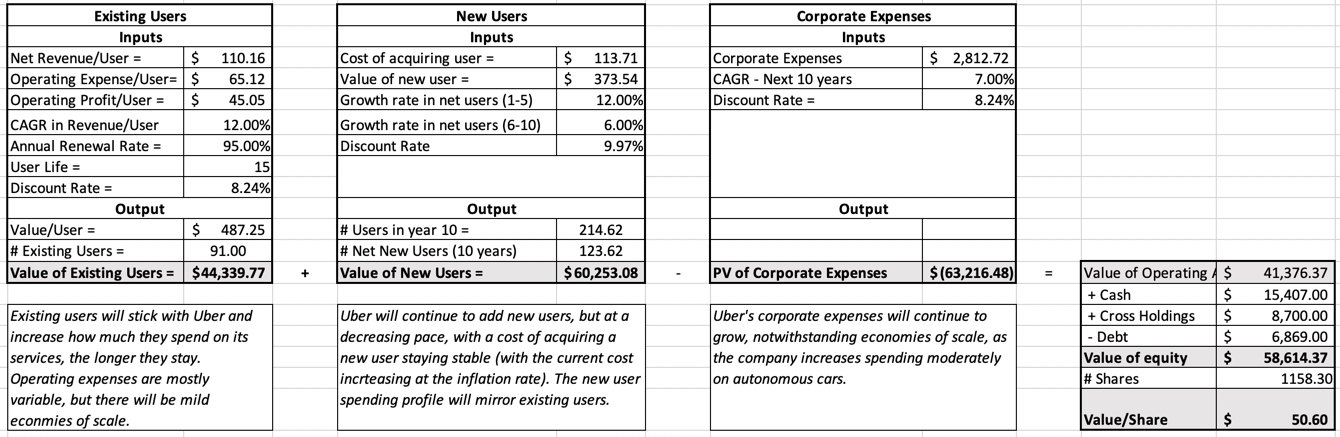 Download spreadsheet
This approach yields a value for the equity of about $58.6 billion for Uber’s equity, which again depending on the share count would translate into a share price of $51/share.
Value Dynamics
The benefits of the rider-based valuation is that it allows us to isolate the variables that will determine whether Uber turns the corner quickly and can make enough money to justify the rumored $100 billion value. The value of existing riders is determined by the growth rate in per-user revenues and the cost of servicing a user, with increases in the former and decreases in the latter driving up user value. The value of new riders, in the aggregate, is determined by the increase in rider count and the cost of acquiring a new rider. One troubling aspect of the growth in users over the last three years has been the increase in user acquisition costs, perhaps reflecting a more saturated market. In the table below, I estimate the value of Uber's equity, using a range of assumptions for the growth rate in per user revenues and the cost of acquiring a new user:
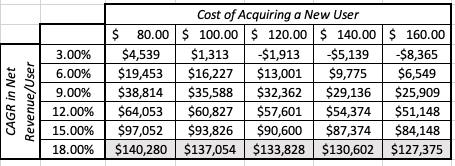 Download spreadsheetThere are two ways that you can read this table. If you are a trader, deeply suspicious of intrinsic value, you may look at this table as confirmation that intrinsic value models can be used to deliver whatever value you want them to, and your suspicions would be well founded. I am a believer in value and I see this table in a different light.
First, I view it as a reminder that my estimate of value is just mine, based on my story and inputs, and that there are others with different stories for the company that may explain why they would pay much more or much less than I would for the company. Second, this table suggests to me that Uber is a company that is poised on a knife's edge. If it just continues to just add to its rider count, but pushes up its cost of acquiring riders as it goes along, and existing riders do not increase the usage of the service, its value implodes. If it can get riders to significantly increase usage (either in the form of more rides or other add on services), it can find a way to justify a value that exceeds $100 billion. Third, the table also indicates that if Uber has to pick between spending money on acquiring more riders or getting existing riders to buy more of its services, the latter provides a much bigger bang for the buck than the former. Put simply, I hope Dara Khoshrowshahi means it when he says that Uber has to show a pathway to profitability, but I think that is what is more critical is that he acts on those words. In my view, this remains a business, whether you define it to be ride sharing, transportation services or personal mobility, without a business model that can generate sustained profits, precisely because the existing model was designed to deliver exponential growth and little else, and Uber, and the other players in this game), have only a limited window to fix it.
Refreshing the Pricing
Having spent all of this time on Uber's valuation, let me concede to the reality that Uber will be priced by the market, and it will be priced relative to Lyft. That is why Uber has probably been pulling harder than almost any one else in the market for the Lyft IPO to be well received and for its stock to continue to do well in the aftermarket. In the table below, I compare key operating numbers for Uber and Lyft, with Lyft's pricing in the market in place:
 In computing the metrics, it is worth remembering that Uber and Lyft use different definitions for basic metrics and I have tried to adjust. For instance, Uber defines riders as those who use the service at least once a month and the closest number that I can get for Lyft is their estimate that they had 18.6 million active quarterly riders. Uber is bigger on every single dimension, including losses, then Lyft. I convert Lyft's current market pricing (on April 12, 2019) into multiples, scaling them to different metrics and applying these metrics to Uber:
 Download pricing spreadsheetIn computing Uber's equity value from its enterprise value, I have added the cash ($6.4 billion of cash on hand plus the $9 billion in expected IPO proceeds) $ and Uber's cross holdings ($8.7 billion) to the value and netted out debt ($6.5 billion). To get the value per share, I have used the estimated 1175 million shares that I believe will be outstanding, including options and RSUs, after the offering. Depending on the metric that I can scale it to, you can get values ranging from $47 billion to $124 billion for Uber's equity, though each comes with a catch. If you believe that there are no games that are played with pricing, you should think again! Also, as Lyft's price moves, so will Uber's, and I am sure that there are many at Uber (and its investment banks) who are hoping and praying that Lyft's stock does not have many more days like last Thursday, before the Uber IPO hits the market.
Conclusion
I am sure that there are many who understand the ride sharing business much better than I do, and see obvious limitations and pitfalls in my valuations of both Uber and Lyft. In fact, I have been wrong before on Uber, as Bill Gurley (who knows more about Uber than I ever will) publicly pointed out, and I am sure that I will be wrong again. I hope that even if you disagree with me on my numbers, the spreadsheets that are linked are flexible enough for you to take your stories about these companies to arrive at your value judgments.
YouTube Video
Spreadsheets (for valuation)
Uber Valuation - Top DownUber Valuation - User-basedUber Pricing
Other Links
Uber Prospectus (April 2019)My first and fatally flawed valuation of Uber (June 2014)Bill Gurley's take down of my Uber valuation (July 2014)My post on the future of ride sharing (August 2016)My first user-based valuation of Uber (June 2017)
March 7, 2019
Lyft Off? The First Ride Sharing IPO!
Last week, Lyft became the first of the ride sharing companies to announce plans for an initial public officering, filing its prospectus. It is definitely not going to be the last, but its fate in the market will not only determine when Uber, Didi, Ola and GrabTaxi will test public markets, but what prices they can hope to get. My fascination with ride sharing goes back to June 2014, when I tried to value Uber and failed spectacularly in forecasting how much and how quickly ride sharing would change the face of car service around the world. I have since returned multiple times to the scene of my crime, and while I am not sure that I have learned very much along the way, I have tried to right size my thinking on this business. You can be the judge as bring my experiences to play in my valuation of Lyft, ahead of its IPO pricing.
The Rise of Ride SharingThe ride sharing business, as we know it, traces its roots back to the Bay Area, with the founding of Uber, Sidecar and Lyft providing the key impetus, and its impact on the car service business has been immense. In a post in 2015, I traced out the growth of ride sharing and the ripple effects it has had on the car service status quo, noting that revenues for ride sharing companies have climbed, the price of a taxi cab medallion in New York city has plummeted by 80-90%. The most impressive statistic, for ride sharing companies, is not just the growth in revenues, which has been explosive, but also how much it has become part of day-to-day life, not just for younger, more tech savvy individuals but for everyone. While the growth was initially in the United States, ride sharing has taken off at an exponential rate in Asia, with India (Ola), China (Didi) and Malaysia (GrabTaxi) all developing home grown ride sharing companies. The regulatory push back has been strong in Europe, slowing growth, but there are signs that even there, ride sharing is acquiring a foothold.
There are many factors that can explain how and why ride sharing so quickly and decisively disrupted the taxi cab business, but the latter was ripe for the taking for may reasons. First, the taxi business in the 2009 had changed little in decades, refusing to incorporate advance in technology and shifting tastes, secure that it did not have to adapt, because it had a captive market. Second, in most cities, rules and regulations that were throwbacks in time or lobbied for by special interests handicapped taxi operators and gave ride sharing companies, not bound by the same rules, a decisive advantage. Third, automobiles are underutilized resources for the most part, since most cars sit idle for much of the day, and ride sharing companies took advantage of excess capacity, by letting car owners monetize it. Finally, individuals often under price their time and do not factor in long term costs in their decision making and the ride sharing companies have exploited that irrationality. I think that the MIT study in February 2018 that showed absurdly low hourly wages (less than $4/hour) for Uber and Lyft drivers was flawed, but I also don't buy into the rosy picture that the ride sharing companies paint about the income potential in driving.
It has not been all good news for ride sharing, as usage has increased. While revenues have come easily, the companies have struggled with profitability, reporting huge losses as they grow. Lyft reported losses of $911 million in 2018, in its prospectus, but Uber's loss was $1.8 billion during 2018, Didi almost matched that with a $1.6 billion loss and the only reason that Ola and GrabTaxi lost less was because they were smaller. Put simply, these company are money losing machines, at least at the moment, and if there are economies of scale kicking in, they are showing up awfully slowly. While some of this can be attributed to growing pains, that will ease as these companies age and grow bigger, a significant portion of the profitability shortfall can be attributed to how these businesses are designed. In my 2015 post, I argued that the low capital intensity (where ride sharing companies don't invest in cars) and the independent contractor model (where drivers are not employees), which made growth so easy, also conspired to make it difficult for these companies to gain economies of scale or stay away from cut throat competition.
The Playing FieldIn 2015, I argued, with tongue only half in cheek, that one possible model for the ride sharing companies to develop sustainable businesses was the Mafia's mostly successful attempt to stop intrafamily warfare in the 1930s by dividing up New York city among five families, giving each family its own fiefdom to exploit. (I prefer The Godfather version.). While that may have seemed like an outlandish comparison in 2015, it is interesting that in the years since, Uber has extricated itself from China, leaving that market to Didi, in return for a 20% stake in the company and then from South East Asia, in return for a share of GrabTaxi. In fact, the United States may be the most competitive ride sharing market in the world, with Uber and Lyft going head-to-head in most cities.
While Uber and Lyft are ride sharing companies, their evolution over the last decade offers a fascinating contrast in business models, for young companies. In a post in 2015, I drew the contrast between the two companies, as a prelude to valuing them. Uber was the "big story" company, telling investors that it wanted to be in all things logistics, expanding into delivery and moving, and all over the world. Lyft was the "focused story" company, setting itself apart from Uber by keeping its business in the United States and staying with car service, as its primary business. I argued in 2015, that given how the two companies were priced, I would rather be an investor in Lyft than Uber.
In the four years since the post, we have seen the consequences for both companies. While Uber's bigger story gained it a much higher pricing from investors, it has also brought the company a whole host of troubles, ranging from being a target for regulators to management over reach. Travis Kalanick, its high profit CEO, left the company in a messy and public divorce, and Dara Khosrowshahi, who replaced him, has scaled Uber's ambitions down, first globally by getting out of China and Southeast Asia, where it was burning through cash at an exponential rate, and then within the logistics business, by focusing on Uber Delivery as the key add on to car service. Lyft has stayed true to its US and car service focus, and it has paid off in a higher market share in the market. Both companies have jumped on the bike and scooter craze, with Uber buying Jump and Lime and Lyft acquiring Motivate. From the looks of it, neither company seems willing to concede to the other in the US market, and this fight will be fought on multiple fronts, in the years to come.
The Lyft ValuationWhen valuing young companies, it is the story that drives your numbers and valuation, not historical data or current financials. I have stayed true to this perspective, in all of the valuations that I have done on ride sharing companies. In this section, I will lay out my story for Lyft, drawing on past behavior and the clues that are in their current plans, but it would be hubris to argue that I have a monopoly on the truth and a claim on the "right" story. So, feel free to disagree with me and you can use my valuation spreadsheet to reflect your disagreements.
The Story
Reviewing Lyft's (very long) prospectus, I was struck by the repetition of the mantra that it saw its future as a "US transportation" company, suggesting that the focus will remain primarily domestic and focused on transportation. While the cynical part of me argues that Lyft's use of the word "transportation" is intended to draw attention to the size of that market, which is $1.2 trillion, Lyft's history backs up their "focused" story. While I am normally leery of management stories for companies, I will adopt Lyft's story with a few changes:
It will stay a US transportation services company: The total market that I assume for US transportation services is $120 billion at the moment, well over two and a half times larger than the taxi cab market was in 2009. That is, of course, well below the size of the transportation market, but the $1.2 trillion that Lyft provides for that market includes what people spend on acquiring cars and does not reflect that they would pay for just transportation services.In a growing transportation services market: One of the striking features of the ride sharing revolution is how much it has changed consumer behavior, drawing people who would normally never have used car service into its reach. I will assume that ride sharing will continue to draw new customers, from mass transit users to self-drivers, causing the transportations services market to double over the next ten years.With strong market-wide networking benefits: In 2014, when I first valued Uber, I argued that ride sharing companies would have local, but not market-wide, networking benefits. In effect, I saw a market where six, eight or even ten ride sharing companies could co-exist, each dominating different local markets. Observing how quickly the ride sharing companies have consolidated, over the last few years, I think that I was wrong and that the networking effects are likely to be market-wide. Ultimately, I see only two or three ride sharing companies dominating the US ride sharing market, in steady state. In my story, I see Lyft as one of the winners, with a 40% market share of the US transportation services market.A sustained share of Gross Billings: The concentration of the market among two or three ride sharing companies will also give them the power to hold the line on the percentage of gross billings. That percentage, which was (arbitrarily) set at 20% of gross billings, when the ride sharing companies came into being, has morphed and changed with the advent of pooled rides and how the gross billing number is computed. Lyft, for instance, in 2018, reported revenues of $2,156 million on gross billings of $8.054 million, working out to a 26.77% share. I will assume that as Lyft continues to grow and offers new services, this number will revert back to 20%.And a shift to drivers as employees: Since their inception, the ride sharing companies have been able to maintain the facade that their drivers are independent contractors, not employees, thus providing the company legal cover, when drivers were found to be at fault of everything from driving infractions to serious crimes, as well as shelter from the expenses that the would ensue if drivers were treated as employees. As the number who work for ride sharing companies rises into the millions, states are already starting to push back, and in my view, it is only a matter of time before ride sharing companies are forced to deal with drivers as employees, causing operating margins in steady state to drop to 15%.There are some aspects of this story that some of you may find too pessimistic, and other aspects that others may find too optimistic. You are welcome to download the spreadsheet and make the story your own,
The Valuation
The story that I have for Lyft already provides the bulk of the inputs that I need to value the company. To complete the valuation, I add four more inputs related to the company:
Cost of capital: Rather than try to break down cost of capital into its constituent parts for a company that is transitioning to being a public company, I will take a short cut and give Lyft the cost of capital of 9.97%, at the 75th percentile of all US companies at the start of 2019, reflecting its status as a young, money-losing company. I will assume that this cost of capital will drift down towards the median of 8.24% for all US companies as Lyft becomes larger and profitable.Sales to capital: While Lyft will continue to operating with a low capital-intensity model, its need for reinvestment will increase, to build competitive barriers to entry and to preserve market dominance. If autonomous cars become part of the ride sharing landscape, these investment needs will become greater, I will assume revenues of $2.50 for every dollar of capital invested, in keeping with what you would expect from a technology company.Failure rate: Given that Lyft continues to lose money, with no clear pathway to generating profits, and that it will remain dependent on external capital providers to stay a going concern, I will assume that there is a 10% chance that Lyft will not survive as a going concern. Share Count: Lyft posits that it will have 240.6 million shares outstanding, including both the class A shares that will be offered to the public and the class B shares, with higher voting rights, that will be held by the founders. It also discloses that it did not include in the share count two share overhangs: (1) 6.8 million shares that are subject to option exercise, with a strike price of $4.68, and (2) 31.6 million restricted shares that had already been issued to employees, but have not vested yet. I will include both of these in shares outstanding, the options because they are so deep in the money that they are effectively outstanding shares and the restricted stock because I assume that the employees that have large numbers of RSUs will stay until vesting, to arrive at a total share count is 279.03 million.Finally, the company has not made explicit how much cash it hopes to raise from the initial public offering, but I have used the rumored value of $2 billion in new proceeds, which will be kept in the firm to cover reinvestment and operating needs, according to the prospectus. With these assumptions in place, my valuation of Lyft is below:
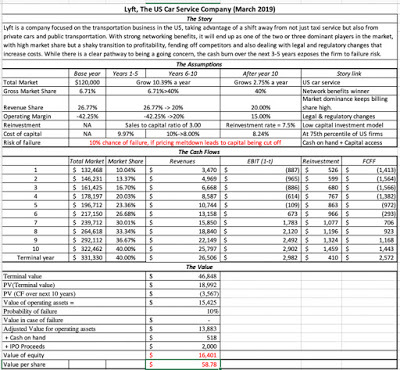 Download spreadsheetMy story for Lyft leads to a value of equity of approximately $16 billion, with the $2 billion in proceeds includes, or $14 billion, prior to the IPO cash infusion. Dividing by the 279 million shares outstanding, computed by adding the restricted shares outstanding to the share count that the company anticipates after the IPO, yields a value per share of about $59. Any story about young companies comes with ifs, ands and buts, and the Lyft story is no exception. I remain troubled by the ride sharing business model and its lack of clear pathways to profitability, but I think Lyft has picked the right strategy of staying focused both geographically (in the US) and in the transportation services business. I also am leery of the special voting rights that the founders have carved out for themselves, but that seems to have now become par for the course, at least with young tech companies. Finally, the possibility that one of the big technology companies or even an automobile company may be tempted to enter the business remains a wild card that could change the business.
The Lyft PricingI am a realist and know that when the stock opens for trading on the offering day, it is not value that will determine the opening bid, but pricing. In the pricing game, investors look at what others are paying for similar companies, scaling to some common operating variable. With publicly traded companies in mature sectors, this takes the form of an earnings (PE), cash flow (EV/EBITDA) or book value (Price to Book) multiple that can then be compared across companies. With Lyft, investors will face two challenges.
The first is that it is the first ride sharing company to list, and the only pricing that we have for other ride sharing companies is from venture capital rounds that are sometimes dated (from the middle or early last year). The second is that every company in the ride sharing business is losing money and the book values have no substance (both because the companies are young and don't invest much in physical assets). Notwithstanding these limitations, investors will still try, by scaling to any operating number that they can find that is positive, as I have tried to do in the table below:
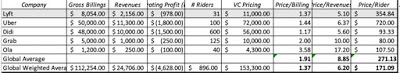
It is true that there is substantial noise in the VC pricing numbers and that the operating numbers for some of these companies are rumored or unofficial estimates. That said, desperation will drive investors to scale the VC pricing to one of these numbers with the gross billings, revenues and number of riders being the most likely choices. Uber has the highest pricing/rider and that the metric is lowest for the Asian companies, which have far more riders than their US counterparts; the revenue per rider, though, is also far lower in Asia than in the US. The companies all trade at high multiples of revenues and more moderate multiples of gross billings. In the table below, I have priced Lyft, using Uber's most recent pricing metrics as well as global averages, both simple and weighted:
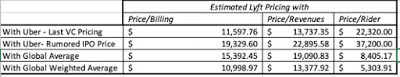
To the extent that you accept these metrics, the pricing for Lyft can range from $5 billion to $22 billion, depending on your peer comparison (Uber, Global average, Global weighted average) and your scaling variable (Gross Billings, revenues or riders). In fact, if I bring in the rumored pricing of Uber ($120 billion) into the mix, defying circular logic, I can come up with pricing in excess of $30 billion for Lyft. I think that they are all flawed, but you should not be surprised to see Lyft and its bankers to focus on the comparisons that yield the highest pricing.
Given the way the pricing game is structured, the pricing of the Lyft IPO is going to be watched closely by the rest of the ride sharing companies, since there will be a feedback effect. In fact, I think of pricing as a ladder, where if you move one rung of the ladder, all of the other rungs have to move as well. For instance, if investors price Lyft at $25 billion, about 12 times its revenue in 2018, Uber will be quicker to go public and will expect markets to attach a pricing in excess of $130 billion to it, given that its revenues were more than $11 billion in 2018. The Asian ride sharing companies, where rider numbers are high, relative to revenues, will try to market themselves on rider numbers, though it is not clear that investors will buy that pitch. Conversely, if investors price Lyft at only $12 billion, Uber may be tempted to wait to go public, and continue to tap into private investors, with the caveat being that those investors will also lower their pricing estimates. The pricing ladder can lead prices up, but they can also lead prices down, and timing is the name of the game.
The Waiting Game
It is still early and there is much that we still do not know. While some of the uncertainties will not be resolved in the near future, we will learn more specifics about the offering itself, including the amount that Lyft plans to raise on the offering day, over the next few weeks. Sometime soon, we will also get the a pricing of the company from the bankers that have been given the task of taking the company public, and I use the word "pricing" rather than "valuation" deliberately. The bankers' job is to price the company for the IPO, not value it. Not only should any talk of value from them be discounted, but if you do see a discounted cash flow valuation from a bank for Lyft, you can almost bet that it will be a Kabuki valuation, where they will go through the motions of estimating valuation inputs, when the ending number has been pre-decided.
YouTube Video
Links
Prospectus for LyftLyft ValuationLyft PricingPosts on Ride Sharing (from 2015)On the Uber Rollercoaster: Narrative Tweaks, Twists and TurnsDream Big or Stay Focused? The Lyft Answer!The Future of Ride Sharing: Playing Pundit
The Rise of Ride SharingThe ride sharing business, as we know it, traces its roots back to the Bay Area, with the founding of Uber, Sidecar and Lyft providing the key impetus, and its impact on the car service business has been immense. In a post in 2015, I traced out the growth of ride sharing and the ripple effects it has had on the car service status quo, noting that revenues for ride sharing companies have climbed, the price of a taxi cab medallion in New York city has plummeted by 80-90%. The most impressive statistic, for ride sharing companies, is not just the growth in revenues, which has been explosive, but also how much it has become part of day-to-day life, not just for younger, more tech savvy individuals but for everyone. While the growth was initially in the United States, ride sharing has taken off at an exponential rate in Asia, with India (Ola), China (Didi) and Malaysia (GrabTaxi) all developing home grown ride sharing companies. The regulatory push back has been strong in Europe, slowing growth, but there are signs that even there, ride sharing is acquiring a foothold.
There are many factors that can explain how and why ride sharing so quickly and decisively disrupted the taxi cab business, but the latter was ripe for the taking for may reasons. First, the taxi business in the 2009 had changed little in decades, refusing to incorporate advance in technology and shifting tastes, secure that it did not have to adapt, because it had a captive market. Second, in most cities, rules and regulations that were throwbacks in time or lobbied for by special interests handicapped taxi operators and gave ride sharing companies, not bound by the same rules, a decisive advantage. Third, automobiles are underutilized resources for the most part, since most cars sit idle for much of the day, and ride sharing companies took advantage of excess capacity, by letting car owners monetize it. Finally, individuals often under price their time and do not factor in long term costs in their decision making and the ride sharing companies have exploited that irrationality. I think that the MIT study in February 2018 that showed absurdly low hourly wages (less than $4/hour) for Uber and Lyft drivers was flawed, but I also don't buy into the rosy picture that the ride sharing companies paint about the income potential in driving.
It has not been all good news for ride sharing, as usage has increased. While revenues have come easily, the companies have struggled with profitability, reporting huge losses as they grow. Lyft reported losses of $911 million in 2018, in its prospectus, but Uber's loss was $1.8 billion during 2018, Didi almost matched that with a $1.6 billion loss and the only reason that Ola and GrabTaxi lost less was because they were smaller. Put simply, these company are money losing machines, at least at the moment, and if there are economies of scale kicking in, they are showing up awfully slowly. While some of this can be attributed to growing pains, that will ease as these companies age and grow bigger, a significant portion of the profitability shortfall can be attributed to how these businesses are designed. In my 2015 post, I argued that the low capital intensity (where ride sharing companies don't invest in cars) and the independent contractor model (where drivers are not employees), which made growth so easy, also conspired to make it difficult for these companies to gain economies of scale or stay away from cut throat competition.
The Playing FieldIn 2015, I argued, with tongue only half in cheek, that one possible model for the ride sharing companies to develop sustainable businesses was the Mafia's mostly successful attempt to stop intrafamily warfare in the 1930s by dividing up New York city among five families, giving each family its own fiefdom to exploit. (I prefer The Godfather version.). While that may have seemed like an outlandish comparison in 2015, it is interesting that in the years since, Uber has extricated itself from China, leaving that market to Didi, in return for a 20% stake in the company and then from South East Asia, in return for a share of GrabTaxi. In fact, the United States may be the most competitive ride sharing market in the world, with Uber and Lyft going head-to-head in most cities.
While Uber and Lyft are ride sharing companies, their evolution over the last decade offers a fascinating contrast in business models, for young companies. In a post in 2015, I drew the contrast between the two companies, as a prelude to valuing them. Uber was the "big story" company, telling investors that it wanted to be in all things logistics, expanding into delivery and moving, and all over the world. Lyft was the "focused story" company, setting itself apart from Uber by keeping its business in the United States and staying with car service, as its primary business. I argued in 2015, that given how the two companies were priced, I would rather be an investor in Lyft than Uber.
In the four years since the post, we have seen the consequences for both companies. While Uber's bigger story gained it a much higher pricing from investors, it has also brought the company a whole host of troubles, ranging from being a target for regulators to management over reach. Travis Kalanick, its high profit CEO, left the company in a messy and public divorce, and Dara Khosrowshahi, who replaced him, has scaled Uber's ambitions down, first globally by getting out of China and Southeast Asia, where it was burning through cash at an exponential rate, and then within the logistics business, by focusing on Uber Delivery as the key add on to car service. Lyft has stayed true to its US and car service focus, and it has paid off in a higher market share in the market. Both companies have jumped on the bike and scooter craze, with Uber buying Jump and Lime and Lyft acquiring Motivate. From the looks of it, neither company seems willing to concede to the other in the US market, and this fight will be fought on multiple fronts, in the years to come.
The Lyft ValuationWhen valuing young companies, it is the story that drives your numbers and valuation, not historical data or current financials. I have stayed true to this perspective, in all of the valuations that I have done on ride sharing companies. In this section, I will lay out my story for Lyft, drawing on past behavior and the clues that are in their current plans, but it would be hubris to argue that I have a monopoly on the truth and a claim on the "right" story. So, feel free to disagree with me and you can use my valuation spreadsheet to reflect your disagreements.
The Story
Reviewing Lyft's (very long) prospectus, I was struck by the repetition of the mantra that it saw its future as a "US transportation" company, suggesting that the focus will remain primarily domestic and focused on transportation. While the cynical part of me argues that Lyft's use of the word "transportation" is intended to draw attention to the size of that market, which is $1.2 trillion, Lyft's history backs up their "focused" story. While I am normally leery of management stories for companies, I will adopt Lyft's story with a few changes:
It will stay a US transportation services company: The total market that I assume for US transportation services is $120 billion at the moment, well over two and a half times larger than the taxi cab market was in 2009. That is, of course, well below the size of the transportation market, but the $1.2 trillion that Lyft provides for that market includes what people spend on acquiring cars and does not reflect that they would pay for just transportation services.In a growing transportation services market: One of the striking features of the ride sharing revolution is how much it has changed consumer behavior, drawing people who would normally never have used car service into its reach. I will assume that ride sharing will continue to draw new customers, from mass transit users to self-drivers, causing the transportations services market to double over the next ten years.With strong market-wide networking benefits: In 2014, when I first valued Uber, I argued that ride sharing companies would have local, but not market-wide, networking benefits. In effect, I saw a market where six, eight or even ten ride sharing companies could co-exist, each dominating different local markets. Observing how quickly the ride sharing companies have consolidated, over the last few years, I think that I was wrong and that the networking effects are likely to be market-wide. Ultimately, I see only two or three ride sharing companies dominating the US ride sharing market, in steady state. In my story, I see Lyft as one of the winners, with a 40% market share of the US transportation services market.A sustained share of Gross Billings: The concentration of the market among two or three ride sharing companies will also give them the power to hold the line on the percentage of gross billings. That percentage, which was (arbitrarily) set at 20% of gross billings, when the ride sharing companies came into being, has morphed and changed with the advent of pooled rides and how the gross billing number is computed. Lyft, for instance, in 2018, reported revenues of $2,156 million on gross billings of $8.054 million, working out to a 26.77% share. I will assume that as Lyft continues to grow and offers new services, this number will revert back to 20%.And a shift to drivers as employees: Since their inception, the ride sharing companies have been able to maintain the facade that their drivers are independent contractors, not employees, thus providing the company legal cover, when drivers were found to be at fault of everything from driving infractions to serious crimes, as well as shelter from the expenses that the would ensue if drivers were treated as employees. As the number who work for ride sharing companies rises into the millions, states are already starting to push back, and in my view, it is only a matter of time before ride sharing companies are forced to deal with drivers as employees, causing operating margins in steady state to drop to 15%.There are some aspects of this story that some of you may find too pessimistic, and other aspects that others may find too optimistic. You are welcome to download the spreadsheet and make the story your own,
The Valuation
The story that I have for Lyft already provides the bulk of the inputs that I need to value the company. To complete the valuation, I add four more inputs related to the company:
Cost of capital: Rather than try to break down cost of capital into its constituent parts for a company that is transitioning to being a public company, I will take a short cut and give Lyft the cost of capital of 9.97%, at the 75th percentile of all US companies at the start of 2019, reflecting its status as a young, money-losing company. I will assume that this cost of capital will drift down towards the median of 8.24% for all US companies as Lyft becomes larger and profitable.Sales to capital: While Lyft will continue to operating with a low capital-intensity model, its need for reinvestment will increase, to build competitive barriers to entry and to preserve market dominance. If autonomous cars become part of the ride sharing landscape, these investment needs will become greater, I will assume revenues of $2.50 for every dollar of capital invested, in keeping with what you would expect from a technology company.Failure rate: Given that Lyft continues to lose money, with no clear pathway to generating profits, and that it will remain dependent on external capital providers to stay a going concern, I will assume that there is a 10% chance that Lyft will not survive as a going concern. Share Count: Lyft posits that it will have 240.6 million shares outstanding, including both the class A shares that will be offered to the public and the class B shares, with higher voting rights, that will be held by the founders. It also discloses that it did not include in the share count two share overhangs: (1) 6.8 million shares that are subject to option exercise, with a strike price of $4.68, and (2) 31.6 million restricted shares that had already been issued to employees, but have not vested yet. I will include both of these in shares outstanding, the options because they are so deep in the money that they are effectively outstanding shares and the restricted stock because I assume that the employees that have large numbers of RSUs will stay until vesting, to arrive at a total share count is 279.03 million.Finally, the company has not made explicit how much cash it hopes to raise from the initial public offering, but I have used the rumored value of $2 billion in new proceeds, which will be kept in the firm to cover reinvestment and operating needs, according to the prospectus. With these assumptions in place, my valuation of Lyft is below:
 Download spreadsheetMy story for Lyft leads to a value of equity of approximately $16 billion, with the $2 billion in proceeds includes, or $14 billion, prior to the IPO cash infusion. Dividing by the 279 million shares outstanding, computed by adding the restricted shares outstanding to the share count that the company anticipates after the IPO, yields a value per share of about $59. Any story about young companies comes with ifs, ands and buts, and the Lyft story is no exception. I remain troubled by the ride sharing business model and its lack of clear pathways to profitability, but I think Lyft has picked the right strategy of staying focused both geographically (in the US) and in the transportation services business. I also am leery of the special voting rights that the founders have carved out for themselves, but that seems to have now become par for the course, at least with young tech companies. Finally, the possibility that one of the big technology companies or even an automobile company may be tempted to enter the business remains a wild card that could change the business.
The Lyft PricingI am a realist and know that when the stock opens for trading on the offering day, it is not value that will determine the opening bid, but pricing. In the pricing game, investors look at what others are paying for similar companies, scaling to some common operating variable. With publicly traded companies in mature sectors, this takes the form of an earnings (PE), cash flow (EV/EBITDA) or book value (Price to Book) multiple that can then be compared across companies. With Lyft, investors will face two challenges.
The first is that it is the first ride sharing company to list, and the only pricing that we have for other ride sharing companies is from venture capital rounds that are sometimes dated (from the middle or early last year). The second is that every company in the ride sharing business is losing money and the book values have no substance (both because the companies are young and don't invest much in physical assets). Notwithstanding these limitations, investors will still try, by scaling to any operating number that they can find that is positive, as I have tried to do in the table below:
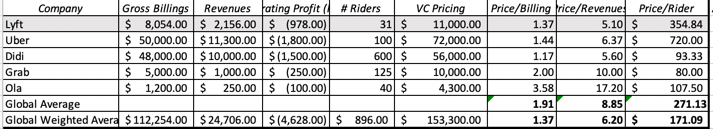
It is true that there is substantial noise in the VC pricing numbers and that the operating numbers for some of these companies are rumored or unofficial estimates. That said, desperation will drive investors to scale the VC pricing to one of these numbers with the gross billings, revenues and number of riders being the most likely choices. Uber has the highest pricing/rider and that the metric is lowest for the Asian companies, which have far more riders than their US counterparts; the revenue per rider, though, is also far lower in Asia than in the US. The companies all trade at high multiples of revenues and more moderate multiples of gross billings. In the table below, I have priced Lyft, using Uber's most recent pricing metrics as well as global averages, both simple and weighted:
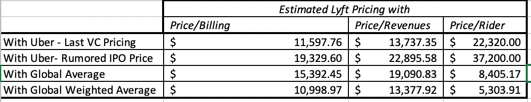
To the extent that you accept these metrics, the pricing for Lyft can range from $5 billion to $22 billion, depending on your peer comparison (Uber, Global average, Global weighted average) and your scaling variable (Gross Billings, revenues or riders). In fact, if I bring in the rumored pricing of Uber ($120 billion) into the mix, defying circular logic, I can come up with pricing in excess of $30 billion for Lyft. I think that they are all flawed, but you should not be surprised to see Lyft and its bankers to focus on the comparisons that yield the highest pricing.
Given the way the pricing game is structured, the pricing of the Lyft IPO is going to be watched closely by the rest of the ride sharing companies, since there will be a feedback effect. In fact, I think of pricing as a ladder, where if you move one rung of the ladder, all of the other rungs have to move as well. For instance, if investors price Lyft at $25 billion, about 12 times its revenue in 2018, Uber will be quicker to go public and will expect markets to attach a pricing in excess of $130 billion to it, given that its revenues were more than $11 billion in 2018. The Asian ride sharing companies, where rider numbers are high, relative to revenues, will try to market themselves on rider numbers, though it is not clear that investors will buy that pitch. Conversely, if investors price Lyft at only $12 billion, Uber may be tempted to wait to go public, and continue to tap into private investors, with the caveat being that those investors will also lower their pricing estimates. The pricing ladder can lead prices up, but they can also lead prices down, and timing is the name of the game.
The Waiting Game
It is still early and there is much that we still do not know. While some of the uncertainties will not be resolved in the near future, we will learn more specifics about the offering itself, including the amount that Lyft plans to raise on the offering day, over the next few weeks. Sometime soon, we will also get the a pricing of the company from the bankers that have been given the task of taking the company public, and I use the word "pricing" rather than "valuation" deliberately. The bankers' job is to price the company for the IPO, not value it. Not only should any talk of value from them be discounted, but if you do see a discounted cash flow valuation from a bank for Lyft, you can almost bet that it will be a Kabuki valuation, where they will go through the motions of estimating valuation inputs, when the ending number has been pre-decided.
YouTube Video
Links
Prospectus for LyftLyft ValuationLyft PricingPosts on Ride Sharing (from 2015)On the Uber Rollercoaster: Narrative Tweaks, Twists and TurnsDream Big or Stay Focused? The Lyft Answer!The Future of Ride Sharing: Playing Pundit
February 27, 2019
The Perils of Investing Idol Worship: The Kraft Heinz Lessons!
On February 22, Kraft Heinz shocked investors with a trifecta of bad news in its earnings report: sub-par operating results, a mention of accounting irregularities and a massive impairment of goodwill, and followed up by cutting dividends per share almost 40%. Investors in the company reacted by selling their shares, causing the stock price to drop more than 25% overnight. While Kraft is neither the first, nor will it be the last company, to have a bad quarter, its travails are noteworthy for a simple reason. Significant portions of the stock were held by Berkshire Hathaway (26.7%) and 3G Capital (29%), a Brazil-based private equity group. Berkshire Hathaway’s lead oracle is Warren Buffett, venerated by some who track his every utterance, and try to imitate his actions. 3G Capital might not have Buffett’s name recognition, but its lead players are viewed as ruthlessly efficient managers, capable of delivering large cost cuts. In fact, their initial joint deal to bring together Heinz and Kraft, two of the biggest names in the food business, was viewed as a master stroke, and given the pedigree of the two investors, guaranteed to succeed. As the promised benefits have failed to materialize, the investors who followed them into the deal seem to view their failure as a betrayal.
The Back StoryYou don’t have to like ketchup or processed cheese to know that Kraft and Heinz are part of American culinary history. Heinz, the older of the two companies, traces its history back to 1869, when Henry Heinz started packing and selling horseradish, and after a brief bout of bankruptcy, turned to making 57 varieties of ketchup. After a century of growth and profitability, the company hit a rough patch in the 1990s, and was targeted by activist investor, Nelson Peltz, in 2013. Shortly thereafter, Heinz was acquired by Berkshire Hathaway and 3G Capital for $23 billion, becoming a private company. Kraft started life as a cheese company in 1903, and over the next century, it expanded first into other dairy products, and then widened its repertoire to includes other processed foods. In 1981, it merged with Dart Industries, maker of Duracell batteries and Tupperware, before it was acquired by Philip Morris in 1988. After a series of convulsions, where parts of it were sold and rest merged with Nabisco, Kraft was spun off by Philip Morris (renamed Altria), and targeted by Nelson Peltz (yes, the same gentleman) in 2008. Through all the mergers, divestitures and spin offs, managers made promises of synergy and new beginnings, deal makers made money, but little of substance actually changed in the products.
In 2015, the two companies were brought together, with Berkshire Hathaway and 3G playing both match makers and deal funders, as Kraft Heinz, and the merger was completed in July 2015. At the time of the deal, there was unbridled enthusiasm on the part of investors and market observers, and part of the unquestioning acceptance that the new company would become a force in the global food business was the pedigree of the main investors. In the years since the merger, though, the company has had trouble delivering on expectations of revenue growth and cost cutting: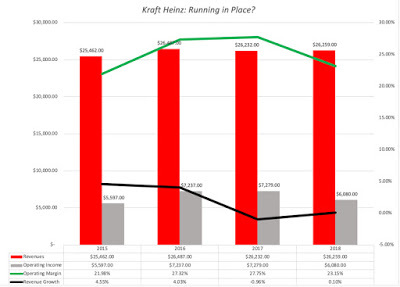
The bottom line is that while much was promised in terms of revenue growth, from expanding its global footprint, and increased margins, from cost cutting, at the time of the deal, the numbers tell a different story. In fact, if investors were surprised by the low growth and declining margins in the most recent earnings report, they should not have been, since this has been a long, slow bleed.
The Earnings ReportThe earnings report that triggered the stock price collapse, for Kraft-Heinz, was released on February 22, and it contained bad news on many fronts:Flatlining Operartions: Revenues for 2018 were unchanged from revenues in 2017, but operating income dipped (before impairment charges) from $6.2 billion in 2017 to $5.8 billion in 2018; the operating margin dropped from 23.5% in 2017 to 22% in 2018.Accounting Irregularities: In a surprise, the company also announced that it was under SEC investigation for accounting irregularities in its procurement area, and took a charge of $25 million to reflect expected adjustments to its costs.Goodwill Impairment: The company took a charge of $15.4 billion for impairment of goodwill, primarily on their US Refrigerated and Canadian Retail segments, an admission that they paid too much for acquisitions in prior years.Dividend Cuts: The company, a perennial big-dividend payer, cut its dividend per share from $2.50 to $1.60, to prepare itself for what it said would be a difficult 2019.While investors were shocked, the crumb trail leading up to this report contained key clues. Revenues had already flattened out in 2017, relative to 2016, and the decline in margins reflected difficulties that 3G faced in trying to cut costs, after the deal was made. The only people who care about impairment charges, a pointless and delayed admission of overpayment on acquisitions, are those who use book value of equity as a proxy for overall value. The dividend cuts were perhaps a surprise, but more in what they say about how panicked management must be about future operations, since a company this attached to dividends cuts them only as a last resort.
The Value EffectsWith the bad news in the earnings report still fresh, let’s consider the implications for the story for, and the value of, Kraft Heinz. The flat revenues and the declining margins, as I see them, are part of a long term trend that will be difficult, if not impossible, to reverse. While Kraft-Heinz may have a quarter or two with positive blips, I see more of the same going forward. In my valuation, I have forecast a revenue growth of 1% a year in perpetuity, less than the inflation rate, reflecting the headwinds the company faces. That downbeat revenue growth story will be accompanied by a matching “bad news” story on operating margins, where the company will face pricing pressures in its product markets, leading to a drop (though a small and gradual one) in operating margins over time, from 22% in 2018 (already down from 2017) to 20% over the next five years. The company’s cost of capital is currently 6%, reflecting the nature of its products and its use of debt, but over time, the benefits from the latter will wear thin, and since that is close to the average for the industry (US food processing companies have an average cost of capital of 6.12%), I will leave it unchanged. Finally, the mistakes of the past few years will leave at least one positive residue in the form of restructuring charges, that I assume will provide partial shelter from taxes, at least for the next two years.
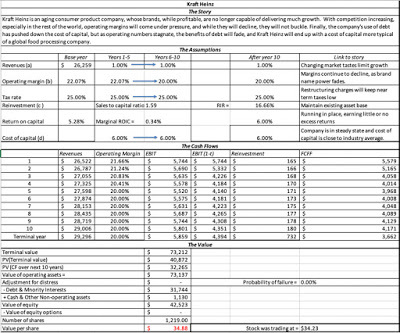 Spreadsheet with valuationThe good news is that, even with a stilted story, Kraft Heinz has a value ($34.88) that is close to the stock price ($34.23). The bad news is that the potential upside looks limited, as you can see in the results of a simulation that I did, allowing expected revenue growth, operating margin and cost of capital to be drawn from distributions, rather than using point estimates.
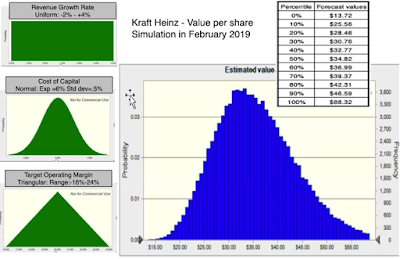 Simulation ResultsThe finding the value falls within a tight range, with the first decile at about $26 and the ninth at close to $47 should not surprise you, since the ranges on the inputs are also not wide. As an investor, here are the actions that would follow this valuation. If you owned Kraft Heinz prior to the earnings report (and I thankfully did not), selling now will accomplish little. The damage has been done already, and the stock as priced now, is a fair value investment. I know that 3G sold almost one quarter of its holding in September 2018, good timing given the earnings report, but any attempts to sell now will gain them nothing. (I made a mistake in an earlier version of the post, and I thank those of you who pointed it out.)If you don’t own Kraft Heinz, the valuation suggests that the stock is fairly valued, at today’s price, but at a lower price, it would be a good investment. I have a limit buy on the stock at a $30 price (close the 25th percentile of the distribution), and if it does hit that price, I will be a Kraft Heinz stockholder, notwithstanding the fact that I think its future does not hold promise. If it does not drop that low, there are other fish to catch and I will move on.There are two concerns, though, that investors looking at this stock have to consider. The first is that when companies claim that they have discovered accounting irregularities, but that they have cleaned up their act, they are often dissembling and that there are more shocks to come. With Kraft Heinz, the magnitude of the irregularity is small, and given that they have no history of playing accounting games, I am willing to given them the benefit of the doubt. The second is that the company does carry $32 billion in debt, and while that debt has no toxic side effects today, that is because the company is perceived to have stable and positive cash flows. If the margin decline that I forecast becomes a margin rout, the debt will expose the company to a clear and present danger of default. Put simply, it will make the bad case scenarios that are embedded in the simulation worse, and perhaps threaten the company’s existence.
The LessonsThere are lessons in the Kraft-Heinz blow-up, but I will tread carefully, since I risk offending some, with talk that you may view as not just incorrect but sacrilegious:It is human to err: At the risk of stating the obvious, Warren Buffett and 3G’s key operators are human, and are prone to not only making mistakes, like the rest of us, but also to have blind spots in investing that hurt them. In fact, Buffett has been open about his mistakes, and how much they have cost him and Berkshire Hathaway shareholders. He has also been candid about his blind spots, which include an unwillingness to invest in businesses that he does not understand, a sphere that only grows as he gets older and the economy changes, and an excessive trust in the managers of the companies that he invests in. While he is, for the most part, an excellent judge of character, his investments in Wells Fargo, Coca Cola and Kraft-Heinz show that he is not perfect. The fault, in my view, is not with Buffett, but with the legions of investors, analysts and journalists who treat him as an investment deity, quoting his words as gospel and tarring and feathering anyone who dares to question them. Stocks are not bonds: In my data posts, I looked at how companies in the United States have moved away from dividends to buybacks, as a way of returning cash. That trend, though, has not been universally welcomed by investors, and there remains a significant subset of investors, with strategies built around buying stocks with big dividends. One reason that stocks like Kraft Heinz become attractive conservative value investors is because they offer high dividend yields, often much higher than what you could earn investing in treasury or even safe corporate bonds. In effect, the rationale that investors use is that by buying these shares, they are in effect getting a bond (with the dividends replacing coupons), with price appreciation. From the Dogs of the Dow to screening based upon dividend yields, the underlying premise is that investors can count more on dividends than on buybacks. While it is true that dividends are stickier than buybacks, with many companies maintaining or increasing dividends over time, these dividend-based strategies become delusional when they treat dividends as obligated payments, rather than expected ones. After all, much as companies do not like to cut dividends, they are not contractually obligated to pay dividends. In fact, when a stock carries a dividend yield that looks too good to be true, it is usually almost always an unsustainable dividends, and it is only a question of time before dividends are cut (or even stopped) or the company drives itself into a financial ditch. Brand Names last a long time, but nothing lasts forever: A major lodestone of conventional value investing is that while technology, cost efficiencies and new products are all competitive advantages that can generate value, it is brand name that is the moat that has the most staying power. Again, that statement reflects a truth, which is that brand names last long, often stretching over decades, but even brand name benefits fade, as customers change and companies seek to become global. The troubles at Kraft-Heinz are part of a much bigger story, where some of the most recognized and valued brand names of the twentieth century, from Coca Cola to McDonalds, are finding that their magic fading. Using my life cycle terminology, these companies are aging and no amount of financial engineering or strategic repositioning is going to make them young again. Cost cutting can take you far, but no further: For the last few decades, we have cut a great deal of slack for those who use cost cutting as their pathway for creating value, with many leveraged buyouts and restructurings built almost entirely on its promise. Don’t get me wrong! In firms with significant cost inefficiencies and bloat, cost cutting can deliver significant gains in profits, but even with these firms, those gains will be time limited, since there is only so much fat to cut out. Worse, there are firms that find themselves in trouble for a myriad of reasons that have little to do with cost inefficiencies and cutting costs as these firms is a recipe for disaster. It is true that 3G did a masterful job, cutting costs and increasing margins at Mexico's Grupo Modelo, the Mexican brewer that they acquired through Inbev, but that was because Modelo’s problems lent themselves to a cost-cutting solution. It may even have worked at Kraft-Heinz initially, but at this point, the company’s problems may have little to do with cost inefficiencies, and much to do with a stable of products that is less appealing to customers than it used to be, and cost cutting is the wrong medicine for whatever ails them.ConclusionI hope that you do not read this as a hit piece on Warren Buffett and/or 3G. I admire Buffett’s adherence to a core philosophy and his willingness to be open about his mistakes, but I think he is ill served by some of his devotees, who insist on putting him on a pedestal and refuse to accept the reality that his philosophy has its limits, and that like the rest of us, he has an ego and makes mistakes. If you have faith in value investing, you should be willing to have that faith tested by the mistakes that you and the people you admire make in its pursuit. If your investment views are dogma, and you believe that your path is only the correct one to success, I wish you the best, but your righteousness and rigidity will only set you up for more disappointments like Kraft Heinz.
YouTube Video
DataValuation of Kraft Heinz on February 26, 2019Kraft Heinz Simulation Results
The Back StoryYou don’t have to like ketchup or processed cheese to know that Kraft and Heinz are part of American culinary history. Heinz, the older of the two companies, traces its history back to 1869, when Henry Heinz started packing and selling horseradish, and after a brief bout of bankruptcy, turned to making 57 varieties of ketchup. After a century of growth and profitability, the company hit a rough patch in the 1990s, and was targeted by activist investor, Nelson Peltz, in 2013. Shortly thereafter, Heinz was acquired by Berkshire Hathaway and 3G Capital for $23 billion, becoming a private company. Kraft started life as a cheese company in 1903, and over the next century, it expanded first into other dairy products, and then widened its repertoire to includes other processed foods. In 1981, it merged with Dart Industries, maker of Duracell batteries and Tupperware, before it was acquired by Philip Morris in 1988. After a series of convulsions, where parts of it were sold and rest merged with Nabisco, Kraft was spun off by Philip Morris (renamed Altria), and targeted by Nelson Peltz (yes, the same gentleman) in 2008. Through all the mergers, divestitures and spin offs, managers made promises of synergy and new beginnings, deal makers made money, but little of substance actually changed in the products.
In 2015, the two companies were brought together, with Berkshire Hathaway and 3G playing both match makers and deal funders, as Kraft Heinz, and the merger was completed in July 2015. At the time of the deal, there was unbridled enthusiasm on the part of investors and market observers, and part of the unquestioning acceptance that the new company would become a force in the global food business was the pedigree of the main investors. In the years since the merger, though, the company has had trouble delivering on expectations of revenue growth and cost cutting:

The bottom line is that while much was promised in terms of revenue growth, from expanding its global footprint, and increased margins, from cost cutting, at the time of the deal, the numbers tell a different story. In fact, if investors were surprised by the low growth and declining margins in the most recent earnings report, they should not have been, since this has been a long, slow bleed.
The Earnings ReportThe earnings report that triggered the stock price collapse, for Kraft-Heinz, was released on February 22, and it contained bad news on many fronts:Flatlining Operartions: Revenues for 2018 were unchanged from revenues in 2017, but operating income dipped (before impairment charges) from $6.2 billion in 2017 to $5.8 billion in 2018; the operating margin dropped from 23.5% in 2017 to 22% in 2018.Accounting Irregularities: In a surprise, the company also announced that it was under SEC investigation for accounting irregularities in its procurement area, and took a charge of $25 million to reflect expected adjustments to its costs.Goodwill Impairment: The company took a charge of $15.4 billion for impairment of goodwill, primarily on their US Refrigerated and Canadian Retail segments, an admission that they paid too much for acquisitions in prior years.Dividend Cuts: The company, a perennial big-dividend payer, cut its dividend per share from $2.50 to $1.60, to prepare itself for what it said would be a difficult 2019.While investors were shocked, the crumb trail leading up to this report contained key clues. Revenues had already flattened out in 2017, relative to 2016, and the decline in margins reflected difficulties that 3G faced in trying to cut costs, after the deal was made. The only people who care about impairment charges, a pointless and delayed admission of overpayment on acquisitions, are those who use book value of equity as a proxy for overall value. The dividend cuts were perhaps a surprise, but more in what they say about how panicked management must be about future operations, since a company this attached to dividends cuts them only as a last resort.
The Value EffectsWith the bad news in the earnings report still fresh, let’s consider the implications for the story for, and the value of, Kraft Heinz. The flat revenues and the declining margins, as I see them, are part of a long term trend that will be difficult, if not impossible, to reverse. While Kraft-Heinz may have a quarter or two with positive blips, I see more of the same going forward. In my valuation, I have forecast a revenue growth of 1% a year in perpetuity, less than the inflation rate, reflecting the headwinds the company faces. That downbeat revenue growth story will be accompanied by a matching “bad news” story on operating margins, where the company will face pricing pressures in its product markets, leading to a drop (though a small and gradual one) in operating margins over time, from 22% in 2018 (already down from 2017) to 20% over the next five years. The company’s cost of capital is currently 6%, reflecting the nature of its products and its use of debt, but over time, the benefits from the latter will wear thin, and since that is close to the average for the industry (US food processing companies have an average cost of capital of 6.12%), I will leave it unchanged. Finally, the mistakes of the past few years will leave at least one positive residue in the form of restructuring charges, that I assume will provide partial shelter from taxes, at least for the next two years.
 Spreadsheet with valuationThe good news is that, even with a stilted story, Kraft Heinz has a value ($34.88) that is close to the stock price ($34.23). The bad news is that the potential upside looks limited, as you can see in the results of a simulation that I did, allowing expected revenue growth, operating margin and cost of capital to be drawn from distributions, rather than using point estimates.
 Simulation ResultsThe finding the value falls within a tight range, with the first decile at about $26 and the ninth at close to $47 should not surprise you, since the ranges on the inputs are also not wide. As an investor, here are the actions that would follow this valuation. If you owned Kraft Heinz prior to the earnings report (and I thankfully did not), selling now will accomplish little. The damage has been done already, and the stock as priced now, is a fair value investment. I know that 3G sold almost one quarter of its holding in September 2018, good timing given the earnings report, but any attempts to sell now will gain them nothing. (I made a mistake in an earlier version of the post, and I thank those of you who pointed it out.)If you don’t own Kraft Heinz, the valuation suggests that the stock is fairly valued, at today’s price, but at a lower price, it would be a good investment. I have a limit buy on the stock at a $30 price (close the 25th percentile of the distribution), and if it does hit that price, I will be a Kraft Heinz stockholder, notwithstanding the fact that I think its future does not hold promise. If it does not drop that low, there are other fish to catch and I will move on.There are two concerns, though, that investors looking at this stock have to consider. The first is that when companies claim that they have discovered accounting irregularities, but that they have cleaned up their act, they are often dissembling and that there are more shocks to come. With Kraft Heinz, the magnitude of the irregularity is small, and given that they have no history of playing accounting games, I am willing to given them the benefit of the doubt. The second is that the company does carry $32 billion in debt, and while that debt has no toxic side effects today, that is because the company is perceived to have stable and positive cash flows. If the margin decline that I forecast becomes a margin rout, the debt will expose the company to a clear and present danger of default. Put simply, it will make the bad case scenarios that are embedded in the simulation worse, and perhaps threaten the company’s existence.
 The LessonsThere are lessons in the Kraft-Heinz blow-up, but I will tread carefully, since I risk offending some, with talk that you may view as not just incorrect but sacrilegious:It is human to err: At the risk of stating the obvious, Warren Buffett and 3G’s key operators are human, and are prone to not only making mistakes, like the rest of us, but also to have blind spots in investing that hurt them. In fact, Buffett has been open about his mistakes, and how much they have cost him and Berkshire Hathaway shareholders. He has also been candid about his blind spots, which include an unwillingness to invest in businesses that he does not understand, a sphere that only grows as he gets older and the economy changes, and an excessive trust in the managers of the companies that he invests in. While he is, for the most part, an excellent judge of character, his investments in Wells Fargo, Coca Cola and Kraft-Heinz show that he is not perfect. The fault, in my view, is not with Buffett, but with the legions of investors, analysts and journalists who treat him as an investment deity, quoting his words as gospel and tarring and feathering anyone who dares to question them. Stocks are not bonds: In my data posts, I looked at how companies in the United States have moved away from dividends to buybacks, as a way of returning cash. That trend, though, has not been universally welcomed by investors, and there remains a significant subset of investors, with strategies built around buying stocks with big dividends. One reason that stocks like Kraft Heinz become attractive conservative value investors is because they offer high dividend yields, often much higher than what you could earn investing in treasury or even safe corporate bonds. In effect, the rationale that investors use is that by buying these shares, they are in effect getting a bond (with the dividends replacing coupons), with price appreciation. From the Dogs of the Dow to screening based upon dividend yields, the underlying premise is that investors can count more on dividends than on buybacks. While it is true that dividends are stickier than buybacks, with many companies maintaining or increasing dividends over time, these dividend-based strategies become delusional when they treat dividends as obligated payments, rather than expected ones. After all, much as companies do not like to cut dividends, they are not contractually obligated to pay dividends. In fact, when a stock carries a dividend yield that looks too good to be true, it is usually almost always an unsustainable dividends, and it is only a question of time before dividends are cut (or even stopped) or the company drives itself into a financial ditch. Brand Names last a long time, but nothing lasts forever: A major lodestone of conventional value investing is that while technology, cost efficiencies and new products are all competitive advantages that can generate value, it is brand name that is the moat that has the most staying power. Again, that statement reflects a truth, which is that brand names last long, often stretching over decades, but even brand name benefits fade, as customers change and companies seek to become global. The troubles at Kraft-Heinz are part of a much bigger story, where some of the most recognized and valued brand names of the twentieth century, from Coca Cola to McDonalds, are finding that their magic fading. Using my life cycle terminology, these companies are aging and no amount of financial engineering or strategic repositioning is going to make them young again. Cost cutting can take you far, but no further: For the last few decades, we have cut a great deal of slack for those who use cost cutting as their pathway for creating value, with many leveraged buyouts and restructurings built almost entirely on its promise. Don’t get me wrong! In firms with significant cost inefficiencies and bloat, cost cutting can deliver significant gains in profits, but even with these firms, those gains will be time limited, since there is only so much fat to cut out. Worse, there are firms that find themselves in trouble for a myriad of reasons that have little to do with cost inefficiencies and cutting costs as these firms is a recipe for disaster. It is true that 3G did a masterful job, cutting costs and increasing margins at Mexico's Grupo Modelo, the Mexican brewer that they acquired through Inbev, but that was because Modelo’s problems lent themselves to a cost-cutting solution. It may even have worked at Kraft-Heinz initially, but at this point, the company’s problems may have little to do with cost inefficiencies, and much to do with a stable of products that is less appealing to customers than it used to be, and cost cutting is the wrong medicine for whatever ails them.ConclusionI hope that you do not read this as a hit piece on Warren Buffett and/or 3G. I admire Buffett’s adherence to a core philosophy and his willingness to be open about his mistakes, but I think he is ill served by some of his devotees, who insist on putting him on a pedestal and refuse to accept the reality that his philosophy has its limits, and that like the rest of us, he has an ego and makes mistakes. If you have faith in value investing, you should be willing to have that faith tested by the mistakes that you and the people you admire make in its pursuit. If your investment views are dogma, and you believe that your path is only the correct one to success, I wish you the best, but your righteousness and rigidity will only set you up for more disappointments like Kraft Heinz.
YouTube Video
DataValuation of Kraft Heinz on February 26, 2019Kraft Heinz Simulation Results
February 22, 2019
January 2019 Data Update 9: The Pricing Game
In my last eight posts, I looked at aspects of corporate behavior from investments to financing to dividend policy, using the data that I collected at the start of 2019, to examine what companies share in common, and what makes them different. In summary, I found that the rise in risk premiums in both equity and bond markets in 2018 have pushed up costs of equity and capital, that companies across the globe are finding it difficult to generate returns on their investments that exceed their costs of funding, and that many of them, especially in mature businesses, are returning more cash, much of it in the form of buybacks. Since all of the companies in my data set are publicly traded, there is one final number that I have not addressed directly in my posts so far, and that is the market pricing of these companies. In this post, I complete my data update series, by looking at how pricing varies across companies, sectors and geographies, and what lessons investors can draw from the data.
Value versus Price: The DifferenceI have posted many times on the between the value of an asset and its' pricing, but I don't think it hurts to revisit that difference. The determinants of value are simple, although not always easy to estimate. Whether you are valuing start-up businesses, emerging market firms, or commodity companies, the values are driven by expected cash flows, growth, and risk. Although a discounted cash flow valuation is often the tool that we used to give form to these fundamentals, in the form of cash flows, growth rates in these cash flows, and discount rates, it is not the only pathway to intrinsic value. The determinants of price are demand and supply, and while fundamentals do affect both, mood and momentum are also strong forces in pricing. These “animal spirits,” as behavioral economists might tag them, can not only cause price to diverge from value, but also require different tools to be used to assess the right pricing for an asset. With many assets and businesses, pricing an asset usually involves standardizing a price (a multiple), finding similar or comparable assets that are already priced in the marketplace, and controlling for differences. The picture below, which I have used many times before, captures the two processes:
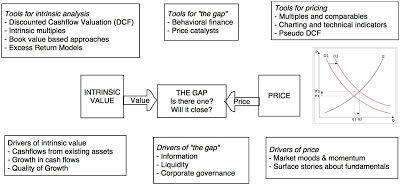 The reason that I reuse this picture so much is because, to me, it is an all-encompassing snapshot of every conceivable investment philosophy that exists in the market:Efficient Marketers: If you believe that markets are efficient, the two processes will generate the same number, and any gap that exists will be purely random and quickly closed.Investors: If you are an investor, whether value or growth, and you truly mean it, your view is that the pricing process, for one reason or the other, can deliver a price different from your estimate of value and that the gap that exists will close, as the price converges to value. The difference between value and growth investors lies in where you think markets are most likely to make mistakes (in valuing existing assets or growth opportunities) and correct them. In essence, you are as much a believer in efficient markets as the first group, with the only difference being that you believe markets become efficient after you have taken your position on a stock. Traders: If you are a trader, you start off with either the presumption that there is no such thing as intrinsic value, or that it exists, but that no one can estimate it. You play the pricing game, effectively using your skills at gauging momentum and forecasting the effects of corporate news on prices, to buy at a low price and sell at a high price.Market participants are most exposed to danger when they are delusional about the game that they are playing. Many portfolio managers, for instance, claim to be investors, playing the value game, while using pricing screens (PE and growth, PBV and ROE) and adding to their holdings of momentum stocks. Many traders seem to think that they will be viewed as deeper and more accomplished if they talk the value talk, while using charts and technical indicators in the closet, to make their stock picks.
The Pricing ProcessThe essence of pricing is attaching a number to an asset or company, based upon how similar assets and companies are being priced in the market. To get insight into how to price an asset, a business or a company, you should break down the pricing process into steps: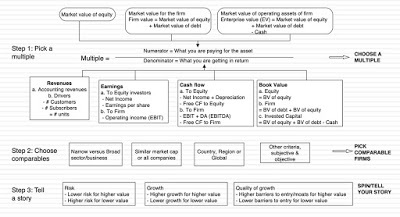
You may be a little puzzled by the first step in the process, where I standardize the price, but the reason is simple. You cannot compare price per share across companies, since it is a function of the share count, which can be changed overnight in a stock split. To standardize prices, you scale them to some variable that all of the assets in the peer group share. With real estate properties, you divide the price of each property by its square footage to arrive at a price/square foot that can be compared across properties. With businesses, you scale pricing to an operating variable, with earnings being the most obvious choice, but it can be revenues, cash flows or book value. Note that any multiple that you find on a stock or company is embedded in this definition, ranging from PE ratios to EV/EBITDA multiples to revenue multiples, and even beyond, to market price per subscriber or user. The second step in the process, i.e., finding similar assets and companies, should make clear the fact that this is a process that requires subjective judgments and is open to bias, just as is the case in intrinsic valuation. If you are pricing Nvidia, for instance, you determine how narrowly or broadly you define the peer group, and which companies to deem to be "similar". The third step int he process requires controlling for differences across companies. Put simply, if the company that you are pricing has higher growth or lower risk or better returns on its investments on it projects that the companies in the peer group, you have to adjust the pricing to reflect it, either subjectively, as many analysts do, with story telling, or objectively, by bringing in key variables into the estimation process.
Pricing the Markets in January 2019Rather than taking you through multiple after multiple, and overwhelming with pictures and tables on each one, I will list out what I learned by looking at the pricing of all publicly traded stocks around the world, in early 2019, in a series of pricing propositions.
Pricing Proposition 1: Absolute rules don't belong in a relative world!Paraphrasing Einstein, everything is relative, if you are pricing companies. Is a PE ratio of five low? Not if half the stocks in the market trade at less than five. Is an EV/EBITDA of forty high? Perhaps in some sectors, but not if you are comparing high growth companies in a highly priced sector. Old time value investing is filled with rules of thumb, and many of these rules are devised around absolute values for PE or PEG ratios or Price to Book, at odds with the very notion of pricing. If you want to make pricing statements about what comprises cheap or expensive, you should be looking at the distribution of the multiple across the market. Thus, to form pricing rules on US stocks at the start of 2019, I looked the distribution of current, forward and trailing PE ratios for US stocks on January 1, 2019: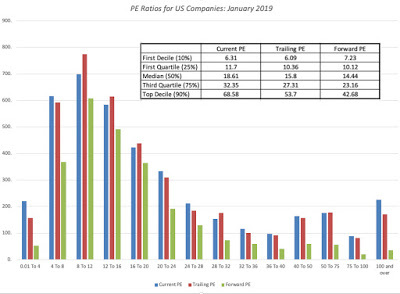
At the start of 2019, a low trailing PE ratio for a US stock would have been 6.09, if you used the lowest decile or 10.36, if you moved to the first quartile, and a high PE ratio, using the same approach, would have been 27.31, with the third quartile, or 53.70, with the top decile. Lest I be accused of picking on value investors, they are not the only or even the biggest culprits, when it comes to absolute rules. Private equity investors and LBO initiators have built their own set of screens. I have lost count of the number of times I have heard it said that an EV to EBITDA less than six (or five or seven) must mean that a company is not just cheap, but a good candidate for leverage, but is that true? To answer the question, I looked at the EV to EBITDA multiples across companies, across regions of the world.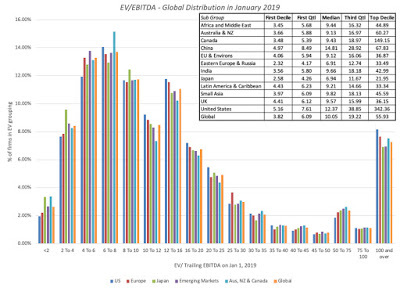 If you wield a pricing bludgeon and declare all companies that trade at less than six times EBITDA to be cheap, you will find about half of all stocks in Russia to be bargains. Even globally, you should hav no trouble finding investments to make with this rule, since almost one quarter of all companies trade at less than six times EBITDA. My point is not that that you cannot have rules of thumb, since they do exist for a reason, but that those rules, in a pricing world, have to be scaled to the data. Thus, if you want to define the first decile as your measure of what comprises cheap, why not make it the first decile? That would mean that an EV to EBITDA multiple less than 5.16 would be cheap in the US on January 1, 2019, but that number would have to recalibrated as the market moves up or down.
Pricing Proposition 2: Markets have a great deal in common, when it comes to pricing, but the differences can be revealing!Much is made about the differences across global equity markets, and especially about the divide between emerging and developed market companies, when it comes to pricing, with delusions running deep on both sides. Emerging market analysts are convinced that stocks are priced very differently, and often more irrationally, in their local markets, leaving them free to devise their own rules for their markets. Conversely, developed market analysts often bring perspectives about what comprises high, low or average pricing ratios, built up through decades of exposure to US and European markets, to emerging markets and find them puzzling. The data tells a different story, with pricing ratios around the world having distributional characteristics that are surprisingly similar across different parts of the world:
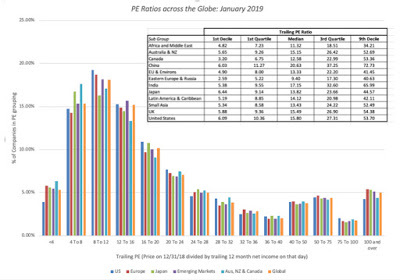 While the levels of PE ratios vary across regions, with Chinese stocks having the highest median PE ratios (20.63) and Russian and East European stocks the lowest (9.40), they all have the same asymmetric look, with a peak to the left (since PE ratios cannot be lower than zero) and a tail to the right (there is no cap on PE ratios). That asymmetry, which is shared by all pricing multiples, is the reason that you should always be cautious about any pricing argument that is built on comparisons to the average PE or PBV, since those numbers will be skewed upwards because of the asymmetry. While it is true that markets share common characteristics, when it comes to pricing, the differences in levels are also worth paying attention to, when investing. A global fund manager who ignores these differences, and picks stocks based upon PE ratios alone, will end up with a portfolio that is dominated by African, Midde East and Russian stocks, not a recipe for investing success.
Pricing Proposition 3: Book value is the most overrated metric in investingI have never understood the reverence that some investors seem to hold for book value, as revealed in the number of investing adages built around it. Stocks that trade at less than book value are considered cheap, and companies that build up book value are considered to be value creating. At the root of the "book value" focus are two assumptions, sometimes stated but often implicit. The first is that the book value is a measure of liquidation value, an estimate of what investors would get if they shut down the company today and sold its assets. The second is that accountants are consistent and conservative in estimating asset value, unlike markets, which are prone to mood swings. Both assumptions are built on foundations of sand, since book value is not a good measure of liquidation value in most sectors, and accountants are both inconsistent and slow-moving, when it comes to estimating and adjusting book value. Again, to get perspective, let's look at the price to book ratios around the world, at the start of 2019: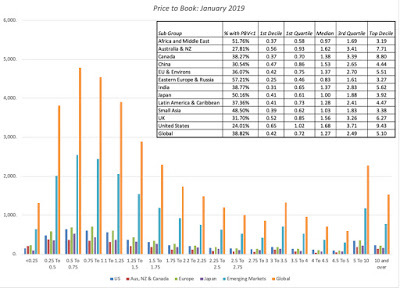 If you believe that stocks that trade at less than book value are cheap, you will again find lots of bargains in the Middle East, Africa and Russia, but even in markets like the United States, where less than a quarter of all companies trade at less than book value, they tend to be clustered in industries that are in capital intensive (at least as defined by accountants) and declining businesses.
 PBV by Industry (US)Note that among the US industries with the fewest stocks that trade at less than book value are a large number of technology and consumer product companies, with utilities and basic chemicals being the only surprises. On the list of US industry groups with the highest percentage of stocks that trade at less than book value are oil companies (at different stages of the business), old time manufacturing companies and life insurance. If you pick your stocks based upon low price to book, in January 2019, your portfolio will be weighted with companies in the latter group, a prospect that should concern you.
Pricing Proposition 4: Most stocks that look cheap deserve to be cheap!There are traders who have little time for fundamentals, arguing that they have little or no role to play in day to day movements of stock prices. That is probably true, but fundamentals do have significant explanatory power, when it comes to why some companies trade at low multiples of earnings or book value and others are high multiples. To understand the link, I find it most useful to go back to a simple intrinsic value model, and with simple algebraic manipulation, make it a model for a pricing multiple. The picture below shows the paths you would take with an equity multiple (Price to Book) and an enterprise value (EV/Sales) to arrive at their determinants: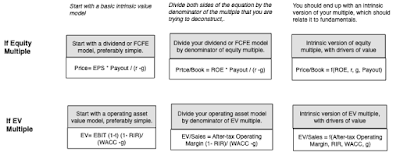
Now what? If you buy into the intrinsic view of a price to book ratio, it should be higher for firms that earn high returns on equity, have higher growth and lower risk, and lower for firms that earn low returns on equity, have lower growth and higher risk. Does the market price in fundamentals? For the most part, the answer is yes, as you can see even in the tables that I have provided in this post so far. Russian stocks have the lowest PE ratios, but that reflects the corporate governance concerns and country risk that investors have when investing in them. Chinese stocks in contrast have the highest PE ratios, because even with stepped down growth prospects for the country, they have higher expected growth than most developed market companies. Looking at stocks with the lowest price to book ratios, Middle Eastern stocks have a disproportionate representation because they earn low returns on equity and the industry groupings with the lowest price to book (oil industry groups, steel etc.) also share that feature. Pricing, done right, is therefore a search for mismatches, i.e., companies that look cheap on a pricing multiple without an obvious fundamental that explains it. This table captures some of the mismatches: table.tableizer-table { font-size: 12px; border: 1px solid #CCC; font-family: Arial, Helvetica, sans-serif; } .tableizer-table td { padding: 4px; margin: 3px; border: 1px solid #CCC; } .tableizer-table th { background-color: #104E8B; color: #FFF; font-weight: bold; }
MultipleKey DriverValuation MismatchPE ratioExpected growthLow PE stock with high expected growth rate in earnings per sharePBV ratioROELow PBV stock with high ROEEV/EBITDAReinvestment rateLow EV/EBITDA stock with low reinvestment needsEV/capitalReturn on capitalLow EV/capital stock with high return on capitalEV/salesAfter-tax operating marginLow EV/sales ratio with a high after-tax operating margin
Pricing Proposition 5: In pricing, it is not about what "should be" priced in, but "what is" priced in!In the last proposition, I argued that markets for the most part are sensible, pricing in fundamentals when pricing stocks, but there will be exceptions, and sometimes large ones, where entire sectors are priced on variables that have little to do with fundamentals, at least on the surface. This is especially true if the companies in a sector are early in their life cycles and have little to show in revenues, very little (or even negative) book value and are losing money on every earnings measure. Desperation drives investors to look for other variables to explain prices, resulting in companies being priced based upon website visitors (at the peak of the dot com boom), numbers of users (at the start of the social media craze) and numbers of subscribers.
I noted this phenomenon, when I priced Twitter ahead of its IPO in 2013, and argued that to price Twitter, you should look at its user base (about 240 million at the time) and what markets were paying per user at the time (about $130) to arrive at a pricing of $24 billion, well above my estimate of intrinsic value of $11 billion for the company at a time, but much closer to the actual pricing, right after the IPO. It is therefore neither surprising nor newsworthy that venture capitalists and equity research analysts are more focused on these pricing metrics, when assessing how much to pay for stocks, and companies, knowing this, play along, by emphasizing them in their earnings reports and news releases.
ConclusionI do believe in intrinsic value, and think of myself more as an investor than a trader, but I am not a valuation snob. I chose the path I did because it works for me and reflects my beliefs, but it would be both arrogant and wrong for me to argue that being a trader and playing the pricing game is somehow less worthy of respect or returns. In fact, the end game for both investors and traders is to make money, and if you can make money by screening stocks using PE ratios or technical indicators, and timing your entry/exit by looking at charts, all the more power to you! If there is a point to this post, it is that a great deal of pricing, as practiced today, is sloppy and ignores, or throws away, data that can be used to make pricing better.
YouTube Video
Data LinksPE ratios by industry grouping: US, Europe, Emerging Markets, Japan, Australia & Canada, India and ChinaBook Value Multiples by industry grouping: US, Europe, Emerging Markets, Japan, Australia & Canada, India and ChinaEV to EBIT & EBITDA by industry grouping: US, Europe, Emerging Markets, Japan, Australia & Canada, India and ChinaEV to Sales by industry grouping: US, Europe, Emerging Markets, Japan, Australia & Canada, India and ChinaPricing Multiples, by countryJanuary 2019 Data UpdatesData Update 1: A Reminder that equities are risky, in case you forgot!Data Update 2: The Message from Bond MarketsData Update 3: Playing the Numbers GameData Update 4: The Many Faces of RiskData Update 5: Of Hurdle Rates and Funding Costs!Data Update 6: Profitability and Value Creation!Data Update 7: Debt, neither poison nor nectar!Data Update 8: Dividends and Buybacks - Fact and Fiction!Data Update 9: Playing the Pricing Game!
Value versus Price: The DifferenceI have posted many times on the between the value of an asset and its' pricing, but I don't think it hurts to revisit that difference. The determinants of value are simple, although not always easy to estimate. Whether you are valuing start-up businesses, emerging market firms, or commodity companies, the values are driven by expected cash flows, growth, and risk. Although a discounted cash flow valuation is often the tool that we used to give form to these fundamentals, in the form of cash flows, growth rates in these cash flows, and discount rates, it is not the only pathway to intrinsic value. The determinants of price are demand and supply, and while fundamentals do affect both, mood and momentum are also strong forces in pricing. These “animal spirits,” as behavioral economists might tag them, can not only cause price to diverge from value, but also require different tools to be used to assess the right pricing for an asset. With many assets and businesses, pricing an asset usually involves standardizing a price (a multiple), finding similar or comparable assets that are already priced in the marketplace, and controlling for differences. The picture below, which I have used many times before, captures the two processes:
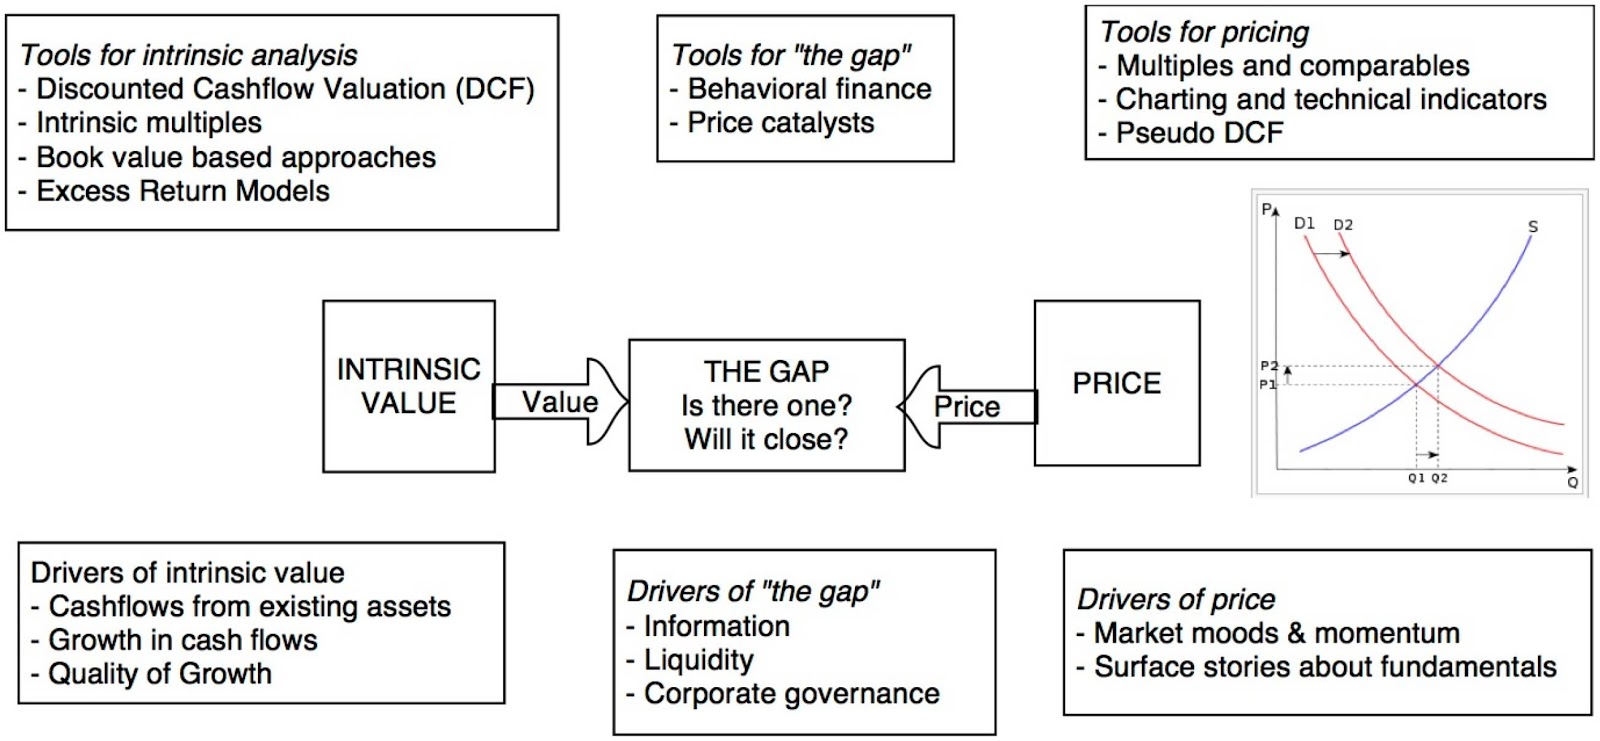 The reason that I reuse this picture so much is because, to me, it is an all-encompassing snapshot of every conceivable investment philosophy that exists in the market:Efficient Marketers: If you believe that markets are efficient, the two processes will generate the same number, and any gap that exists will be purely random and quickly closed.Investors: If you are an investor, whether value or growth, and you truly mean it, your view is that the pricing process, for one reason or the other, can deliver a price different from your estimate of value and that the gap that exists will close, as the price converges to value. The difference between value and growth investors lies in where you think markets are most likely to make mistakes (in valuing existing assets or growth opportunities) and correct them. In essence, you are as much a believer in efficient markets as the first group, with the only difference being that you believe markets become efficient after you have taken your position on a stock. Traders: If you are a trader, you start off with either the presumption that there is no such thing as intrinsic value, or that it exists, but that no one can estimate it. You play the pricing game, effectively using your skills at gauging momentum and forecasting the effects of corporate news on prices, to buy at a low price and sell at a high price.Market participants are most exposed to danger when they are delusional about the game that they are playing. Many portfolio managers, for instance, claim to be investors, playing the value game, while using pricing screens (PE and growth, PBV and ROE) and adding to their holdings of momentum stocks. Many traders seem to think that they will be viewed as deeper and more accomplished if they talk the value talk, while using charts and technical indicators in the closet, to make their stock picks.
The Pricing ProcessThe essence of pricing is attaching a number to an asset or company, based upon how similar assets and companies are being priced in the market. To get insight into how to price an asset, a business or a company, you should break down the pricing process into steps:
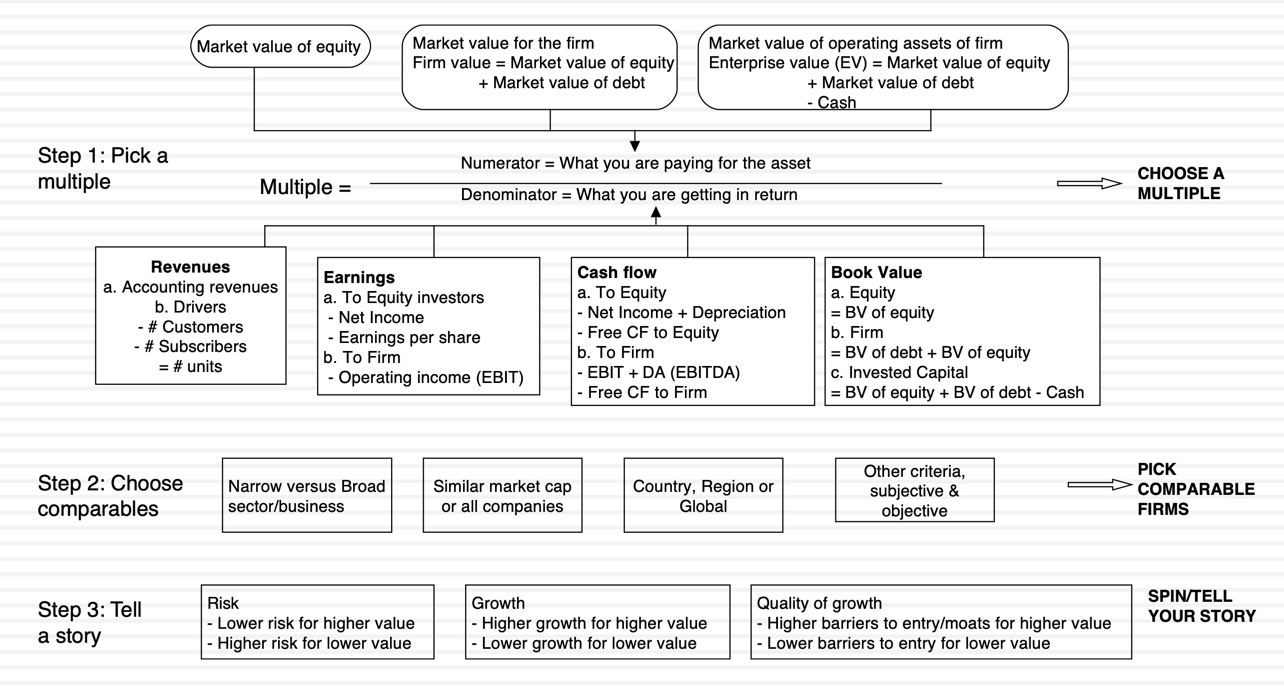
You may be a little puzzled by the first step in the process, where I standardize the price, but the reason is simple. You cannot compare price per share across companies, since it is a function of the share count, which can be changed overnight in a stock split. To standardize prices, you scale them to some variable that all of the assets in the peer group share. With real estate properties, you divide the price of each property by its square footage to arrive at a price/square foot that can be compared across properties. With businesses, you scale pricing to an operating variable, with earnings being the most obvious choice, but it can be revenues, cash flows or book value. Note that any multiple that you find on a stock or company is embedded in this definition, ranging from PE ratios to EV/EBITDA multiples to revenue multiples, and even beyond, to market price per subscriber or user. The second step in the process, i.e., finding similar assets and companies, should make clear the fact that this is a process that requires subjective judgments and is open to bias, just as is the case in intrinsic valuation. If you are pricing Nvidia, for instance, you determine how narrowly or broadly you define the peer group, and which companies to deem to be "similar". The third step int he process requires controlling for differences across companies. Put simply, if the company that you are pricing has higher growth or lower risk or better returns on its investments on it projects that the companies in the peer group, you have to adjust the pricing to reflect it, either subjectively, as many analysts do, with story telling, or objectively, by bringing in key variables into the estimation process.
Pricing the Markets in January 2019Rather than taking you through multiple after multiple, and overwhelming with pictures and tables on each one, I will list out what I learned by looking at the pricing of all publicly traded stocks around the world, in early 2019, in a series of pricing propositions.
Pricing Proposition 1: Absolute rules don't belong in a relative world!Paraphrasing Einstein, everything is relative, if you are pricing companies. Is a PE ratio of five low? Not if half the stocks in the market trade at less than five. Is an EV/EBITDA of forty high? Perhaps in some sectors, but not if you are comparing high growth companies in a highly priced sector. Old time value investing is filled with rules of thumb, and many of these rules are devised around absolute values for PE or PEG ratios or Price to Book, at odds with the very notion of pricing. If you want to make pricing statements about what comprises cheap or expensive, you should be looking at the distribution of the multiple across the market. Thus, to form pricing rules on US stocks at the start of 2019, I looked the distribution of current, forward and trailing PE ratios for US stocks on January 1, 2019:

At the start of 2019, a low trailing PE ratio for a US stock would have been 6.09, if you used the lowest decile or 10.36, if you moved to the first quartile, and a high PE ratio, using the same approach, would have been 27.31, with the third quartile, or 53.70, with the top decile. Lest I be accused of picking on value investors, they are not the only or even the biggest culprits, when it comes to absolute rules. Private equity investors and LBO initiators have built their own set of screens. I have lost count of the number of times I have heard it said that an EV to EBITDA less than six (or five or seven) must mean that a company is not just cheap, but a good candidate for leverage, but is that true? To answer the question, I looked at the EV to EBITDA multiples across companies, across regions of the world.
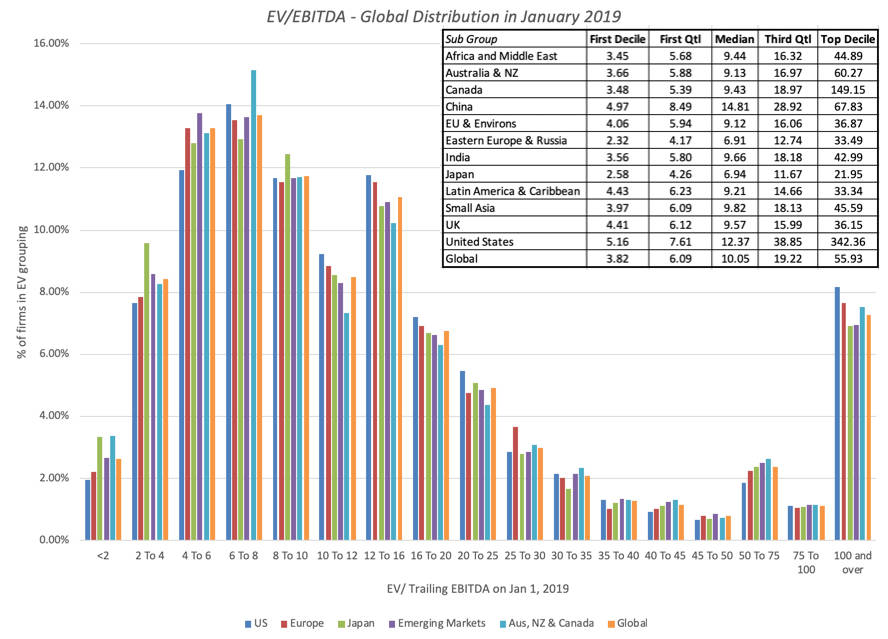 If you wield a pricing bludgeon and declare all companies that trade at less than six times EBITDA to be cheap, you will find about half of all stocks in Russia to be bargains. Even globally, you should hav no trouble finding investments to make with this rule, since almost one quarter of all companies trade at less than six times EBITDA. My point is not that that you cannot have rules of thumb, since they do exist for a reason, but that those rules, in a pricing world, have to be scaled to the data. Thus, if you want to define the first decile as your measure of what comprises cheap, why not make it the first decile? That would mean that an EV to EBITDA multiple less than 5.16 would be cheap in the US on January 1, 2019, but that number would have to recalibrated as the market moves up or down.
Pricing Proposition 2: Markets have a great deal in common, when it comes to pricing, but the differences can be revealing!Much is made about the differences across global equity markets, and especially about the divide between emerging and developed market companies, when it comes to pricing, with delusions running deep on both sides. Emerging market analysts are convinced that stocks are priced very differently, and often more irrationally, in their local markets, leaving them free to devise their own rules for their markets. Conversely, developed market analysts often bring perspectives about what comprises high, low or average pricing ratios, built up through decades of exposure to US and European markets, to emerging markets and find them puzzling. The data tells a different story, with pricing ratios around the world having distributional characteristics that are surprisingly similar across different parts of the world:
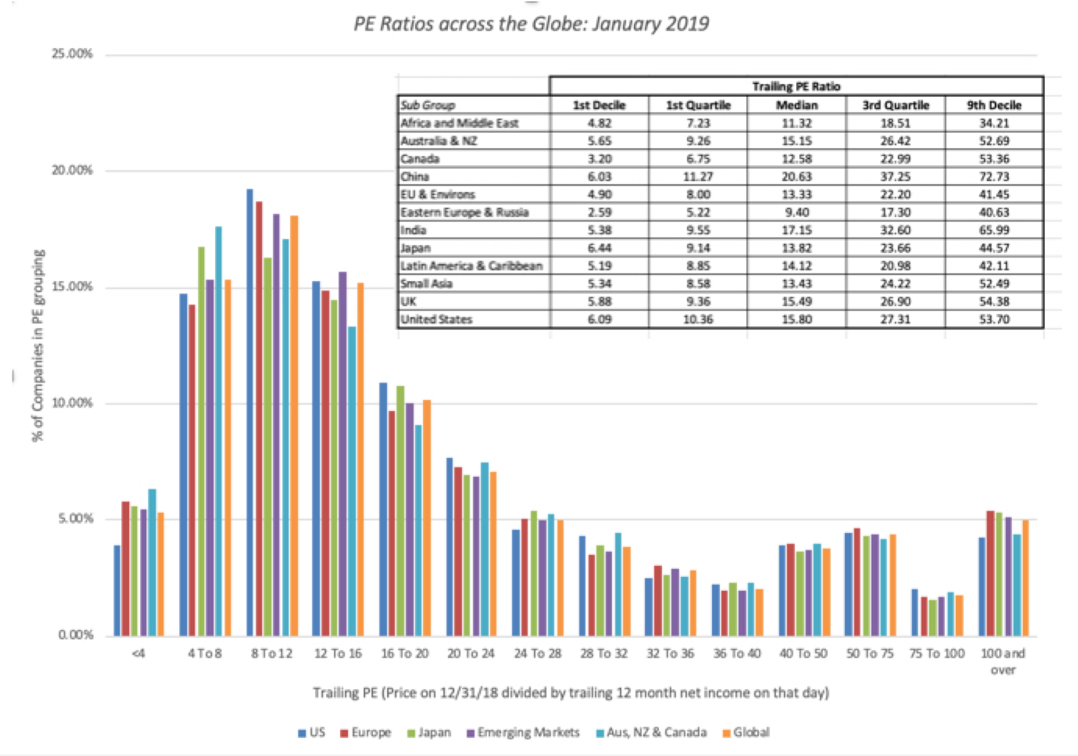 While the levels of PE ratios vary across regions, with Chinese stocks having the highest median PE ratios (20.63) and Russian and East European stocks the lowest (9.40), they all have the same asymmetric look, with a peak to the left (since PE ratios cannot be lower than zero) and a tail to the right (there is no cap on PE ratios). That asymmetry, which is shared by all pricing multiples, is the reason that you should always be cautious about any pricing argument that is built on comparisons to the average PE or PBV, since those numbers will be skewed upwards because of the asymmetry. While it is true that markets share common characteristics, when it comes to pricing, the differences in levels are also worth paying attention to, when investing. A global fund manager who ignores these differences, and picks stocks based upon PE ratios alone, will end up with a portfolio that is dominated by African, Midde East and Russian stocks, not a recipe for investing success.
Pricing Proposition 3: Book value is the most overrated metric in investingI have never understood the reverence that some investors seem to hold for book value, as revealed in the number of investing adages built around it. Stocks that trade at less than book value are considered cheap, and companies that build up book value are considered to be value creating. At the root of the "book value" focus are two assumptions, sometimes stated but often implicit. The first is that the book value is a measure of liquidation value, an estimate of what investors would get if they shut down the company today and sold its assets. The second is that accountants are consistent and conservative in estimating asset value, unlike markets, which are prone to mood swings. Both assumptions are built on foundations of sand, since book value is not a good measure of liquidation value in most sectors, and accountants are both inconsistent and slow-moving, when it comes to estimating and adjusting book value. Again, to get perspective, let's look at the price to book ratios around the world, at the start of 2019:
 If you believe that stocks that trade at less than book value are cheap, you will again find lots of bargains in the Middle East, Africa and Russia, but even in markets like the United States, where less than a quarter of all companies trade at less than book value, they tend to be clustered in industries that are in capital intensive (at least as defined by accountants) and declining businesses.
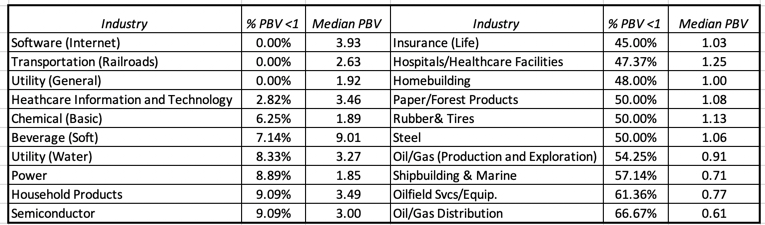 PBV by Industry (US)Note that among the US industries with the fewest stocks that trade at less than book value are a large number of technology and consumer product companies, with utilities and basic chemicals being the only surprises. On the list of US industry groups with the highest percentage of stocks that trade at less than book value are oil companies (at different stages of the business), old time manufacturing companies and life insurance. If you pick your stocks based upon low price to book, in January 2019, your portfolio will be weighted with companies in the latter group, a prospect that should concern you.
Pricing Proposition 4: Most stocks that look cheap deserve to be cheap!There are traders who have little time for fundamentals, arguing that they have little or no role to play in day to day movements of stock prices. That is probably true, but fundamentals do have significant explanatory power, when it comes to why some companies trade at low multiples of earnings or book value and others are high multiples. To understand the link, I find it most useful to go back to a simple intrinsic value model, and with simple algebraic manipulation, make it a model for a pricing multiple. The picture below shows the paths you would take with an equity multiple (Price to Book) and an enterprise value (EV/Sales) to arrive at their determinants:
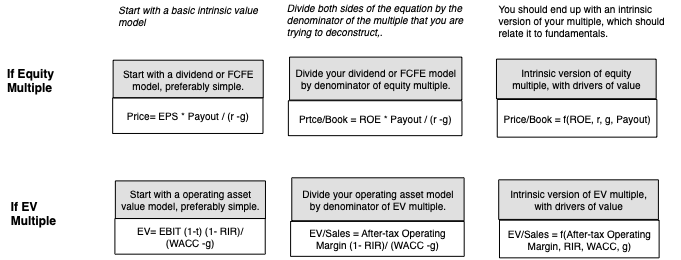
Now what? If you buy into the intrinsic view of a price to book ratio, it should be higher for firms that earn high returns on equity, have higher growth and lower risk, and lower for firms that earn low returns on equity, have lower growth and higher risk. Does the market price in fundamentals? For the most part, the answer is yes, as you can see even in the tables that I have provided in this post so far. Russian stocks have the lowest PE ratios, but that reflects the corporate governance concerns and country risk that investors have when investing in them. Chinese stocks in contrast have the highest PE ratios, because even with stepped down growth prospects for the country, they have higher expected growth than most developed market companies. Looking at stocks with the lowest price to book ratios, Middle Eastern stocks have a disproportionate representation because they earn low returns on equity and the industry groupings with the lowest price to book (oil industry groups, steel etc.) also share that feature. Pricing, done right, is therefore a search for mismatches, i.e., companies that look cheap on a pricing multiple without an obvious fundamental that explains it. This table captures some of the mismatches: table.tableizer-table { font-size: 12px; border: 1px solid #CCC; font-family: Arial, Helvetica, sans-serif; } .tableizer-table td { padding: 4px; margin: 3px; border: 1px solid #CCC; } .tableizer-table th { background-color: #104E8B; color: #FFF; font-weight: bold; }
MultipleKey DriverValuation MismatchPE ratioExpected growthLow PE stock with high expected growth rate in earnings per sharePBV ratioROELow PBV stock with high ROEEV/EBITDAReinvestment rateLow EV/EBITDA stock with low reinvestment needsEV/capitalReturn on capitalLow EV/capital stock with high return on capitalEV/salesAfter-tax operating marginLow EV/sales ratio with a high after-tax operating margin
Pricing Proposition 5: In pricing, it is not about what "should be" priced in, but "what is" priced in!In the last proposition, I argued that markets for the most part are sensible, pricing in fundamentals when pricing stocks, but there will be exceptions, and sometimes large ones, where entire sectors are priced on variables that have little to do with fundamentals, at least on the surface. This is especially true if the companies in a sector are early in their life cycles and have little to show in revenues, very little (or even negative) book value and are losing money on every earnings measure. Desperation drives investors to look for other variables to explain prices, resulting in companies being priced based upon website visitors (at the peak of the dot com boom), numbers of users (at the start of the social media craze) and numbers of subscribers.
I noted this phenomenon, when I priced Twitter ahead of its IPO in 2013, and argued that to price Twitter, you should look at its user base (about 240 million at the time) and what markets were paying per user at the time (about $130) to arrive at a pricing of $24 billion, well above my estimate of intrinsic value of $11 billion for the company at a time, but much closer to the actual pricing, right after the IPO. It is therefore neither surprising nor newsworthy that venture capitalists and equity research analysts are more focused on these pricing metrics, when assessing how much to pay for stocks, and companies, knowing this, play along, by emphasizing them in their earnings reports and news releases.
ConclusionI do believe in intrinsic value, and think of myself more as an investor than a trader, but I am not a valuation snob. I chose the path I did because it works for me and reflects my beliefs, but it would be both arrogant and wrong for me to argue that being a trader and playing the pricing game is somehow less worthy of respect or returns. In fact, the end game for both investors and traders is to make money, and if you can make money by screening stocks using PE ratios or technical indicators, and timing your entry/exit by looking at charts, all the more power to you! If there is a point to this post, it is that a great deal of pricing, as practiced today, is sloppy and ignores, or throws away, data that can be used to make pricing better.
YouTube Video
Data LinksPE ratios by industry grouping: US, Europe, Emerging Markets, Japan, Australia & Canada, India and ChinaBook Value Multiples by industry grouping: US, Europe, Emerging Markets, Japan, Australia & Canada, India and ChinaEV to EBIT & EBITDA by industry grouping: US, Europe, Emerging Markets, Japan, Australia & Canada, India and ChinaEV to Sales by industry grouping: US, Europe, Emerging Markets, Japan, Australia & Canada, India and ChinaPricing Multiples, by countryJanuary 2019 Data UpdatesData Update 1: A Reminder that equities are risky, in case you forgot!Data Update 2: The Message from Bond MarketsData Update 3: Playing the Numbers GameData Update 4: The Many Faces of RiskData Update 5: Of Hurdle Rates and Funding Costs!Data Update 6: Profitability and Value Creation!Data Update 7: Debt, neither poison nor nectar!Data Update 8: Dividends and Buybacks - Fact and Fiction!Data Update 9: Playing the Pricing Game!
February 8, 2019
January 2019 Data Update 8: Dividends and Buybacks - Fact and Fiction
In my series of data posts, I had always planned to get to dividends and buybacks, the two mechanisms that companies have for returning cash to stockholders, at this point, but an op ed on buybacks by Senators Schumer and Sanders this week, in the New York Times, will undoubtedly make this post seem reactive. The senators argue that the hundreds of billions of dollars that US companies have expended buying back their own shares could have been put to better use, if it had been reinvested back in their businesses or used to increase wages for their employees, and offer a preview of legislation that they plan to introduce to counter the menace. Like the senators, I am concerned about the declining manufacturing base and income inequality in the US, but I believe that their legislative proposal is built on premises that are at war with the data, and has the potential for making things worse, not better.
The Buyback Effect: Benign Phenomenon, Managerial Short-termism or Corporate Malignancy?'The very mention of buybacks often creates heated debate, because people seem to have very different views on its causes and consequences. All too often, at the end of debate, each side walks away with its views of buybacks intact, completely unpersuaded by the arguments of the other. The reason, I believe is that our views on buybacks are a function of how we think companies act, what the motives of managers are and what it is that investors price into stocks.
a. Buybacks are benignIf companies are run sensibly, the cash that they return to shareholders should reflect a residual cash flow, making the cash return decision, in terms of sequence, the final step in the process.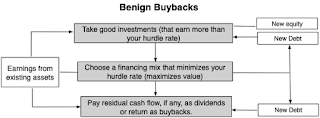
If companies follow this process, buybacks are just another way of returning cash to stockholders, benign in their impact, because they are not coming at the expense of good investments, at least with good defined as investments that generate more than their hurdle rates. In fact, putting restrictions on how much cash companies can return, can harm not only stockholders (by depriving them of their claim on residual cash flows) but also the economy, because capital will now be tied up in businesses that don't need them, rather than find its way to good ones.
b. Buybacks are short termThe benign view of stock buybacks is built on the presumption that managers make decisions at publicly traded companies with an eye on maximizing value, and since value is a function of expected cash flows over the life of the company, that they have a long term perspective. That view is at odds with evidence that managers often put short term gains ahead of long term value, and if investors are also short term, in pricing stocks, you can get a different picture of what drives buybacks and the consequences: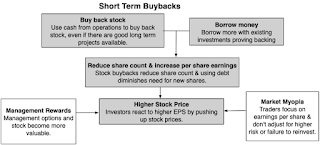
In effect, managers buy back stock, often with borrowed money, because it reduces share count and increases earnings per shares, and markets reward the company with a higher stock price, because investors don't consider the impact of lost growth and/or the risk of more debt. The argument that buybacks are driven by short term interests is strengthened if management compensation takes the form of equity in the company (options or restricted stock), because managers will be personally rewarded then for buybacks that, while damaging to the company's value (which reflects the long term), push up stock prices in the short term. With this view of the world, buybacks can create damage, especially at companies with good long term projects, run by managers who feel the need to meet short term earnings per share targets.
c. Buybacks are malignantThere is a third view of buybacks, where buybacks are not just motivated by the desire to push up earnings per share and stock prices, but become the central purpose of the firm. With this view, companies try to do whatever they can to generate more cash for buybacks, including crimping on worker wages, turning away good investments and borrowing more, even if that borrowing can put their survival at risk.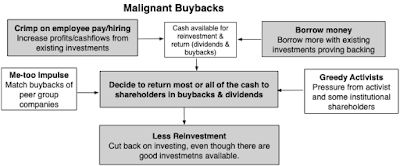
This picture captures almost all of the arguments that detractors of buybacks have used, including the ones that Senators Schumer and Sanders present in their article. If buybacks are the drivers of all other corporate actions, instead of being a residual cash flow, the “buyback binge” can be held responsible for a trifecta of America's most pressing economic problems: stagnant wages for workers, the drop in capital expenditures at US companies and the rise in debt on balance sheets. If this buyback shift is being driven by activist shareholders and a subset of "short term" institutional investors, as many argue that it is, you have a populist dream cast of good (workers, small stockholders, consumers) and evil (activists, wealthy shareholders and bankers). If you buy into this description of corporate and investor behavior, and it is not an implausible picture, it stands to reason that restricting or even stopping companies from buying back stock should alleviate and even solve the resulting problems.
Picking a perspectiveThe reason debates about buybacks very quickly bog down is because proponents not only come in very different perspectives of corporate behavior, but they use anecdotal evidence, where they point to a specific company that behaves in a way that backs their perspective, and say "I told you so". The truth is that the real world is a messy place, with some companies buying back stocks for the right reasons (i.e., because they have no good investments and their stockholders prefer cash returns in this form), some companies buying back stock for short term price gains (to take advantage of markets which are myopic) and some companies focusing on buying back stock at the expense of their employees, lenders and own long term interests.
Moneyball with Buybacks The question of which side of this debate you will come down on, will depend on which of the perspectives outlined above comes closest to describing how companies and markets actually behave. Since that is an empirical question, not a political, idealogical or a theoretical one, I think it makes sense to look at the numbers on dividends and buybacks, not just in the US, but across the world, and I will do so with a series of data-driven statements.
1. More companies are buying back stock, and more cash is being returned in buybacks Are US companies returning more and more cash in the form of buybacks? Yes, they are, and it represents a trend that saw its beginnings, not ten years ago, but in the 1980s. In the graph below, I look at the aggregate dividends and buybacks from firms in the S&P 500 since 1986, and also report on the percentage of cash returned that takes the form of buybacks, each year: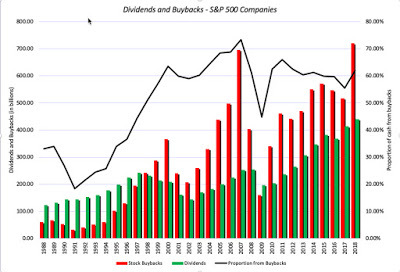
Starting at a base in the early 1980s, where buybacks were uncommon and dividends represented almost all cash return, you can see buybacks climb through the 1980s and 1990s, both in dollar value terms and as a percentage of overall cash return. That trend has only accelerated in this century, with the 2008 crisis putting a brief crimp on it. In 2018, more than 60% of the cash returned by S&P 500 companies was in the form of buybacks, amounting to almost $700 billion.
2. Cash Returns are rising as a percent of earnings, and it looks like companies are reinvesting less back into their own businessesIf you look at the graph above, you can see that the rise in buybacks has been accompanied by a stagnation in dividends, with growth rates in dividends substantially falling short of growth in buybacks. This shift has had consequences for two widely used measures of cash return, dividend yield, which looks at dividends as a percent of market capitalization or stock prices and the dividend payout ratio, a measure of the proportion of earnings as dividends. The declining role of dividends, as a form of cash return, has meant that a more relevant measure of cash return has to incorporate stock buybacks, resulting in a broader definition of cash yield and cash payout ratio measures:Cash Yield = (Dividends + Buybacks) / Market CapitalizationCash Payout Ratio = (Dividends + Buybacks)/ Net IncomeThe push back that you will get from dividend devotees that while dividends go to all shareholders, buybacks put cash only in the pockets of those stockholder who sell back, but that argument ignores the reality that the it is still shareholders who are getting the cash from buybacks. (As a thought experiment, imaging that you own all of the shares in a company and consider whether you notice a difference between dividends and buybacks, other than for tax purposes.) Calculating both dividend and cash measures of yield and payout over time, we observe the following for the companies in the S&P 500: S&P 500: Dividends, Buybacks, Mkt Cap and Net IncomeThis table reinforces the message from the previous graph, which is that both dividends and buybacks have to be considered in any assessment of cash return. That is why I think that the handwringing over how low dividend yields have become over the last two decades misses the point. The cash yield for US companies, which includes both dividends and buybacks, is much more indicative of what companies are returning to shareholders and that number has remained relatively stable over time. Using the same logic that I used to argue that cash yields were better indicators of cash returned to shareholders than dividend yields, I computed cash payout ratios, by adding buybacks to dividends, before dividing by net income in the table in the last section, and it does show a disquieting pattern. In fundamental analysis, analysts give weight to the payout ratio and its twin measure, the retention ratio (1- payout ratio) as a measure of how much a company is reinvesting into its own business, in order to grow. The cash returned to shareholders exceeded net income in 2015 and 2016, and remains high, at 92.12% of net income, and that statistic seems to support the proposition that US companies are reinvesting less.
3. The drop in reinvestment may be real, but it could also be a reflection of accounting inconsistencies and failure to see the full picture on cash returnIt is true that companies are returning more of their net income, as measured by accountants, to stockholders in dividends and buybacks, with the latter accounting for the lion's share of the return. Before we conclude that this is proof that companies are reinvesting less, there are two flaws in the numbers that need fixing:Stock Issuances: If we count stock buybacks as returning cash to shareholders, we should also be counting stock issuances as cash being invested by these same shareholders. Thus, the more relevant measure of cash return would net out stock issuances from stock buybacks, before adding dividends. While this is a lesser issue with the S&P 500 companies, which tend to be larger and more mature companies, less dependent of stock issuances, it can be a larger one for the entire market, where initial public offerings can augment seasoned equity issues, especially for smaller, higher growth companies.Accounting Inconsistencies: Over the last few decades, the percentage of S&P 500 companies that are in technology and health care has risen, and that rise has laid bare an accounting inconsistency on capital expenditures. If a key characteristic of capital expenditures is that money spent on them provide benefits for many years, accounting does a reasonable job in categorizing capital expenditures in manufacturing firms, where it takes the form of plant and equipment, but it does a woeful job of doing the same at firms that derive the bulk of their value from intangible assets. In particular, it treats R&D, the primary capital expenditure for technology and health care firms, brand name advertising, a key investment for the long term for consumer product companies, and customer acquisition costs, central for growth in subscriber/user driven companies as operating expenses, depressing earnings and rendering book value meaningless. In effect, companies on the S&P 500 are having their earnings measured using different rules, with the earnings for GM and 3M reflecting the correct recognition that money spent on investments designed to create benefits over many years should not be expensed, but the earnings for Microsoft and Apple being calculated after netting those same types of investments. As with the treatment of leases, I refuse to wait for accountants to come to their senses on this question, and I have been capitalizing R&D for all companies and adjusting their earnings accordingly. In the table below, I bring in stock issues and R&D into the picture, looking across all US stocks, not just the S&P 500: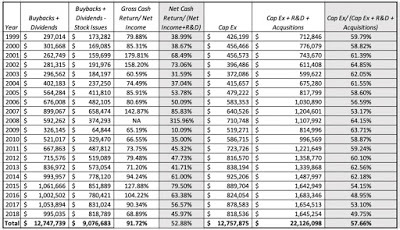 All US publicly traded companies; S&P Capital IQWhile the trend towards buybacks is still visible, bringing in new stock issuances tempers some of the most extreme findings. In 2018, for instance, the net cash return (with issuances netted out from dividends and buybacks) represented about 46% of adjusted net profit (with R&D added back), well below the gross cash return. In fact, there is no discernible decline in reinvestment over time, barring 2008 and 2009, the years around the last crisis. Capital expenditures have grown slowly, but an increasing percentage of reinvestment, especially in the last 5 years, has taken the form of R&D and acquisitions.
4. Buybacks cut across sectors, size classes and growth categories, but the biggest cash returners are larger, more mature companies. Before we decide that buybacks are ravaging the economy and should be restricted or even banned, it is also worth taking a look at what types of companies are buying back the most stock. Staying with US stocks, I looked at buybacks and dividends of companies, broken down by industry grouping. The full table is at the end of this post, but based upon the dollar value of buybacks, the ten industries that bought back the least stock and the ten that bought back the most are highlighted below: Dividends and Buybacks: By Industry for USIt should come as no surprise that the industries where you see buybacks used the least tend to be industries which have a history of large dividend payments, with utilities, metals and mining and real estate making the list. Looking at the industries that are the biggest buyers of their own stock, the list is dominated by companies that derive their value from intangible assets, with technology and pharmaceuticals accounting for seven of the ten top spots. While that may surprise some, since these are viewed as high growth businesses, some of the biggest players in both technology and pharmaceuticals are now middle aged or older, using my corporate life cycle structure.
Given that there are often wide differences in size and growth, within each industry grouping, I also broke companies down by market cap size, to see if smaller companies behave differently than larger ones, when it comes to buybacks: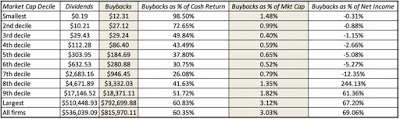 Market capitalization, as of 12/31/18It is not surprising that the largest companies account for the bulk of buybacks, but you can also see that they return far more in buybacks, as a percent of their market capitalizations, then smaller firms do.
Finally, I categorized companies based upon expected growth in the future, to see if companies that expect high growth behave differently from ones that expect low growth.
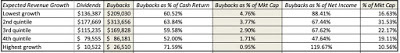 Expected revenue growth in the next two yearsWhile companies in every growth class have jumped on the buyback bandwagon, the biggest buybacks in absolute and relative terms are for companies that have the lowest expected growth in revenues, returning 4-5% of their market capitalization in buybacks each year. Companies in the highest growth class, in contrast, return only 0.95% of their buybacks. That said, there are companies in higher growth classes that are buying back stock, when they should not be, perhaps for short term pricing reasons, but they represent only a small portion of the market, accounting collectively for only 10.56% of overall market capitalization.
I may be guilty of letting my priors guide my reading of these tables, but as I see it, the buyback boom in the United States is being driven by large non-manufacturing firms, with low growth prospects. If you restrict buybacks, expecting that this to unleash a new era of manufacturing growth and factory jobs, I am afraid that you will be disappointed. The workers at the firms that buy back the most stock, tend to be already among the better paid in the economy, and tying buybacks to higher wages for these workers will not help those who are at the bottom of the pay scale.
5. Investing back into businesses is not always better than returning cash to shareholders, when it comes to jobs, economic growth and prosperity.Implicit in the Schumer-Sanders proposal to restrict buy backs is the belief that while shareholders may benefit from buybacks, the economy overall will be more prosperous, and workers will be better served, if the cash that is returned to shareholders is invested back in the businesses instead. Incidentally, this seems to be a shared delusion for both ends of the political spectrum, since one of the biggest sales pitches for the tax reform act, passed in 2017, was that the cash trapped overseas by bad US tax law, would, once released, be invested into new factories and manufacturing capacity in the US. I believe that both sides are operating from a false premise, since investing money back into bad businesses can make both economies and workers worse off. In a prior post, I defined a bad business as one where it is difficult to generate a return that is higher than the risk adjusted rate that you need to make to break even on your investment.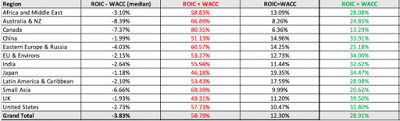 Data Update 6 on excess returnsUsing the return on capital, a flawed but still useful measure, as a measure of return and the cost of capital, with all of the caveats about measurement error, I found that approximately 60% of companies, both globally and in the US, earn less than their cost of capital. Forcing these companies to reinvest their earnings, rather than letting them pay it out, will only put more more money into bad businesses and create what I call "walking dead" companies, tying up capital that could be used more productively, if it were paid out to shareholders, who then can find better businesses to invest in.
6. Some companies may be funding buybacks with debt, but the bulk of buybacks are still funded with equity cash flowsThe narrative about stock buybacks that its detractors tell is that US companies have borrowed money and used that debt to fund buybacks, creating, at least in the narrative, sky-high debt ratios and rising default risk. While there is certainly anecdotal evidence that you can offer for this proposition, there is evidence that we have looked at already that should lead you to question this narrative. Looking across sectors, we noted that the technology and pharmaceutical companies are on the list of biggest buyers of their own stock, and neither group is in the top ten or even twenty, when it comes to debt ratios.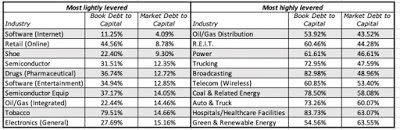
Taking the naysayers at their word, I broke US companies down, based upon their debt loads, using Debt/EBITDA as the measure, from lowest to highest, to see if there is a relationship between buybacks and debt loads: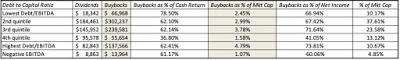 Debt to EBITDA at the end of 2018The bulk of the buybacks are coming from firms with low to moderate debt ratios, falling in the second and third quintiles of debt ratios. It is true that the firms with the highest debt load, buy back the most stock, at least as a percent of their market capitalization. As with the growth data, you can view this as evidence of either short-term thinking or worse, but note that the second and third quintiles together account for 61% of overall market capitalization, suggesting that if buybacks are skewing debt upwards at some firms, it is more at the margins than at the center of the market.
7. Buybacks are now a global phenomenonIt is true that stock buybacks, at least in the form that you see them today, as cash return to stockholders, had their origins in the United States in the 1980s and it is also true that for a long time after that, much of the rest of the world either stayed with dividends and many countries had severe constraints on the use of buybacks. In the last decade, though, the dam seems to have broken and stock buybacks can now be seen in every part of the world, as can be seen in the table below: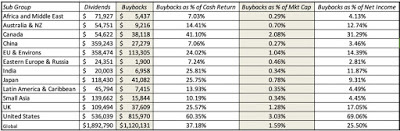
US companies still lead the world in buybacks, but Canadian companies are playing catch up and you are seeing buybacks pick up in Europe. Asia, Eastern Europe and Latin America remain holdouts, though it is unclear how much of the reluctance to buy back stock is due to poor corporate governance.
The Follow Up I agree that wage stagnation and an unwillingness to invest into the industrial base are significant problems for US companies, but I think that buybacks are more a symptom of global economic changes, than a cause. In particular, globalization has made it more difficult for companies to generate sustained returns on investments, and has made earnings more volatile for all businesses. The lower returns on investments has led to more cash being returned, and the fear of earnings volatility has tilted companies away from dividends, which are viewed as more difficult to back out of, to buybacks. In conjunction, a shift from an Industrial Age economy to the economies of today has meant that our biggest businesses are less capital intensive and more dependent on investments in intangible assets, a trend that accounting has not been able to keep up with. You can ban or restrict buybacks, but that will not make investment projects more lucrative and earnings more predictable, and it certainly is not going to create a new industrial age.
If you came into this article with a strong bias against buybacks it is unlikely that I will be able to convince you that buybacks are benign, and it is very likely that you will be in favor, like Senators Schumer and Sanders, on restricting not just buybacks, but cash returns (including dividends), in general. Playing devil’s advocate, let’s assume that you succeed and play out what the effects of these restrictions will be on how much companies invest collectively and employee wages.On the investment front, it is true that companies that used to buy back large numbers of their own shares will now have more cash to invest, but in what? It could be in more internal investments or projects, but given that many of these companies were buying back stock because they could not find good projects in the first place, it would have to be in projects that don’t earn a high enough returns to cover their hurdle rates. Perhaps, it will be in acquisitions, and while that will make M&A deal makers happy, the corporate track record is woeful. In either case, you will have more reinvestment in the wrong segments of the economy, at the expense of investments in the segments that need them more.On the wage front, the consequences will be even messier. It is possible that tying buybacks to employee wages, as Senators Schumer and Sanders propose, will cause some companies to raise wages for existing employees, but with what consequences? Since they will now be paying much higher wages than their competitors, my guess is that these same companies will be quicker to shift to automation and will have smaller workforces in the future, and that those at the low end of the pay scale will be most hurt by this substitution. Illustrating my point about anecdotal evidence, the senators use Walmart and Harley Davidson to make their case, arguing that both companies should not have expended the money that they did on buybacks, and taken investments or raised wages instead. Assuming that Walmart had followed their advice and not bought back stock and invested instead, it is unlikely that Walmart would have opened more stores in the United States, a saturated market, but would have opened them instead in other countries, and I don’t believe that the senators would view more stores being built in Indonesia or India as the outcome they were hoping for. As for Harley Davidson, a company that serves a loyal, but niche market, building another factory may have created more jobs for the moment, but it is not at all clear that the demand exists for the bikes that would roll out.Would Walmart have raised wages, if they had not bought back stock? In a retail landscape, where Amazon lays waste to any competitor with a higher cost structure, that would have been suicidal, and accelerated the flow of customers to Amazon, allowing that company to become even more dominant. In a world where people complain about how the FANG stocks are taking over the world, you would be playing into their hands, by handcuffing their brick and mortar competitors, with buyback legislation.In short, restricting buybacks may lead to more reinvestment, but much of it will be in bad businesses, acquisitions of existing entities and often in other countries. Tying buybacks to employee wage levels may boost the pay for existing employees, but will lead to fewer new hires, increasing automation and smaller workforces over time. In short, the ills that the Schumer-Sanders bill tries to cure will get worse, as a result of their efforts, rather than better.
ConclusionI believe that the shift to buybacks reflects fundamental shifts in competition and earnings risk, but I don't wear rose colored glasses, when looking at the phenomenon. There are clearly some firms that are buying back stock, when they clearly should not be, paying out cash that could be better used on paying down debt, especially in the aftermath of the reduction of tax benefits of debt, or taking investments that can generate returns that exceed their hurdle rates. You may consider me naive, but I believe that the market, while it may be fooled for the moment, will catch on and punish these firms. Also, the data suggests that these bad players are more the exception than the rule, and banning all buybacks or writing in restrictions on buybacks for all companies strikes me as overkill, especially since the promised benefits of higher capital investment and wages are likely to be illusory or transitory. If you are tempted to back these restrictions, because you believe they are well intentioned, it is worth remembering that history is full of well intentioned legislation delivering perverse results.
YouTube Video
DatasetsDividends and Buybacks in 2018- By industryDividends and Buybacks in 2018- By countryPapers
Dealing with Intangibles: Valuing Brand Names, Flexibility and Patents
January 2019 Data UpdatesData Update 1: A Reminder that equities are risky, in case you forgot!Data Update 2: The Message from Bond MarketsData Update 3: Playing the Numbers GameData Update 4: The Many Faces of RiskData Update 5: Of Hurdle Rates and Funding Costs!Data Update 6: Profitability and Value Creation!Data Update 7: Debt, neither poison nor nectar!Data Update 8: Dividends and Buybacks - Fact and Fiction!
<!-- /* Style Definitions */ p.MsoNormal, li.MsoNormal, div.MsoNormal {mso-style-unhide:no; mso-style-qformat:yes; mso-style-parent:""; margin:0in; margin-bottom:.0001pt; mso-pagination:widow-orphan; font-size:12.0pt; font-family:"Calibri",sans-serif; mso-ascii-font-family:Calibri; mso-ascii-theme-font:minor-latin; mso-fareast-font-family:Calibri; mso-fareast-theme-font:minor-latin; mso-hansi-font-family:Calibri; mso-hansi-theme-font:minor-latin; mso-bidi-font-family:"Times New Roman"; mso-bidi-theme-font:minor-bidi;} p.MsoListParagraph, li.MsoListParagraph, div.MsoListParagraph {mso-style-priority:34; mso-style-unhide:no; mso-style-qformat:yes; margin-top:0in; margin-right:0in; margin-bottom:0in; margin-left:.5in; margin-bottom:.0001pt; mso-add-space:auto; mso-pagination:widow-orphan; font-size:12.0pt; font-family:"Calibri",sans-serif; mso-ascii-font-family:Calibri; mso-ascii-theme-font:minor-latin; mso-fareast-font-family:Calibri; mso-fareast-theme-font:minor-latin; mso-hansi-font-family:Calibri; mso-hansi-theme-font:minor-latin; mso-bidi-font-family:"Times New Roman"; mso-bidi-theme-font:minor-bidi;} p.MsoListParagraphCxSpFirst, li.MsoListParagraphCxSpFirst, div.MsoListParagraphCxSpFirst {mso-style-priority:34; mso-style-unhide:no; mso-style-qformat:yes; mso-style-type:export-only; margin-top:0in; margin-right:0in; margin-bottom:0in; margin-left:.5in; margin-bottom:.0001pt; mso-add-space:auto; mso-pagination:widow-orphan; font-size:12.0pt; font-family:"Calibri",sans-serif; mso-ascii-font-family:Calibri; mso-ascii-theme-font:minor-latin; mso-fareast-font-family:Calibri; mso-fareast-theme-font:minor-latin; mso-hansi-font-family:Calibri; mso-hansi-theme-font:minor-latin; mso-bidi-font-family:"Times New Roman"; mso-bidi-theme-font:minor-bidi;} p.MsoListParagraphCxSpMiddle, li.MsoListParagraphCxSpMiddle, div.MsoListParagraphCxSpMiddle {mso-style-priority:34; mso-style-unhide:no; mso-style-qformat:yes; mso-style-type:export-only; margin-top:0in; margin-right:0in; margin-bottom:0in; margin-left:.5in; margin-bottom:.0001pt; mso-add-space:auto; mso-pagination:widow-orphan; font-size:12.0pt; font-family:"Calibri",sans-serif; mso-ascii-font-family:Calibri; mso-ascii-theme-font:minor-latin; mso-fareast-font-family:Calibri; mso-fareast-theme-font:minor-latin; mso-hansi-font-family:Calibri; mso-hansi-theme-font:minor-latin; mso-bidi-font-family:"Times New Roman"; mso-bidi-theme-font:minor-bidi;} p.MsoListParagraphCxSpLast, li.MsoListParagraphCxSpLast, div.MsoListParagraphCxSpLast {mso-style-priority:34; mso-style-unhide:no; mso-style-qformat:yes; mso-style-type:export-only; margin-top:0in; margin-right:0in; margin-bottom:0in; margin-left:.5in; margin-bottom:.0001pt; mso-add-space:auto; mso-pagination:widow-orphan; font-size:12.0pt; font-family:"Calibri",sans-serif; mso-ascii-font-family:Calibri; mso-ascii-theme-font:minor-latin; mso-fareast-font-family:Calibri; mso-fareast-theme-font:minor-latin; mso-hansi-font-family:Calibri; mso-hansi-theme-font:minor-latin; mso-bidi-font-family:"Times New Roman"; mso-bidi-theme-font:minor-bidi;} .MsoChpDefault {mso-style-type:export-only; mso-default-props:yes; font-family:"Calibri",sans-serif; mso-ascii-font-family:Calibri; mso-ascii-theme-font:minor-latin; mso-fareast-font-family:Calibri; mso-fareast-theme-font:minor-latin; mso-hansi-font-family:Calibri; mso-hansi-theme-font:minor-latin; mso-bidi-font-family:"Times New Roman"; mso-bidi-theme-font:minor-bidi;} @page WordSection1 {size:8.5in 11.0in; margin:1.0in 1.0in 1.0in 1.0in; mso-header-margin:.5in; mso-footer-margin:.5in; mso-paper-source:0;} div.WordSection1 {page:WordSection1;} /* List Definitions */ @list l0 {mso-list-id:398942054; mso-list-type:hybrid; mso-list-template-ids:-1922145872 67698703 67698713 67698715 67698703 67698713 67698715 67698703 67698713 67698715;} @list l0:level1 {mso-level-tab-stop:none; mso-level-number-position:left; text-indent:-.25in;} @list l0:level2 {mso-level-number-format:alpha-lower; mso-level-tab-stop:none; mso-level-number-position:left; text-indent:-.25in;} @list l0:level3 {mso-level-number-format:roman-lower; mso-level-tab-stop:none; mso-level-number-position:right; text-indent:-9.0pt;} @list l0:level4 {mso-level-tab-stop:none; mso-level-number-position:left; text-indent:-.25in;} @list l0:level5 {mso-level-number-format:alpha-lower; mso-level-tab-stop:none; mso-level-number-position:left; text-indent:-.25in;} @list l0:level6 {mso-level-number-format:roman-lower; mso-level-tab-stop:none; mso-level-number-position:right; text-indent:-9.0pt;} @list l0:level7 {mso-level-tab-stop:none; mso-level-number-position:left; text-indent:-.25in;} @list l0:level8 {mso-level-number-format:alpha-lower; mso-level-tab-stop:none; mso-level-number-position:left; text-indent:-.25in;} @list l0:level9 {mso-level-number-format:roman-lower; mso-level-tab-stop:none; mso-level-number-position:right; text-indent:-9.0pt;} @list l1 {mso-list-id:1397242339; mso-list-type:hybrid; mso-list-template-ids:-614431912 67698703 67698713 67698715 67698703 67698713 67698715 67698703 67698713 67698715;} @list l1:level1 {mso-level-tab-stop:none; mso-level-number-position:left; text-indent:-.25in;} @list l1:level2 {mso-level-number-format:alpha-lower; mso-level-tab-stop:none; mso-level-number-position:left; text-indent:-.25in;} @list l1:level3 {mso-level-number-format:roman-lower; mso-level-tab-stop:none; mso-level-number-position:right; text-indent:-9.0pt;} @list l1:level4 {mso-level-tab-stop:none; mso-level-number-position:left; text-indent:-.25in;} @list l1:level5 {mso-level-number-format:alpha-lower; mso-level-tab-stop:none; mso-level-number-position:left; text-indent:-.25in;} @list l1:level6 {mso-level-number-format:roman-lower; mso-level-tab-stop:none; mso-level-number-position:right; text-indent:-9.0pt;} @list l1:level7 {mso-level-tab-stop:none; mso-level-number-position:left; text-indent:-.25in;} @list l1:level8 {mso-level-number-format:alpha-lower; mso-level-tab-stop:none; mso-level-number-position:left; text-indent:-.25in;} @list l1:level9 {mso-level-number-format:roman-lower; mso-level-tab-stop:none; mso-level-number-position:right; text-indent:-9.0pt;} @list l2 {mso-list-id:1521316037; mso-list-type:hybrid; mso-list-template-ids:26616284 -1544508952 67698691 67698693 67698689 67698691 67698693 67698689 67698691 67698693;} @list l2:level1 {mso-level-number-format:bullet; mso-level-text:-; mso-level-tab-stop:none; mso-level-number-position:left; margin-left:.75in; text-indent:-.25in; font-family:"Calibri",sans-serif; mso-fareast-font-family:Calibri; mso-fareast-theme-font:minor-latin;} @list l2:level2 {mso-level-number-format:bullet; mso-level-text:o; mso-level-tab-stop:none; mso-level-number-position:left; margin-left:1.25in; text-indent:-.25in; font-family:"Courier New";} @list l2:level3 {mso-level-number-format:bullet; mso-level-text:; mso-level-tab-stop:none; mso-level-number-position:left; margin-left:1.75in; text-indent:-.25in; font-family:Wingdings;} @list l2:level4 {mso-level-number-format:bullet; mso-level-text:; mso-level-tab-stop:none; mso-level-number-position:left; margin-left:2.25in; text-indent:-.25in; font-family:Symbol;} @list l2:level5 {mso-level-number-format:bullet; mso-level-text:o; mso-level-tab-stop:none; mso-level-number-position:left; margin-left:2.75in; text-indent:-.25in; font-family:"Courier New";} @list l2:level6 {mso-level-number-format:bullet; mso-level-text:; mso-level-tab-stop:none; mso-level-number-position:left; margin-left:3.25in; text-indent:-.25in; font-family:Wingdings;} @list l2:level7 {mso-level-number-format:bullet; mso-level-text:; mso-level-tab-stop:none; mso-level-number-position:left; margin-left:3.75in; text-indent:-.25in; font-family:Symbol;} @list l2:level8 {mso-level-number-format:bullet; mso-level-text:o; mso-level-tab-stop:none; mso-level-number-position:left; margin-left:4.25in; text-indent:-.25in; font-family:"Courier New";} @list l2:level9 {mso-level-number-format:bullet; mso-level-text:; mso-level-tab-stop:none; mso-level-number-position:left; margin-left:4.75in; text-indent:-.25in; font-family:Wingdings;} @list l3 {mso-list-id:1734893140; mso-list-type:hybrid; mso-list-template-ids:-1138469626 -1544508952 67698691 67698693 67698689 67698691 67698693 67698689 67698691 67698693;} @list l3:level1 {mso-level-number-format:bullet; mso-level-text:-; mso-level-tab-stop:none; mso-level-number-position:left; text-indent:-.25in; font-family:"Calibri",sans-serif; mso-fareast-font-family:Calibri; mso-fareast-theme-font:minor-latin;} @list l3:level2 {mso-level-number-format:bullet; mso-level-text:o; mso-level-tab-stop:none; mso-level-number-position:left; text-indent:-.25in; font-family:"Courier New";} @list l3:level3 {mso-level-number-format:bullet; mso-level-text:; mso-level-tab-stop:none; mso-level-number-position:left; text-indent:-.25in; font-family:Wingdings;} @list l3:level4 {mso-level-number-format:bullet; mso-level-text:; mso-level-tab-stop:none; mso-level-number-position:left; text-indent:-.25in; font-family:Symbol;} @list l3:level5 {mso-level-number-format:bullet; mso-level-text:o; mso-level-tab-stop:none; mso-level-number-position:left; text-indent:-.25in; font-family:"Courier New";} @list l3:level6 {mso-level-number-format:bullet; mso-level-text:; mso-level-tab-stop:none; mso-level-number-position:left; text-indent:-.25in; font-family:Wingdings;} @list l3:level7 {mso-level-number-format:bullet; mso-level-text:; mso-level-tab-stop:none; mso-level-number-position:left; text-indent:-.25in; font-family:Symbol;} @list l3:level8 {mso-level-number-format:bullet; mso-level-text:o; mso-level-tab-stop:none; mso-level-number-position:left; text-indent:-.25in; font-family:"Courier New";} @list l3:level9 {mso-level-number-format:bullet; mso-level-text:; mso-level-tab-stop:none; mso-level-number-position:left; text-indent:-.25in; font-family:Wingdings;} @list l4 {mso-list-id:1762292810; mso-list-type:hybrid; mso-list-template-ids:465087120 -1544508952 67698691 67698693 67698689 67698691 67698693 67698689 67698691 67698693;} @list l4:level1 {mso-level-number-format:bullet; mso-level-text:-; mso-level-tab-stop:none; mso-level-number-position:left; text-indent:-.25in; font-family:"Calibri",sans-serif; mso-fareast-font-family:Calibri; mso-fareast-theme-font:minor-latin;} @list l4:level2 {mso-level-number-format:bullet; mso-level-text:o; mso-level-tab-stop:none; mso-level-number-position:left; text-indent:-.25in; font-family:"Courier New";} @list l4:level3 {mso-level-number-format:bullet; mso-level-text:; mso-level-tab-stop:none; mso-level-number-position:left; text-indent:-.25in; font-family:Wingdings;} @list l4:level4 {mso-level-number-format:bullet; mso-level-text:; mso-level-tab-stop:none; mso-level-number-position:left; text-indent:-.25in; font-family:Symbol;} @list l4:level5 {mso-level-number-format:bullet; mso-level-text:o; mso-level-tab-stop:none; mso-level-number-position:left; text-indent:-.25in; font-family:"Courier New";} @list l4:level6 {mso-level-number-format:bullet; mso-level-text:; mso-level-tab-stop:none; mso-level-number-position:left; text-indent:-.25in; font-family:Wingdings;} @list l4:level7 {mso-level-number-format:bullet; mso-level-text:; mso-level-tab-stop:none; mso-level-number-position:left; text-indent:-.25in; font-family:Symbol;} @list l4:level8 {mso-level-number-format:bullet; mso-level-text:o; mso-level-tab-stop:none; mso-level-number-position:left; text-indent:-.25in; font-family:"Courier New";} @list l4:level9 {mso-level-number-format:bullet; mso-level-text:; mso-level-tab-stop:none; mso-level-number-position:left; text-indent:-.25in; font-family:Wingdings;} @list l5 {mso-list-id:1807887743; mso-list-type:hybrid; mso-list-template-ids:-759419238 67698703 67698713 67698715 67698703 67698713 67698715 67698703 67698713 67698715;} @list l5:level1 {mso-level-tab-stop:none; mso-level-number-position:left; text-indent:-.25in;} @list l5:level2 {mso-level-number-format:alpha-lower; mso-level-tab-stop:none; mso-level-number-position:left; text-indent:-.25in;} @list l5:level3 {mso-level-number-format:roman-lower; mso-level-tab-stop:none; mso-level-number-position:right; text-indent:-9.0pt;} @list l5:level4 {mso-level-tab-stop:none; mso-level-number-position:left; text-indent:-.25in;} @list l5:level5 {mso-level-number-format:alpha-lower; mso-level-tab-stop:none; mso-level-number-position:left; text-indent:-.25in;} @list l5:level6 {mso-level-number-format:roman-lower; mso-level-tab-stop:none; mso-level-number-position:right; text-indent:-9.0pt;} @list l5:level7 {mso-level-tab-stop:none; mso-level-number-position:left; text-indent:-.25in;} @list l5:level8 {mso-level-number-format:alpha-lower; mso-level-tab-stop:none; mso-level-number-position:left; text-indent:-.25in;} @list l5:level9 {mso-level-number-format:roman-lower; mso-level-tab-stop:none; mso-level-number-position:right; text-indent:-9.0pt;} </style></div></div>--></div>
The Buyback Effect: Benign Phenomenon, Managerial Short-termism or Corporate Malignancy?'The very mention of buybacks often creates heated debate, because people seem to have very different views on its causes and consequences. All too often, at the end of debate, each side walks away with its views of buybacks intact, completely unpersuaded by the arguments of the other. The reason, I believe is that our views on buybacks are a function of how we think companies act, what the motives of managers are and what it is that investors price into stocks.
a. Buybacks are benignIf companies are run sensibly, the cash that they return to shareholders should reflect a residual cash flow, making the cash return decision, in terms of sequence, the final step in the process.
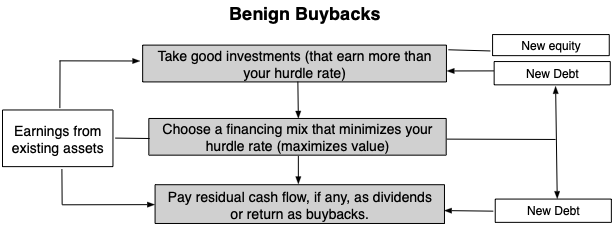
If companies follow this process, buybacks are just another way of returning cash to stockholders, benign in their impact, because they are not coming at the expense of good investments, at least with good defined as investments that generate more than their hurdle rates. In fact, putting restrictions on how much cash companies can return, can harm not only stockholders (by depriving them of their claim on residual cash flows) but also the economy, because capital will now be tied up in businesses that don't need them, rather than find its way to good ones.
b. Buybacks are short termThe benign view of stock buybacks is built on the presumption that managers make decisions at publicly traded companies with an eye on maximizing value, and since value is a function of expected cash flows over the life of the company, that they have a long term perspective. That view is at odds with evidence that managers often put short term gains ahead of long term value, and if investors are also short term, in pricing stocks, you can get a different picture of what drives buybacks and the consequences:

In effect, managers buy back stock, often with borrowed money, because it reduces share count and increases earnings per shares, and markets reward the company with a higher stock price, because investors don't consider the impact of lost growth and/or the risk of more debt. The argument that buybacks are driven by short term interests is strengthened if management compensation takes the form of equity in the company (options or restricted stock), because managers will be personally rewarded then for buybacks that, while damaging to the company's value (which reflects the long term), push up stock prices in the short term. With this view of the world, buybacks can create damage, especially at companies with good long term projects, run by managers who feel the need to meet short term earnings per share targets.
c. Buybacks are malignantThere is a third view of buybacks, where buybacks are not just motivated by the desire to push up earnings per share and stock prices, but become the central purpose of the firm. With this view, companies try to do whatever they can to generate more cash for buybacks, including crimping on worker wages, turning away good investments and borrowing more, even if that borrowing can put their survival at risk.
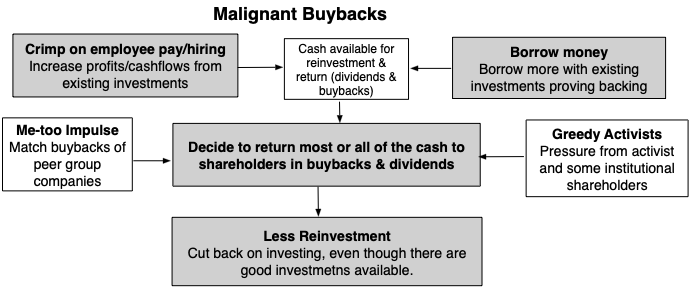
This picture captures almost all of the arguments that detractors of buybacks have used, including the ones that Senators Schumer and Sanders present in their article. If buybacks are the drivers of all other corporate actions, instead of being a residual cash flow, the “buyback binge” can be held responsible for a trifecta of America's most pressing economic problems: stagnant wages for workers, the drop in capital expenditures at US companies and the rise in debt on balance sheets. If this buyback shift is being driven by activist shareholders and a subset of "short term" institutional investors, as many argue that it is, you have a populist dream cast of good (workers, small stockholders, consumers) and evil (activists, wealthy shareholders and bankers). If you buy into this description of corporate and investor behavior, and it is not an implausible picture, it stands to reason that restricting or even stopping companies from buying back stock should alleviate and even solve the resulting problems.
Picking a perspectiveThe reason debates about buybacks very quickly bog down is because proponents not only come in very different perspectives of corporate behavior, but they use anecdotal evidence, where they point to a specific company that behaves in a way that backs their perspective, and say "I told you so". The truth is that the real world is a messy place, with some companies buying back stocks for the right reasons (i.e., because they have no good investments and their stockholders prefer cash returns in this form), some companies buying back stock for short term price gains (to take advantage of markets which are myopic) and some companies focusing on buying back stock at the expense of their employees, lenders and own long term interests.
Moneyball with Buybacks The question of which side of this debate you will come down on, will depend on which of the perspectives outlined above comes closest to describing how companies and markets actually behave. Since that is an empirical question, not a political, idealogical or a theoretical one, I think it makes sense to look at the numbers on dividends and buybacks, not just in the US, but across the world, and I will do so with a series of data-driven statements.
1. More companies are buying back stock, and more cash is being returned in buybacks Are US companies returning more and more cash in the form of buybacks? Yes, they are, and it represents a trend that saw its beginnings, not ten years ago, but in the 1980s. In the graph below, I look at the aggregate dividends and buybacks from firms in the S&P 500 since 1986, and also report on the percentage of cash returned that takes the form of buybacks, each year:

Starting at a base in the early 1980s, where buybacks were uncommon and dividends represented almost all cash return, you can see buybacks climb through the 1980s and 1990s, both in dollar value terms and as a percentage of overall cash return. That trend has only accelerated in this century, with the 2008 crisis putting a brief crimp on it. In 2018, more than 60% of the cash returned by S&P 500 companies was in the form of buybacks, amounting to almost $700 billion.
2. Cash Returns are rising as a percent of earnings, and it looks like companies are reinvesting less back into their own businessesIf you look at the graph above, you can see that the rise in buybacks has been accompanied by a stagnation in dividends, with growth rates in dividends substantially falling short of growth in buybacks. This shift has had consequences for two widely used measures of cash return, dividend yield, which looks at dividends as a percent of market capitalization or stock prices and the dividend payout ratio, a measure of the proportion of earnings as dividends. The declining role of dividends, as a form of cash return, has meant that a more relevant measure of cash return has to incorporate stock buybacks, resulting in a broader definition of cash yield and cash payout ratio measures:Cash Yield = (Dividends + Buybacks) / Market CapitalizationCash Payout Ratio = (Dividends + Buybacks)/ Net IncomeThe push back that you will get from dividend devotees that while dividends go to all shareholders, buybacks put cash only in the pockets of those stockholder who sell back, but that argument ignores the reality that the it is still shareholders who are getting the cash from buybacks. (As a thought experiment, imaging that you own all of the shares in a company and consider whether you notice a difference between dividends and buybacks, other than for tax purposes.) Calculating both dividend and cash measures of yield and payout over time, we observe the following for the companies in the S&P 500:
 S&P 500: Dividends, Buybacks, Mkt Cap and Net IncomeThis table reinforces the message from the previous graph, which is that both dividends and buybacks have to be considered in any assessment of cash return. That is why I think that the handwringing over how low dividend yields have become over the last two decades misses the point. The cash yield for US companies, which includes both dividends and buybacks, is much more indicative of what companies are returning to shareholders and that number has remained relatively stable over time. Using the same logic that I used to argue that cash yields were better indicators of cash returned to shareholders than dividend yields, I computed cash payout ratios, by adding buybacks to dividends, before dividing by net income in the table in the last section, and it does show a disquieting pattern. In fundamental analysis, analysts give weight to the payout ratio and its twin measure, the retention ratio (1- payout ratio) as a measure of how much a company is reinvesting into its own business, in order to grow. The cash returned to shareholders exceeded net income in 2015 and 2016, and remains high, at 92.12% of net income, and that statistic seems to support the proposition that US companies are reinvesting less.
3. The drop in reinvestment may be real, but it could also be a reflection of accounting inconsistencies and failure to see the full picture on cash returnIt is true that companies are returning more of their net income, as measured by accountants, to stockholders in dividends and buybacks, with the latter accounting for the lion's share of the return. Before we conclude that this is proof that companies are reinvesting less, there are two flaws in the numbers that need fixing:Stock Issuances: If we count stock buybacks as returning cash to shareholders, we should also be counting stock issuances as cash being invested by these same shareholders. Thus, the more relevant measure of cash return would net out stock issuances from stock buybacks, before adding dividends. While this is a lesser issue with the S&P 500 companies, which tend to be larger and more mature companies, less dependent of stock issuances, it can be a larger one for the entire market, where initial public offerings can augment seasoned equity issues, especially for smaller, higher growth companies.Accounting Inconsistencies: Over the last few decades, the percentage of S&P 500 companies that are in technology and health care has risen, and that rise has laid bare an accounting inconsistency on capital expenditures. If a key characteristic of capital expenditures is that money spent on them provide benefits for many years, accounting does a reasonable job in categorizing capital expenditures in manufacturing firms, where it takes the form of plant and equipment, but it does a woeful job of doing the same at firms that derive the bulk of their value from intangible assets. In particular, it treats R&D, the primary capital expenditure for technology and health care firms, brand name advertising, a key investment for the long term for consumer product companies, and customer acquisition costs, central for growth in subscriber/user driven companies as operating expenses, depressing earnings and rendering book value meaningless. In effect, companies on the S&P 500 are having their earnings measured using different rules, with the earnings for GM and 3M reflecting the correct recognition that money spent on investments designed to create benefits over many years should not be expensed, but the earnings for Microsoft and Apple being calculated after netting those same types of investments. As with the treatment of leases, I refuse to wait for accountants to come to their senses on this question, and I have been capitalizing R&D for all companies and adjusting their earnings accordingly. In the table below, I bring in stock issues and R&D into the picture, looking across all US stocks, not just the S&P 500:
 All US publicly traded companies; S&P Capital IQWhile the trend towards buybacks is still visible, bringing in new stock issuances tempers some of the most extreme findings. In 2018, for instance, the net cash return (with issuances netted out from dividends and buybacks) represented about 46% of adjusted net profit (with R&D added back), well below the gross cash return. In fact, there is no discernible decline in reinvestment over time, barring 2008 and 2009, the years around the last crisis. Capital expenditures have grown slowly, but an increasing percentage of reinvestment, especially in the last 5 years, has taken the form of R&D and acquisitions.
 4. Buybacks cut across sectors, size classes and growth categories, but the biggest cash returners are larger, more mature companies. Before we decide that buybacks are ravaging the economy and should be restricted or even banned, it is also worth taking a look at what types of companies are buying back the most stock. Staying with US stocks, I looked at buybacks and dividends of companies, broken down by industry grouping. The full table is at the end of this post, but based upon the dollar value of buybacks, the ten industries that bought back the least stock and the ten that bought back the most are highlighted below:
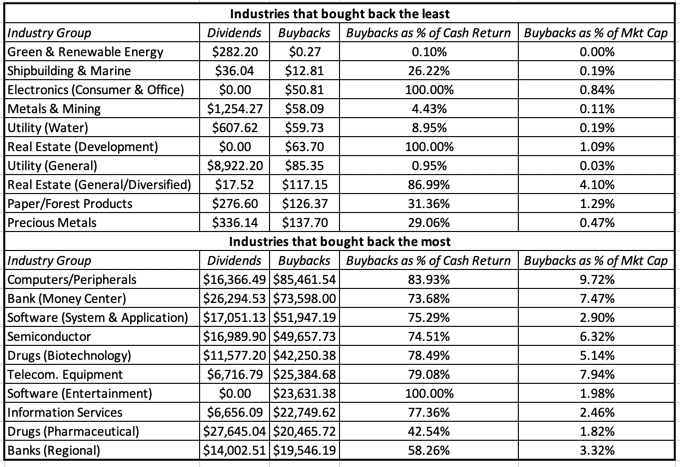 Dividends and Buybacks: By Industry for USIt should come as no surprise that the industries where you see buybacks used the least tend to be industries which have a history of large dividend payments, with utilities, metals and mining and real estate making the list. Looking at the industries that are the biggest buyers of their own stock, the list is dominated by companies that derive their value from intangible assets, with technology and pharmaceuticals accounting for seven of the ten top spots. While that may surprise some, since these are viewed as high growth businesses, some of the biggest players in both technology and pharmaceuticals are now middle aged or older, using my corporate life cycle structure.
Given that there are often wide differences in size and growth, within each industry grouping, I also broke companies down by market cap size, to see if smaller companies behave differently than larger ones, when it comes to buybacks:
 Market capitalization, as of 12/31/18It is not surprising that the largest companies account for the bulk of buybacks, but you can also see that they return far more in buybacks, as a percent of their market capitalizations, then smaller firms do.
 Finally, I categorized companies based upon expected growth in the future, to see if companies that expect high growth behave differently from ones that expect low growth.
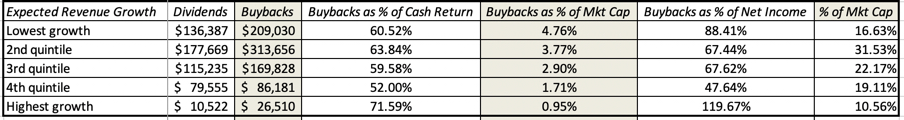 Expected revenue growth in the next two yearsWhile companies in every growth class have jumped on the buyback bandwagon, the biggest buybacks in absolute and relative terms are for companies that have the lowest expected growth in revenues, returning 4-5% of their market capitalization in buybacks each year. Companies in the highest growth class, in contrast, return only 0.95% of their buybacks. That said, there are companies in higher growth classes that are buying back stock, when they should not be, perhaps for short term pricing reasons, but they represent only a small portion of the market, accounting collectively for only 10.56% of overall market capitalization.
I may be guilty of letting my priors guide my reading of these tables, but as I see it, the buyback boom in the United States is being driven by large non-manufacturing firms, with low growth prospects. If you restrict buybacks, expecting that this to unleash a new era of manufacturing growth and factory jobs, I am afraid that you will be disappointed. The workers at the firms that buy back the most stock, tend to be already among the better paid in the economy, and tying buybacks to higher wages for these workers will not help those who are at the bottom of the pay scale.
5. Investing back into businesses is not always better than returning cash to shareholders, when it comes to jobs, economic growth and prosperity.Implicit in the Schumer-Sanders proposal to restrict buy backs is the belief that while shareholders may benefit from buybacks, the economy overall will be more prosperous, and workers will be better served, if the cash that is returned to shareholders is invested back in the businesses instead. Incidentally, this seems to be a shared delusion for both ends of the political spectrum, since one of the biggest sales pitches for the tax reform act, passed in 2017, was that the cash trapped overseas by bad US tax law, would, once released, be invested into new factories and manufacturing capacity in the US. I believe that both sides are operating from a false premise, since investing money back into bad businesses can make both economies and workers worse off. In a prior post, I defined a bad business as one where it is difficult to generate a return that is higher than the risk adjusted rate that you need to make to break even on your investment.
 Data Update 6 on excess returnsUsing the return on capital, a flawed but still useful measure, as a measure of return and the cost of capital, with all of the caveats about measurement error, I found that approximately 60% of companies, both globally and in the US, earn less than their cost of capital. Forcing these companies to reinvest their earnings, rather than letting them pay it out, will only put more more money into bad businesses and create what I call "walking dead" companies, tying up capital that could be used more productively, if it were paid out to shareholders, who then can find better businesses to invest in.
 6. Some companies may be funding buybacks with debt, but the bulk of buybacks are still funded with equity cash flowsThe narrative about stock buybacks that its detractors tell is that US companies have borrowed money and used that debt to fund buybacks, creating, at least in the narrative, sky-high debt ratios and rising default risk. While there is certainly anecdotal evidence that you can offer for this proposition, there is evidence that we have looked at already that should lead you to question this narrative. Looking across sectors, we noted that the technology and pharmaceutical companies are on the list of biggest buyers of their own stock, and neither group is in the top ten or even twenty, when it comes to debt ratios.

Taking the naysayers at their word, I broke US companies down, based upon their debt loads, using Debt/EBITDA as the measure, from lowest to highest, to see if there is a relationship between buybacks and debt loads:
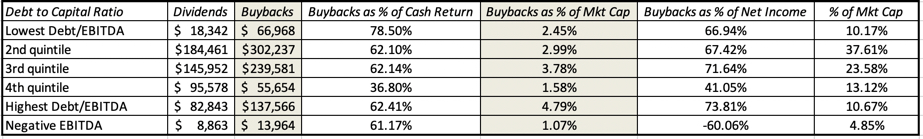 Debt to EBITDA at the end of 2018The bulk of the buybacks are coming from firms with low to moderate debt ratios, falling in the second and third quintiles of debt ratios. It is true that the firms with the highest debt load, buy back the most stock, at least as a percent of their market capitalization. As with the growth data, you can view this as evidence of either short-term thinking or worse, but note that the second and third quintiles together account for 61% of overall market capitalization, suggesting that if buybacks are skewing debt upwards at some firms, it is more at the margins than at the center of the market.
 7. Buybacks are now a global phenomenonIt is true that stock buybacks, at least in the form that you see them today, as cash return to stockholders, had their origins in the United States in the 1980s and it is also true that for a long time after that, much of the rest of the world either stayed with dividends and many countries had severe constraints on the use of buybacks. In the last decade, though, the dam seems to have broken and stock buybacks can now be seen in every part of the world, as can be seen in the table below:

US companies still lead the world in buybacks, but Canadian companies are playing catch up and you are seeing buybacks pick up in Europe. Asia, Eastern Europe and Latin America remain holdouts, though it is unclear how much of the reluctance to buy back stock is due to poor corporate governance.
The Follow Up I agree that wage stagnation and an unwillingness to invest into the industrial base are significant problems for US companies, but I think that buybacks are more a symptom of global economic changes, than a cause. In particular, globalization has made it more difficult for companies to generate sustained returns on investments, and has made earnings more volatile for all businesses. The lower returns on investments has led to more cash being returned, and the fear of earnings volatility has tilted companies away from dividends, which are viewed as more difficult to back out of, to buybacks. In conjunction, a shift from an Industrial Age economy to the economies of today has meant that our biggest businesses are less capital intensive and more dependent on investments in intangible assets, a trend that accounting has not been able to keep up with. You can ban or restrict buybacks, but that will not make investment projects more lucrative and earnings more predictable, and it certainly is not going to create a new industrial age.
If you came into this article with a strong bias against buybacks it is unlikely that I will be able to convince you that buybacks are benign, and it is very likely that you will be in favor, like Senators Schumer and Sanders, on restricting not just buybacks, but cash returns (including dividends), in general. Playing devil’s advocate, let’s assume that you succeed and play out what the effects of these restrictions will be on how much companies invest collectively and employee wages.On the investment front, it is true that companies that used to buy back large numbers of their own shares will now have more cash to invest, but in what? It could be in more internal investments or projects, but given that many of these companies were buying back stock because they could not find good projects in the first place, it would have to be in projects that don’t earn a high enough returns to cover their hurdle rates. Perhaps, it will be in acquisitions, and while that will make M&A deal makers happy, the corporate track record is woeful. In either case, you will have more reinvestment in the wrong segments of the economy, at the expense of investments in the segments that need them more.On the wage front, the consequences will be even messier. It is possible that tying buybacks to employee wages, as Senators Schumer and Sanders propose, will cause some companies to raise wages for existing employees, but with what consequences? Since they will now be paying much higher wages than their competitors, my guess is that these same companies will be quicker to shift to automation and will have smaller workforces in the future, and that those at the low end of the pay scale will be most hurt by this substitution. Illustrating my point about anecdotal evidence, the senators use Walmart and Harley Davidson to make their case, arguing that both companies should not have expended the money that they did on buybacks, and taken investments or raised wages instead. Assuming that Walmart had followed their advice and not bought back stock and invested instead, it is unlikely that Walmart would have opened more stores in the United States, a saturated market, but would have opened them instead in other countries, and I don’t believe that the senators would view more stores being built in Indonesia or India as the outcome they were hoping for. As for Harley Davidson, a company that serves a loyal, but niche market, building another factory may have created more jobs for the moment, but it is not at all clear that the demand exists for the bikes that would roll out.Would Walmart have raised wages, if they had not bought back stock? In a retail landscape, where Amazon lays waste to any competitor with a higher cost structure, that would have been suicidal, and accelerated the flow of customers to Amazon, allowing that company to become even more dominant. In a world where people complain about how the FANG stocks are taking over the world, you would be playing into their hands, by handcuffing their brick and mortar competitors, with buyback legislation.In short, restricting buybacks may lead to more reinvestment, but much of it will be in bad businesses, acquisitions of existing entities and often in other countries. Tying buybacks to employee wage levels may boost the pay for existing employees, but will lead to fewer new hires, increasing automation and smaller workforces over time. In short, the ills that the Schumer-Sanders bill tries to cure will get worse, as a result of their efforts, rather than better.
ConclusionI believe that the shift to buybacks reflects fundamental shifts in competition and earnings risk, but I don't wear rose colored glasses, when looking at the phenomenon. There are clearly some firms that are buying back stock, when they clearly should not be, paying out cash that could be better used on paying down debt, especially in the aftermath of the reduction of tax benefits of debt, or taking investments that can generate returns that exceed their hurdle rates. You may consider me naive, but I believe that the market, while it may be fooled for the moment, will catch on and punish these firms. Also, the data suggests that these bad players are more the exception than the rule, and banning all buybacks or writing in restrictions on buybacks for all companies strikes me as overkill, especially since the promised benefits of higher capital investment and wages are likely to be illusory or transitory. If you are tempted to back these restrictions, because you believe they are well intentioned, it is worth remembering that history is full of well intentioned legislation delivering perverse results.
YouTube Video
DatasetsDividends and Buybacks in 2018- By industryDividends and Buybacks in 2018- By countryPapers
Dealing with Intangibles: Valuing Brand Names, Flexibility and Patents
January 2019 Data UpdatesData Update 1: A Reminder that equities are risky, in case you forgot!Data Update 2: The Message from Bond MarketsData Update 3: Playing the Numbers GameData Update 4: The Many Faces of RiskData Update 5: Of Hurdle Rates and Funding Costs!Data Update 6: Profitability and Value Creation!Data Update 7: Debt, neither poison nor nectar!Data Update 8: Dividends and Buybacks - Fact and Fiction!
<!-- /* Style Definitions */ p.MsoNormal, li.MsoNormal, div.MsoNormal {mso-style-unhide:no; mso-style-qformat:yes; mso-style-parent:""; margin:0in; margin-bottom:.0001pt; mso-pagination:widow-orphan; font-size:12.0pt; font-family:"Calibri",sans-serif; mso-ascii-font-family:Calibri; mso-ascii-theme-font:minor-latin; mso-fareast-font-family:Calibri; mso-fareast-theme-font:minor-latin; mso-hansi-font-family:Calibri; mso-hansi-theme-font:minor-latin; mso-bidi-font-family:"Times New Roman"; mso-bidi-theme-font:minor-bidi;} p.MsoListParagraph, li.MsoListParagraph, div.MsoListParagraph {mso-style-priority:34; mso-style-unhide:no; mso-style-qformat:yes; margin-top:0in; margin-right:0in; margin-bottom:0in; margin-left:.5in; margin-bottom:.0001pt; mso-add-space:auto; mso-pagination:widow-orphan; font-size:12.0pt; font-family:"Calibri",sans-serif; mso-ascii-font-family:Calibri; mso-ascii-theme-font:minor-latin; mso-fareast-font-family:Calibri; mso-fareast-theme-font:minor-latin; mso-hansi-font-family:Calibri; mso-hansi-theme-font:minor-latin; mso-bidi-font-family:"Times New Roman"; mso-bidi-theme-font:minor-bidi;} p.MsoListParagraphCxSpFirst, li.MsoListParagraphCxSpFirst, div.MsoListParagraphCxSpFirst {mso-style-priority:34; mso-style-unhide:no; mso-style-qformat:yes; mso-style-type:export-only; margin-top:0in; margin-right:0in; margin-bottom:0in; margin-left:.5in; margin-bottom:.0001pt; mso-add-space:auto; mso-pagination:widow-orphan; font-size:12.0pt; font-family:"Calibri",sans-serif; mso-ascii-font-family:Calibri; mso-ascii-theme-font:minor-latin; mso-fareast-font-family:Calibri; mso-fareast-theme-font:minor-latin; mso-hansi-font-family:Calibri; mso-hansi-theme-font:minor-latin; mso-bidi-font-family:"Times New Roman"; mso-bidi-theme-font:minor-bidi;} p.MsoListParagraphCxSpMiddle, li.MsoListParagraphCxSpMiddle, div.MsoListParagraphCxSpMiddle {mso-style-priority:34; mso-style-unhide:no; mso-style-qformat:yes; mso-style-type:export-only; margin-top:0in; margin-right:0in; margin-bottom:0in; margin-left:.5in; margin-bottom:.0001pt; mso-add-space:auto; mso-pagination:widow-orphan; font-size:12.0pt; font-family:"Calibri",sans-serif; mso-ascii-font-family:Calibri; mso-ascii-theme-font:minor-latin; mso-fareast-font-family:Calibri; mso-fareast-theme-font:minor-latin; mso-hansi-font-family:Calibri; mso-hansi-theme-font:minor-latin; mso-bidi-font-family:"Times New Roman"; mso-bidi-theme-font:minor-bidi;} p.MsoListParagraphCxSpLast, li.MsoListParagraphCxSpLast, div.MsoListParagraphCxSpLast {mso-style-priority:34; mso-style-unhide:no; mso-style-qformat:yes; mso-style-type:export-only; margin-top:0in; margin-right:0in; margin-bottom:0in; margin-left:.5in; margin-bottom:.0001pt; mso-add-space:auto; mso-pagination:widow-orphan; font-size:12.0pt; font-family:"Calibri",sans-serif; mso-ascii-font-family:Calibri; mso-ascii-theme-font:minor-latin; mso-fareast-font-family:Calibri; mso-fareast-theme-font:minor-latin; mso-hansi-font-family:Calibri; mso-hansi-theme-font:minor-latin; mso-bidi-font-family:"Times New Roman"; mso-bidi-theme-font:minor-bidi;} .MsoChpDefault {mso-style-type:export-only; mso-default-props:yes; font-family:"Calibri",sans-serif; mso-ascii-font-family:Calibri; mso-ascii-theme-font:minor-latin; mso-fareast-font-family:Calibri; mso-fareast-theme-font:minor-latin; mso-hansi-font-family:Calibri; mso-hansi-theme-font:minor-latin; mso-bidi-font-family:"Times New Roman"; mso-bidi-theme-font:minor-bidi;} @page WordSection1 {size:8.5in 11.0in; margin:1.0in 1.0in 1.0in 1.0in; mso-header-margin:.5in; mso-footer-margin:.5in; mso-paper-source:0;} div.WordSection1 {page:WordSection1;} /* List Definitions */ @list l0 {mso-list-id:398942054; mso-list-type:hybrid; mso-list-template-ids:-1922145872 67698703 67698713 67698715 67698703 67698713 67698715 67698703 67698713 67698715;} @list l0:level1 {mso-level-tab-stop:none; mso-level-number-position:left; text-indent:-.25in;} @list l0:level2 {mso-level-number-format:alpha-lower; mso-level-tab-stop:none; mso-level-number-position:left; text-indent:-.25in;} @list l0:level3 {mso-level-number-format:roman-lower; mso-level-tab-stop:none; mso-level-number-position:right; text-indent:-9.0pt;} @list l0:level4 {mso-level-tab-stop:none; mso-level-number-position:left; text-indent:-.25in;} @list l0:level5 {mso-level-number-format:alpha-lower; mso-level-tab-stop:none; mso-level-number-position:left; text-indent:-.25in;} @list l0:level6 {mso-level-number-format:roman-lower; mso-level-tab-stop:none; mso-level-number-position:right; text-indent:-9.0pt;} @list l0:level7 {mso-level-tab-stop:none; mso-level-number-position:left; text-indent:-.25in;} @list l0:level8 {mso-level-number-format:alpha-lower; mso-level-tab-stop:none; mso-level-number-position:left; text-indent:-.25in;} @list l0:level9 {mso-level-number-format:roman-lower; mso-level-tab-stop:none; mso-level-number-position:right; text-indent:-9.0pt;} @list l1 {mso-list-id:1397242339; mso-list-type:hybrid; mso-list-template-ids:-614431912 67698703 67698713 67698715 67698703 67698713 67698715 67698703 67698713 67698715;} @list l1:level1 {mso-level-tab-stop:none; mso-level-number-position:left; text-indent:-.25in;} @list l1:level2 {mso-level-number-format:alpha-lower; mso-level-tab-stop:none; mso-level-number-position:left; text-indent:-.25in;} @list l1:level3 {mso-level-number-format:roman-lower; mso-level-tab-stop:none; mso-level-number-position:right; text-indent:-9.0pt;} @list l1:level4 {mso-level-tab-stop:none; mso-level-number-position:left; text-indent:-.25in;} @list l1:level5 {mso-level-number-format:alpha-lower; mso-level-tab-stop:none; mso-level-number-position:left; text-indent:-.25in;} @list l1:level6 {mso-level-number-format:roman-lower; mso-level-tab-stop:none; mso-level-number-position:right; text-indent:-9.0pt;} @list l1:level7 {mso-level-tab-stop:none; mso-level-number-position:left; text-indent:-.25in;} @list l1:level8 {mso-level-number-format:alpha-lower; mso-level-tab-stop:none; mso-level-number-position:left; text-indent:-.25in;} @list l1:level9 {mso-level-number-format:roman-lower; mso-level-tab-stop:none; mso-level-number-position:right; text-indent:-9.0pt;} @list l2 {mso-list-id:1521316037; mso-list-type:hybrid; mso-list-template-ids:26616284 -1544508952 67698691 67698693 67698689 67698691 67698693 67698689 67698691 67698693;} @list l2:level1 {mso-level-number-format:bullet; mso-level-text:-; mso-level-tab-stop:none; mso-level-number-position:left; margin-left:.75in; text-indent:-.25in; font-family:"Calibri",sans-serif; mso-fareast-font-family:Calibri; mso-fareast-theme-font:minor-latin;} @list l2:level2 {mso-level-number-format:bullet; mso-level-text:o; mso-level-tab-stop:none; mso-level-number-position:left; margin-left:1.25in; text-indent:-.25in; font-family:"Courier New";} @list l2:level3 {mso-level-number-format:bullet; mso-level-text:; mso-level-tab-stop:none; mso-level-number-position:left; margin-left:1.75in; text-indent:-.25in; font-family:Wingdings;} @list l2:level4 {mso-level-number-format:bullet; mso-level-text:; mso-level-tab-stop:none; mso-level-number-position:left; margin-left:2.25in; text-indent:-.25in; font-family:Symbol;} @list l2:level5 {mso-level-number-format:bullet; mso-level-text:o; mso-level-tab-stop:none; mso-level-number-position:left; margin-left:2.75in; text-indent:-.25in; font-family:"Courier New";} @list l2:level6 {mso-level-number-format:bullet; mso-level-text:; mso-level-tab-stop:none; mso-level-number-position:left; margin-left:3.25in; text-indent:-.25in; font-family:Wingdings;} @list l2:level7 {mso-level-number-format:bullet; mso-level-text:; mso-level-tab-stop:none; mso-level-number-position:left; margin-left:3.75in; text-indent:-.25in; font-family:Symbol;} @list l2:level8 {mso-level-number-format:bullet; mso-level-text:o; mso-level-tab-stop:none; mso-level-number-position:left; margin-left:4.25in; text-indent:-.25in; font-family:"Courier New";} @list l2:level9 {mso-level-number-format:bullet; mso-level-text:; mso-level-tab-stop:none; mso-level-number-position:left; margin-left:4.75in; text-indent:-.25in; font-family:Wingdings;} @list l3 {mso-list-id:1734893140; mso-list-type:hybrid; mso-list-template-ids:-1138469626 -1544508952 67698691 67698693 67698689 67698691 67698693 67698689 67698691 67698693;} @list l3:level1 {mso-level-number-format:bullet; mso-level-text:-; mso-level-tab-stop:none; mso-level-number-position:left; text-indent:-.25in; font-family:"Calibri",sans-serif; mso-fareast-font-family:Calibri; mso-fareast-theme-font:minor-latin;} @list l3:level2 {mso-level-number-format:bullet; mso-level-text:o; mso-level-tab-stop:none; mso-level-number-position:left; text-indent:-.25in; font-family:"Courier New";} @list l3:level3 {mso-level-number-format:bullet; mso-level-text:; mso-level-tab-stop:none; mso-level-number-position:left; text-indent:-.25in; font-family:Wingdings;} @list l3:level4 {mso-level-number-format:bullet; mso-level-text:; mso-level-tab-stop:none; mso-level-number-position:left; text-indent:-.25in; font-family:Symbol;} @list l3:level5 {mso-level-number-format:bullet; mso-level-text:o; mso-level-tab-stop:none; mso-level-number-position:left; text-indent:-.25in; font-family:"Courier New";} @list l3:level6 {mso-level-number-format:bullet; mso-level-text:; mso-level-tab-stop:none; mso-level-number-position:left; text-indent:-.25in; font-family:Wingdings;} @list l3:level7 {mso-level-number-format:bullet; mso-level-text:; mso-level-tab-stop:none; mso-level-number-position:left; text-indent:-.25in; font-family:Symbol;} @list l3:level8 {mso-level-number-format:bullet; mso-level-text:o; mso-level-tab-stop:none; mso-level-number-position:left; text-indent:-.25in; font-family:"Courier New";} @list l3:level9 {mso-level-number-format:bullet; mso-level-text:; mso-level-tab-stop:none; mso-level-number-position:left; text-indent:-.25in; font-family:Wingdings;} @list l4 {mso-list-id:1762292810; mso-list-type:hybrid; mso-list-template-ids:465087120 -1544508952 67698691 67698693 67698689 67698691 67698693 67698689 67698691 67698693;} @list l4:level1 {mso-level-number-format:bullet; mso-level-text:-; mso-level-tab-stop:none; mso-level-number-position:left; text-indent:-.25in; font-family:"Calibri",sans-serif; mso-fareast-font-family:Calibri; mso-fareast-theme-font:minor-latin;} @list l4:level2 {mso-level-number-format:bullet; mso-level-text:o; mso-level-tab-stop:none; mso-level-number-position:left; text-indent:-.25in; font-family:"Courier New";} @list l4:level3 {mso-level-number-format:bullet; mso-level-text:; mso-level-tab-stop:none; mso-level-number-position:left; text-indent:-.25in; font-family:Wingdings;} @list l4:level4 {mso-level-number-format:bullet; mso-level-text:; mso-level-tab-stop:none; mso-level-number-position:left; text-indent:-.25in; font-family:Symbol;} @list l4:level5 {mso-level-number-format:bullet; mso-level-text:o; mso-level-tab-stop:none; mso-level-number-position:left; text-indent:-.25in; font-family:"Courier New";} @list l4:level6 {mso-level-number-format:bullet; mso-level-text:; mso-level-tab-stop:none; mso-level-number-position:left; text-indent:-.25in; font-family:Wingdings;} @list l4:level7 {mso-level-number-format:bullet; mso-level-text:; mso-level-tab-stop:none; mso-level-number-position:left; text-indent:-.25in; font-family:Symbol;} @list l4:level8 {mso-level-number-format:bullet; mso-level-text:o; mso-level-tab-stop:none; mso-level-number-position:left; text-indent:-.25in; font-family:"Courier New";} @list l4:level9 {mso-level-number-format:bullet; mso-level-text:; mso-level-tab-stop:none; mso-level-number-position:left; text-indent:-.25in; font-family:Wingdings;} @list l5 {mso-list-id:1807887743; mso-list-type:hybrid; mso-list-template-ids:-759419238 67698703 67698713 67698715 67698703 67698713 67698715 67698703 67698713 67698715;} @list l5:level1 {mso-level-tab-stop:none; mso-level-number-position:left; text-indent:-.25in;} @list l5:level2 {mso-level-number-format:alpha-lower; mso-level-tab-stop:none; mso-level-number-position:left; text-indent:-.25in;} @list l5:level3 {mso-level-number-format:roman-lower; mso-level-tab-stop:none; mso-level-number-position:right; text-indent:-9.0pt;} @list l5:level4 {mso-level-tab-stop:none; mso-level-number-position:left; text-indent:-.25in;} @list l5:level5 {mso-level-number-format:alpha-lower; mso-level-tab-stop:none; mso-level-number-position:left; text-indent:-.25in;} @list l5:level6 {mso-level-number-format:roman-lower; mso-level-tab-stop:none; mso-level-number-position:right; text-indent:-9.0pt;} @list l5:level7 {mso-level-tab-stop:none; mso-level-number-position:left; text-indent:-.25in;} @list l5:level8 {mso-level-number-format:alpha-lower; mso-level-tab-stop:none; mso-level-number-position:left; text-indent:-.25in;} @list l5:level9 {mso-level-number-format:roman-lower; mso-level-tab-stop:none; mso-level-number-position:right; text-indent:-9.0pt;} </style></div></div>--></div>
February 4, 2019
January 2019 Data Update 7: Debt, neither poison nor nectar!
Debt is a hot button issue, viewed as destructive to businesses by some at one end of the spectrum and an easy value creator by some at the other. The truth, as is usually the case, falls in the middle. In this post, I will look not only at how debt loads vary across companies, regions and industries, but also at how they have changed over the last year. That is because last year should have been a consequential one for financial leverage, especially for US companies, since the corporate tax rate was reduced from close to 40% to approximately 25%. I will also put leases under the microscope, converting lease commitments to debt, as I have been doing for close to two decades, and look at the effect on profit margins and returns, offering a precursor to changes in 2019, when both IFRS and GAAP will finally do the right thing, and start treating leases as debt.
The Debt Trade OffDebt is neither an unmixed good nor an unmitigated disaster. In fact, there are good and bad reasons for companies to borrow money, to fund operations, and in this section, I will look at the trade off, and look at the implications for what types of businesses should be the biggest users of debt, and which ones, the smallest.
The Pluses and MinusesThere are only two ways you can raise capital to fund a business. One is to use owner funds, which can of course range from personal savings in a small start up to issuing shares to the market, for a public company. The other is to borrow money, again ranging from a loan from a family member or friend to bank debt to corporate bonds. The debt equity trade off then boils down to what debt brings to the process, relative to equity, in both good and bad ways.
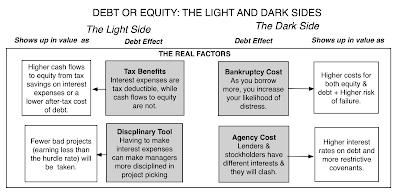 The two big elements driving whether a company should borrow money are the tax code, and how heavily it is tilted towards debt, on the good side and the increased exposure to default and distress, that it also creates, on the bad side. Simply put, companies with stable and predictable earnings streams operating in countries, with high corporate tax rates should borrow more money than companies with unstable earnings or which operate in countries that either have low tax rates or do not allow for interest tax deductions. For financial service firms, the decision on debt is more complex, since debt is less source of capital and more raw material to a bank. As a consequence, I will look at only non-financial service firms in this post, but I plan to do a post dedicate to just financial service firms.
US Tax Reform - Effect on DebtIf one of the key drivers of how much you borrow is the corporate tax code, last year was an opportunity to see this force in action, at least in the US. At the start of 2018, the US tax code was changed in two ways that should have affected the tax benefits of debt:The federal corporate tax rate was lowered from 35% to 21%. Adding state and local taxes to this, the overall corporate tax rate dropped from close to 40% to about 25%.Restrictions were put on the deductibility of interest expenses, with amounts exceeding 30% of taxable income no longer receiving the tax benefit.Since there were no significant changes to bankruptcy laws or costs, these tax code changes make debt less attractive, relative to equity, for all US companies. In fact, as I argued in this post at the start of 2018, if US companies are weighing the pros and cons correctly, they should have reduced their debt exposure during the course of 2018.
While I have data only through through the end of the third quarter of 2018, I look at the change in total debt, both gross and net, at non-financial service US companies, over the year (by comparing to the debt at the end of the third quarter of 2017).
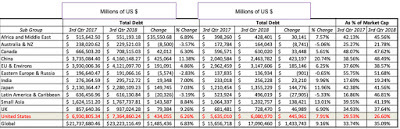 Download debt change, by industryIn the aggregate, US non-financial service companies did not reduce debt, but instead added $434 billion to their debt load, increasing their total debt from $6,931 billion to $7,365 billion between September 2017 and September 2018. That represented only a 6.26% increase over the year, and was accompanied by a decline in debt as a percent of market capitalization, but that increase is still surprising, given the drop in the marginal tax rate and the ensuing loss of tax benefits from borrowing. There are three possible explanations:Inertia: One of the strongest forces in corporate finance is inertia, where companies continue to do what they have always done, even when the reasons for doing so have long since disappeared. It is possible that it will be years before companies wake up to the changed tax environment and start borrowing less.Uncertainty about future tax rates: It is also possible that companies view the current tax code as a temporary phase and that the drop in corporate tax rates will be reversed by future administrations.Illusory and Transient Benefits: Many companies perceive benefits in debt that I term illusory, because they create value, only if you ignore the full consequences of borrowing. I have captured these illusory benefits in the table below: Put simply, the notion that debt will lower your cost of capital, just because it is lower than your cost of equity, is widely held, but just not true, and while using debt will generally increase your return on equity, it will also proportionately increase your cost of equity.
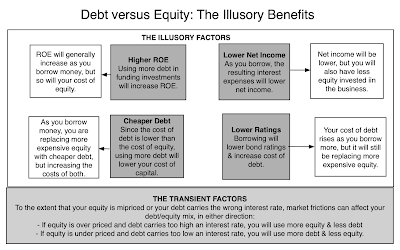 I will continue tracking debt levels through the coming years, and assuming no bounce back in corporate tax rates, we should get confirmation as to whether the tax hypothesis holds.
Debt: DefinitionThe tax law changed the dynamics of the debt/equity tradeoff, but there is an accounting change coming this year, which will have a significant impact on the debt that you see reported on corporate balance sheets around the world, and since this is the debt that most companies and data services use in measuring financial leverage. Specifically, accountants and their rule writers are finally going to come to their senses and plan to start treating lease commitments as debt, plugging what I have always believed is the biggest source of off balance sheet debt.
Debt: DefinitionIn my financing construct for a business, I argue that there are two ways that a business, debt (bank loans, corporate bonds) and equity (owner's funds), but to get a sense of how the two sources of capital vary, I looked at the differences:
Specifically, there are two characteristics that set debt apart from equity. The first is that debt creates a contractual or fixed claim that the firm is obligated to meet, in good and bad times, whereas equity gives rise to a residual claim, where the firm has the flexibility not to make any payments, in bad times. The second is that with debt, a failure to meet a contractual commitment, will lead to a loss of control of the firm and perhaps default, whereas with equity, a failure to meet an expected commitment (like paying dividends) can lead to a drop in market value but not to distress. Finally, in liquidation, debt holders get first claim on the assets and equity gets whatever, if any, is left over. Using this definition of debt, we can navigate through a balance sheet and work out what should be included in debt and what should not. If the defining features for debt are contractual commitments, with a loss of control and default flowing from a failure to meet them, it follows that all interest bearing debt, short term as well as long term, bank loans and corporate bonds, are debt. Staying on the balance sheet, though, there are items that fall in a gray area:
Accounts Payable and Supplier Credit: There can be no denying that a company has to pay back supplier credit and honor its accounts payable, to be a continuing business, but these liabilities often have no explicit interest costs. That said, the notion that they are free is misplaced, since they come with an implicit cost. To make use of supplier credit, for instance, you have to give up discounts that you could have obtained if you paid on delivery. The bottom line in valuation and corporate finance is simple. If you can estimate these implicit expenses (discounts lost) and treat them as actual interest expenses, thus altering your operating income and net income, you can treat these items as debt. If you find that task impossible or onerous, since it is often difficult to back out of financial reports, you should not consider these items debt, but instead include them as working capital (which affects cash flows).Underfunded Pension and Health Care Obligations: Accounting rules around the world have moved towards requiring companies to report whether their defined-benefit pension plans or health care obligations are underfunded, and to show that underfunding as a liability on balance sheets. In some countries, this disclosure comes with legal consequences, where the company has to set aside funds to cover these obligations, akin to debt payments, and if this is the case, they should be treated as debt. In much of the world, including the United States, the disclosure is more for informational purposes and while companies are encouraged to cover them, there is no legal obligation that follows. In these cases, you should not consider these underfunded obligations to be debt, though you may still net them out of firm value to get to equity value.The table below provides the breakdown of debt for non-financial service companies around the world.
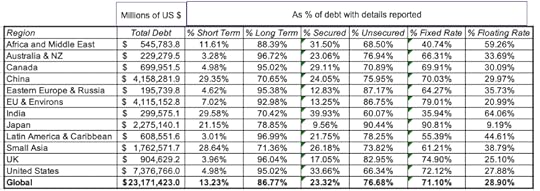 Debt Details, by Industry (US)As you browse this table, please keep in mind that disclosure on the details of debt varies widely across companies, and this table cannot plug in holes created by non-disclosure. To the extent that company disclosures are complete, you can see that there are differences in debt type across regions, with a greater reliance on short term debt in Asia, a higher percent of unsecured and fixed rate debt in Japan and more variable rate, secured debt in Africa, India and Latin America than in Europe or the US. You can get the debt details, by industry, for regional breakdowns at the link at the end of this post.
Debt Load: Balance Sheet Debt
Using all interest bearing debt as debt in looking at companies, we can raise and answer fundamental questions about leverage at companies. Broadly speaking, the debt load at a company can be scaled to either the value of the company or to its earnings and cash flows. Both measures are useful, though they measure different aspects of debt load:
a. Debt and Value
Earlier, I noted that there are two ways you can fund a business, debt and equity, and a logical measure of financial leverage that follows is to look at how much debt a firm uses, relative to its equity. That said, there are two competing measures of value, and especially for equity, the divergence can be wide.
The first is the book value, which is the accountant's estimate of how much a business and its equity are worth. While value investors attach significant weight to this number, it reflects all of the weaknesses that accounting brings to the table, a failure to adjust for time value of money, an unwillingness to consider the value for current market conditions and an inability to deal with investments in intangible assets. The second is market value, which is the market's estimate, with all of the pluses and minuses that go with that value. It is updated constantly, with no artificial lines drawn between tangible and intangible assets, but it is also volatile, and reflects the pricing game that sometimes can lead prices away from intrinsic value.In the graph below, I look at debt as a percent of capital, first using book values for debt and equity, and next using market value. Debt ratios, by industry (US)In the table below, I break out debt as a percent of overall value (debt + equity) using both book value and market value numbers, and look at the distribution of these ratios globally:
Embedded in the chart is a regional breakdown of debt ratios, and even with these simple measures of debt loads, you can see how someone with a strong prior point of view on debt, pro or con, can find a number to back that view. Thus, if you want to argue as some have that the Fed (which is blamed for almost everything that happens under the sun), low interest rates and stock buybacks have led US companies to become over levered, you will undoubtedly point to book debt ratios to make your case. In contrast, if you have a more sanguine view of financial leverage in the US, you will point to market debt ratios and perhaps to the earnings and cash flow ratios that I will report in the next section. On this debate, at least, I think that those who use book value ratios to make their case hold a weak hand, since book values, at least in the US and for almost every sector other than financial, have lost relevance as measures of anything, other than accounting ineptitude.
b. Debt and Earnings/CashflowsDebt creates contractual obligations in the form of interest and principal payments, and these payments have to be covered by earnings and cash flows. Thus, it is sensible to measure how much buffer, or how little, a firm has by scaling debt payments to earnings and cash flows, and here are two measures:
Debt to EBITDA: It is true that EBITDA is an intermediate cash flow, not a final one, since you still have to pay taxes and invest in growth, before you get a residual cash flow. That said, it is a proxy for how much cash flow is being generated by existing investments, and dividing the total debt by EBITDA is a measure of overall debt load, with lower numbers translating into less onerous loads.Interest Coverage Ratio: Dividing the operating income (EBIT) by interest expenses, gives us a different measure of safety, one that is more immediately tied to default risk and cost of debt than debt to EBITDA. Firms that generate substantial operating income, relative to interest expenses, are safer, other things remaining equal, than firms that operate with lower interest coverage ratios. In the table below, I look at the distributions of both these numbers, again broken down by region of the world:
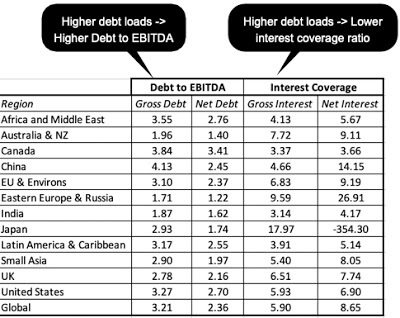 Debt ratios, by industry (US)Again, the story you tell can be very different, based upon which number you look at. Chinese companies have the most debt in the world, if you define debt as gross debt, but look close to average, when you look at net debt. Indian companies look lightly levered, if you look at Debt to EBITDA multiples, but have the most exposure to debt, if you use interest coverage ratios to measure debt load.
Operating Leases: The Accounting NetherworldGoing back to the definition of debt as financing that comes with contractually set obligations, where failure to meet these obligations can lead to loss of control and default, it is clear that focusing on only the balance sheet (as we have so far) is dangerous, since there are other claims that companies create that meet these conditions. Consider lease agreements, where a retailer or a restaurant business enters into a multi-year agreement to make lease payments, in return for using a store front or building. The lease payments are clearly set out by contract, and failing to make these payments will lead to loss of that site, and the income from it. You can argue that leases providing more flexibility that a bank loan and that defaulting on a lease is less onerous, because the claims are against a specific location and not the business, but those are arguments about whether leases are more like unsecured debt than secured debt, and not whether leases should be treated as debt. For much of accounting history, though, accountants have followed a different path, treating only a small subset of leases as debt and bringing them on to the balance sheet as capital leases, while allowing the bulk of lease expenses as operating expenses and ignoring future lease commitments on balance sheets. The only consolation prize is that both IFRS and GAAP have required companies to show these lease commitments as footnotes to balance sheets.
In my experience, waiting for accountants to do the right thing will leave you twisting in the wind, since it seems to take decades for common sense to prevail. Consequently, I have been treating leases as debt for more than three decades in valuation, and the process for doing so is neither complicated nor novel. In fact, it is the same process that accountants use right now with capital leases and it involves the following steps:
Estimate a current cost of borrowing or pre-tax cost of debt for the company today, given its default risk and current interest rates (and default spreads).Starting with the lease commitment table that is included in the footnotes today, discount each lease commitment back to today, using the pre-tax cost of debt as your discount rate (since the lease commitments are pre-tax). Most companies provide only a lump-sum value for commitments after year 5, and while you can act as if this entire amount will come due in year 6, it makes more sense to convert it into an annuity, before discounting.The sum total of the present value of lease commitments will be the lease debt that will now show up on your balance sheet, but to keep the balance sheet balanced, you will have to create a counter asset. To the extent that the accounting has treated the current year's lease expense as an operating expense, you have to recompute the operating income, reflecting your treatment of leases as debt:Adjusted Operating Income = Stated Operating Income + Current year's lease expense - Depreciation on the leased asset
Capitalizing leases will have large consequences for not just debt ratios at companies (pushing them for companies with significant lease commitments) but also for operating profitability measures (like operating margin) and returns on invested capital (since both operating income and invested capital will be changed). The effects on net margin and return on equity should either be much smaller or non-existent, because equity income is after both operating and capital expenses, and moving leases from one grouping to another has muted consequences. In the table below, I report on debt ratio, operating margin and return on capital. before and after the lease adjustment :
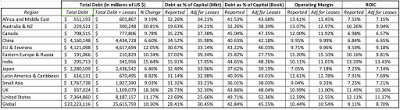 Lease Effect, by Industry, for USYou can download the effects, by industry, for different regions, by using the links at the bottom of this post. Keep in mind, though, that there are parts of the world where lease commitments, though they exist, are not disclosed in financial statements, and as a consequence, I will understate the else effect, While the effect is modest across all companies, the lease effect is larger in sectors that use leases liberally in operations, and to see which sectors are most and least affected, I looked at the ten sectors, among US companies, and not counting financial service firms, that saw the biggest percentage increases in debt ratios and the ten sectors that saw the smallest in the table below:
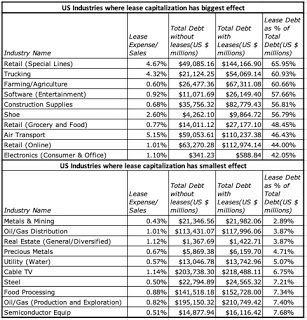 Lease Effect, by Industry, for USNote that there are a large number of retail groupings that rank among the most affected sectors, though a few technology companies also make the cut. As I noted at the start of this post, this year will be a consequential one, since both GAAP and IFRS will start requiring companies to capitalize leases and showing them as debt. While I applaud the dawning of sanity, there are many investors (and equity research analysts) who are convinced that this step will be catastrophic for companies in lease-heavy sectors, since it will be uncover how levered they are. I am less concerned, because markets, unlike accountants, have not been in denial for decades and market prices, for the most part and for most companies, already reflect the reality that leases are debt.
Debt: Final ThoughtsOne of the biggest impediments to any rational discussion of debt's place in capital is the emotional baggage that we bring to that discussion. Debt is neither poison, as some detractors claim it to be, nor is a nectar, as its biggest promoters describe it. It is a source of capital that comes with fixed commitments and the risk of default, good for some companies and bad for others, and when it does create value, it is because the tax code it tilted towards it. It is true that some companies and investors, especially those playing the leverage game, over estimate its benefits and under estimate its side costs, but they will learn their lessons the hard way. It is also true that other companies and investors, in the name of prudence, think that less debt is always better than more debt, and no debt is optimal, and they too are leaving money on the table, by being too conservative.
YouTube Video
Datasets
Debt Change, by Industry Group for US companies, in 2019Debt Details, by Industry Group in 2019 for US, Europe, Emerging Markets, Japan, Australia & Canada, India and ChinaDebt Ratios, by Industry Group in 2019 for US, Europe, Emerging Markets, Japan, Australia & Canada, India and ChinaLease Capitalization Effects, by Industry Group in 2019 for US, Europe, Emerging Markets, Japan, Australia & Canada, India and ChinaPapers
Leases, Debt and Value (SSRN paper on how to capitalize leases and how it might affect value)January 2019 Data UpdatesData Update 1: A Reminder that equities are risky, in case you forgot!Data Update 2: The Message from Bond MarketsData Update 3: Playing the Numbers GameData Update 4: The Many Faces of RiskData Update 5: Of Hurdle Rates and Funding Costs!Data Update 6: Profitability and Value Creation!Data Update 7: Debt, neither poison nor nectar!
The Debt Trade OffDebt is neither an unmixed good nor an unmitigated disaster. In fact, there are good and bad reasons for companies to borrow money, to fund operations, and in this section, I will look at the trade off, and look at the implications for what types of businesses should be the biggest users of debt, and which ones, the smallest.
The Pluses and MinusesThere are only two ways you can raise capital to fund a business. One is to use owner funds, which can of course range from personal savings in a small start up to issuing shares to the market, for a public company. The other is to borrow money, again ranging from a loan from a family member or friend to bank debt to corporate bonds. The debt equity trade off then boils down to what debt brings to the process, relative to equity, in both good and bad ways.
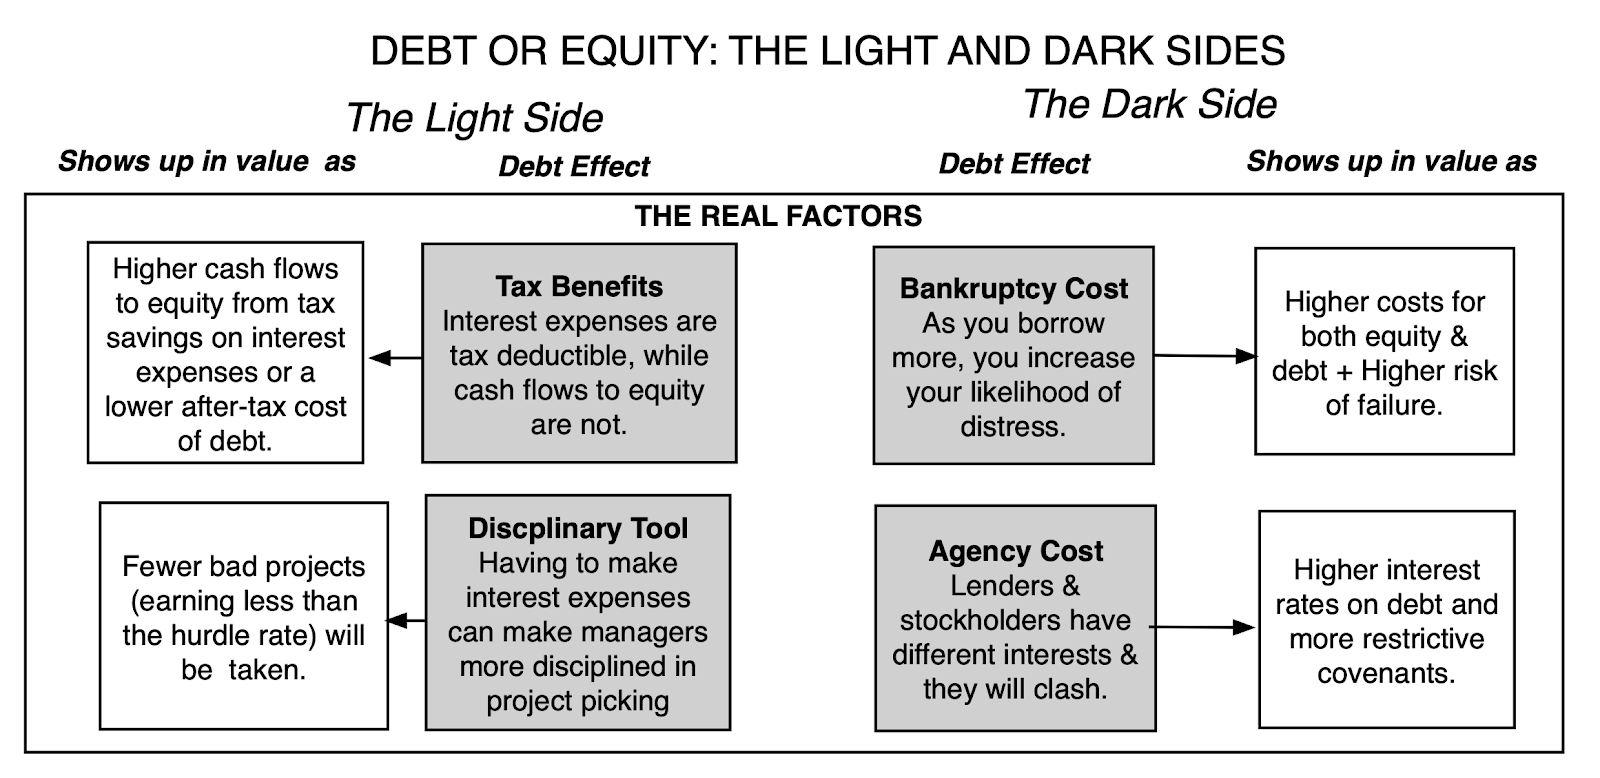 The two big elements driving whether a company should borrow money are the tax code, and how heavily it is tilted towards debt, on the good side and the increased exposure to default and distress, that it also creates, on the bad side. Simply put, companies with stable and predictable earnings streams operating in countries, with high corporate tax rates should borrow more money than companies with unstable earnings or which operate in countries that either have low tax rates or do not allow for interest tax deductions. For financial service firms, the decision on debt is more complex, since debt is less source of capital and more raw material to a bank. As a consequence, I will look at only non-financial service firms in this post, but I plan to do a post dedicate to just financial service firms.
US Tax Reform - Effect on DebtIf one of the key drivers of how much you borrow is the corporate tax code, last year was an opportunity to see this force in action, at least in the US. At the start of 2018, the US tax code was changed in two ways that should have affected the tax benefits of debt:The federal corporate tax rate was lowered from 35% to 21%. Adding state and local taxes to this, the overall corporate tax rate dropped from close to 40% to about 25%.Restrictions were put on the deductibility of interest expenses, with amounts exceeding 30% of taxable income no longer receiving the tax benefit.Since there were no significant changes to bankruptcy laws or costs, these tax code changes make debt less attractive, relative to equity, for all US companies. In fact, as I argued in this post at the start of 2018, if US companies are weighing the pros and cons correctly, they should have reduced their debt exposure during the course of 2018.
While I have data only through through the end of the third quarter of 2018, I look at the change in total debt, both gross and net, at non-financial service US companies, over the year (by comparing to the debt at the end of the third quarter of 2017).
 Download debt change, by industryIn the aggregate, US non-financial service companies did not reduce debt, but instead added $434 billion to their debt load, increasing their total debt from $6,931 billion to $7,365 billion between September 2017 and September 2018. That represented only a 6.26% increase over the year, and was accompanied by a decline in debt as a percent of market capitalization, but that increase is still surprising, given the drop in the marginal tax rate and the ensuing loss of tax benefits from borrowing. There are three possible explanations:Inertia: One of the strongest forces in corporate finance is inertia, where companies continue to do what they have always done, even when the reasons for doing so have long since disappeared. It is possible that it will be years before companies wake up to the changed tax environment and start borrowing less.Uncertainty about future tax rates: It is also possible that companies view the current tax code as a temporary phase and that the drop in corporate tax rates will be reversed by future administrations.Illusory and Transient Benefits: Many companies perceive benefits in debt that I term illusory, because they create value, only if you ignore the full consequences of borrowing. I have captured these illusory benefits in the table below: Put simply, the notion that debt will lower your cost of capital, just because it is lower than your cost of equity, is widely held, but just not true, and while using debt will generally increase your return on equity, it will also proportionately increase your cost of equity.
 I will continue tracking debt levels through the coming years, and assuming no bounce back in corporate tax rates, we should get confirmation as to whether the tax hypothesis holds.
Debt: DefinitionThe tax law changed the dynamics of the debt/equity tradeoff, but there is an accounting change coming this year, which will have a significant impact on the debt that you see reported on corporate balance sheets around the world, and since this is the debt that most companies and data services use in measuring financial leverage. Specifically, accountants and their rule writers are finally going to come to their senses and plan to start treating lease commitments as debt, plugging what I have always believed is the biggest source of off balance sheet debt.
Debt: DefinitionIn my financing construct for a business, I argue that there are two ways that a business, debt (bank loans, corporate bonds) and equity (owner's funds), but to get a sense of how the two sources of capital vary, I looked at the differences:
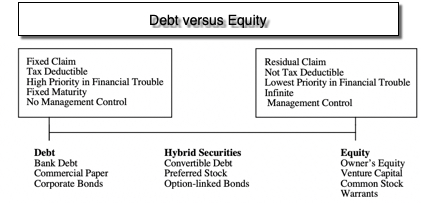
Specifically, there are two characteristics that set debt apart from equity. The first is that debt creates a contractual or fixed claim that the firm is obligated to meet, in good and bad times, whereas equity gives rise to a residual claim, where the firm has the flexibility not to make any payments, in bad times. The second is that with debt, a failure to meet a contractual commitment, will lead to a loss of control of the firm and perhaps default, whereas with equity, a failure to meet an expected commitment (like paying dividends) can lead to a drop in market value but not to distress. Finally, in liquidation, debt holders get first claim on the assets and equity gets whatever, if any, is left over. Using this definition of debt, we can navigate through a balance sheet and work out what should be included in debt and what should not. If the defining features for debt are contractual commitments, with a loss of control and default flowing from a failure to meet them, it follows that all interest bearing debt, short term as well as long term, bank loans and corporate bonds, are debt. Staying on the balance sheet, though, there are items that fall in a gray area:
Accounts Payable and Supplier Credit: There can be no denying that a company has to pay back supplier credit and honor its accounts payable, to be a continuing business, but these liabilities often have no explicit interest costs. That said, the notion that they are free is misplaced, since they come with an implicit cost. To make use of supplier credit, for instance, you have to give up discounts that you could have obtained if you paid on delivery. The bottom line in valuation and corporate finance is simple. If you can estimate these implicit expenses (discounts lost) and treat them as actual interest expenses, thus altering your operating income and net income, you can treat these items as debt. If you find that task impossible or onerous, since it is often difficult to back out of financial reports, you should not consider these items debt, but instead include them as working capital (which affects cash flows).Underfunded Pension and Health Care Obligations: Accounting rules around the world have moved towards requiring companies to report whether their defined-benefit pension plans or health care obligations are underfunded, and to show that underfunding as a liability on balance sheets. In some countries, this disclosure comes with legal consequences, where the company has to set aside funds to cover these obligations, akin to debt payments, and if this is the case, they should be treated as debt. In much of the world, including the United States, the disclosure is more for informational purposes and while companies are encouraged to cover them, there is no legal obligation that follows. In these cases, you should not consider these underfunded obligations to be debt, though you may still net them out of firm value to get to equity value.The table below provides the breakdown of debt for non-financial service companies around the world.
 Debt Details, by Industry (US)As you browse this table, please keep in mind that disclosure on the details of debt varies widely across companies, and this table cannot plug in holes created by non-disclosure. To the extent that company disclosures are complete, you can see that there are differences in debt type across regions, with a greater reliance on short term debt in Asia, a higher percent of unsecured and fixed rate debt in Japan and more variable rate, secured debt in Africa, India and Latin America than in Europe or the US. You can get the debt details, by industry, for regional breakdowns at the link at the end of this post.
Debt Load: Balance Sheet Debt
Using all interest bearing debt as debt in looking at companies, we can raise and answer fundamental questions about leverage at companies. Broadly speaking, the debt load at a company can be scaled to either the value of the company or to its earnings and cash flows. Both measures are useful, though they measure different aspects of debt load:
a. Debt and Value
Earlier, I noted that there are two ways you can fund a business, debt and equity, and a logical measure of financial leverage that follows is to look at how much debt a firm uses, relative to its equity. That said, there are two competing measures of value, and especially for equity, the divergence can be wide.
The first is the book value, which is the accountant's estimate of how much a business and its equity are worth. While value investors attach significant weight to this number, it reflects all of the weaknesses that accounting brings to the table, a failure to adjust for time value of money, an unwillingness to consider the value for current market conditions and an inability to deal with investments in intangible assets. The second is market value, which is the market's estimate, with all of the pluses and minuses that go with that value. It is updated constantly, with no artificial lines drawn between tangible and intangible assets, but it is also volatile, and reflects the pricing game that sometimes can lead prices away from intrinsic value.In the graph below, I look at debt as a percent of capital, first using book values for debt and equity, and next using market value.
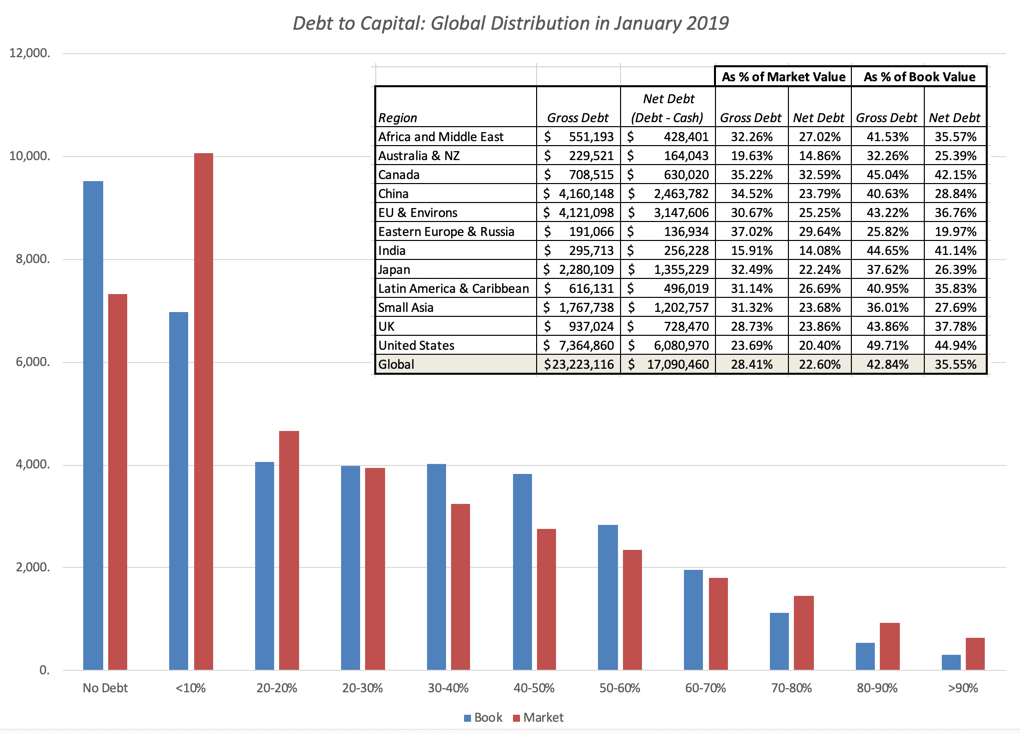 Debt ratios, by industry (US)In the table below, I break out debt as a percent of overall value (debt + equity) using both book value and market value numbers, and look at the distribution of these ratios globally:
Embedded in the chart is a regional breakdown of debt ratios, and even with these simple measures of debt loads, you can see how someone with a strong prior point of view on debt, pro or con, can find a number to back that view. Thus, if you want to argue as some have that the Fed (which is blamed for almost everything that happens under the sun), low interest rates and stock buybacks have led US companies to become over levered, you will undoubtedly point to book debt ratios to make your case. In contrast, if you have a more sanguine view of financial leverage in the US, you will point to market debt ratios and perhaps to the earnings and cash flow ratios that I will report in the next section. On this debate, at least, I think that those who use book value ratios to make their case hold a weak hand, since book values, at least in the US and for almost every sector other than financial, have lost relevance as measures of anything, other than accounting ineptitude.
b. Debt and Earnings/CashflowsDebt creates contractual obligations in the form of interest and principal payments, and these payments have to be covered by earnings and cash flows. Thus, it is sensible to measure how much buffer, or how little, a firm has by scaling debt payments to earnings and cash flows, and here are two measures:
Debt to EBITDA: It is true that EBITDA is an intermediate cash flow, not a final one, since you still have to pay taxes and invest in growth, before you get a residual cash flow. That said, it is a proxy for how much cash flow is being generated by existing investments, and dividing the total debt by EBITDA is a measure of overall debt load, with lower numbers translating into less onerous loads.Interest Coverage Ratio: Dividing the operating income (EBIT) by interest expenses, gives us a different measure of safety, one that is more immediately tied to default risk and cost of debt than debt to EBITDA. Firms that generate substantial operating income, relative to interest expenses, are safer, other things remaining equal, than firms that operate with lower interest coverage ratios. In the table below, I look at the distributions of both these numbers, again broken down by region of the world:
 Debt ratios, by industry (US)Again, the story you tell can be very different, based upon which number you look at. Chinese companies have the most debt in the world, if you define debt as gross debt, but look close to average, when you look at net debt. Indian companies look lightly levered, if you look at Debt to EBITDA multiples, but have the most exposure to debt, if you use interest coverage ratios to measure debt load.
Operating Leases: The Accounting NetherworldGoing back to the definition of debt as financing that comes with contractually set obligations, where failure to meet these obligations can lead to loss of control and default, it is clear that focusing on only the balance sheet (as we have so far) is dangerous, since there are other claims that companies create that meet these conditions. Consider lease agreements, where a retailer or a restaurant business enters into a multi-year agreement to make lease payments, in return for using a store front or building. The lease payments are clearly set out by contract, and failing to make these payments will lead to loss of that site, and the income from it. You can argue that leases providing more flexibility that a bank loan and that defaulting on a lease is less onerous, because the claims are against a specific location and not the business, but those are arguments about whether leases are more like unsecured debt than secured debt, and not whether leases should be treated as debt. For much of accounting history, though, accountants have followed a different path, treating only a small subset of leases as debt and bringing them on to the balance sheet as capital leases, while allowing the bulk of lease expenses as operating expenses and ignoring future lease commitments on balance sheets. The only consolation prize is that both IFRS and GAAP have required companies to show these lease commitments as footnotes to balance sheets.
In my experience, waiting for accountants to do the right thing will leave you twisting in the wind, since it seems to take decades for common sense to prevail. Consequently, I have been treating leases as debt for more than three decades in valuation, and the process for doing so is neither complicated nor novel. In fact, it is the same process that accountants use right now with capital leases and it involves the following steps:
Estimate a current cost of borrowing or pre-tax cost of debt for the company today, given its default risk and current interest rates (and default spreads).Starting with the lease commitment table that is included in the footnotes today, discount each lease commitment back to today, using the pre-tax cost of debt as your discount rate (since the lease commitments are pre-tax). Most companies provide only a lump-sum value for commitments after year 5, and while you can act as if this entire amount will come due in year 6, it makes more sense to convert it into an annuity, before discounting.The sum total of the present value of lease commitments will be the lease debt that will now show up on your balance sheet, but to keep the balance sheet balanced, you will have to create a counter asset. To the extent that the accounting has treated the current year's lease expense as an operating expense, you have to recompute the operating income, reflecting your treatment of leases as debt:Adjusted Operating Income = Stated Operating Income + Current year's lease expense - Depreciation on the leased asset
Capitalizing leases will have large consequences for not just debt ratios at companies (pushing them for companies with significant lease commitments) but also for operating profitability measures (like operating margin) and returns on invested capital (since both operating income and invested capital will be changed). The effects on net margin and return on equity should either be much smaller or non-existent, because equity income is after both operating and capital expenses, and moving leases from one grouping to another has muted consequences. In the table below, I report on debt ratio, operating margin and return on capital. before and after the lease adjustment :
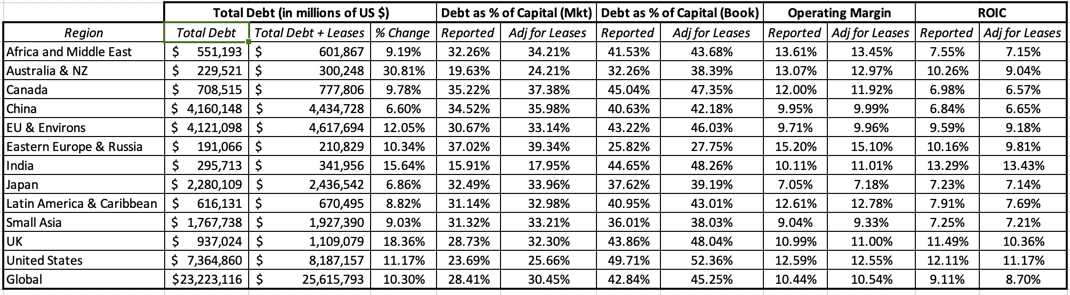 Lease Effect, by Industry, for USYou can download the effects, by industry, for different regions, by using the links at the bottom of this post. Keep in mind, though, that there are parts of the world where lease commitments, though they exist, are not disclosed in financial statements, and as a consequence, I will understate the else effect, While the effect is modest across all companies, the lease effect is larger in sectors that use leases liberally in operations, and to see which sectors are most and least affected, I looked at the ten sectors, among US companies, and not counting financial service firms, that saw the biggest percentage increases in debt ratios and the ten sectors that saw the smallest in the table below:
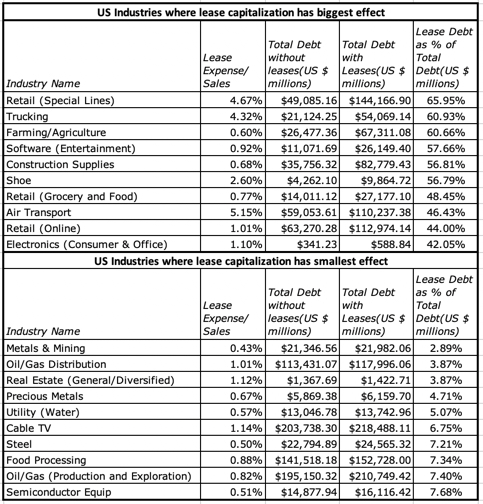 Lease Effect, by Industry, for USNote that there are a large number of retail groupings that rank among the most affected sectors, though a few technology companies also make the cut. As I noted at the start of this post, this year will be a consequential one, since both GAAP and IFRS will start requiring companies to capitalize leases and showing them as debt. While I applaud the dawning of sanity, there are many investors (and equity research analysts) who are convinced that this step will be catastrophic for companies in lease-heavy sectors, since it will be uncover how levered they are. I am less concerned, because markets, unlike accountants, have not been in denial for decades and market prices, for the most part and for most companies, already reflect the reality that leases are debt.
 Debt: Final ThoughtsOne of the biggest impediments to any rational discussion of debt's place in capital is the emotional baggage that we bring to that discussion. Debt is neither poison, as some detractors claim it to be, nor is a nectar, as its biggest promoters describe it. It is a source of capital that comes with fixed commitments and the risk of default, good for some companies and bad for others, and when it does create value, it is because the tax code it tilted towards it. It is true that some companies and investors, especially those playing the leverage game, over estimate its benefits and under estimate its side costs, but they will learn their lessons the hard way. It is also true that other companies and investors, in the name of prudence, think that less debt is always better than more debt, and no debt is optimal, and they too are leaving money on the table, by being too conservative.
YouTube Video
Datasets
Debt Change, by Industry Group for US companies, in 2019Debt Details, by Industry Group in 2019 for US, Europe, Emerging Markets, Japan, Australia & Canada, India and ChinaDebt Ratios, by Industry Group in 2019 for US, Europe, Emerging Markets, Japan, Australia & Canada, India and ChinaLease Capitalization Effects, by Industry Group in 2019 for US, Europe, Emerging Markets, Japan, Australia & Canada, India and ChinaPapers
Leases, Debt and Value (SSRN paper on how to capitalize leases and how it might affect value)January 2019 Data UpdatesData Update 1: A Reminder that equities are risky, in case you forgot!Data Update 2: The Message from Bond MarketsData Update 3: Playing the Numbers GameData Update 4: The Many Faces of RiskData Update 5: Of Hurdle Rates and Funding Costs!Data Update 6: Profitability and Value Creation!Data Update 7: Debt, neither poison nor nectar!
Aswath Damodaran's Blog

- Aswath Damodaran's profile
- 725 followers
Aswath Damodaran isn't a Goodreads Author
(yet),
but they
do have a blog,
so here are some recent posts imported from
their feed.

