
Aswath Damodaran's Blog, page 12
November 5, 2020
A Viral Market Update XIV: A Wrap on the COVID market, premature or not!
Over the last eight months, I have written a series of posts on the market and how it has adapted and adjusted to COVID. The very first of these posts, on February 26, 2020, was about two weeks into the meltdown and it is indicative of how little we knew about the virus then, and what effects it would have on the economy and the market. More than seven months later, there is still much that we still do not know about COVID, as it continues to wreak havoc on global economies and businesses. In this post, I intend to wrap up this series with a final post, reviewing how value has been reallocated across companies during the months, and providing an updated valuation of the S&P 500. Given that much of Europe is going into lockdown, and that there is no vaccine in sight, this may seem premature, but I have a feeling that there will be other uncertainties that will vie for market attention over the coming weeks, especially as the US election results play out in legal and legislative arenas.
A Market Overview
For those of you who have read my prior posts on COVID's market effects, I will follow a familiar script. I will start by noting that this crisis has played out in markets in three acts, captured in the graph below where I look at the S&P 500 and the NASDAQ, since the start of this year:
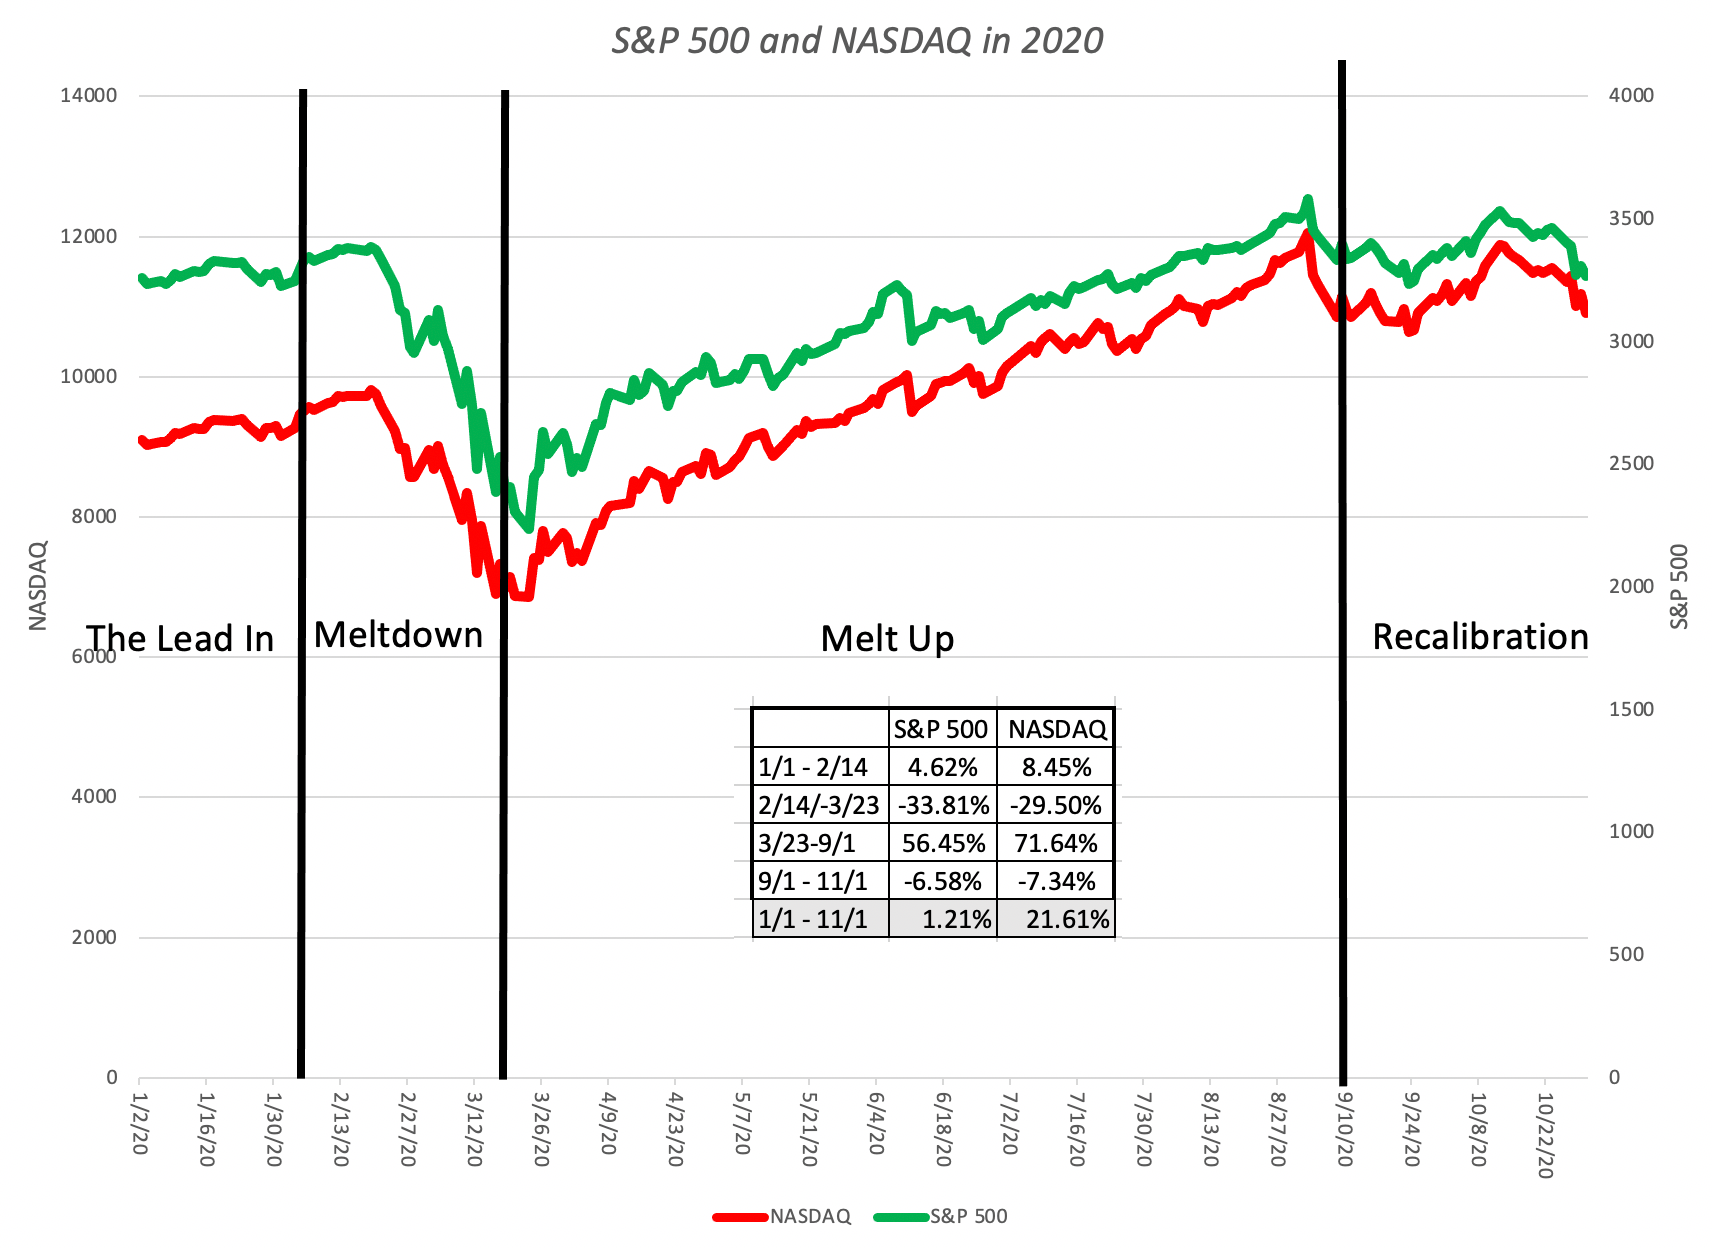
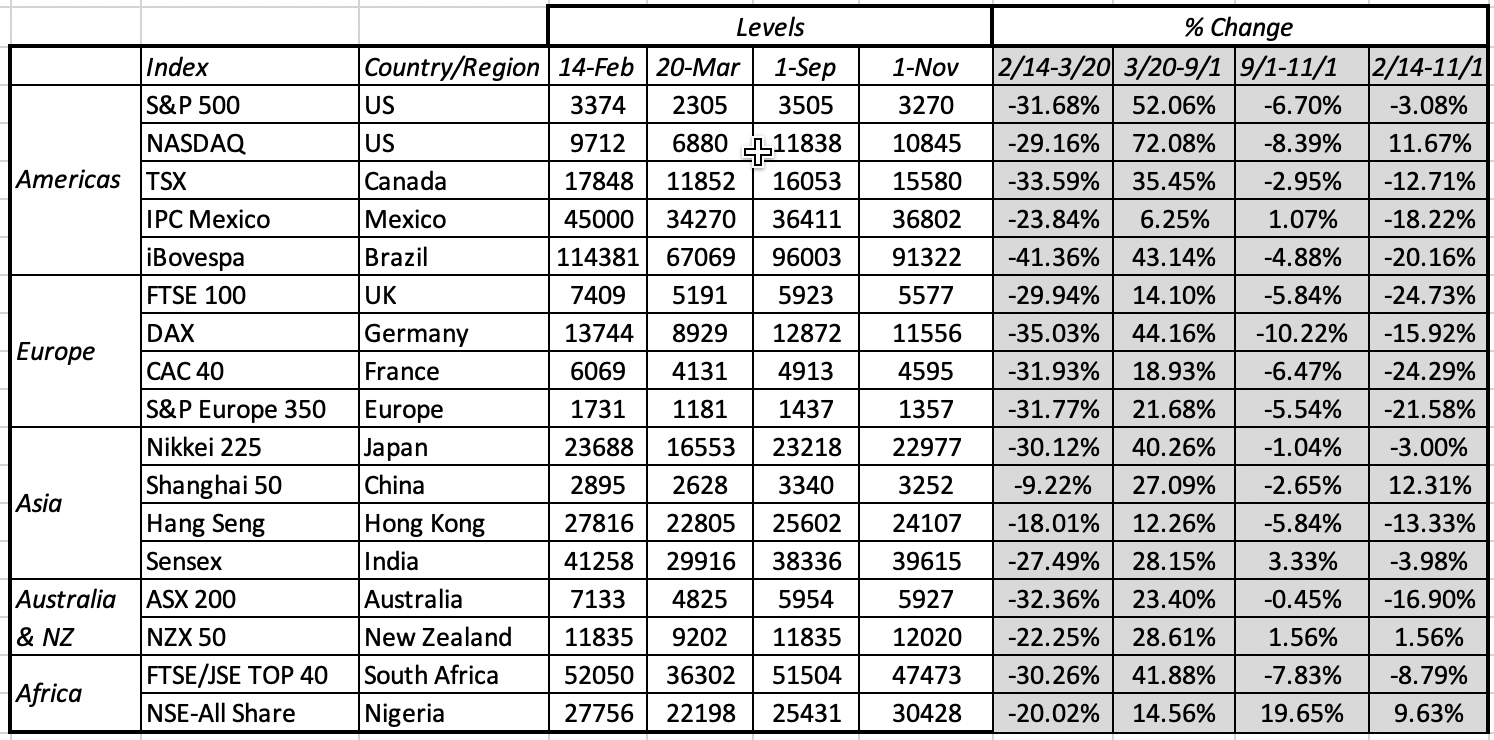
The year began auspiciously for US equities, as stocks built on positive performance in 2019 (when it was up more than 30%) and continued to rise. In fact, on February 14, US equities were are at all time highs, when news of the virus encroaching into Europe and then rapidly expanding across the world caused stocks to go into a tailspin that lasted just over five weeks. On March 23, 2020, amidst talk of doomsday for stocks, momentum shifted, with some credit to the Fed, and stocks went on a run that extended through the end of August, recovering almost all of the ground lost during the meltdown. In September and October, stocks were choppy with more bad days than good, as investors recalibrated. While the graph is US-centric, this was a global crisis, and equities around the global moved through the same three phases, as you can see in the table below, where I look at selected equity indices from around the world:
 Download data
Note that the pattern is very similar, across indices, with steep drops in the first phase (2/14-3/20), followed by steep increases in the following months (3/20-9/1) before settling down in the last two months (9/1-11/1). As equities went on a turbulent ride, other asset classes were also affected, with US treasuries benefiting from a flight to safety in the first five weeks:
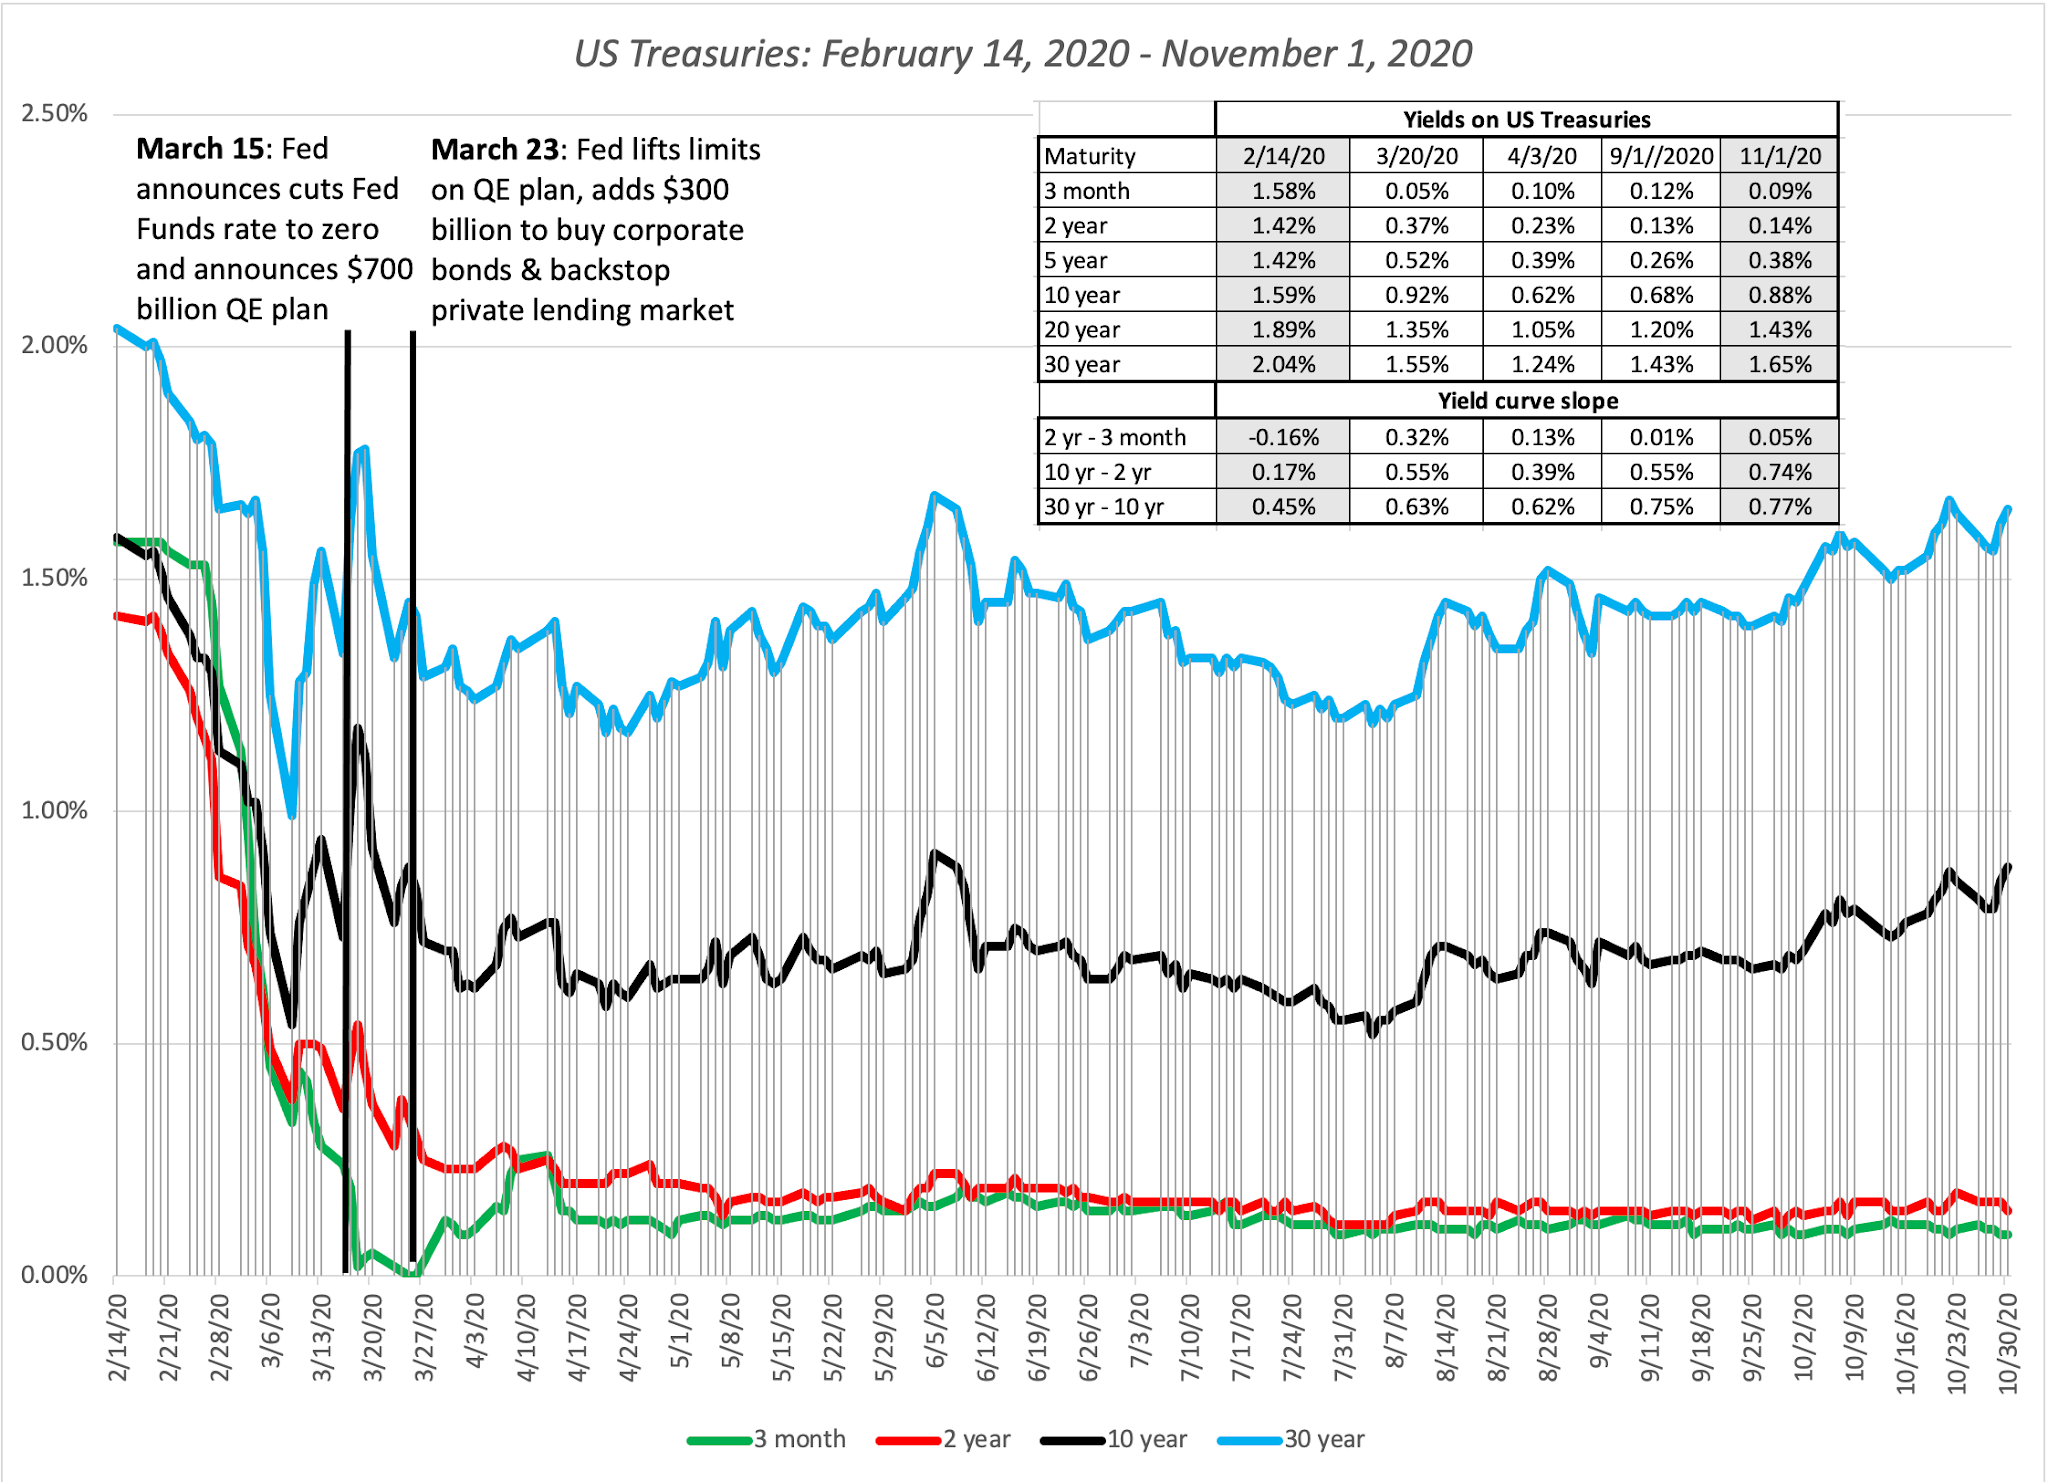 Download dataUS treasury yields dropped across all maturity classes between February 14 and March 20, with short term rates dropping close to zero and 10-year T.Bond rates dropping fro 1.7% to 0.7%. I know it is fashionable now to attribute all things related to interest rates to the Fed's actions, but the bulk of the decline in treasury rates occurred before the Fed finally acted in mid-March, and it is surprising how little movement there has been in treasury rates in the months since. Though treasury yields have stayed at their mid-March levels, the rise and fall of the fear factor in the equity markets also played out in the corporate bonds, in the form of movements in corporate default spreads:
 Download data
When stocks were melting down between February 14 and March 20, corporate bond spreads were also widening dramatically, but those spreads have fallen back almost to pre-crisis levels for the higher ratings, and mostly recovered even for the lower ratings.
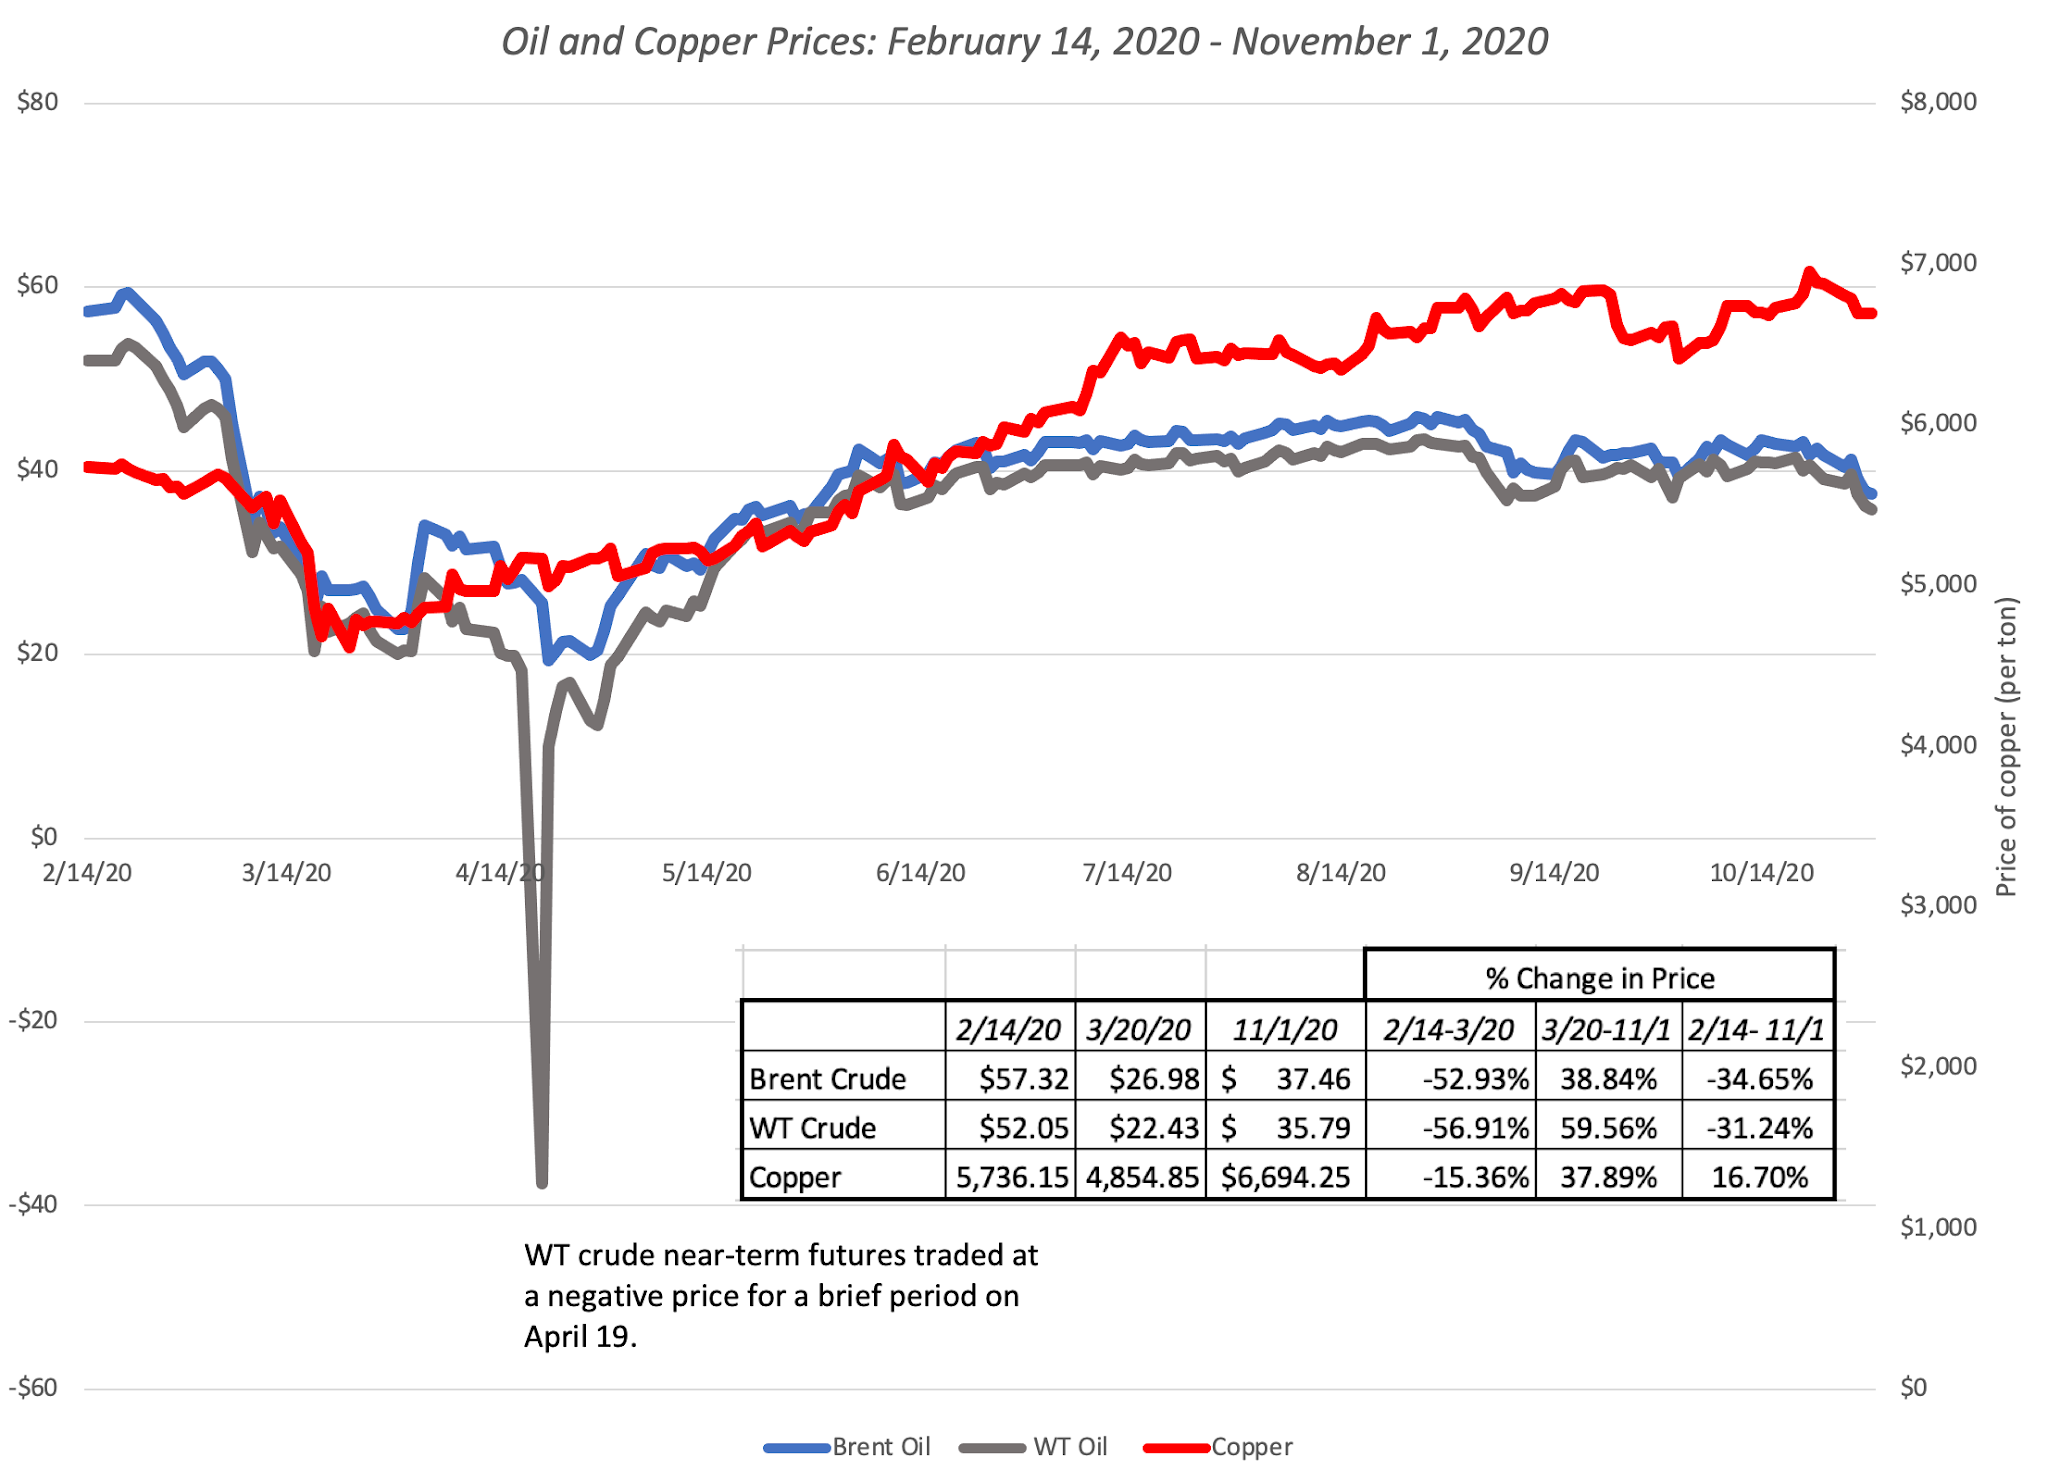
Looking at oil and copper, two economically sensitive commodities, you see reflections of the turbulence that affected equities and corporate bond markets:
 Download data
Both oil and copper prices dropped significantly between February 14 and March 20, with oil showing a much larger decline (down more than 50%) than copper (about 15%), but both commodities have recovered, with copper now up almost 17% from pre-crisis levels. Oil, in spite of its comeback in the last few months, is still down more than 30% from pre-crisis levels. Finally, I look at gold and bitcoin, an odd pair, but both touted by their advocates as crisis assets:
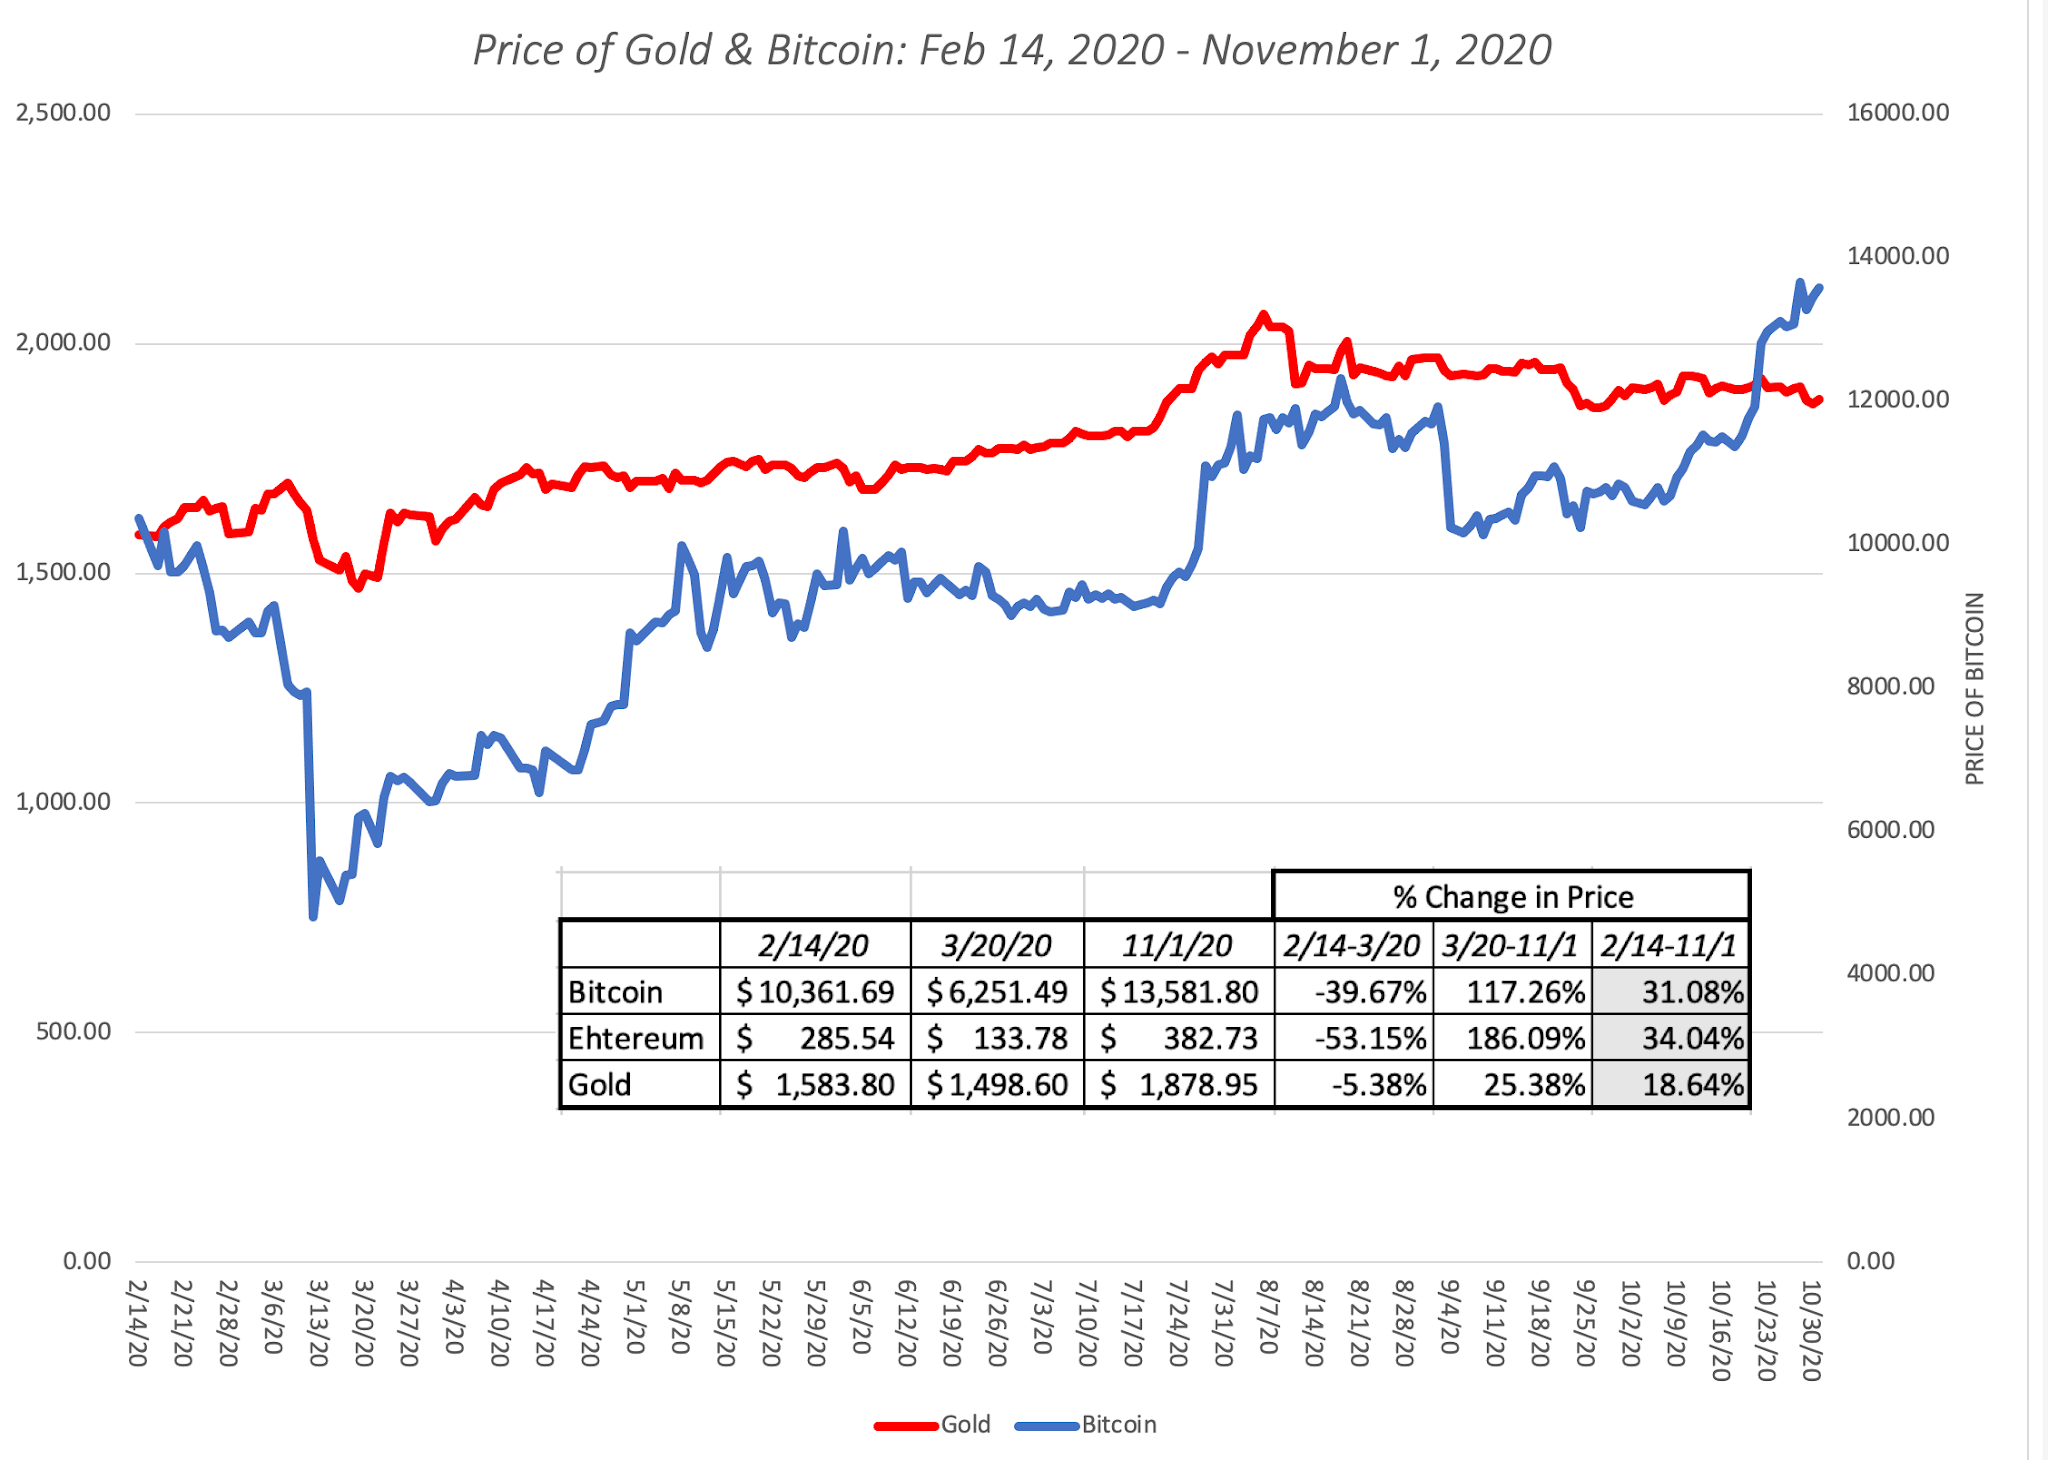 Download dataWhile bitcoin is now up more than gold over the period, gold has performed better as a crisis asset, holding its own when equities were melting down between February 14 and March 20. In contrast, the crypto currencies (Bitcoin and Ethereum) have behaved like very risky equities, going down more than equities, when stocks were going down, and rising more, when they rose.
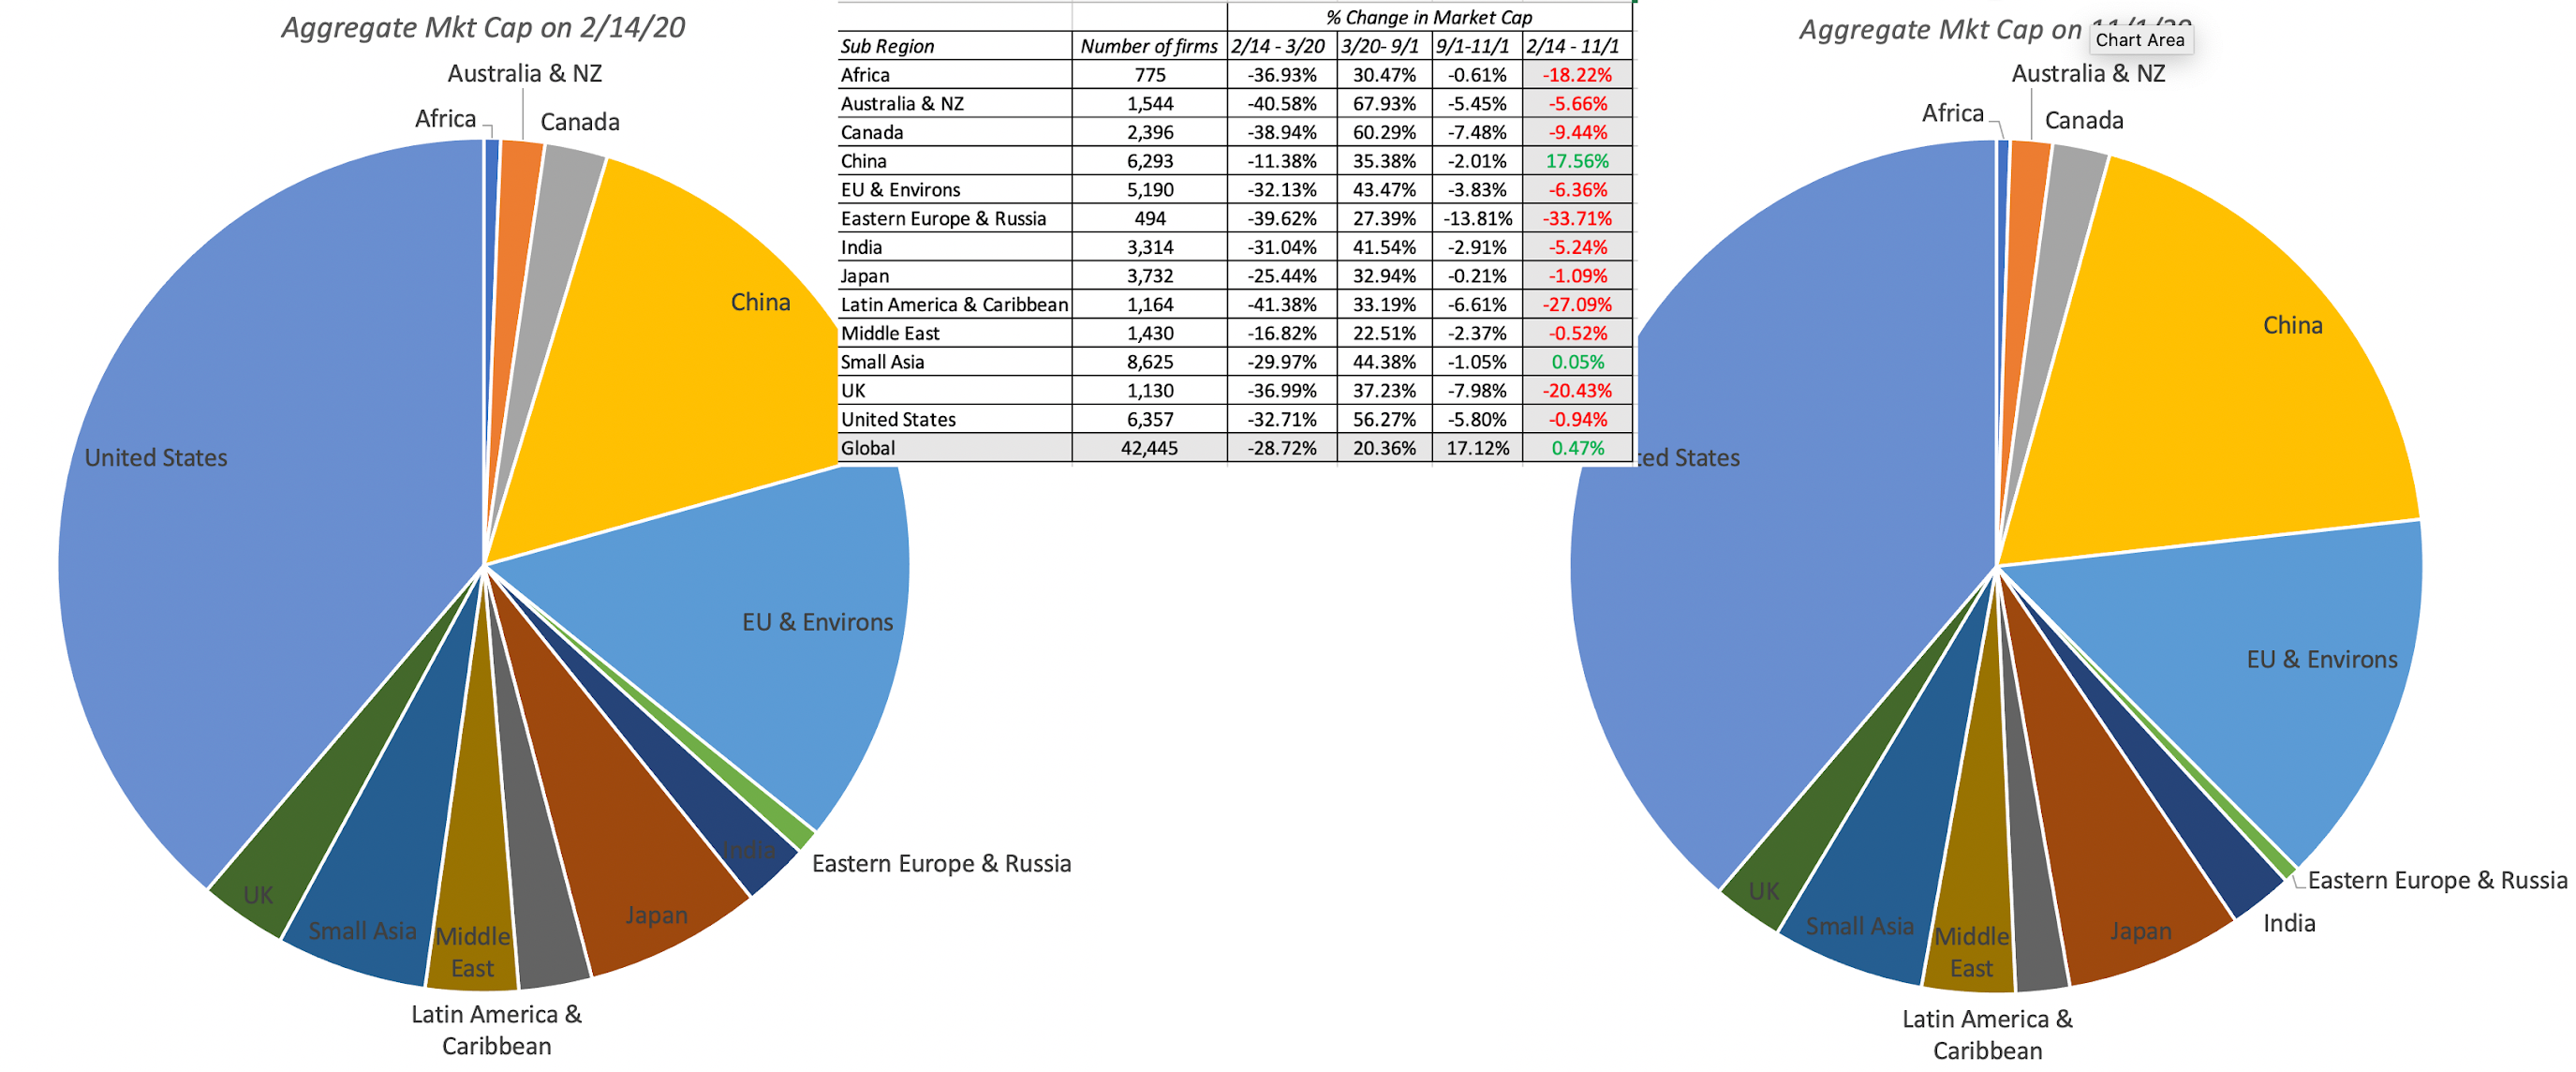
Equity Markets: A Wealth TransferThe quick recovery in equity markets has led some to believe that the market has ignored the crisis, but that is not true. While equity values have recovered globally, there has been a significant shift in value across regions, sectors and company types. While I have talked about this value reallocation in previous posts, I will update the numbers and provide a summary of what the data is showing as of November 1. First, this crisis has played out very differently in different parts of the world, as you can see below, where I break down the market capitalizations of all publicly traded companies, by region, on February 14, 2020 and on November 1, 2020, with a table showing the percentage changes over the period:
 Download data
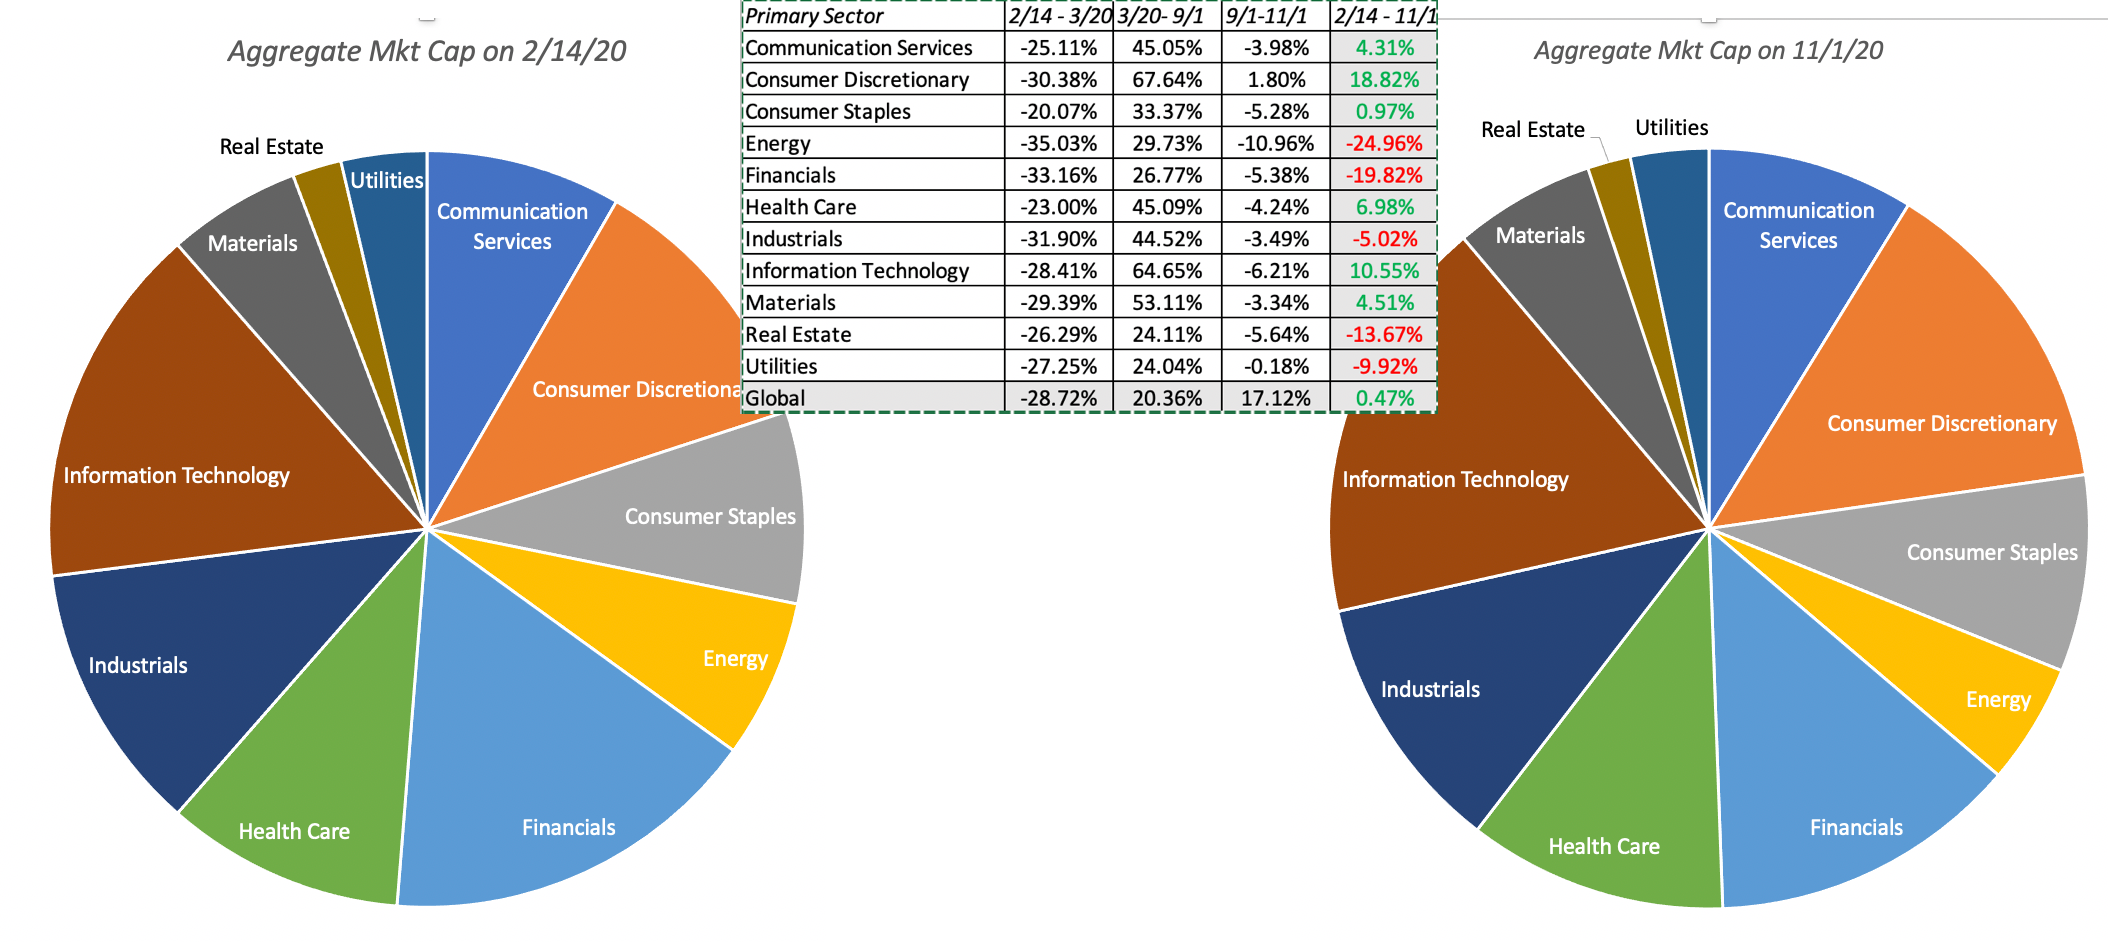
The markets that are showing the most residual damage are Africa, Eastern Europe & Russia and Latin America. While the easy explanation is that they are all emerging markets, note that Asia has emerged not just unscathed, but as one of the best performing regions of the world. Among the developed markets, the UK is the worst performer, perhaps dragged down by the continued uncertainty of how Brexit will play out. A better explanation would be that these are regions heavily dependent on natural resource and infrastructure businesses, and as we will see in the next section, those have been adversely affected by this crisis. In addition, since these returns are in US dollars, currency movements add to the effect, with depreciating (appreciating) currencies, against the dollar, worsening (improving) returns. Building on the theme that damage has varied across sections, I break down aggregate market cap by sectors, on February 14 and November 20, in the graph below (also with percent changes over the period:
 Download data
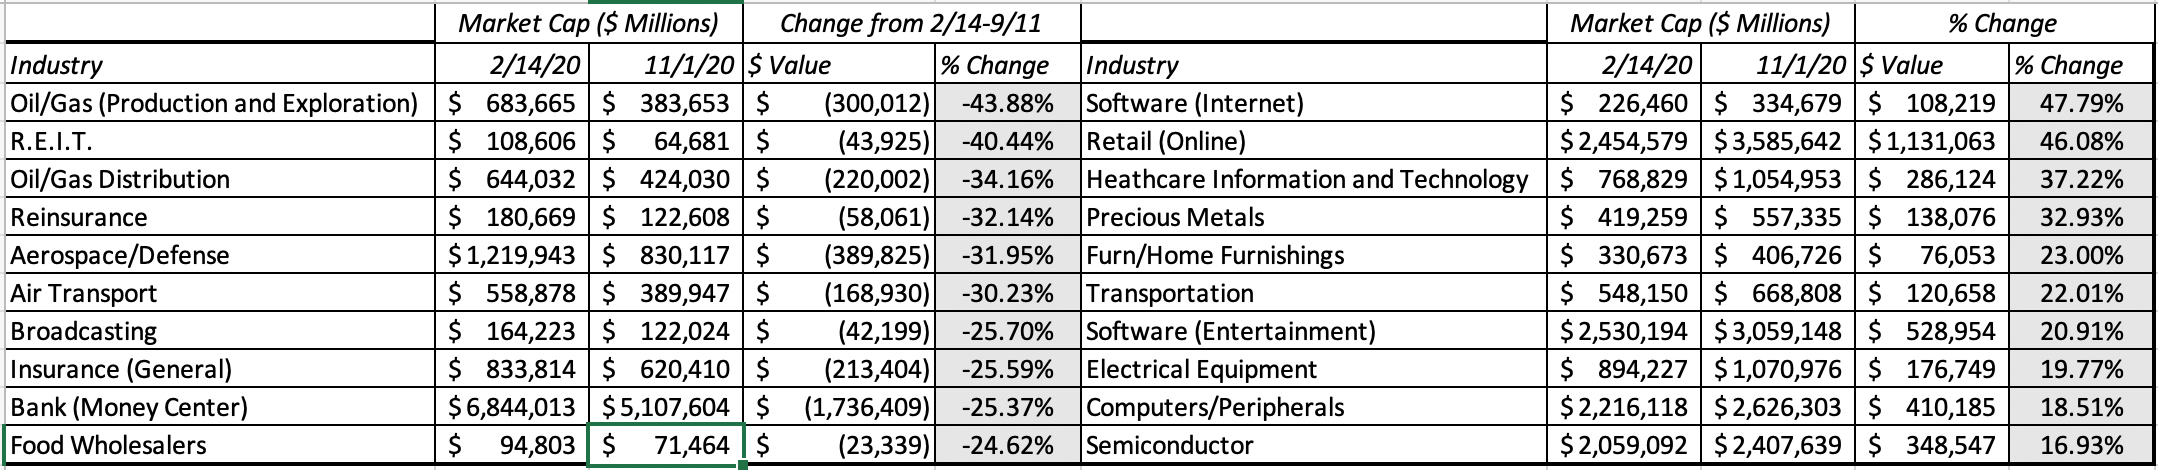
Again, the shift in value is clear and decisive, with consumer discretionary, technology and health care gaining at the expense of energy, real estate, utilities and financials. Put simply, capital light businesses have gained at the expense of capital intensive ones, and breaking down sectors into finer industry detail, emphasizes this shift, with the ten best and worst performing industries below:
 Download data
In an earlier post, I connected this value shift across industries to corporate life cycles, noting that younger, higher growth companies have gained value at the expense of older, more mature businesses, as can be seen in the tables below, where I break down the value change across companies, first by age, and then by expected revenue growth rate, into deciles:
 Download corporate age data & revenue growth data
The youngest companies have gained value over this crisis, whereas the oldest companies have lost value, and high growth companies have benefited at the expense of low growth firms. As this shift has occurred, it is not surprising that the stocks most favored by value investors (low PE/PBV, high dividends) have underperformed the stocks that are most favored by growth investors. I capture this in the table below, where I first look at value changes across companies, first classified across PE ratios and then across dividend yields:
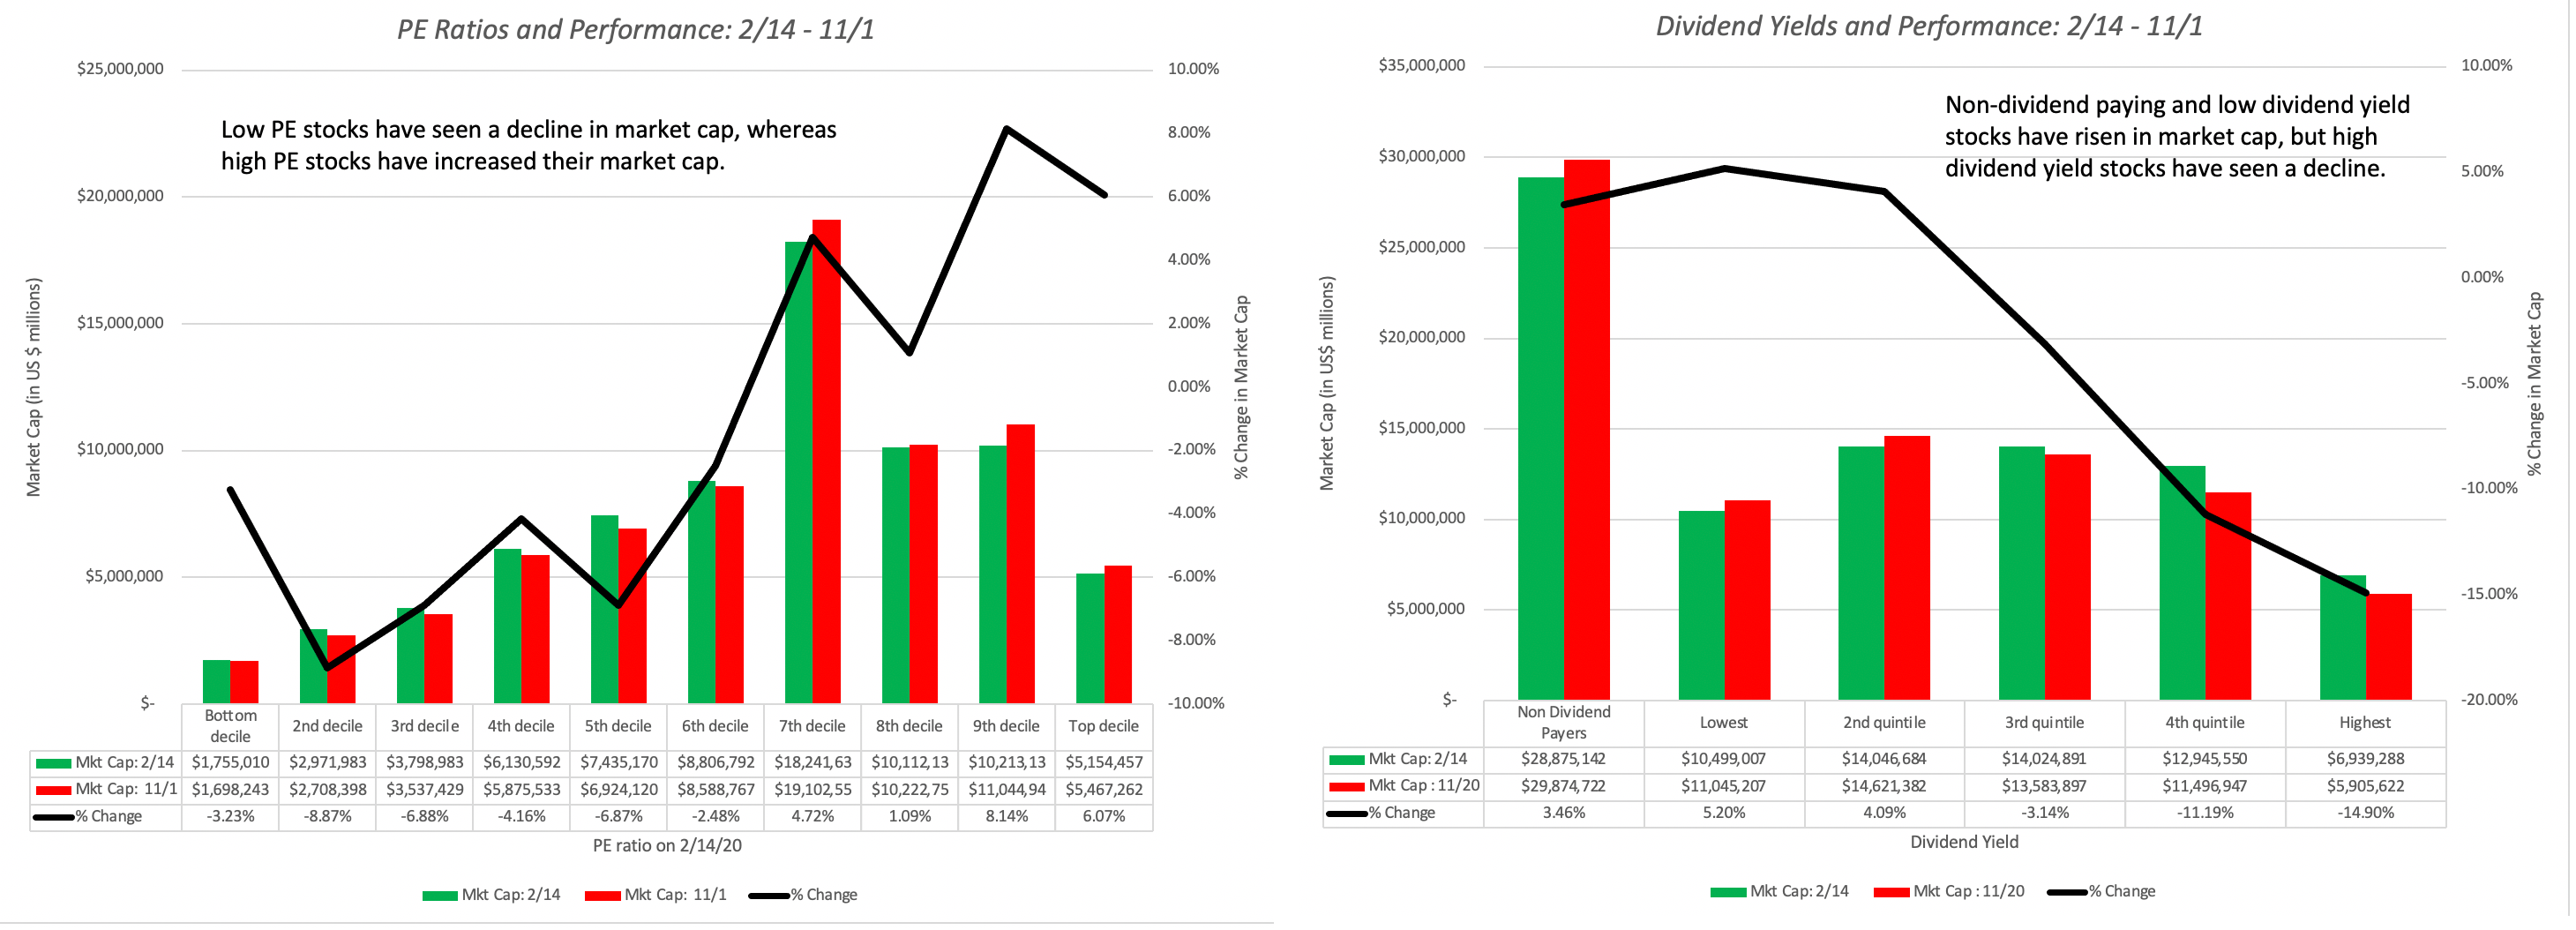 Download PE decile data & Dividend decile dataValue investors have also warned us over the last decade about two trends in corporate behavior, an increase in debt loads at some companies and a surge in stock buybacks. To evaluate whether those warnings were justified, I looked at companies classified by debt load (net debt to EBITDA) into deciles and computed value changes between February 14 and November 1.
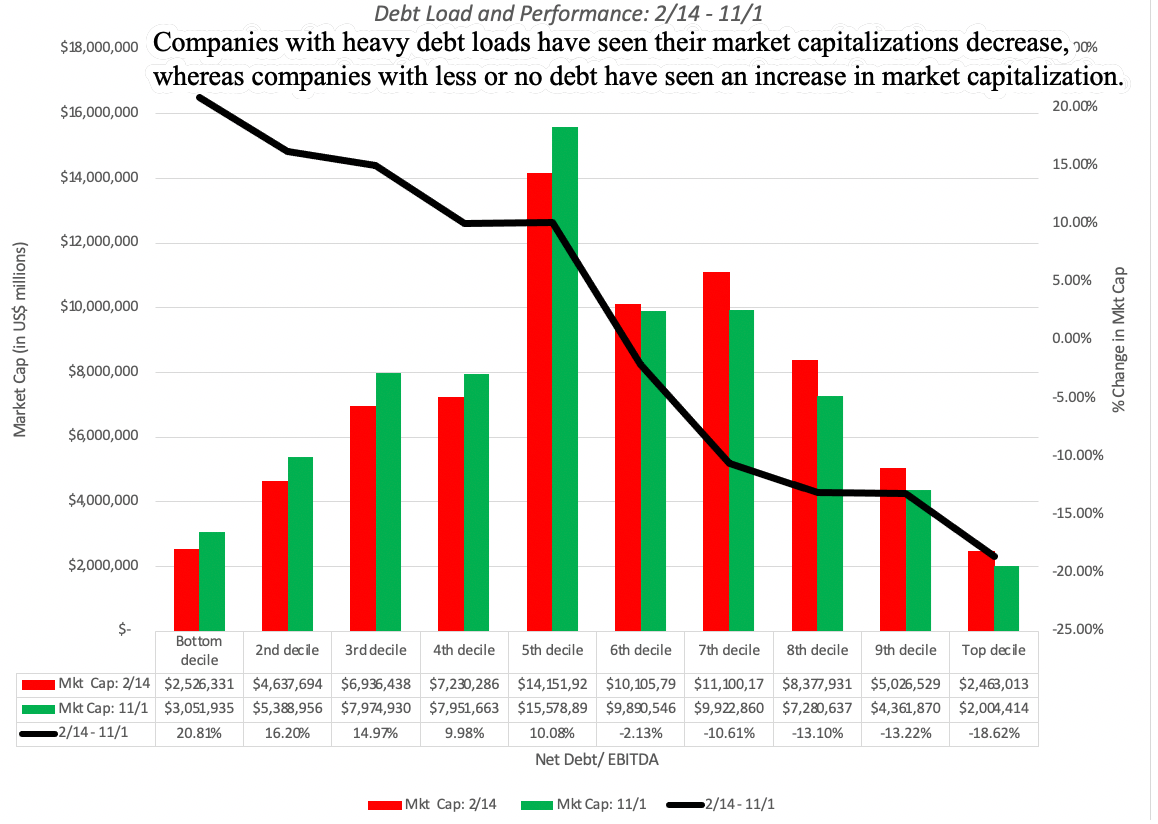 Download data
On this front, I think that the message is clear that the more indebted a company, the more exposed it was to damage during this crisis. On the buyback front, the results are a little murkier. In the graph below, I look at value changes for four groups of companies, (1) those that returned no cash at all in 2019 (no dividends or buybacks), (2) those that paid only dividends, (3) those that returned cash in the form of buybacks and (4) those that did both:
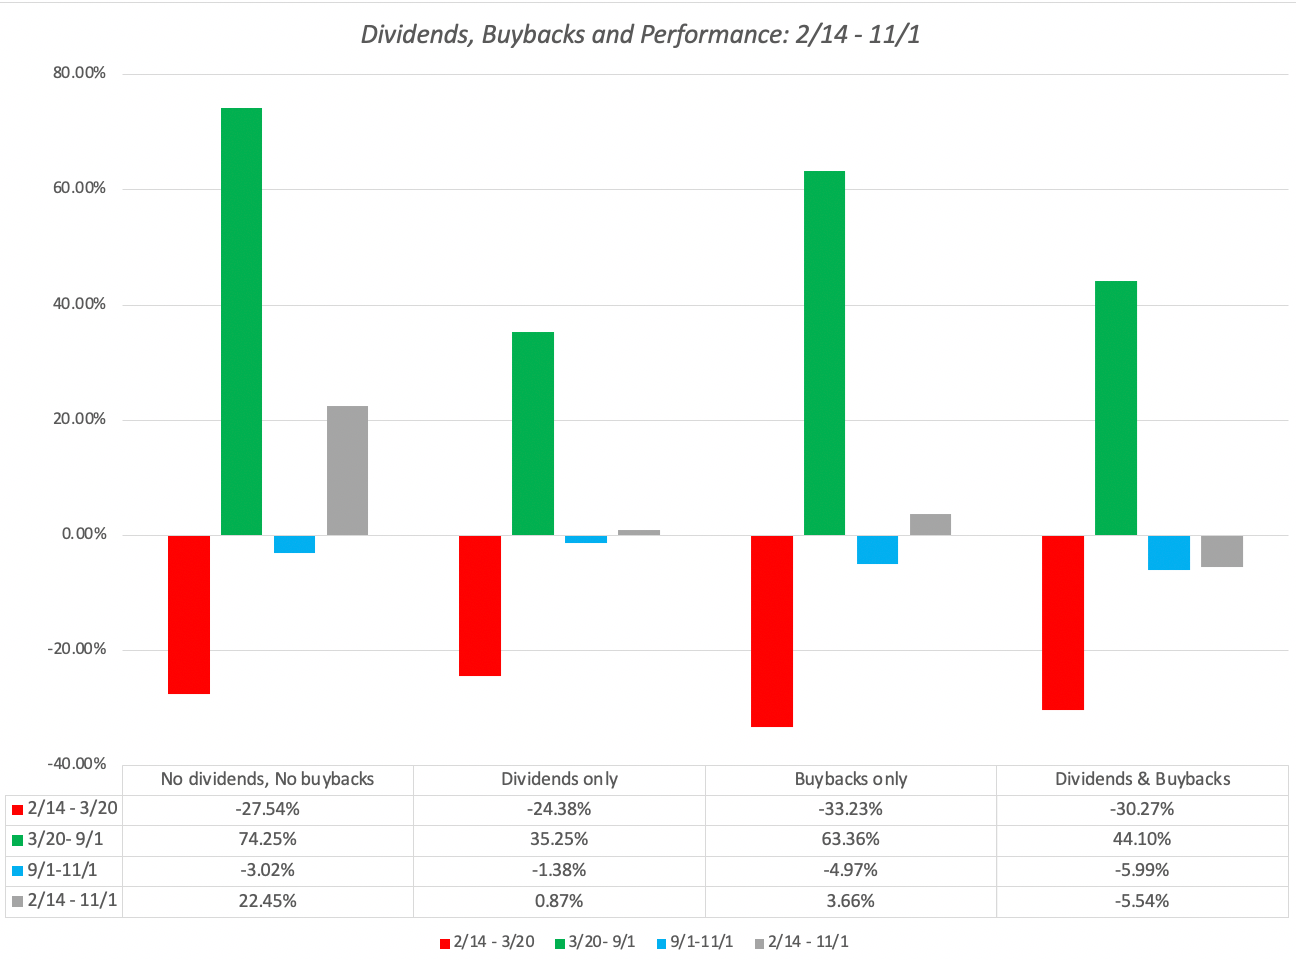
There is a muddled message in this graph. While companies that returned no cash to their shareholders in 2019 fared better overall than companies that returned cash (either in dividends or in buybacks) in 2019, companies that returned cash only in the form of buybacks recovered faster and more completely the companies that paid only dividends. Companies that both paid dividends and bought back stock did worst of all. If flexibility is key to surviving a crisis, it is possible that this crisis will make companies more reluctant to return cash, in general, and when they do, it is also more likely that you will see that cash returned in the form of buybacks than dividends, since the former are easily retracted but the latter are sticky.
Finally, no post on US equities is complete without a mention of the FANGAM stocks, a topic that I focused on in my last post. Updating the numbers through November 1, here is how these six companies have performed over the crisis, relative to the rest of the market:
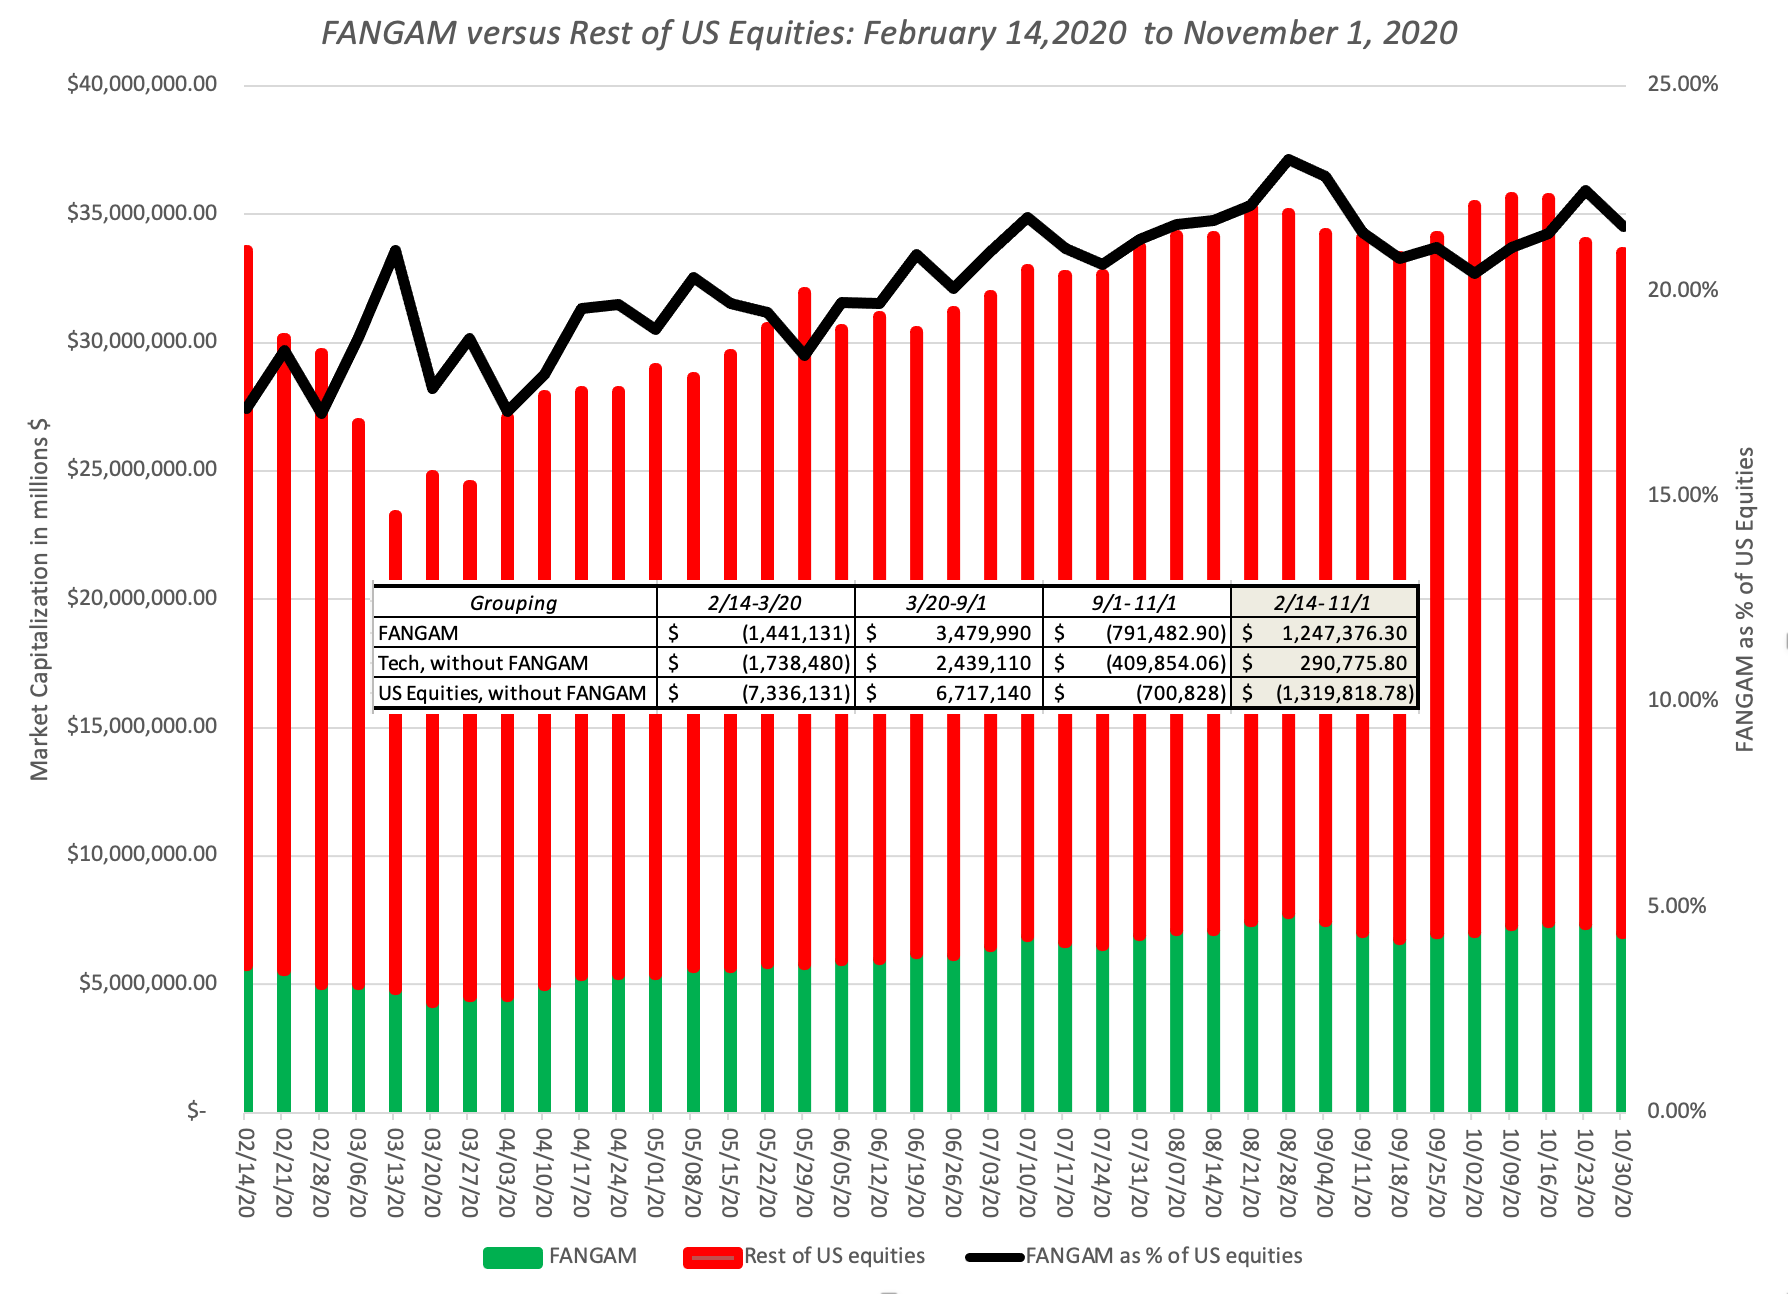 Download data
As you can see, the FANGAM stocks have added $1.25 trillion in aggregate market cap since February 14, while all other US equities have shed $1.32 trillion over that period. If the market has almost fully recovered from its early swoon, the credit has to go almost entirely to these six companies.
The Resilient Risk Capital ThesisThe best way to summarize how this crisis has affected companies is to summarize the value transfer from what would be consider "risk on" categories (young, high growth, high PE, low or no dividends and high debt) to "risk off" categories (old, low growth, low PE, high dividends and low debt), looking at the top and bottom deciles of each grouping:
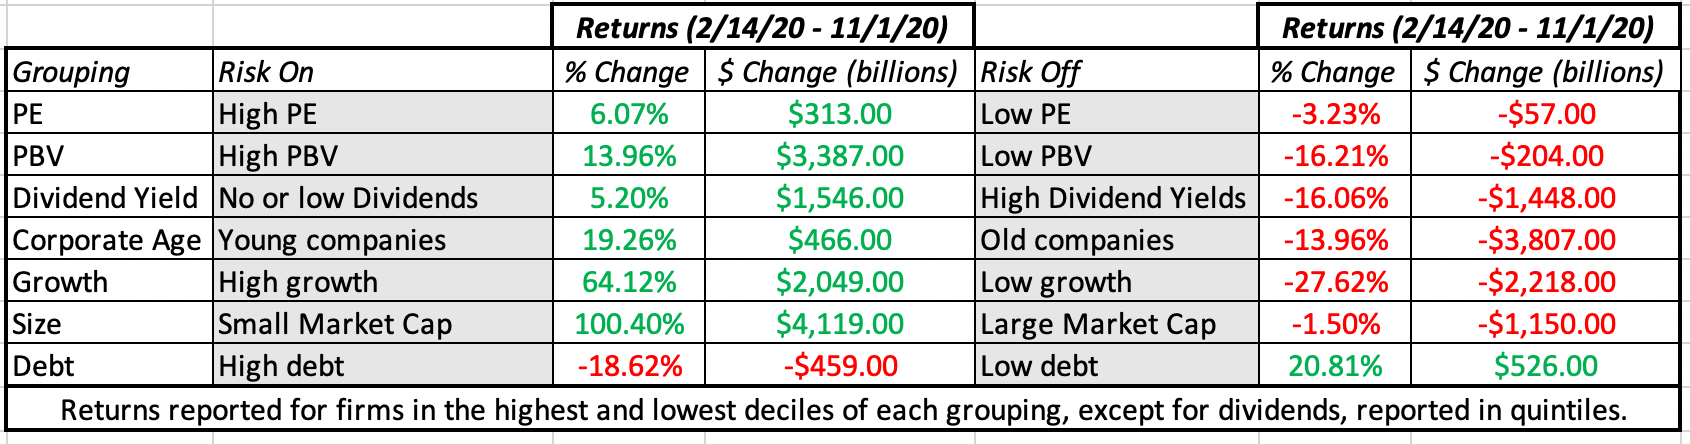
Note that in almost every category, other than debt, the "risk on" group gained value at the expense of the "risk off" group. One explanation that I offered in my post from a few weeks ago was that, unlike prior crises, risk capital (defined as capital invested in the highest risk assets, such as venture capital and investments in below investment grade bonds) has stayed in the game, as can be seen in the behavior of VC fund flows and issuances of high yield bonds (updated to include the third quarter of 2020):
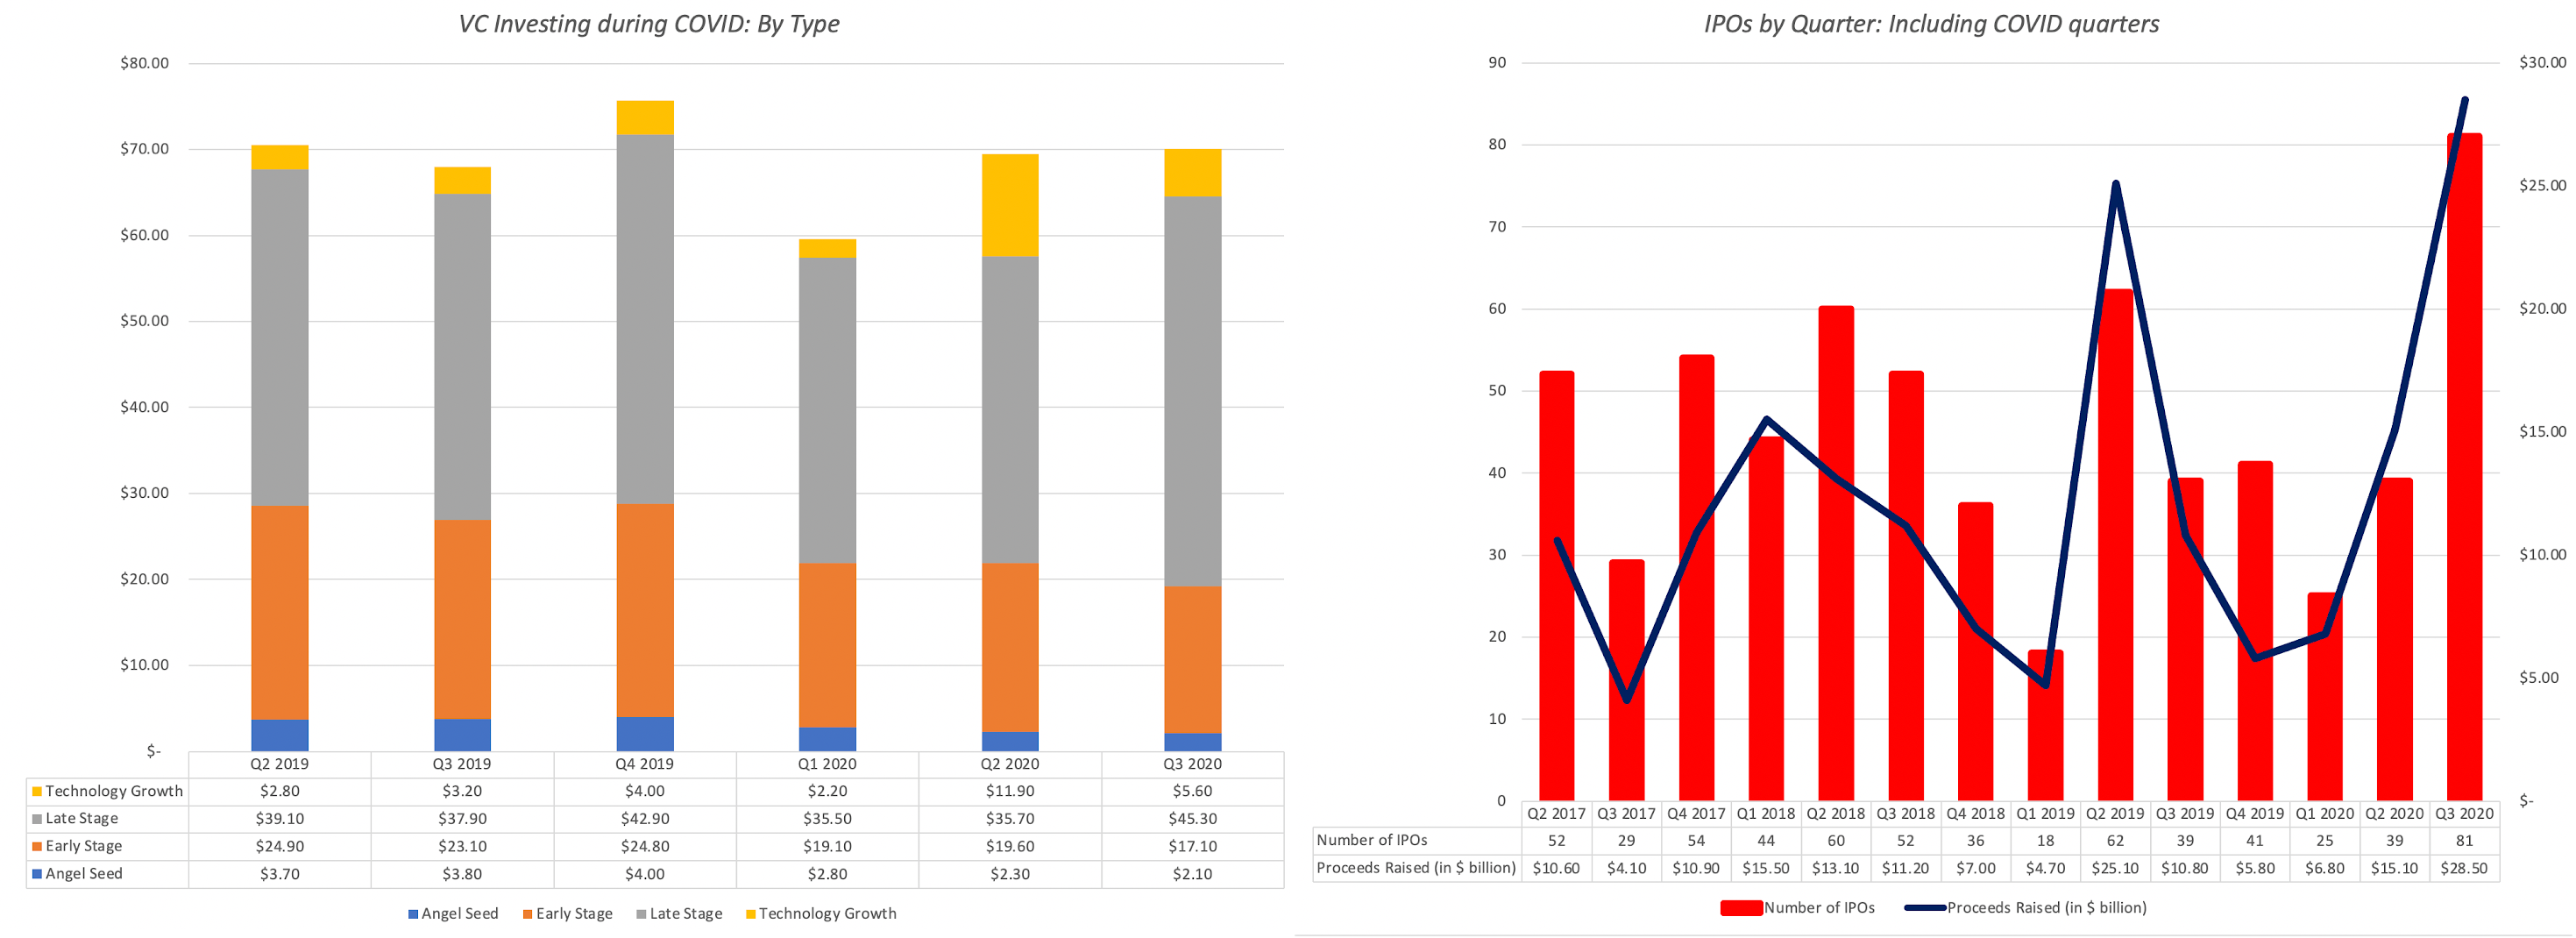
In fact, it is this resilience of risk capital that explains why the equity risk premium for the S&P 500, which soared in the first five weeks of this crisis, has reverted back to pre-crisis levels:
 Download data
Put simply, markets, for better or worse, seem to be sending the message that the fear factor of the crisis has passed, though earnings and cash flows will need to be tweaked.
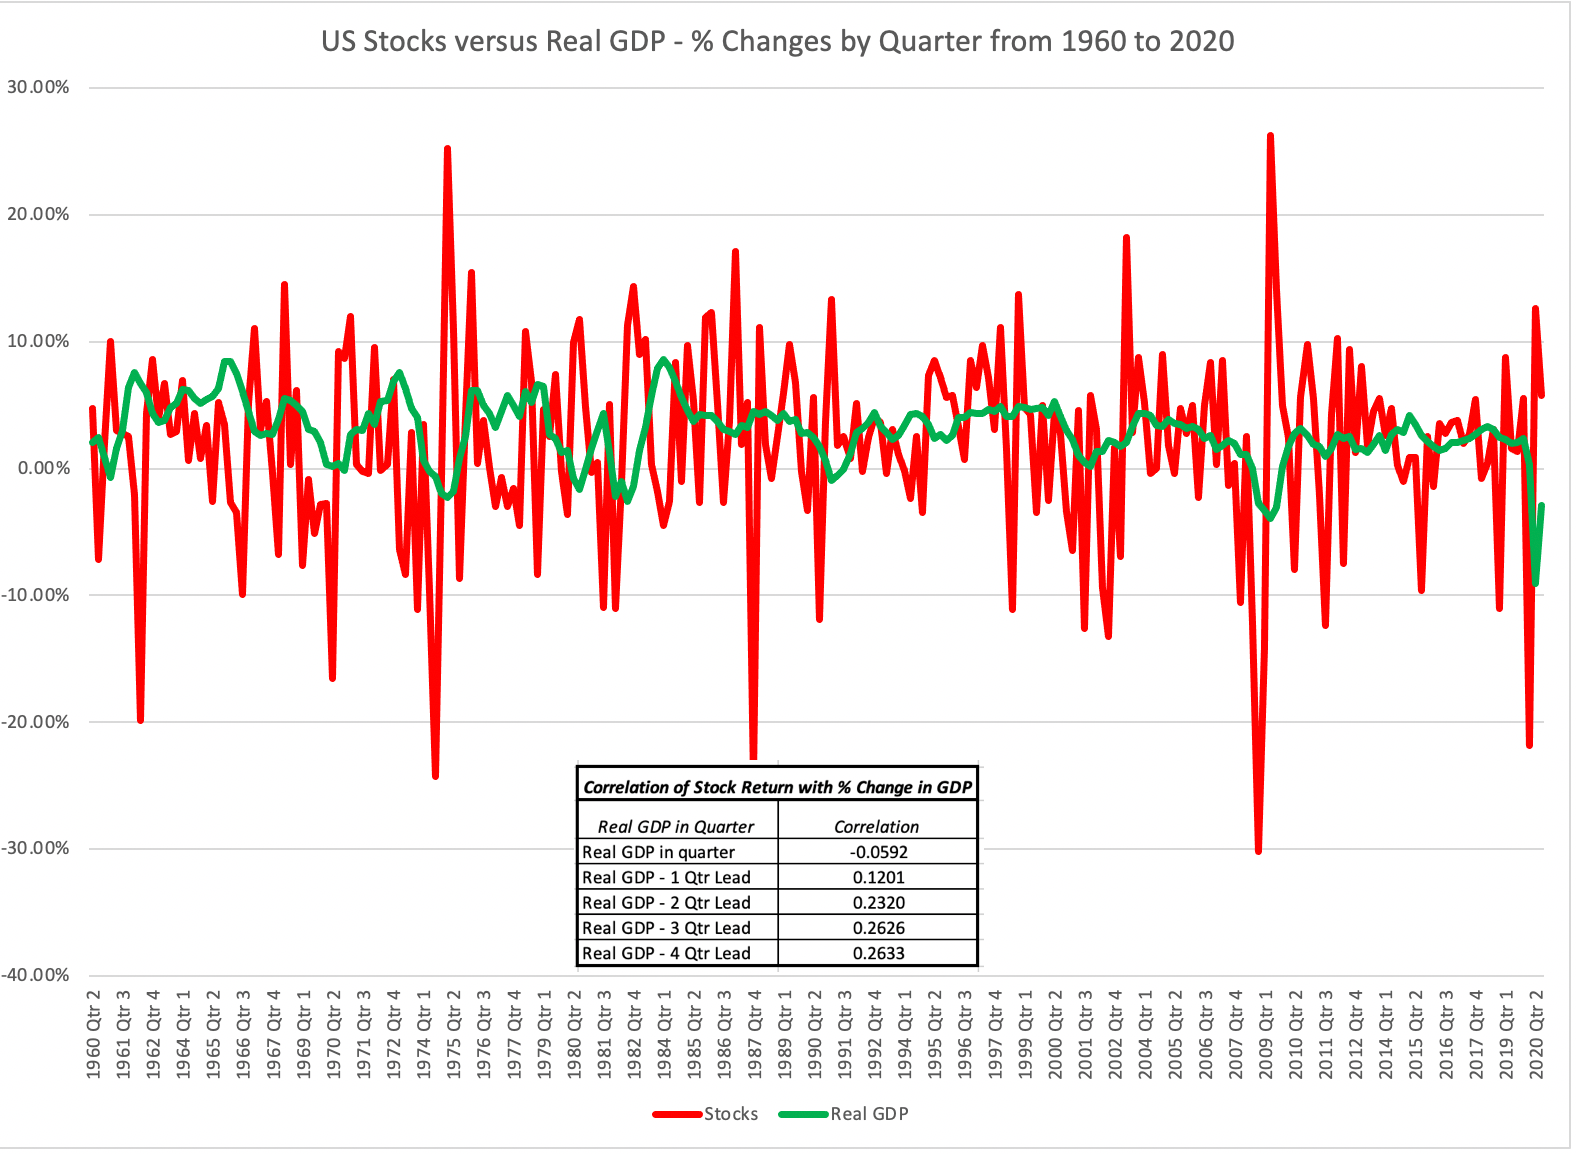
Market Assessment: Predictive Mechanism or Animal SpiritsAs markets have risen over the last few months, there has been a fair amount of hand wringing about animal spirits and irrational exuberance driving markets higher. Some of this concern has come from the clear disconnect between stocks going up and economic malaise, but I noted that this is neither unusual nor unexpected, using this graph of stock returns and real GDP growth, by quarter:
 Download data
Looking at the quarterly data over the last 60 years, there has been little to no relationship between stock returns in a quarter and the GDP change in that quarter, and if there is one, it is mildly negative, i.e., stocks are slightly more likely to go up (down) in a quarter when GDP is down (up). While that may surprise some people, it is entirely understandable, when you recognize that stock markets are predictive mechanisms, and that is borne out by the data, with stock returns becoming positively correlated with GDP growth in future quarters. Note that while the correlation increases as you look three or four quarters ahead, it flattens out at about 0.26 indicating that markets are noisy predictors; they are wrong as often as they are right, but given a choice between trusting markets and going with market gurus, I will take the former every single time.
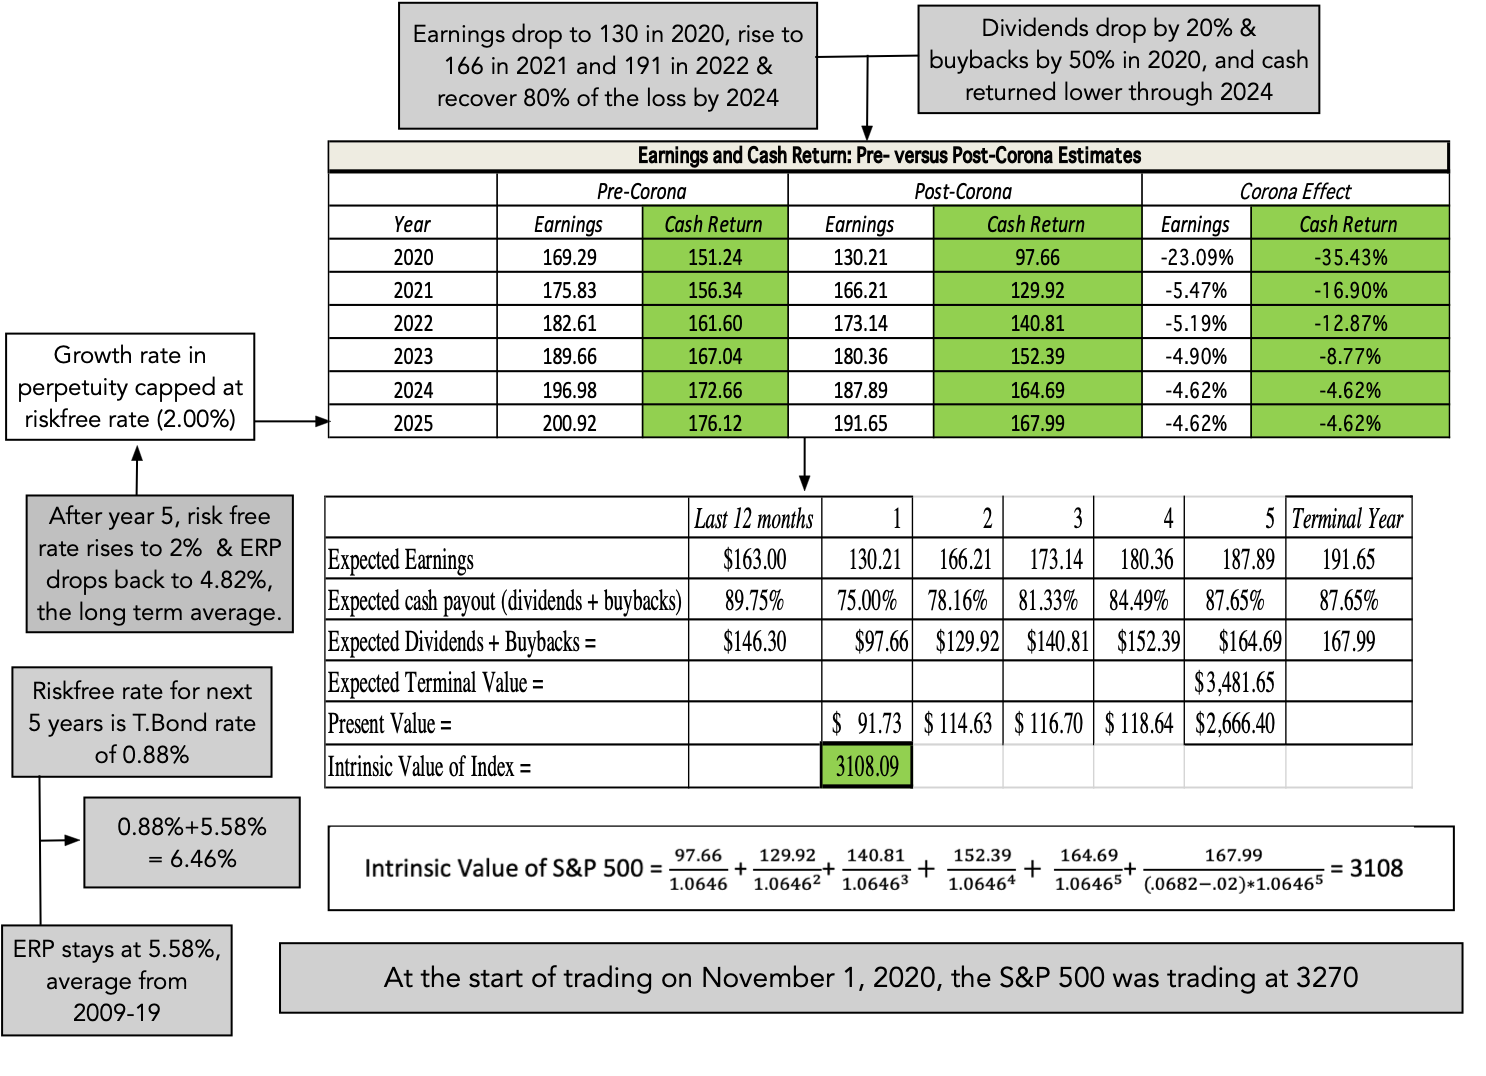
There is a debate to be had about whether markets have over adjusted to the possibility of a vaccine and the economy reopening, and to address that question, I decided to value the S&P 500 again; I did value it on June 1, 2020 and found it to be close to fairly valued. I revisited my assumptions, updating my estimates of earnings for the index in the near years (2020, 2021 and 2022), where the bulk of the damage from this crisis will be done.
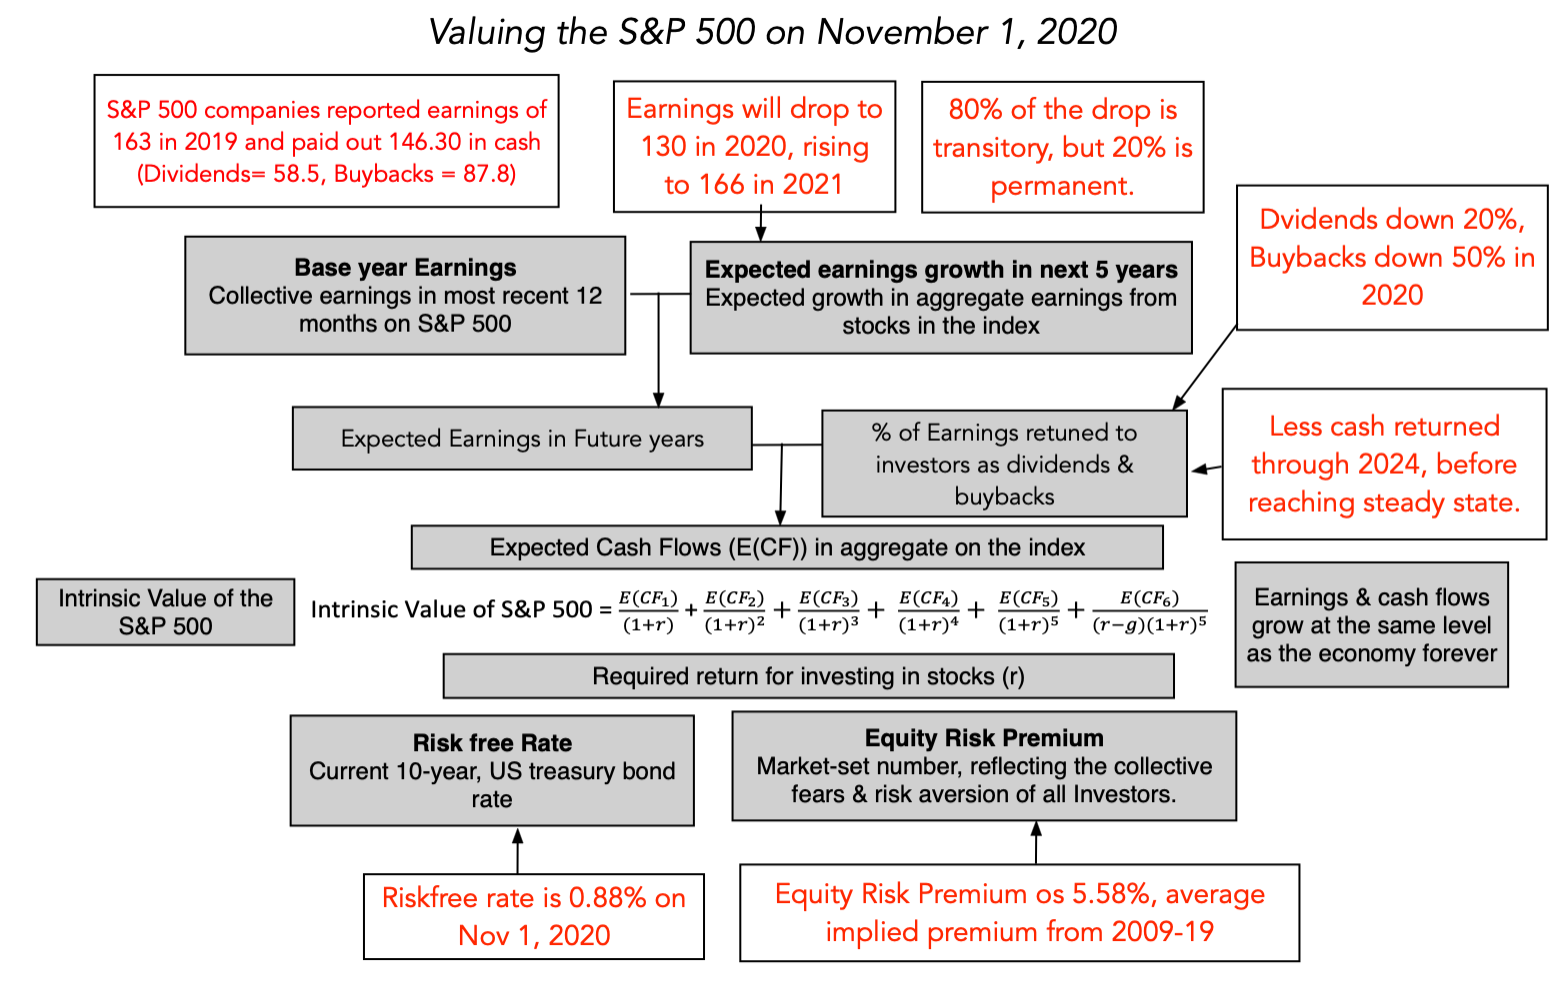
Note that in the intervening five months, since my last valuation, analysts tracking the index have become more optimistic about earnings in 2020 and 2021. The resulting valuation reflects these improved estimates:
 Download spreadsheet
Based upon my inputs, I arrive at a value for the index of just over 3100, which would make stocks mildly over valued. I also followed up with a simulation of this valuation, based upon distributions for my key inputs, and the results are below:
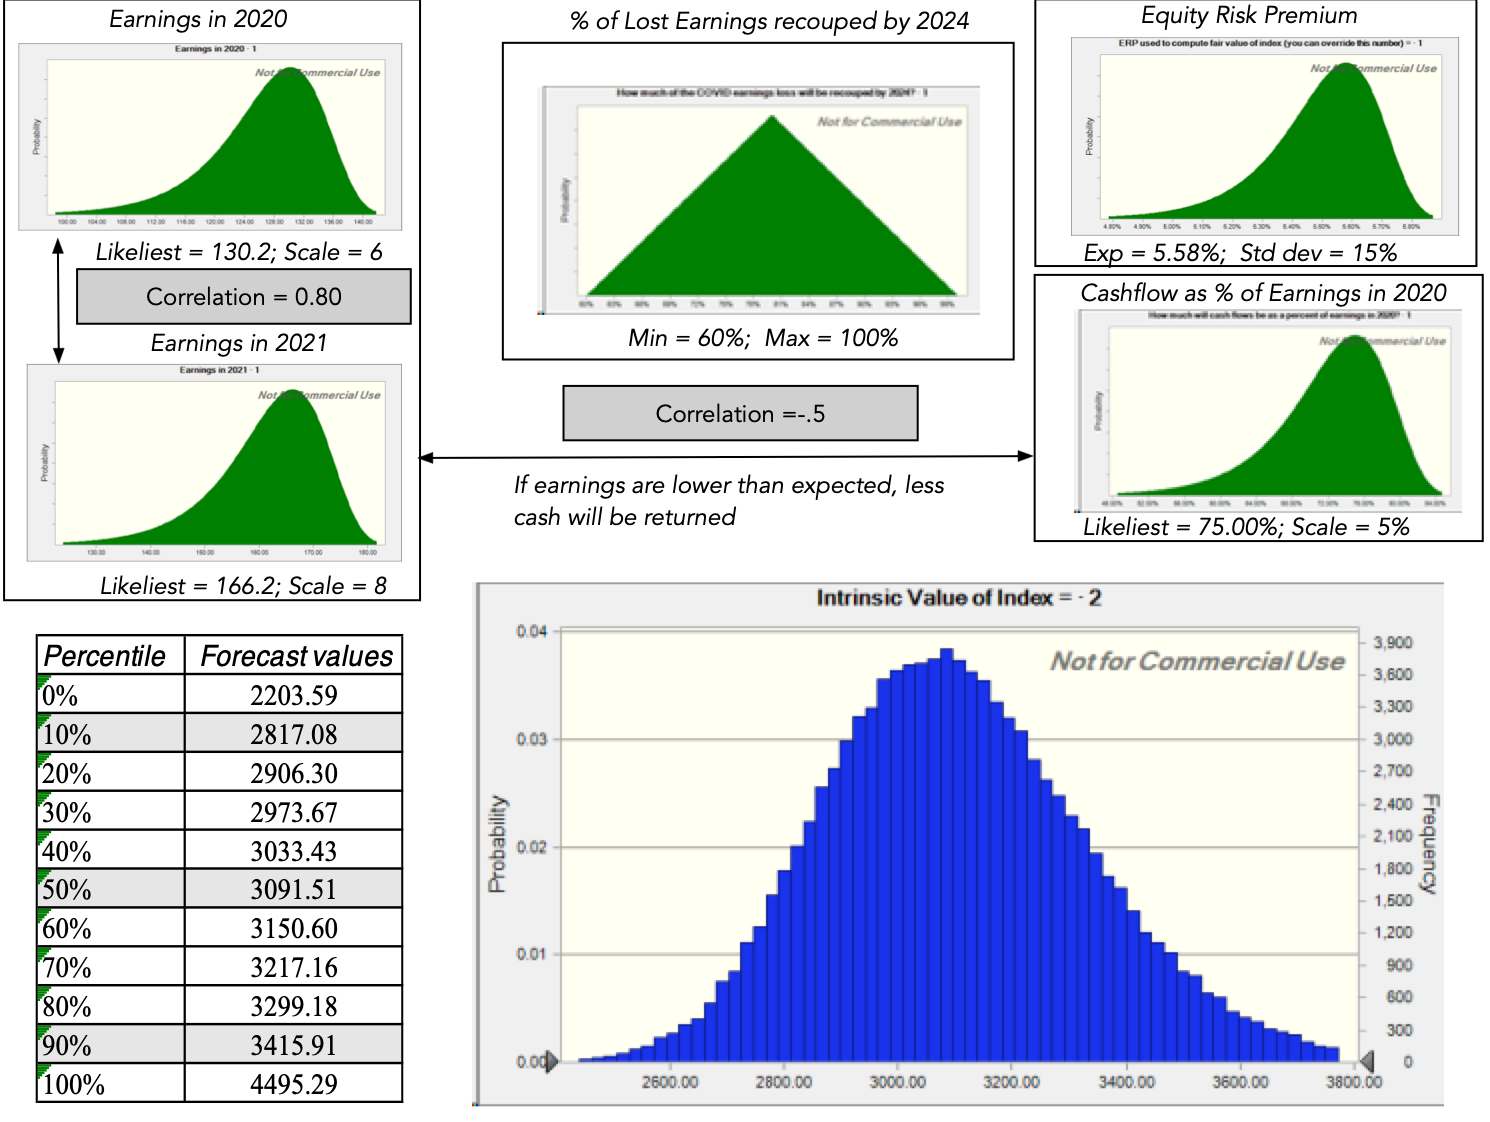 Download spreadsheet with simulation results
The simulation reinforces the findings in the base case valuation. You could make a case that stocks are over valued, and that case will be built on the premise that the economic damage from this crisis will be much greater and long lasting that analysts believe. However, if your argument is that markets have gone crazy and that nothing explains stock prices, you may want to evaluate that view, and consider at least the possibility that your world view (about how the economy will recover and the virus will play out) is wildly at odds with the market consensus. That leaves open the unpleasant possibility that it is you that is being irrational and wrong, not the market.
Crisis as Crucible: Lessons learned, unlearned and relearnedEvery crisis is a crucible, exposing what we don't know and putting our faith to the test. This one has been no different, and while I will not tell you that I have enjoyed it, I have learned some lessons from it.Respect markets, even if you disagree with them: Markets are not all knowing and they are definitely not efficient, but they are extraordinary platforms for conveying a consensus view of the future. While you and I may disagree with the market view, and markets can be wrong, it behooves us all to at least try and understand the message that it delivers.Time to move on: For many managers and investors, the COVID crisis is a reminder, sometimes in painful terms, that we are now well into the 21st century and continuing to use tools, techniques and metrics that were developed and tested on 20th century data is a recipe for disaster. That was the underlying message in my posts on value investing from last month.Importance of Flexibility: If you look across what companies that have done well during this crisis share in common, it is flexibility, with companies that can adapt quickly to new circumstances improving their odds of winning. In the same vein, it seems self defeating for companies to borrow too much or lock themselves into paying large dividends, since both reduce their capacity to respond quickly to changed circumstances.All in all, it has been an interesting roller coaster ride over these last few months, and I am glad that you were able to join me for at least some of the ride. It is definitely not over, but I have a feeling it is time for me to move on. There are other attractions at this fair!
YouTube Video
Data
Market data (November 1, 2020)Regional breakdown - Market Changes (November 1, 2020)Country breakdown - Market Changes (November 1, 2020)Sector breakdown - Market Changes (November 1, 2020)Industry breakdown - Market Changes (November 1, 2020)PE breakdown - Market Changes (November 1, 2020)PBV breakdown - Market Changes (November 1, 2020)Dividend Yield breakdown - Market Changes (November 1, 2020)Cash Return breakdown - Market Changes (November 1, 2020)Age breakdown - Market Changes (November 1, 2020)Revenue Growth breakdown - Market Changes (November 1, 2020)Debt load breakdown - Market Changes (November 1, 2020)SpreadsheetsValuation of the S&P 500 on November 1, 2020S&P 500 simulation resultsViral Market Update PostsA Viral Market Meltdown: Fear or Fundamentals?A Viral Market Meltdown II: Pricing or Valuing? Investing or Trading?A Viral Market Meltdown III: Clues in the Market DebrisA Viral Market Meltdown IV: Investing for a post-virus EconomyA Viral Market Meltdown V: Back to BasicsA Viral Market Meltdown VI: The Price of RiskA Viral Market Update VII: Market MultiplesA Viral Market Update VIII: Value vs Growth, Active vs Passive, Small Cap vs Large!A Viral Market Update IX: A Do-it-Yourself S&P 500 ValuationA Viral Market Update X: A Corporate Life Cycle PerspectiveA Viral Market Update XI: The Flexibility PremiumA Viral Market Update XII: The Resilience of Private Risk CapitalA Viral Market Update XIII: The Strong (FANGAM) get Stronger!A Viral Market Update XIV: It's a wrap, premature or not!


October 23, 2020
Value Investing III: Requiem, Rebirth or Reinvention?
If you have had the endurance to make your way through my first two posts on value investing, I compliment you on your staying power, but I am sure that, if you are a value investor, you have found my take on it to be unduly negative. In this, my third post, I want to explain why value investing is in trouble and point to ways in which it can be reinvented, to gain new life. I am sure that many of you will disagree both with my diagnosis and my solutions, but I welcome your points of view.
Value Investing: Has it lost its way?
I have never made the pilgrimage to the Berkshire Hathaway meetings, but I did visit Omaha, around the time of the annual meeting, a few years ago, to talk to some of the true believers who had made the trek. I do not think that I will be invited back again, because I argued in harsh terms that value investing had lost its way at three levels.
It has become rigid: In the decades since Ben Graham published Security Analysis, value investing has developed rules for investing that have no give to them. Some of these rules reflect value investing history (screens for current and quick ratios), some are a throwback in time, and some just seem curmudgeonly. For instance, value investing has been steadfast in its view that companies that do not have significant tangible assets, relative to their market value, and that view has kept many value investors out of technology stocks for most of the last three decades. Similarly, value investing's focus on dividends has caused adherents to concentrate their holdings in utilities, financial service companies and older consumer product companies, as younger companies have shifted away to returning cash in buybacks. It has become ritualistic: The rituals of value investing are well established, from the annual trek to Omaha, to the claim that your investment education is incomplete unless you have read Ben Graham's Intelligent Investor and Security Analysis to an almost unquestioning belief that anything said by Warren Buffett or Charlie Munger has to be right. Its has become righteous: While investors of all stripes believe that their "investing ways" will yield payoffs, some value investors seem to feel entitled to high returns because they have followed all of the rules and rituals. In fact, they view investors who deviate from the script as shallow speculators, but are convinced that they will fail in the "long term".Put simply, value investing, at least as practiced by some of its advocates, has evolved into a religion, rather than a philosophy, viewing other ways of investing as not just misguided, but wrong and deserving of punishment.
A New Paradigm for Value Investing
For value investing to rediscover its roots and reclaim its effectiveness, I believe that it has to change in fundamental ways. As I list some of these changes, they may sound heretical, especially if you have spent decades in the value investing trenches.
Be clearer about the distinction between value and price: While value and price are often used interchangeably by some market commentators, they are the results of very different processes and require different tools to assess and forecast.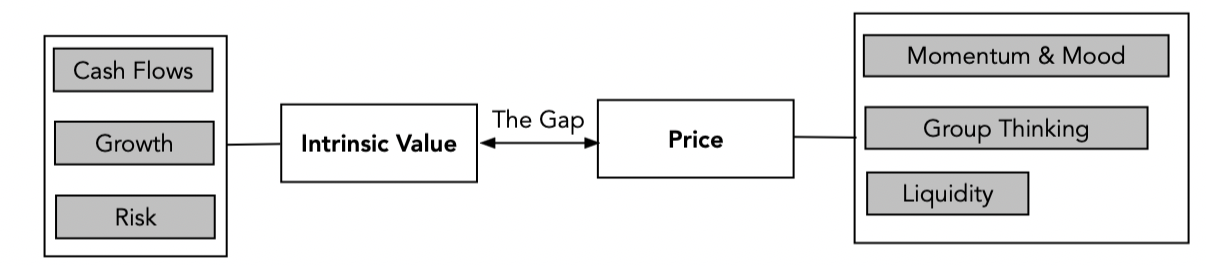
Value is a function of cash flows, growth and risk, and any intrinsic valuation model that does not explicitly forecast cash flows or adjust for risk is lacking core elements. Price is determined by demand and supply, and moved by mood and momentum, and you price an asset by looking at how the market is pricing comparable or similar assets. I am surprised that so many value investors seem to view discounted cash flow valuation as a speculative exercise, and instead pin their analysis on comparing comparing on pricing multiples (PE, Price to book etc.). After all, there should be no disagreement that the value of a business comes from its future cash flows, and the uncertainty you feel about those cash flows, and as I see it, all that discounted cash flow valuation does is bring these into the fold:

It is true that you are forecasting future cash flows and trying to adjust for risk in intrinsic valuation, and that both exercises expose you to error, but I don't see how using a pricing ratio or a short cut makes that error or uncertainty go away. Rather than avoid uncertainty, face up to it: Many value investors view uncertainty as "bad" and "something to be avoided", and it is this perspective that has led them away from investing in growth companies, where you have to grapple with forecasting the future and towards investing in mature companies with tangible assets. The truth is that uncertainty is a feature of investing, not a bug, and that it always exists, even with the most mature, established companies, albeit in smaller doses.
While it is true that there is less uncertainty, when valuing more mature companies in stable markets, you are more likely to find those mistakes in companies where the uncertainty is greatest about the future, either because they are young or distressed, or because the macroeconomic environment is challenging. In fact, uncertainty underlies almost every part of intrinsic value, whether it be from micro to macro sources:
To deal with that uncertainty, value investors need to expand their tool boxes to include basic statistical tools, from probability distributions to decision trees to Monte Carlo simulations. Margin of safety is not a substitute risk measure: I know that value investors view traditional risk and return models with disdain, but there is nothing in intrinsic value that requires swearing allegiance to betas and modern portfolio theory. In fact, if you don't like betas, intrinsic valuation is flexible enough to allow you to replace them with your preferred measures of risk, whether they be based upon earnings, debt or accounting ratios.
For those value investors who argue that the margin of safety is a better proxy for risk, it is worth emphasizing that the margin of safety comes into play only after you have valued a company, and to value a company, you need a measure of risk. When used, the margin of safety creates trade offs, where you avoid one type of investment mistake for another:
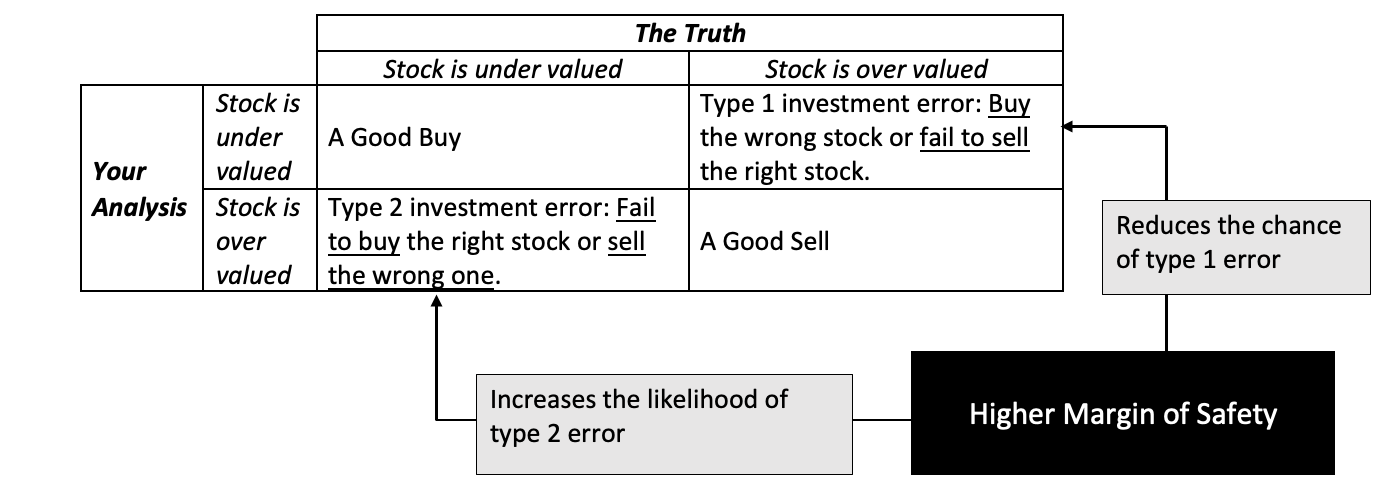
As to whether having a large MOS is a net plus or minus depends in large part on whether value investors can afford to be picky. One simply measure that the margin of safety has been set too high is a portfolio that is disproportionately in cash, an indication that you have set your standards so high that too few equities pass through. Don't take accounting numbers at face value: It is undeniable that value investing has an accounting focus, with earnings and book value playing a central role in investing strategies. There is good reason to trust those numbers less now than in decades past, for a few reasons. One is that companies have become much more aggressive in playing accounting games, using pro forma income statements to skew the numbers in their favor. The second is that as the center of gravity in the economy has shifted away from manufacturing companies to technology and service companies, accounting has struggled to keep up. In fact, it is clear that the accounting treatment of R&D has resulted in the understatement of book values of technology and pharmaceutical companies. You can pick stocks, and be diversified, at the same time: While not all value investors make this contention, a surprisingly large number seem to view concentrated portfolios as a hallmark of good value investing, arguing that spreading your bets across too many stocks will dilute your upside. The choice of whether you want to pick good stocks or be diversified is a false one, since there is no reason you cannot do both. After all, you have thousands of publicly traded stocks to pick from, and all that diversification requires is that rather than put your money in the very best stock or the five best stocks, you should hold the best thirty or forty stocks. My reasoning for diversification is built on the presumption that any investment, no matter how well researched and backed up, comes with uncertainty about the payoff, either because you missed a key element when valuing the investment or because the market may not correct its mistakes. In a post from a few years ago, I presented the choice between concentration and diversification in terms of those two uncertainties, i.e., about value and the price/value gap closing:
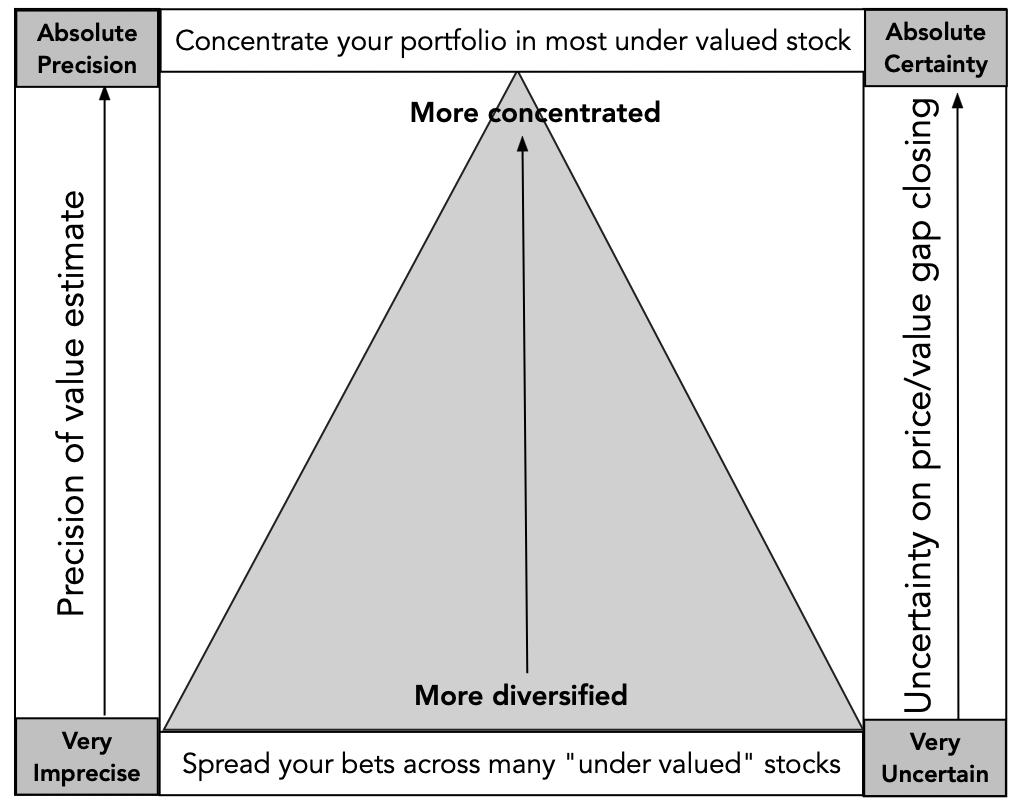
I think that value investors are on shaky ground assuming that doing your homework and focusing on mature companies yield precise valuations, and on even shakier ground, when assuming that markets correct these mistakes in a timely fashion. In a market, where even the most mature of companies are finding their businesses disrupted and market momentum is augmented by passive trading, having a concentrated portfolio is foolhardy.Don't feel entitled to be rewarded for your virtue: Investing is not a morality play, and there are no virtuous ways of making money. The distinction between investing and speculating is not only a fine one, but very much in the eyes of the beholder. To hold any investing philosophy as better than the rest is a sign of hubris and an invitation for markets to take you down. If you are a value investor, that is your choice, but it should not preclude you from treating other investors with respect and borrowing tools to enhance your returns. I will argue that respecting other investors and considering their investment philosophies with respect can allow value investors to borrow components from other philosophies to augment their returns. Moving ForwardInvestors, when asked to pick an investment philosophy, gravitate towards value investing, drawn by both its way of thinking about markets and its history of success in markets. While that dominance was unquestioned for much of the twentieth century, when low PE/PBV stocks earned significantly higher returns than high PE/PBV stocks, the last decade has shaken the faith of even diehard value investors. While some in this group see this as a passing phase or the result of central banking overreach, I believe that value investing has lost its edge, partly because of its dependence on measures and metrics that have become less meaningful over time and partly because the global economy has changed, with ripple effects on markets. To rediscover itself, value investing needs to get over its discomfort with uncertainty and be more willing to define value broadly, to include not just countable and physical assets in place but also investments in intangible and growth assets.
YouTube Video
Blog Posts on Value Investing (2020)Value Investing I: The Glory DaysValue Investing II: A Lost DecadeValue Investing III: Rebirth, Reincarnation or Requiem?
Value Investing II: Tough times for Value Investing - Passing Phase or a Changed World?
In the last post, I noted the strong backing for value investing for much of the last century, where a combination of investing success stories and numbers that back those stories allowed it to acquire its lead position among investment philosophies. In this post, I plan to look at the underbelly of value investing, by first going back to the "good old days" for value investing, and probing the numbers more closely to see if even in those days, there were red lights that were being ignored. I will follow up by looking at the last decade (2010-2019), a period where value investing lost its sheen and even long time value investors started questioning its standing, and then extend this discussion to 2020, as COVID has caused further damage. I will close by looking at the explanations for this lost decade, not so much as a post-mortem, but to get a measure of what value investors may need to do, going forward.
The Dark Side of the Good Old DaysFor value investors, nostalgic for the good old days, when the dominance of value investing was unquestioned, I think it is worth pointing out that the good old days were never that good, and that even in those days, there were legitimate questions about the payoff to value investing that remained unanswered or ignored.
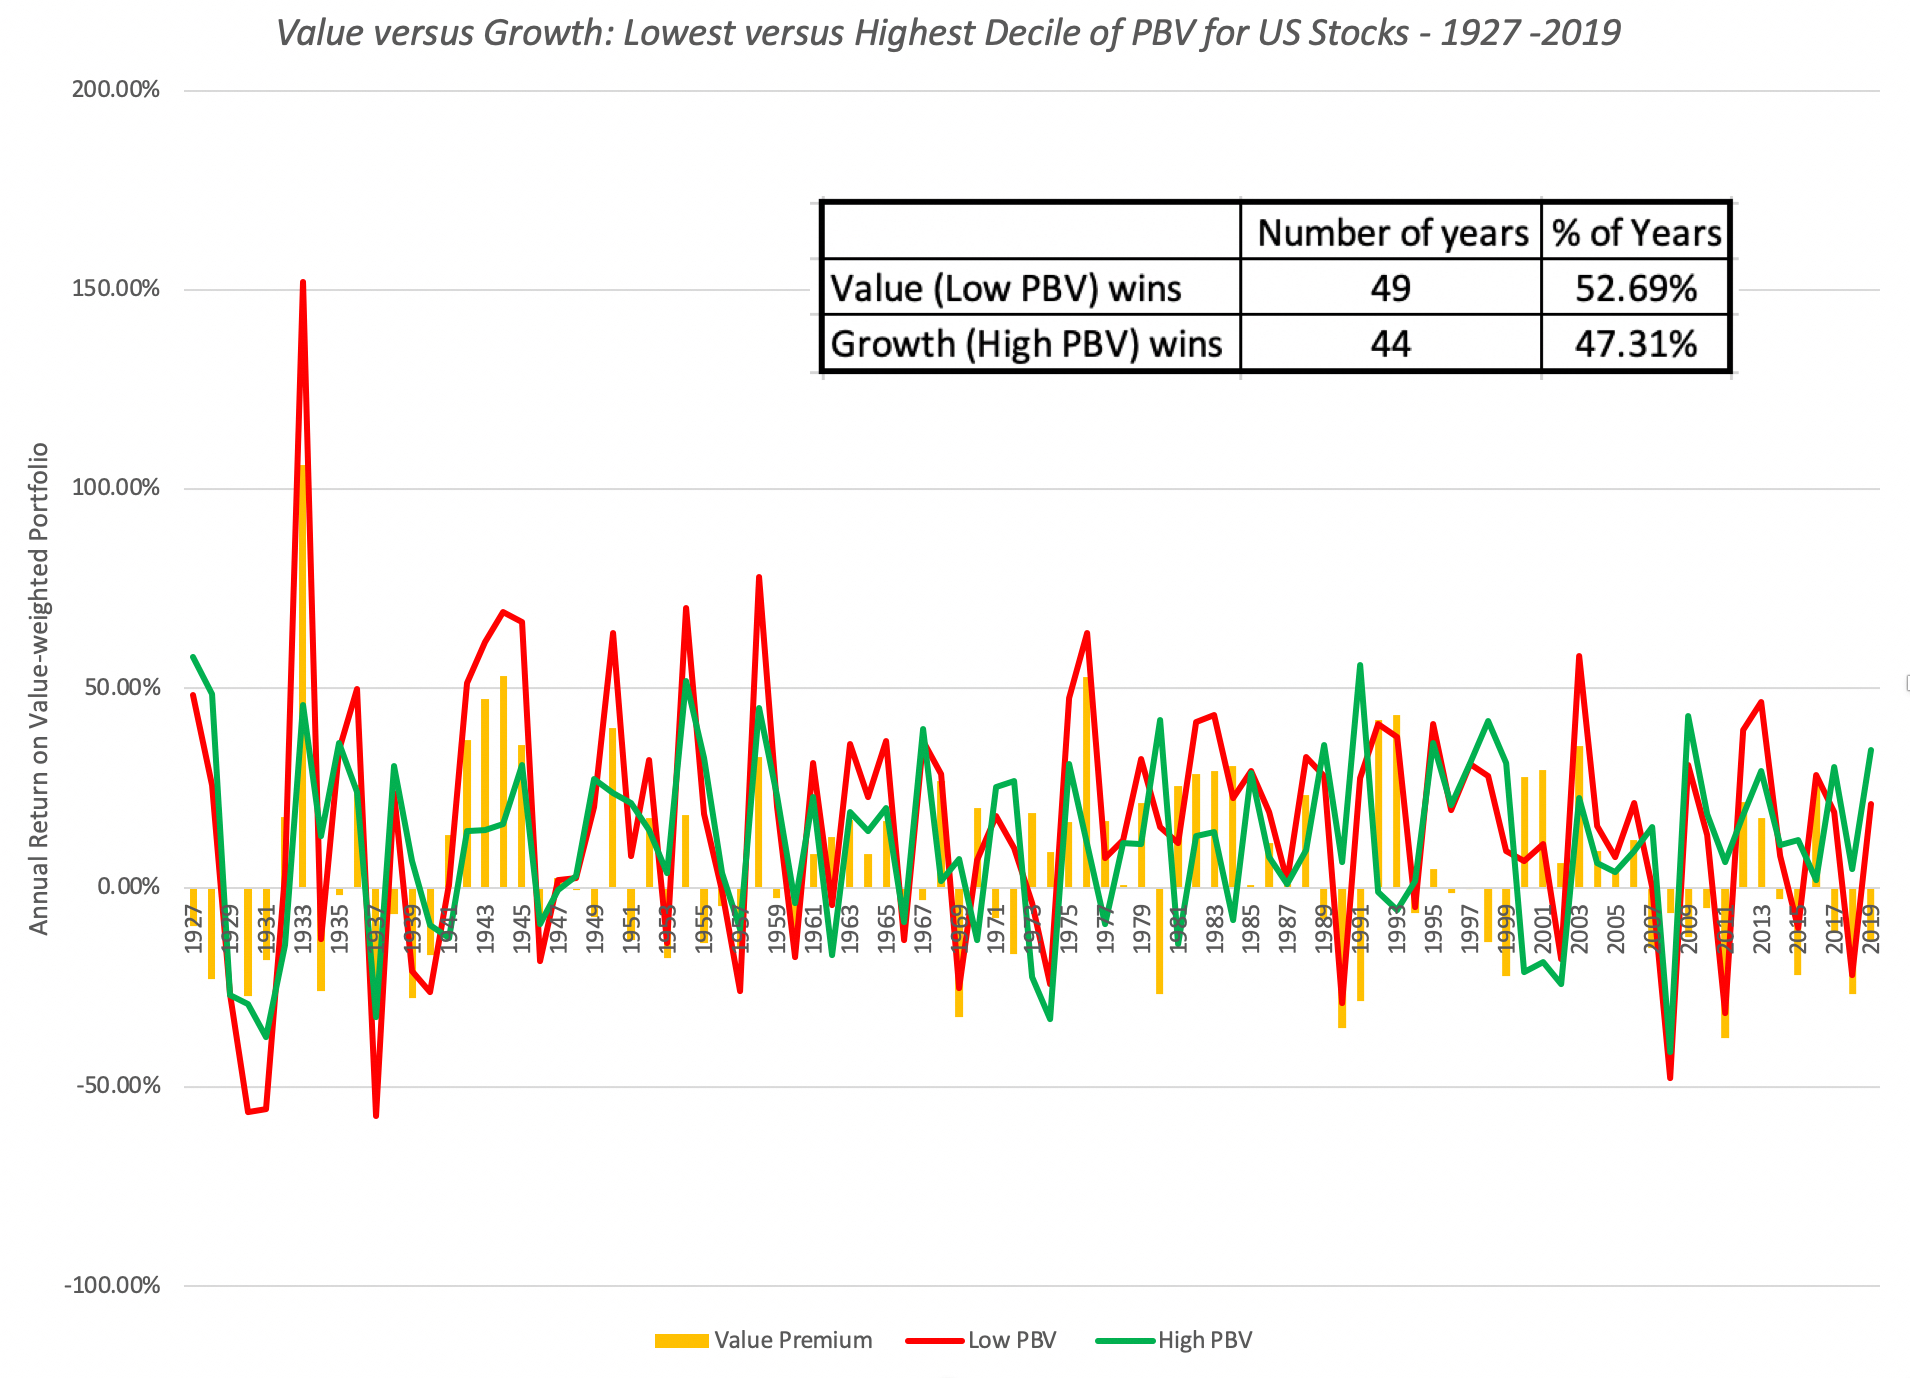
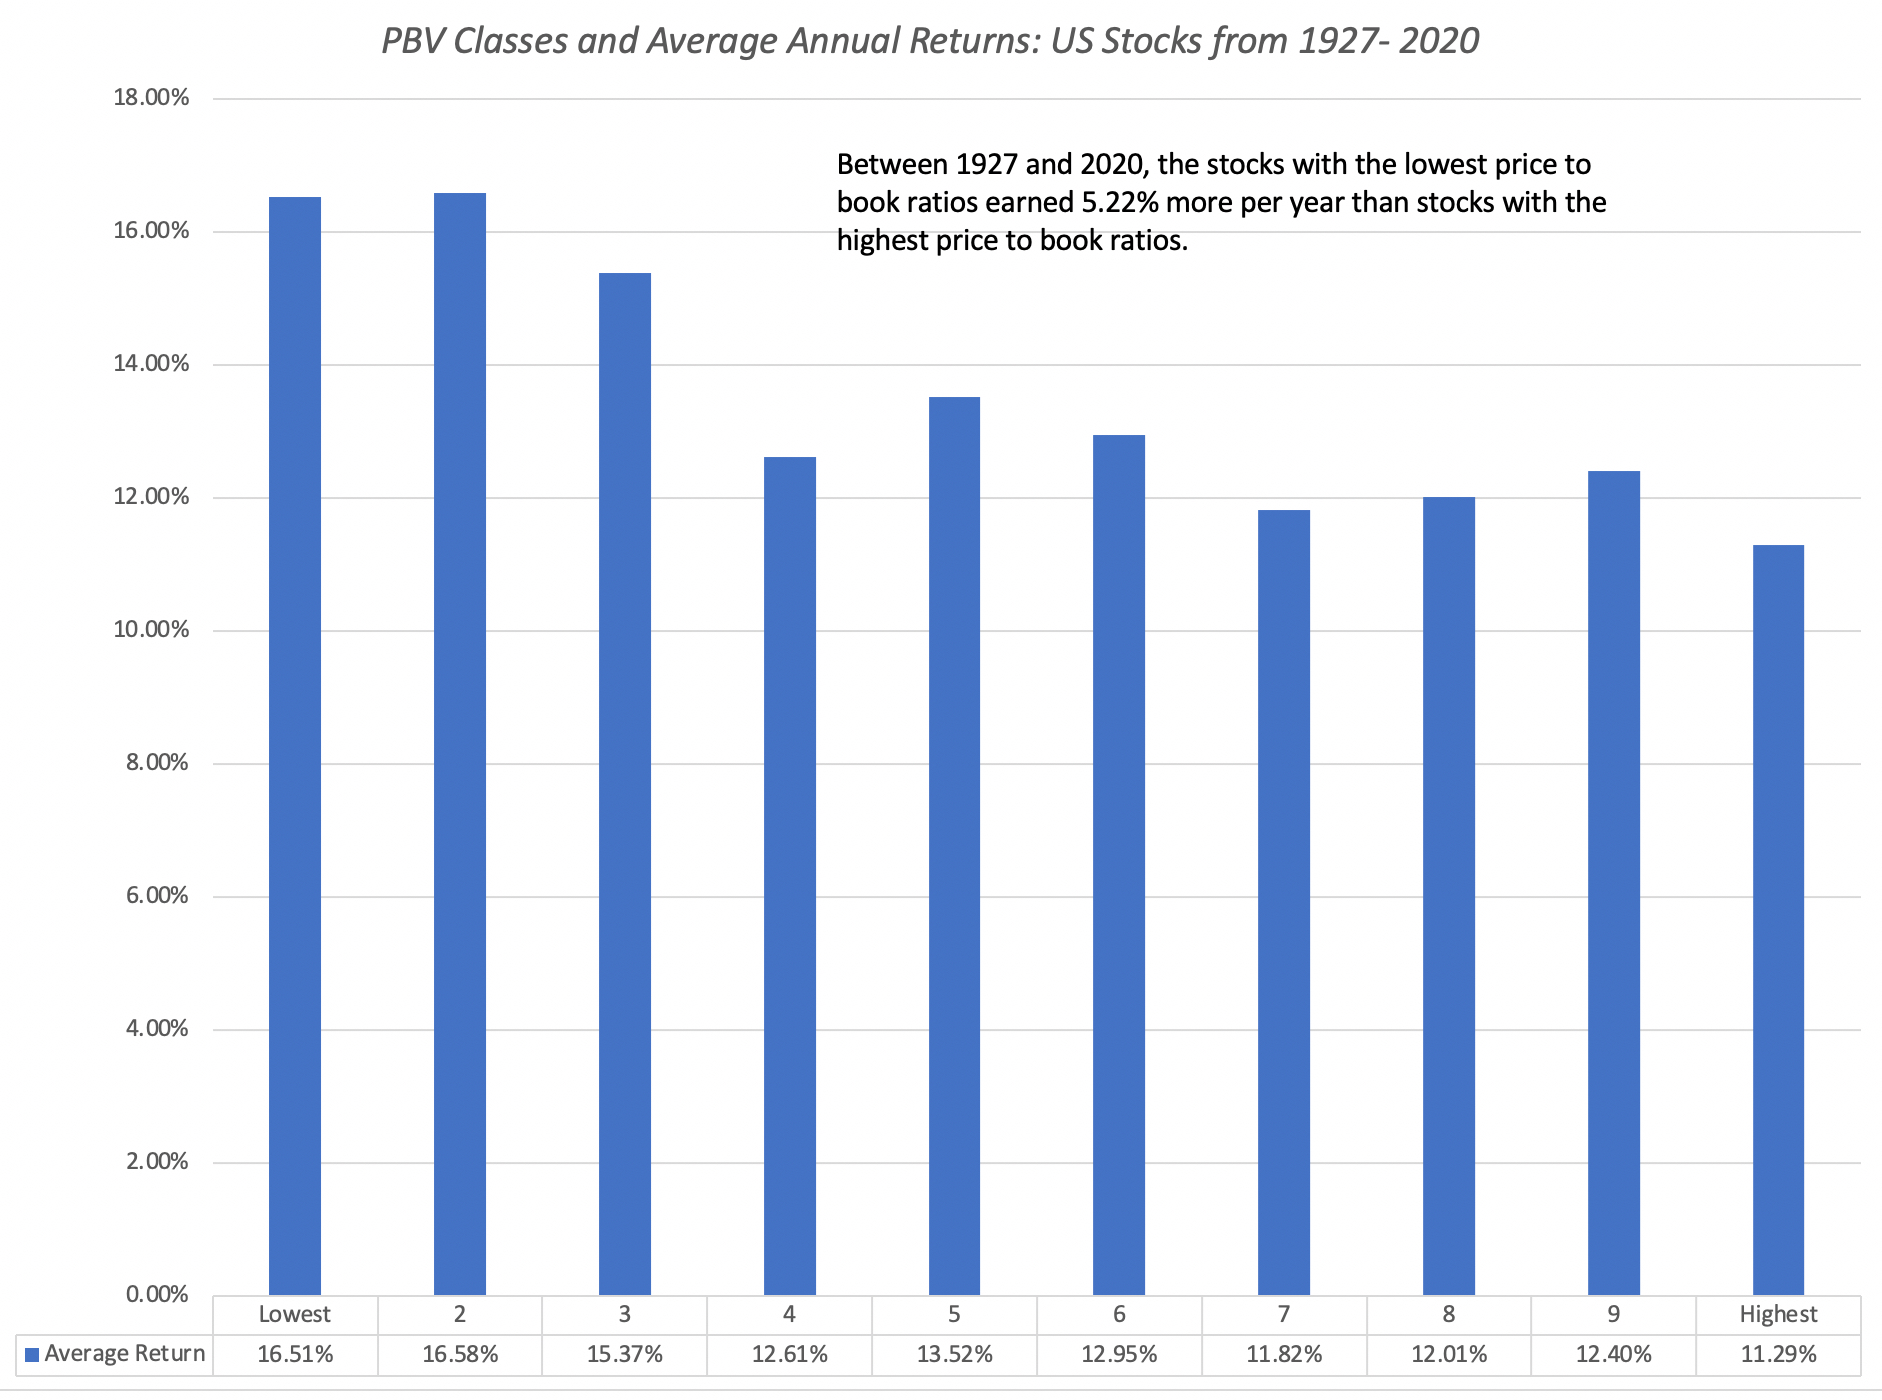
Revisiting the Value PremiumFor some value investors, the graph from my last post, showing that low price to book stocks have outperformed high price to book stocks by more than 5% a year, going back to 1927 in the US, is all the proof they need to conclude that value investing has won the investing game, but even that rosy history has warts that are worth examining. In the graph below, I look at the year-to-year movements in the value premium, i.e. the difference between the annual returns on the lowest and highest deciles of price to book ratios:
 Source: Ken French
While it is true that low price to book stocks earned higher annual returns than high price to book stocks over the entire time period, note that there is significant variation over time, and that the high price to book stocks delivered higher returns in 44 of the 93 years of data. In fact, one of the pitches that growth investors made, with some success, during the glory days of value investing was that you could still succeed as a growth investor, if you had the capacity to time the value/growth cycle. In particular, looking back at the data on value versus growth and correlating with other variables, there are two fundamentals that seem to be correlated with whether value or growth investing emerges the winner.
The first is earnings growth, with growth investing beating value investing when earnings growth rates are low, perhaps because growth becomes a scarcer and a bigger driver of value. The other is the slope of the yield curve, i.e., the difference between short term and long term rates, with flatter and downward sloping yield curves associates with growth outperforming and upward sloping yield curves with value outperforming.In short, the fact that value stocks, at least based upon the price to book proxy, delivered higher returns than growth stocks, again using that proxy, obscures the reality that there were periods of time even in the twentieth century, where the latter won out.
Payoff to Active Value InvestingInvesting in low PE or low PBV stocks would not be considered true value investing, by most of its adherents. In fact, most value investors would argue that the while you may start with these stocks, the real payoff to value investing comes in from the additional analysis that you do, whether it be in bringing in other quantitative screens (following up on Ben Graham) and qualitative ones (good management, moats). If we call this active value investing, the true test of value investing then becomes whether following value investing precepts and practices and picking stocks generates returns that exceed the returns on a value index fund, created by investing in low price to book or low PE stocks. Defined thus, the evidence that value investing works has always been weaker than just looking at the top lines, though the strength of the evidence varies depending upon the strand of value investing examined.
Screening for Value: Since Ben Graham provided the architecture for screening for cheap stocks, it should be no surprise that some of the early research looked at whether Graham's screens worked in delivering returns. Henry Oppenheimer examined the returns on stocks, picked using the Graham screens, between 1970 and 1983, and found that they delivered average annual returns of 29.4% a year, as opposed to 11.5% of the index. There are other studies that do come to the same conclusion, looking at screening over the period, but they all suffer from two fundamental problems. The first is that one of the value screens that invariably gets used is low PE and low PBV, and we already know that these stocks delivered significantly higher returns than the rest of the market for much of the last century, and it is unclear from these studies whether all of the additional screens (Graham has a dozen or more) add much to returns. The second is that the ultimate test of a philosophy is not in whether its strategies work on paper, but in whether the investors who use those strategies make money on actual portfolios. There is many a slip between the cup and the lip, when it comes to converting paper strategies to practical ones, and finding investors who have consistently succeeded at beating the market, using screening, is difficult to do. Contrarian Value: The early evidence on contrarian investing came from looking at loser stocks, i.e., stocks that have gone down the most over a prior period, and chronicling the returns you would earn if you bought these stocks. One of the earliest studies, from the mid 1980s, presented this eye-catching graph, backing up the thesis that loser stocks are investment winners: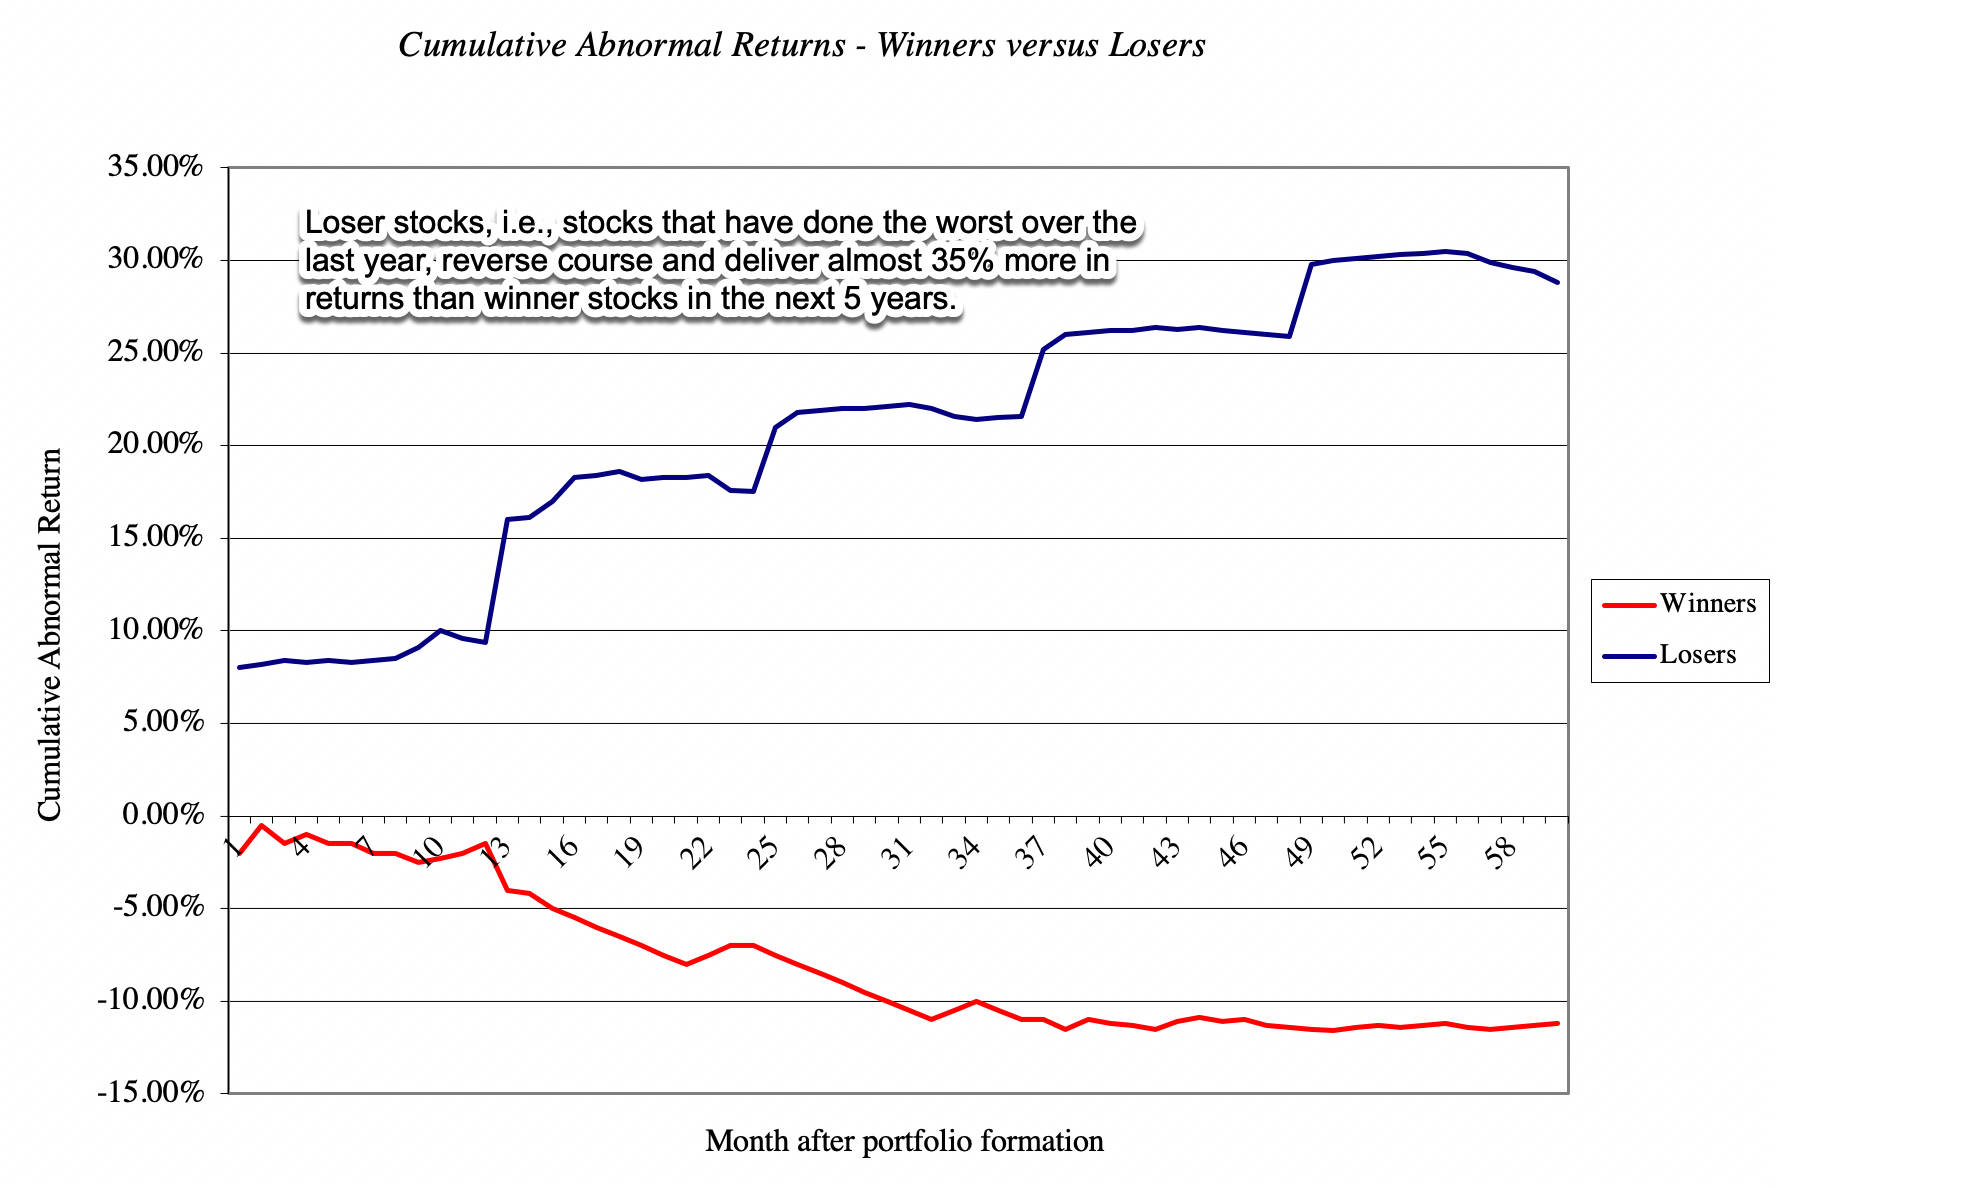 Source: DeBondt and Thaler,
 Loser stocks, defined as the stocks that have gone down the most in the last year, deliver almost 45% more in returns than winner stocks, defined as stocks that have gone up the most in the last year. Before you jump out and start buying loser stocks, research in subsequent years pointed to two flaws. The first was that many of the loser stocks in the study traded at less than a dollar, and once transactions costs were factored in, the payoff to buying these stocks shrunk significantly. The second came in a different study, which made a case for buying winner stocks with this graph:
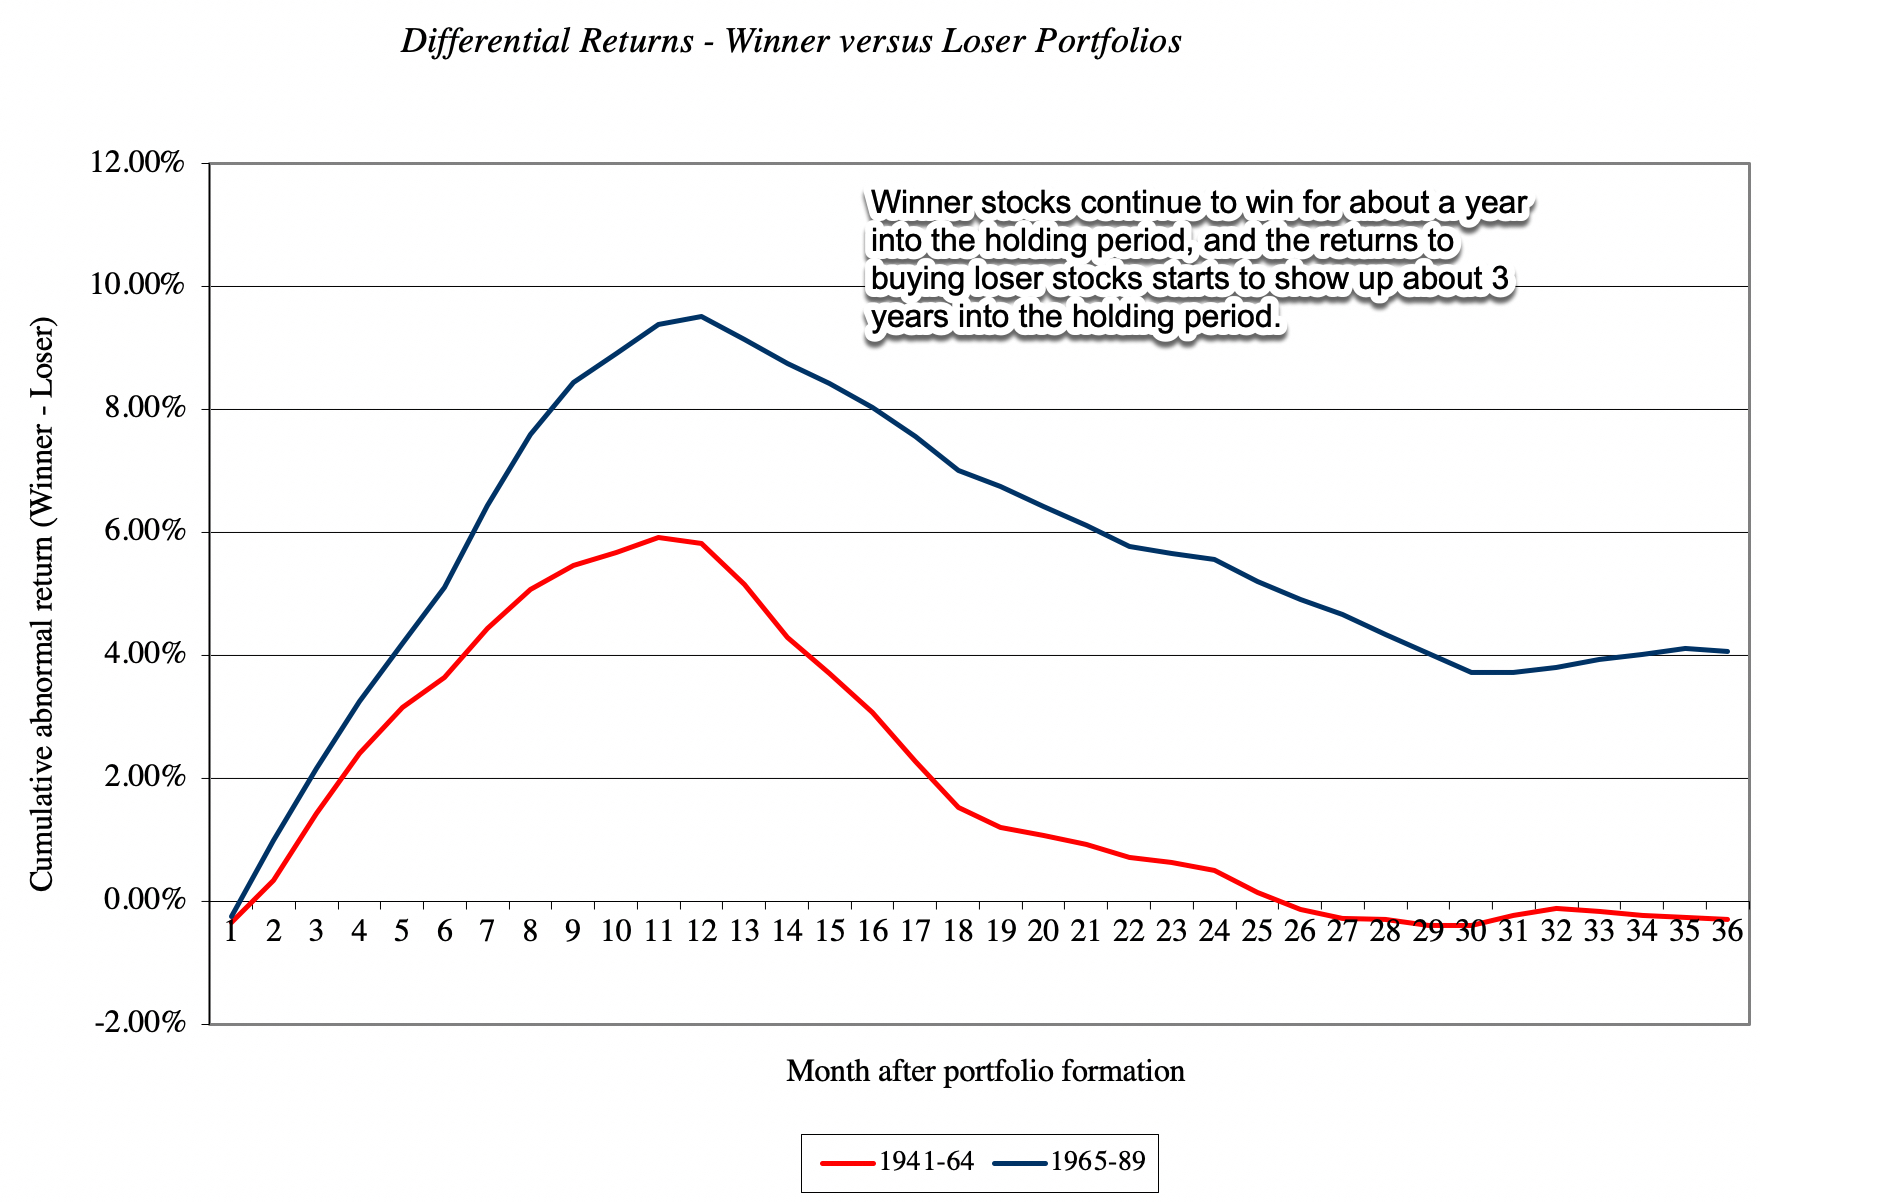 Source: Jegadeesh and Titman
Note that winner stocks continue to win, in both time periods examined, in the first twelve months after the portfolios are created, though those excess returns fade in the months thereafter. Put simply, if you invest in loser stocks and lose your nerve or your faith, and sell too soon, your loser stock strategy will not pay off.Activist Value: Of all of the different strands of value investing, the one that seems to offer the most promise is activist investing, since it is a club that only those with substantial resources can join, with the promise of bringing change to companies. The early results looked promising, as activist hedge funds seemed to offer a greater chance of beating the market than other investing approaches:
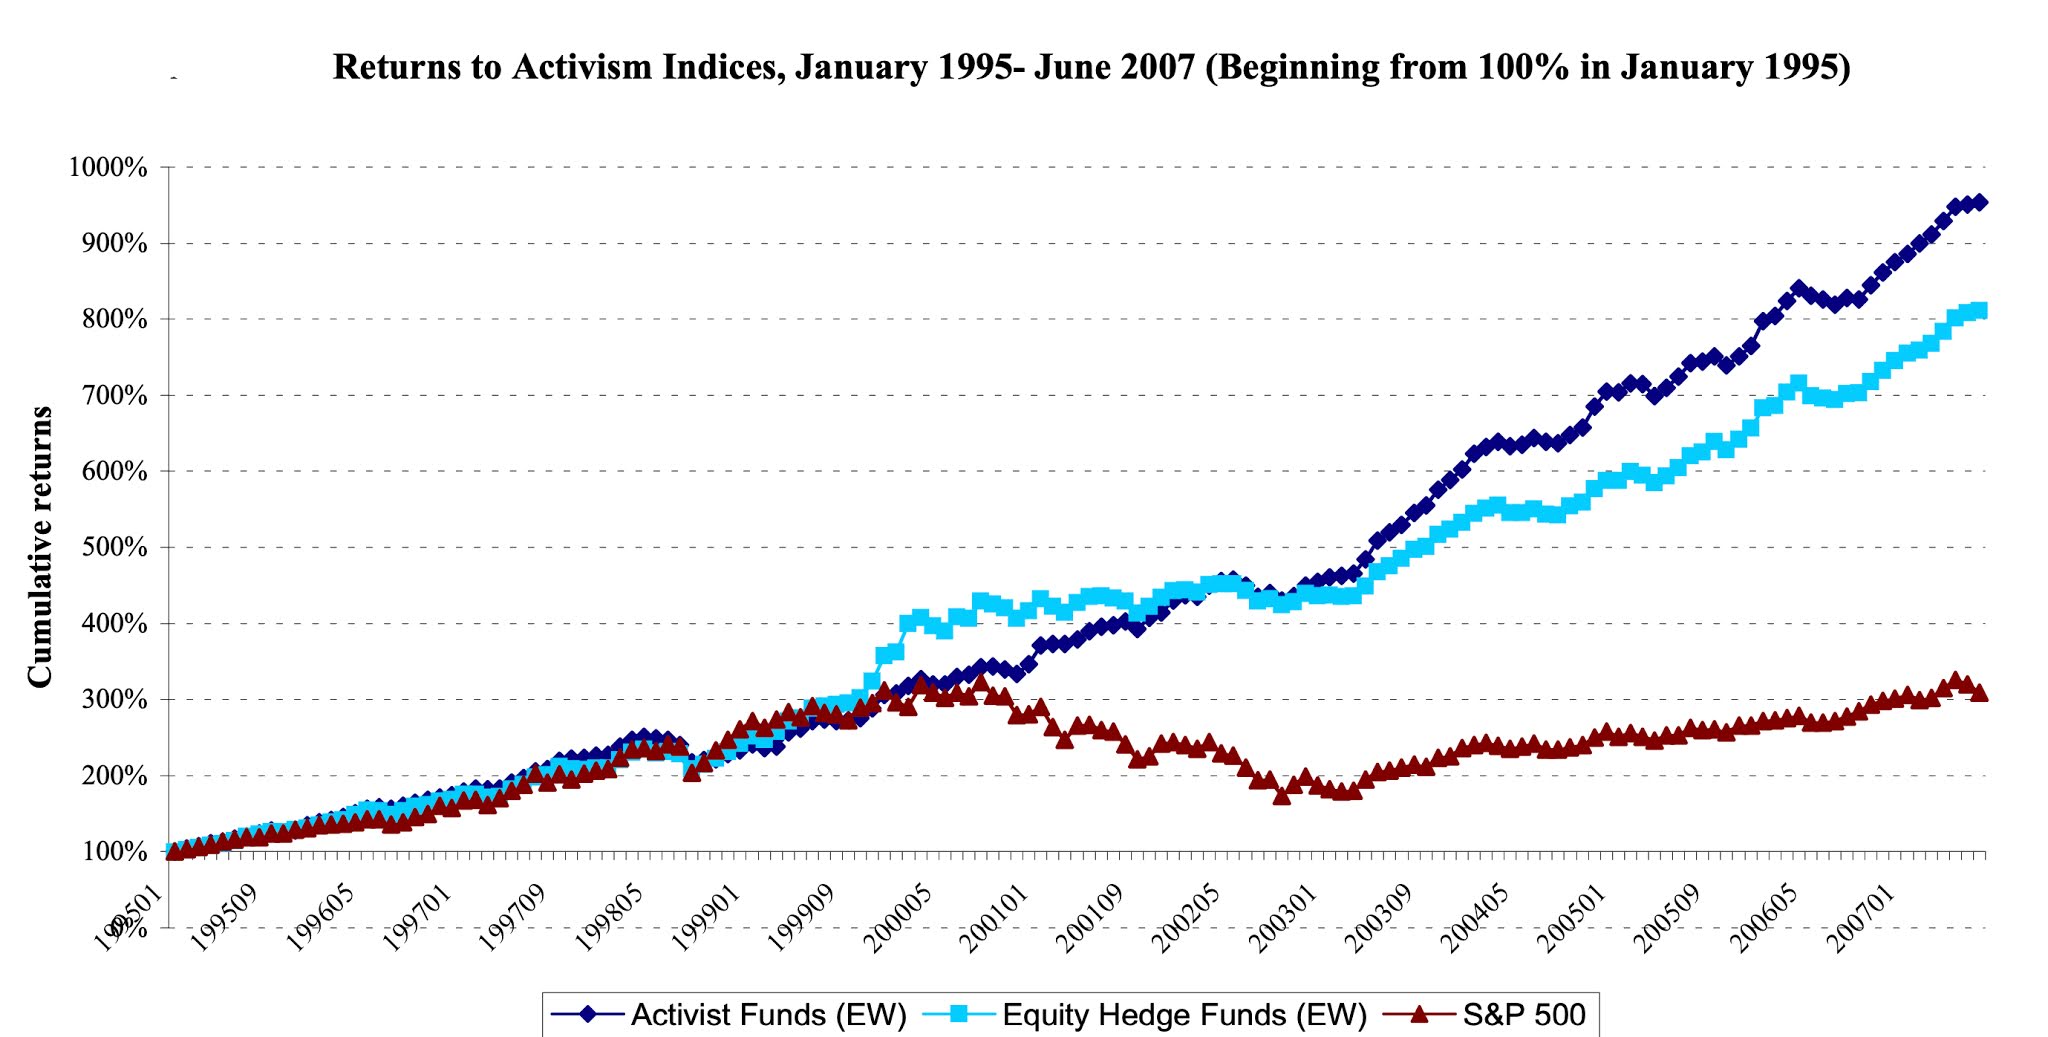 Source: Brav (2008)
In the 1995-2007 time period, activist value investors outstripped both hedge funds and the S&P 500, delivering super-sized returns Those numbers, though, are starting to come under strain, as activist investing has widened it search and perhaps lost its focus in the last decade:
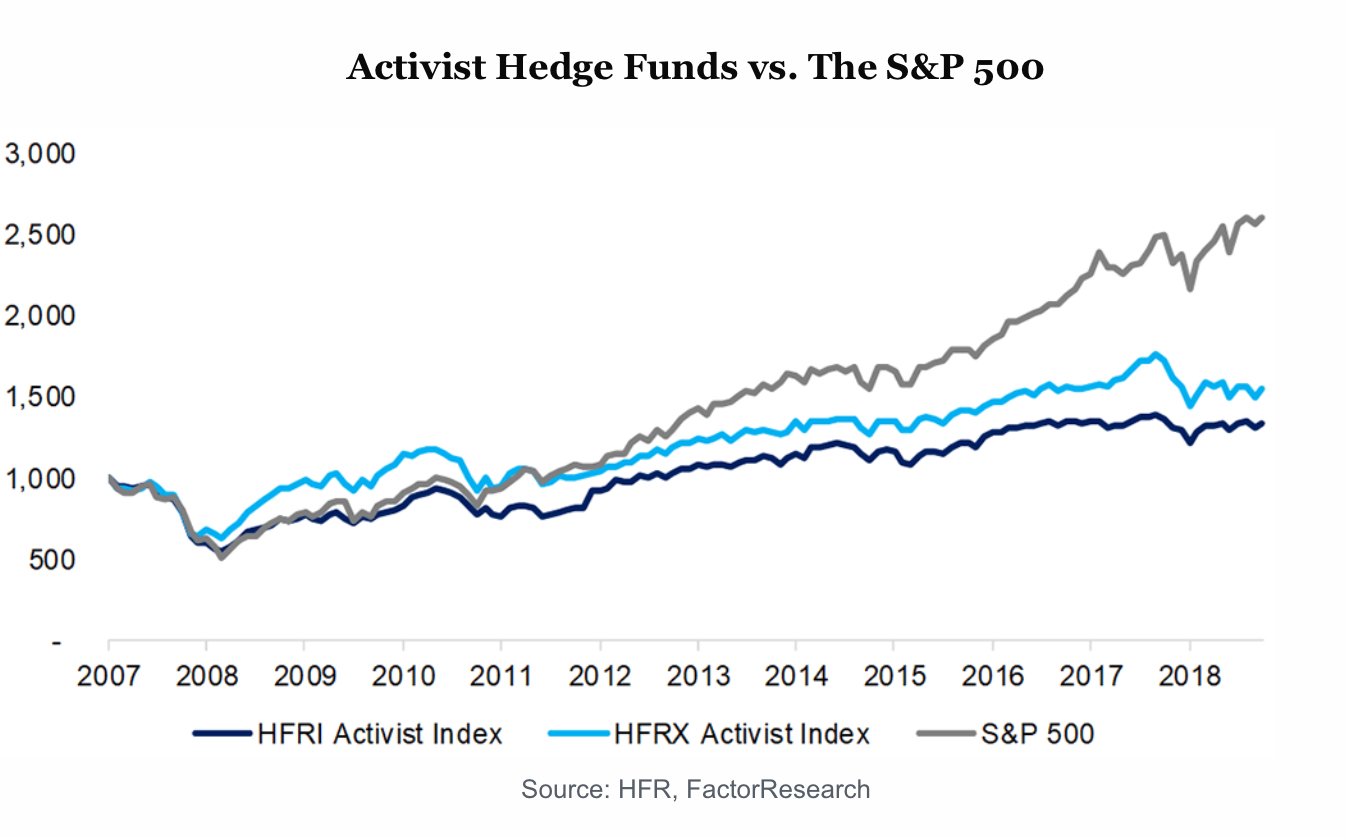 Source: CFA Institute
In the last decade, the bloom has come off the activist investing rose, as returns from it have dropped off to the point that activist investors, at least in the aggregate, are underperforming the market. The only saving grace is that activist investing is a skewed game, where the winners win really big, and many of the losers drop out.Indexed Value: Many value investors will blanch at the idea of letting indexed value investors into this group, but there can be no denying the fact that funds have flowed into tilted index funds, with many of the tilts reflecting historical value factors (low price to book, small cap, low volatility). The sales pitch for these funds is more often that you can not only get a higher return, because of your factor tilts, but also a bigger bang (return) for your risk (standard deviation) rather than a higher return per se (higher ratios of returns to standard deviation). The jury is still out, and my personal view is that titled index funds are an oxymoron, and that these funds should be categorized as minimalist value funds, where you try to minimize your activity, so as to lower your costs.
The most telling statistics on the failure of value investing come from looking at the performance of mutual fund managers who claim to be its adherents. While the earliest studies of mutual funds looked at them as a group, and concluded that they collectively under performed the market, later studies have looked at mutual funds, grouped by category (small cap vs large cap, value vs growth) to see if fund managers in any of these groupings performed better than managers in other groupings. None of these studies have found any evidence that value fund managers are more likely to beat their index counterparts than their growth fund counterparts. It is telling that value investors, when asked to defend their capacity to add value to investing, almost never reference that research, partly because there is little that they can point to as supportive evidence, but instead fall back on Warren Buffett, as their justification for value investing. As I noted in my last post, there is no doubt about Buffett's success over the decades, but as the man turned ninety this year, it is worth asking whether the continued use of his name is more a sign of weakness in value investing, rather than of strength.
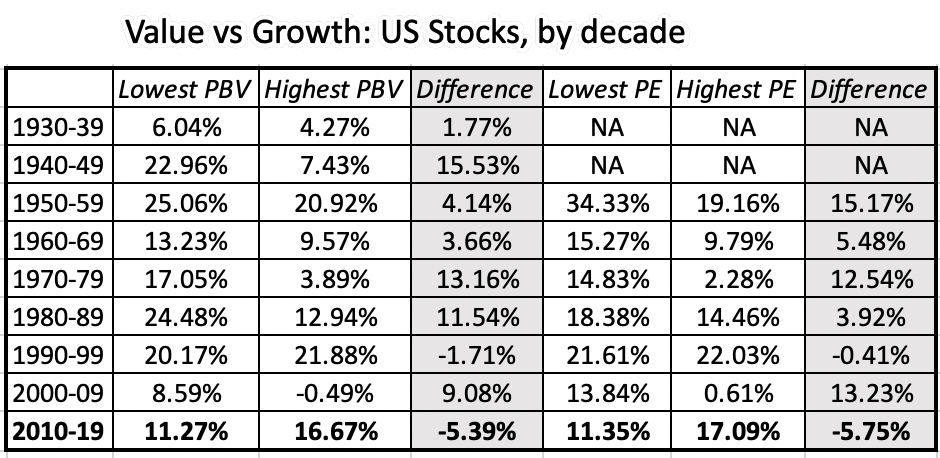
Wandering in the wilderness? Value Investing in the last decadeLooking at my analysis of value investing over the last century, you can accuse me of perhaps nitpicking an overall record of success, but the last decade has, in my view, tested value investing in ways that we have never seen before. To see how much of an outlier this period (2010-2019) has been, take a look at the returns to low and high PBV stocks, by decade:
 Source: Ken French
While it is true that the dot-com boom allowed growth stocks to beat out value stocks in the 1990s, the difference was small and bunched up in the last few years of that decade. In the 2010-2019 time period, in the battle between value and growth, it was no contest with growth winning by a substantial amount and in seven of the ten years.
To make things worse, active value investors, at least those that run mutual funds, found ways to underperform even these badly performing indices. Rather than use risk and return models or academic research to back up this proposition, and open up the debate about portfolio theories, I will draw on a much more simplistic but perhaps more effective comparison. One of S&P's most informative measures is SPIVA, where S&P compares the returns of fund managers in different groupings to indices that reflect that grouping (value index for value funds, growth index for growth funds etc.) and reports on the percentage of managers in each grouping that beat the index. Listed below are the SPIVA measures for 2005-2019 for value managers in all different market cap classes (large, mid-sized, small):
 Risk Adjusted SPIVA Scorecard (2019)
Put simply, most value fund managers have had trouble beating the value indices, net of fees. Even gross of fees, the percentages of fund managers beating their indices stays well above 50%.
Even legendary value investors lost their mojo during the decade, and even Warren Buffett's stock picking delivered average returns. He abandoned long standing practices, such as using book value as a basis for estimating intrinsic value and never doing buybacks, for good and bad reasons. The best indicator of how the market has also lowered the value it attaches to his stock picking is in a number that has the Buffett imprimatur, the ratio of price to book at Berkshire in the last few years:
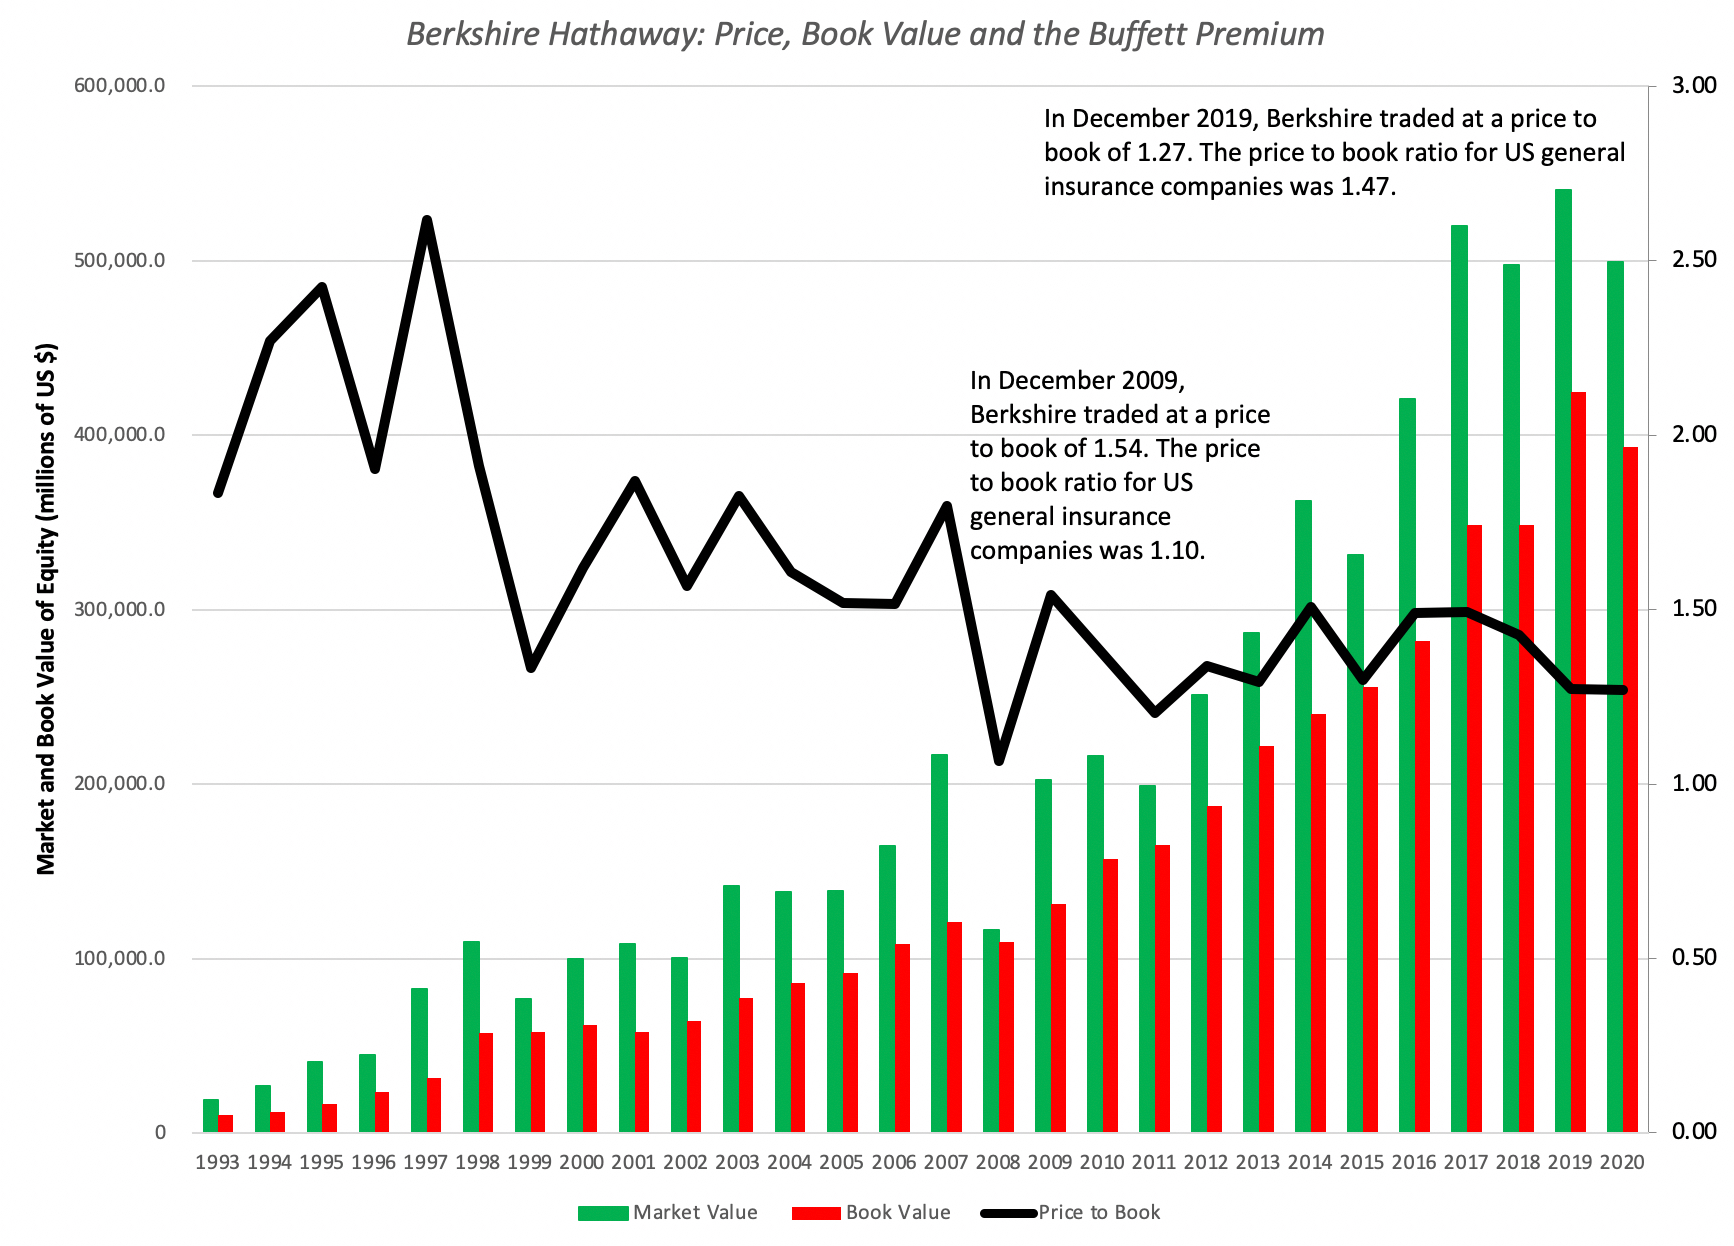
Since Berkshire's assets are primarily in publicly traded companies, and these investments have been marked to market for all of this period, one way to look at a portion of the premium that investors are paying over book value is to consider it to be the stock picker premium. Since some of the premium can also be explained by its presence in the insurance business, I compared the price to book for Berkshire to that of general insurance companies listed and traded in the United States. At the start of 2010, Berkshire traded at a price to book ratio of 1.54, well above the US insurance company industry average of 1.10. Ten years later, at the start of 2020, the price to book ratio for Berkshire had dropped to 1.27, below the average of 1.47 for US insurance companies. The loss of the Buffett premium may seem puzzling to those who track news stories about the man, since he is still not only treated as an investing deity, but viewed as the person behind every Berkshire Hathaway decision, from its investment in Apple in 2017 to its more recent one in the Snowflake IPO. My reading is that markets are less sentimental and more realistic in assessing both the quality of his investments (that he is now closer to the average investor than he has ever been) and the fact that at his age, it is unlikely that he is the lead decision-maker at Berkshire anymore.
The COVID shockFor much of the decade, value investors argued that their underperformance was a passing phase, driven by the success of growth and momentum and aided and abetted by the Fed, and that it value investing would come back with a vengeance in a crisis. The viral shock delivered by the Corona Virus early this year seemed to offer an opportunity for value investing, with its emphasis on safety and earnings, to shine.
In the first few weeks, there were some in the value investing camp who argued that following old time value investing precepts and investing in stocks with low PE and Price to book ratios and high dividends would help buffer investors from downside risk. While the logic may have been appealing, the results have not, as can be seen in this table, where I look at stocks classified based upon their PE ratios and Price to Book ratios on February 14, 2020 (at the start of the crisis), and examining the changes in the aggregate market capitalization in the six months following:

The numbers speak for themselves. Low PE and low PBV stocks have lost value during this crisis, just as high PE and PBV stocks have gained in value. Breaking companies down based upon dividend yields, and looking at market capitalization changes yields the following:
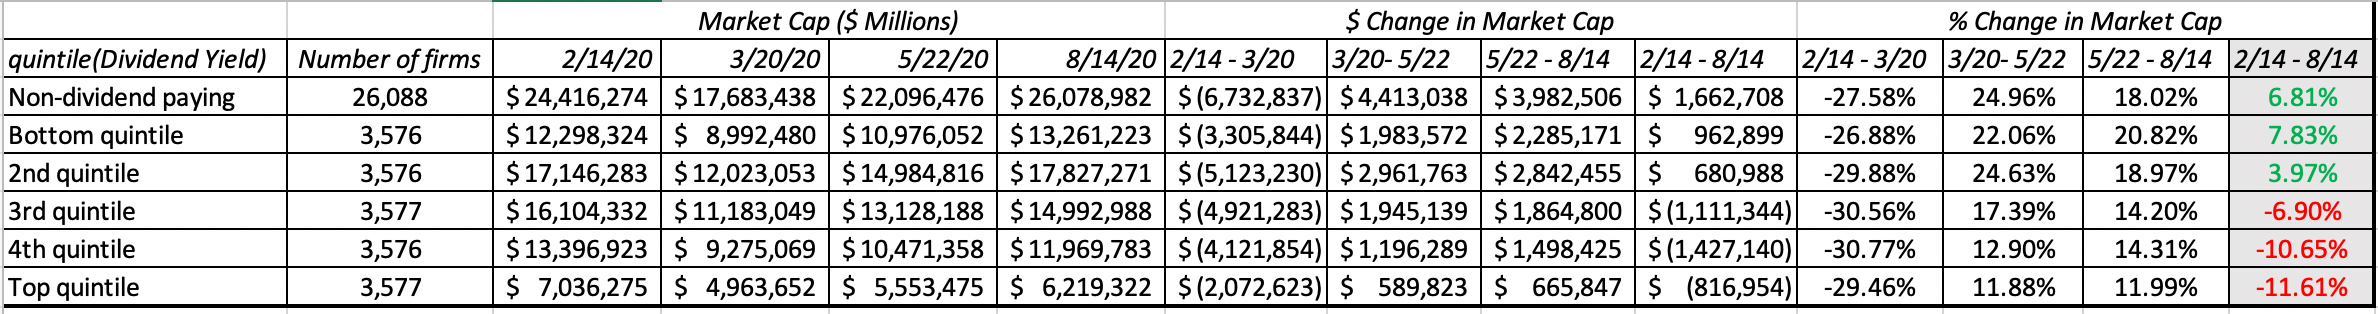
The results are perverse, at least from a value investing perspective, since the stocks that have done best in this crisis are non-dividend paying, high PE stocks, and the stocks that have done worst during the crisis have been high dividend paying, low PE stock.
The ExplanationsThe attempt to explain what happened to value investing in the last decade (and during COVID) is not just about explaining the past, since the rationale you provide will inform whether you will continue to adhere to old time value investing rules, modify them to reflect new realities or abandon them in search of new ones. In particular, there are four explanations that I have heard from value investors for what were wrong during the last decade, and I will list them in their order of consequence for value investing practices, from most benign to most consequential.
This is a passing phase!Diagnosis: Even in its glory days, during the last century, there were extended periods (like the 1990s) when low PE and low PBV stocks underperformed, relative to high PE and high PBV stocks. Once those periods passed, they regained their rightful place at the top of the investing heap. The last decade was one of those aberrations, and as with previous aberrations, it too shall pass!Prescription: Be patient. With time, value investing will deliver superior returns.The Fed did it!Diagnosis: Starting with the 2008 crisis and stretching into the last decade, central banks around the world have become much more active players in markets. With quantitative easing, the Fed and other central banks have contributed not only to keeping interest rates lower (than they should be, given fundamentals) but also provided protection for risk taking at the expense of conservative investing. Prescription: Central banks cannot keep interest rates low in perpetuity, and even they do not have the resource to bail out risk takers forever. Eventually, the process will blow up, causing currencies to lose value, government budgets to implode and inflation and interest rates to rise. When that happens, value investors will find themselves less hurt than other investors.The Investment World has become flatter!Diagnosis: When Ben Graham listed his screens for finding good investments in 1949, running those screens required data and tools that most investors did not have access to, or the endurance to run. All of the data came from poring over annual reports, often using very different accounting standards, the ratios had to be computed with slide rules or on paper, and the sorting of companies was done by hand. Even into the 1980s, access to data and powerful analytical tools was restricted to professional money managers and thus remained a competitive advantage. As data has become easier to get, accounting more standardized and analytical tools more accessible, there is very little competitive advantage to computing ratios (PE, PBV, debt ratio etc.) from financial statements and running screens to find cheap stocks. Prescription: To find a competitive edge, value investors have to become creative in finding new screens that are either qualitative or go beyond the financial statements or in finding new ways of processing publicly accessible data to find undervalued stocks. The global economy has changed!Diagnosis: At the risk of sounding cliched, the shift in economic power to more globalized companies, built on technology and immense user platforms, has made many old time value investing nostrums useless. Prescription: Value investing has to adapt to the new economy, with less of a balance sheet focus and more flexibility in how you assess value. Put simply, investors may have to leave their preferred habitat (mature companies with physical assets bases) in the corporate life cycle to find value.From listening to value investors across the spectrum, there does not seem to be a consensus yet on what ails it, but the evolution in thinking has been clear. As the years of under performance have stretched on, there are fewer value investors who believe that this is a passing phase and that all that is needed is patience. There are many value investors who still blame the Fed (and other central banks) for their underperformance, and while I agree with them that central banks have sometimes over reached and skewed markets, I also think that this belief has become a convenient excuse for not looking at the very real problems at the heart of value investing. Especially after the COVID experience, there are at least some value investors who are willing to consider the possibility that it is time to change the way we practice value investing. In my next post, I will look at some of these changes.YouTube Video
Blog Posts on Value Investing (2020)Value Investing I: The Glory DaysValue Investing II: A Lost DecadeValue Investing III: Rebirth, Reincarnation or Requiem?
Value Investing I: The Back Story
One of the classes that I teach is on investment philosophies, where I begin by describing an investment philosophy as a set of beliefs about how markets work (and sometimes don't) which lead to investment strategies designed to take advantage of market mistakes. Unlike some, I don't believe that there is a single "best" philosophy, since the best investment philosophy for you is the one that best fits you as a person. It is for that reason that I try to keep my personal biases and choices out, perhaps imperfectly, of the investment philosophies, and use the class to describe the spectrum of investment philosophies that investors have used, and some have succeeded with, over time. I start with technical analysis and charting, move on to value investing, then on to growth investing, and end with information trading and arbitrage. The most common pushback that I get is from old-time value investors, arguing that there is no debate, since value investing is the only guaranteed way of winning over the long term. Embedded in this statement are a multitude of questions that deserve to be answered:
What is value investing and what do you need to do to be called a value investor?Where does this certitude that value investing is the "winningest" philosophy come from? Is it deserved?How long is the long term, and why is it guaranteed that value investing wins?I will argue over the course of the next few posts that the answers to these questions are not only more nuanced than many true believers posit them to be, but also that changes in economies and markets are undercutting key components of the value investing case. In this post, I will focus on defining value investing and on the roots of its allure.What is value investing?
Given how widely data services tracking mutual funds and active investing seem to be able classify funds and investors into groupings. how quickly prognosticators are able to pass judgment on value investing's successes and failures and how much academics have been able to write about and opine on value investing in the last few decades, you would think that there is consensus now on what comprises value investing, and how to define it. But you would be wrong! The definition of value investing varies widely even among value investors, and the differences are not often deep and difficult to bridge.
In this section, I will start by providing three variants on value investing that I have seen used in practice, and then go on to explore a way to find commonalities.
Lazy Value Investing: Let's start with the easiest and most simplistic definition, and the one that many data services and academics continue to use, simply because it is quantifiable and convenient, and that is to base whether you are a value or growth investor on whether the stocks you buy trade at low or high multiples of earnings or book value. Put simply, if you consistently invest in stocks that trade at low PE and low price to book ratios, you are a value investor, and if you do not, you are not one. Cerebral Value Investing: If you use the lazy definition of value investing as just buying low PE and low PBV stocks with a group of Omaha-bound value investors, you will get pushback from them. They will point to value investing writing, starting with Graham and buffered by Buffett's annual letters to shareholders, that good value investing starts by looking at cheapness (PE and PBV) but also includes other criteria such as good management, solid moats or competitive advantages and other qualitative factors. Big Data Value Investing: Closely related to cerebral value investing in philosophy, but differing in its roots is a third and more recent branch of value investing, where investors start with the conventional measures of cheapness (low PE and low PBV) but also look for additional criteria that has separated good investments from bad ones. Those criteria are found by poring over the data and looking at historical returns, a path made more accessible by access to huge databases and powerful statistical tools.In my book on value investing, I take a different twist to value investing, arguing that value investors can be broadly classified into four groups, depending on how they approach finding bargains:Passive Value Investing: In passive value investing, you screen for the best stocks using criteria that you believe will improve your odds. Once you buy these stocks, you are asked to be patient, and in some cases, to just buy and hold, and that your patience will pay off as higher returns and a more solid portfolio. To see this approach play out, at least in the early days of value investing, take a look at these screens for good stocks that Ben Graham listed out in 1939 in his classic book on the intelligent investor. These screens have evolved in the years since, in two ways. The first is with the introduction of more qualitative screens, like "good" management, where notwithstanding attempts to measure goodness, there will be disagreements. The second is to use increased access to data, both from the company and about it, to both test existing screens and to add to them. Contrarian Value Investing: In contrarian value investing, you focus your investing energies on companies that have seen steep drops in stock prices, with the belief that markets tend to overreact to news, and that corrections will occur, to deliver higher returns, across the portfolio. Within this approach, access to data has allowed for refinements that, at least on paper, deliver higher and more sustained returns. Activist Value Investing: In activist value investing, you target companies that are not only cheap but badly run, and then expend resources (and you need a considerable amount of those) to push for change, either in management practices or in personnel. The payoff to activist value investing comes from activist investors being the catalysts for both price change in the near term, as markets react to their appearance, and to changes in how the company is run, in the long term.Minimalist Value Investing: There is a fourth approach to value investing that perhaps belongs more within passive investing, but for the moment, I will set it apart. In the last decade or two, we have seen the rise of titled index funds and ETFs, where you start with an index fund or ETF, and tilt the fund/ETF by overweighting value stocks (high PE/PBV, for instance) and underweighting non-value stocks.At this stage, if you are completely confused about what a value investor is, I don't blame you, but there is a more general approach to framing value investing that encompasses all these approaches, and allows you to differentiate it from its most direct competitor, which is growth investing. That approach draws on a structure that I have used repeatedly in my writing and teaching, which is the use of a financial (as opposed to an accounting) balance sheet to describe companies: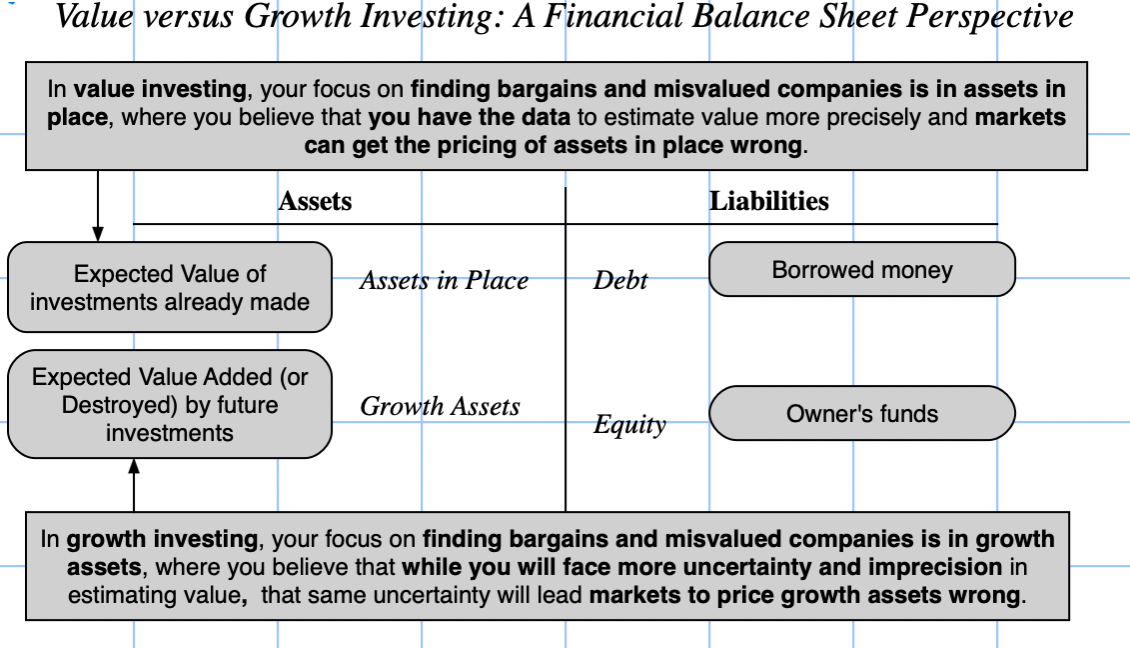
Put simply, the contrast between value and growth investing is not that one cares about value and the other does not, but in what part of the company the "value error" lies. Value investors believe that their tools and data are better suited to finding mistakes in valuing assets in place, and that belief leads them to focus in on more mature companies, that derive the bulk of their value from existing investments. Growth investors, on the other hand, accept that valuing growth is more difficult and more imprecise, but argue that it is precisely because of these difficulties that growth assets are more likely to be mis-valued.
Is value investing the winningest philosophy?
While it is not uncommon for investors of all stripes to express confidence that their approach to investing is the best one, it is my experience that value investors express not just confidence, but an almost unquestioning belief, that their approach to investing will win in the end. To see where this confidence comes from, it is worth tracing out the history of value investing over the last century, where two strands, one grounded in stories and practice and the other in numbers and academic, connected to give it a strength that no other philosophy can match.
The Story Strand
When stock markets were in their infancy, investors faced two problems. The first was that there were almost no information disclosure requirements, and investors had to work with whatever information they had on companies, or on rumors and stories. The second was that investors, more using to pricing bonds than stocks, drew on bond pricing methods to evaluate stocks, giving rise to the practice of paying dividends (as replacements for coupons). That is not to suggest that there were not investors who were ahead of the game, and the first stories about value investing come out of the damage of the Great Depression, where a few investors like Bernard Baruch found a way to preserve and even grow their wealth. However, it was Ben Graham, a young associate of Baruch, who laid the foundations for modern value investing, by formalizing his approach to buying stocks and investing in 1934 in Security Analysis, a book that reflected his definition of an investment as "one which thorough analysis, promises safety of principal and adequate return". In 1938, John Burr Williams wrote The Theory of Investment Value, introducing the notion of present value and discounted cash flow valuation. Graham's subsequent book, The Intelligent Investor, where he elaborated his more developed philosophy of value investing and developed a list of screens, built around observable values, for finding under valued stocks.
While Graham was a successful investor, putting many of his writings into practice, I would argue that Graham's greater contribution to value investing came as a teacher at Columbia University. While many of his students have acquired legendary status, one of them, Warren Buffett has come to embody value investing. Buffett started an investment partnership, which he dissolved (famously) in 1969, arguing that given a choice between bending his investment philosophy and finding investments and not investing, he would choose the latter. These words, in his final letter to partners in May 1969, more than any others have cemented his status in value investing: "I just don't see anything available that gives any reasonable hope of delivering such a good year and I have no desire to grope around, hoping to "get lucky" with other people's money. He did allow his partners a chance to receive shares in a struggling textile maker, Berkshire Hathaway, and the rest, as they say, is history, as Berkshire Hathaway morphed into an insurance company, with an embedded closed end mutual fund, investing in both public and some private businesses, run by Buffett. While Buffett has been generous in his praise for Graham, his approach to value investing has been different, insofar as he has been more willing to bring in qualitative factors (management quality, competitive advantages) and to be more active (taking a role in how the companies he has invested in are run) than Graham was. If you had invested in Berkshire Hathaway in 1965 or soon after, and had continued to hold through today, you would be incredibly wealthy:
 Source: Berkshire Annual Report for 2019 (with a Sept 2020 update)
The numbers speak for themselves and you don't need measures of statistical significance to conclude that these are not just unusually good, but cannot be explained away as luck or chance. Not only did Berkshire Hathaway deliver a compounded annual return that was double that of the S&P 500, it did so with consistency, outperforming the index in 37 out of 55 years. It is true that the returns have looked a lot more ordinary in the last two decades, and we will come back to examine those years in the next post.
Along the way, Buffett has proved to be an extraordinary spokesperson for value investing, not only by delivering mind-blowing returns, but also because of his capacity to explain value investing in homespun, catchy letters to shareholders each year. In 1978, he was joined by Charlie Munger, whose aphorisms about investing have been just as effective at getting investor attention, and were captured well in this book. There have been others who have worn the value investing mantle successfully, and I don't mean to discount them, but it is difficult to overstate how much of value investing as we know it has been built around Graham and Buffett. The Buffett legend has been burnished not just with flourishes like the 1969 partnership letter but by the stories of the companies that he picked along the way. Even novice value investors will have heard the story of Buffett's investment in American Express in 1963, after its stock price collapsed following a disastrous loan to scandalous salad oil company, and quickly doubled his investment.
The Numbers Strand
If all that value investing had for it were the stories of great value investors and their exploits, it would not have the punch that it does today, without the help of a numbers strand, ironically delivered by the very academics that value investors hold in low esteem. To understand this contribution, we need to go back to the 1960s, when finance as we know it, developed as a discipline, built around strong beliefs that markets are, for the most part, efficient. In fact, the capital asset pricing model, despised by value investors, also was developed in 1964, and for much of the next 15 years, financial researchers worked hard trying to test the model. To their disappointment, the model not only revealed clear weaknesses, but it consistently misestimated returns for classes of stock. In 1981, Rolf Banz published a paper, showing that smaller companies (in terms of market capitalization) delivered much higher returns, after adjusting for risk with the CAPM, than larger companies. Over the rest of the 1980s, researchers continued to find other company characteristics that seemed to be systematically related to "excess" returns, even though theory suggested that they should not. (It is interesting that in the early days, these systematic irregularities were called anomalies and non inefficiencies, suggesting that it was not markets that were mispricing these stocks but researchers who were erroneously measuring risk.)
In 1992, Fama and French pulled all of these company characteristics together in a study, where they reversed the research order. Rather than ask whether betas, company size or profitability were affecting returns, they started with the returns on stocks and backed into the characteristics that were strongest in explaining differences across companies. Their conclusion was that two variables, market capitalization (size) and book to market ratios explained the bulk of the variation in stock returns from 1963 to 1990, and that the other variables were either subsumed by these or played only a marginal role in explaining differences. For value investors, long attuned to book value as a key metric, this research was vindication of decades of work. In fact, the relationship between returns over time and price to book ratios still takes pride of place in any sales pitch for value investing, and Ken French has been kind enough to keep updating and making accessible the data on the Fama-French factors, allowing me to provide you with an updated version of the link between returns and price to book ratios:
 Source: Ken French
That study has not only been replicated multiple times with US stocks, and there is evidence that if you back in time, low price to book stocks earn premium returns in much of the rest of the world. Dimson, Marsh and Staunton, in their comprehensive and readable annual update on global market returns, note that the value premium (the premium earned by low price to book stocks, relative to the market) has been positive in 16 of the 24 countries that they have returns for more than a century and amounted to an annual excess return of 1.8%, on a global basis.
While value investors are quick to point to these academic studies as backing for value investing, they are slower to acknowledge the fact that among researchers, there is a clear bifurcation in what they see as the reasons for these value premium:
It is a proxy for missed risk: In their 1992 paper, Fama and French argued that companies that trade at low price to book ratios are more likely to be distressed and that our risk and return models were not doing an adequate job of capturing that risk. They and others who have advanced the same type of argument would argue that rather than be a stamp of approval for value investing, these studies indicate risks that may not show up in near term returns or in traditional risk and return models, but eventually will manifest themselves and cleanse the excess returns. Put simply, in their world, value investors will look like they are beating the market, until these unseen risks show up and mark down their portfolios.It is a sign of market inefficiency: During the 1980s, as behavioral finance became more popular, academics also became more willing to accept and even welcome the notion that markets make systematic mistakes and that investors less susceptible to these behavioral quirks could take advantage of these mistakes. For these researchers, the findings that low price to book stocks were being priced to earn higher returns gave rise to theories of how investor irrationalities could explain these returns. It is the latter group that reinforces the opinion that value investors have that they are better than the rest of the market and that the excess returns that they earned were a reward for their patience and careful research. i.e., being the grown-ups in a world filled with juvenile and impulsive traders.The End Result
When valuing companies, I talk about how value is a bridge between stories and numbers, and how the very best and most valuable companies represent an uncommon mix of strong stories backed up by strong numbers. In the realm of investment philosophies, value investing has had that unique mix work in its favor, with stories of value investors and their winning stocks backed up by numbers on how well value investing does, relative to other philosophies. It is therefore no surprise that many investors, when asked to describe their investment philosophies, describe themselves as value investors, not just because of its winning track record, but also because of its intellectual and academic backing.
YouTube Videos
September 21, 2020
Sounding good or Doing good? A Skeptical Look at ESG
In my time in corporate finance and valuation, I have seen many "new and revolutionary" ideas emerge, each one marketed as the solution to all of the problems that businesses face. Most of the time, these ideas start by repackaging an existing concept or measure and adding a couple of proprietary tweaks that are less improvement and more noise, then get acronyms, before being sold relentlessly. With each one, the magic fades once the limitations come to the surface, as they inevitably do, but not before consultants and bankers have been enriched. So, forgive me for being a cynic when it comes to the latest entrant in this game, where ESG (Environmental, Social and Governance), a measure of the environment and social impact of companies, has become one of the fastest growing movements in business and investing, and this time, the sales pitch is wider and deeper. Companies that improve their social goodness standing will not only become more profitable and valuable over time, we are told, but they will also advance society's best interests, thus resolving one of the fundamental conflicts of private enterprise, while also enriching investors. This week, the ESG debate has come back to take main stage, for three reasons.
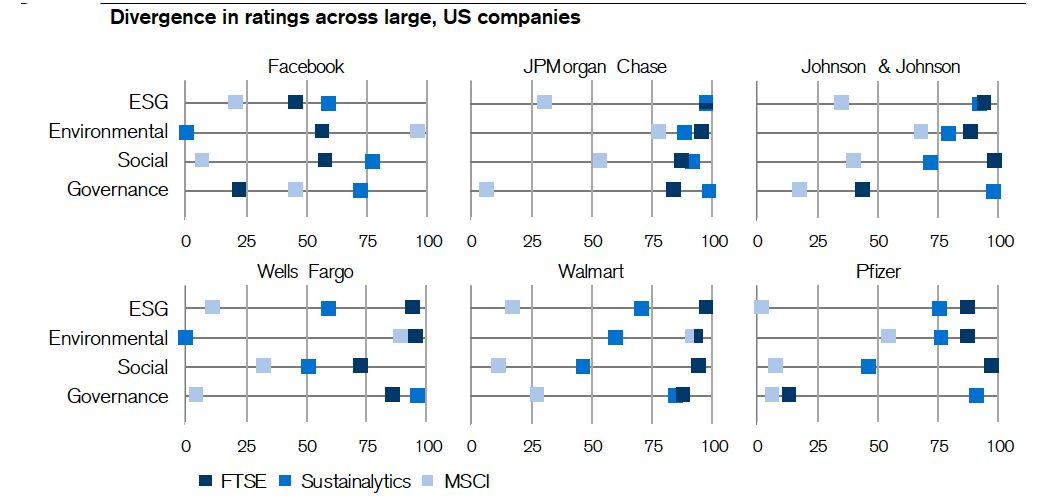
It is the fiftieth anniversary of one of the most influential opinion pieces in media history , where Milton Friedman argued that the focus of a company should be profitability, not social good. There have been many retrospectives published in the last week, with the primary intent of showing how far the business world has moved away from Friedman's views. There were multiple news stories about how "good" companies, with goodness measured on the social scale, have done better during the COVID crisis, and how much money was flowing into ESG funds, with some suggesting that the crisis could be a tipping point for companies and investors, who were on the fence about the added benefits of being socially conscious. In a more long standing story line, the establishment seems to have bought into ESG consciousness, with business leaders in the Conference Board signing on to a "stakeholder interest" statement last year and institutional investors shifting more money into ESG funds.In the interests of openness, I took issue with the Conference Board last year on stakeholder interests, and I start from a position of skepticism, when presented with "new" ways of business thinking. If the debate about ESG had been about facts, data and common sense, and ESG had won, I would gladly incorporate that thinking into my views on corporate finance, investing and valuation. But that has not been the case, at least so far, simply because ESG has been posited by its advocates as good, and any dissent from the party line on ESG (that it is good for companies, investors and society) is viewed as a sign of moral deficiency. At the risk of sounding being labeled a troglodyte (I kind of like that label), I will argue that many fundamental questions about ESG have remained unanswered or have been answered sloppily, and that it is in its proponents' best interests to stop overplaying the morality card, and to have an honest discussion about whether ESG is a net good for companies, investors and society.Measures of Goodness We have spent decades measuring financial performance and output at companies, either at the operating level, as revenues, profits or capital invested, or at the investor level, as market cap and returns. Any attempts to measure environment and social goodness face two challenges. The first is that much of social impact is qualitative, and developing a numerical value for that impact is difficult to do. The second is even trickier, which is that there is little consensus on what social impacts to measure, and the weights to assign to them. If your counter is that there are multiple services now that measure ESG at companies, you are right, but the lack of clarity and consensus results in the companies being ranked very differently by different services. This shows up in low correlations across the ESG services on ESG scores, as indicated by this study:
 Correlations across six ESG data providers
This low correlation often occurs even on high profile companies, as shown in a comprehensive analysis of ESG investing by Dimson, Marsh and Staunton, as part of their global investment returns update:
 Source:
CS Global Investment Returns Yearbook 2020, Dimson, Marsh and Staunton
Source:
CS Global Investment Returns Yearbook 2020, Dimson, Marsh and Staunton
Note the divergence in both the overall ratings and on the individual metrics (E, S and G) across the services, even for widely tracked companies like Facebook and Walmart. There are some who believe that this reflects a measurement process that is still evolving, and that as companies provide more disclosure on ESG data and ESG measurement services mature, there will be consensus. I don't believe it! After all, what I find to be good or bad in a company will reflect my personal values and morality scales, and the choices I make will be different from your choices, and any notion that there will be consensus on these measures is a pipe dream.
Even if you overlook disagreements on ESG as growing pains, there is one more component that adds noise to the mix and that is the direction of causality: Do companies perform better because they are socially conscious (good) companies, or do companies that are doing well find it easier to do good? Put simply, if ESG metrics are based upon actions/measures that companies that are doing better, either operationally and/or in markets, can perform/deliver more easily than companies that are doing badly, researchers will find that ESG and performance move together, but it is not ESG that is causing good performance, but good performance which is allowing companies to be socially good.
The ESG Sales Pitch - Promises and ContradictionsThe power of the ESG sales pitch has always been that it offers something good to everyone involved, from companies adopting its practices, to investors in those companies, and more broadly, to all of society. For companies, the promise is that being "good" will generate higher profits for the company, at least in the long term, with lower risk, and thus make them more valuable businesses.For investors in these companies, the promise is that investing in "good" companies will generate higher returns than investing in "bad" or middling companies. For society, the promise is that not only will good companies help fight problems directly related to ESG, like climate change and low wages, but also counter more general problems like income inequality and uneven healthcare.Given that ESG has been marketed as all things good, to all people, it is no surprise that its usage has soared, with companies signing on in droves to social compacts, and investors pouring hundreds of billions of dollars into ESG funds and investments. In the process, though, its advocates have either glossed over, or mixed up, three separate questions that need to be answered, on ESG:

The reason it is useful to separate the three questions is that it opens up possibilities that are often missed in both debate and research. For instance, it is possible that ESG does nothing for value, but that it offers a sheen to companies that allows them to be priced more highly than their less socially conscious counterparts and enriches investors, who trade on its basis. Alternatively, it is also possible that ESG does increase value, but that markets adjust quickly to this and that investors do not benefit from investing in ESG stocks. It also illustrates the danger of overreach from ESG research. Much of the research on ESG is compartmentalized, where only one of these questions is addressed, but the researchers seem to use the results to draw conclusions about answers the other two. Thus, a research study that finds that investors make higher returns on companies that rank high on ESG often will go on to posit that this must mean that ESG increases value, a leap that is neither justified nor warranted.
ESG and ValueThe framework for answering the question of whether ESG affects value is no different from the framework for assessing whether acquisitions or financing or any other action affects value. It is both simple and universal, and I have captured the drivers of value for any business in the picture below:
 Figure 1: The Drivers of Value
In fact, my favorite propositions in value is the "It Proposition", which posits that for "it" (investing, financing, dividends, ESG) to affect value, "it" has to affect either the cash flows (through revenue growth, operating margins and investment efficiency) or the risk in those cash flows (which plays out in the cost of equity and capital).
Goodness will be rewardedApplying this proposition to ESG, the most direct way to induce companies to behave in a socially responsible manner is to make it in their financial best interests to do so. There is a plausible scenario, where being good creates a cycle of positive outcomes, which makes the company more valuable. Figure 2 describes this virtuous cycle:
 In this story, being good benefits the company on multiple dimensions. Customers, attracted by the company's social mission, are more likely to buy its products and pay higher prices, increasing both growth and margins. The company is able to attract more loyal employees and suppliers, and build a model for investing that leads to more payoff from investments, i.e., more efficient growth. On the risk front, the company benefits from investors who are willing to pay premium prices for their shares (thus lowering cost of equity), and lending that comes with lower rates and fewer covenants. Finally, by operating as a good corporate citizen, the company minimizes the chance of a scandal or a catastrophic event that could put its business model at risk. In the language of ESG, it creates a more “sustainable business”. For proponents of corporate social responsibility, this is the best-case setting for their cause, because being good and doing well financially converge. This scenario holds, though, only because customers, employees, investors, and lenders all put their money where their convictions lie, and are willing to make sacrifices along the way, and it is more likely in some companies/businesses than others:Smaller, rather than larger: While it is not impossible for a large company to hit all the high notes in the virtuous cycle, it is far easier for a small company than a large one, because even a small subset of all investors (consumers) can provide the capital (revenues) at the favorable terms needed for this scenario to unfold. Niche business, with a more socially conscious customer base: Adding to the smallness theme, it is easier for a company that serves a small customer base to attract customers with its ‘good company’ mantle than a company that seeks to reach a mass market. A company like Patagonia, with revenues of $750 million, can more easily make the compromises to stay socially responsible than a company like Nike, with revenues of $34 billion, which will be forced to make compromises that will undercut its goodness.A privately held company or a public company with an investor base that values corporate goodness and prices it in: Being a private company can help, especially if the payoff to corporate goodness is long term, another point working in Patagonia’s favor. A public company that is closely held or controlled by its founders can also make choices that may not be feasible for a widely held company with a vocal stockholder base. It is worth noting that the companies that tend to be most vociferous about their social consciences tend to meet these criteria, at least early in their corporate lives. However, they will face a challenge, if they are successful and want to grow, because growth will bring in customers and investors not so committed to ESG. The acid test of social consciousness occurs when a company scales up and must decide whether to continue to grow or accept a lower ceiling on growth, and perhaps lower value, in order to preserve it good company status.
Badness will be punishedThere is an alternate story that can be used to argue that companies should try to be socially responsible, but it is a more punitive one, where it is not good companies that get rewarded, but bad ones that get punished. This less upbeat scenario is described below:

Here, the punishment for bad companies is meted out from every direction, with customers refusing to buy their products, even if they are lower priced. These companies face higher operating expenses (and lower margins) in the long term, as they have trouble holding on to employees and finding suppliers. Equity investors avoid buying their shares, leading to higher costs of equity, and lenders are leery about lending money to these companies, leading to higher costs of debt. Finally, these companies risk exposure to grievous, or even catastrophic events, arising from operating with too little consideration of societal costs. It is often these events, such as the Union Carbide gas leak in Bhopal, Vale’s dam bursting in Bhopal and BP’s oil spill in the Gulf of Mexico, that highlight shortcomings and create long term problems for the company.
The Bad Guys win!With regard to promoting social responsibility, the "bad behavior gets punished" scenario is not as good as the virtuous cycle, because it will tend to scare companies away from being “bad”, rather than induce them to be “good", but it is still better than a third and potentially devastating scenario for ESG advocates, where bad companies are rewarded for being bad, and become more valuable than good ones:
 In this scenario, bad companies mouth platitudes about social responsibility and environmental consciousness without taking any real action, but customers buy their products and services, either because they are cheaper or because of convenience, employees continue to work for them because they can earn more at these companies or have no options, and investors buy their shares because they deliver higher profits. As a result, bad companies may score low on corporate responsibility scales, but they will score high on profitability and stock price performance.
 The EvidenceThe question of which of these three scenarios is the right one is not one that can be settled by logic or with anecdotal evidence, but with data. For more than two decades now, researchers have examined the link, with the following conclusions:A Weak Link to Profitability: There are meta studies (summaries of all other studies) that summarize hundreds of ESG research papers, and find a small positive link between ESG and profitability, but one that is very sensitive to how profits are measured and over what period, leading one of these studies to conclude that “citizens looking for solutions from any quarter to cure society’s pressing ills ought not appeal to financial returns alone to mobilize corporate involvement”. Breaking down ESG into its component parts, some studies find that environment (E) offered the strongest positive link to performance and social (S) the weakest, with governance (G) falling in the middle. A Stronger Link to Funding Costs: Studies of “sin” stocks, i.e., companies involved in businesses such as producing alcohol, tobacco, and gaming, find that these stocks are less commonly held by institutions, and that they face higher costs for funding, from equity and debt). The evidence for this is strongest in sectors like tobacco (starting in the 1990s) and fossil fuels (especially in the last decade), but these findings come with a troubling catch. While these companies face higher costs, and have lower value, investors in these companies will generate higher returns from holding these stocks.And a link to Failure/Disaster Risk: An alternate reason why companies would want to be “good” is that “bad” companies are exposed to disaster risks, where a combination of missteps by the company, luck, and a failure to build in enough protective controls (because they cost too much) can cause a disaster, either in human or financial terms. That disaster can not only cause substantial losses for the company, but the collateral reputation damage created can have long term consequences. One study created a value-weighted portfolio of controversial firms that had a history of violating ESG rules, and reported negative excess returns of 3.5% on this portfolio, even after controlling for risk, industry, and company characteristics. The conclusion in this study was that these lower excess returns are evidence that being socially irresponsible is costly for firms, and that markets do not fully incorporate the consequences of bad corporate behavior. The push back from skeptics is that not all firms that behave badly get embroiled in controversy, and it is possible that looking at just firms that are controversial creates a selection bias that explains the negative returns.In summary, based upon the studies so far, the strongest evidence in support of ESG seems to be that "bad" companies face higher funding costs (from debt and equity), whereas the evidence on ESG paying off as higher profits and growth is elusive. There is some evidence supporting the proposition that being socially responsible (or at least not being socially irresponsible) can protect companies from damaging disasters, but selection bias is a problem.
ESG and ReturnsTo begin with, the notion that adding an ESG constraint to investing increases expected returns is counter intuitive. After all, a constrained optimum can, at best, match an unconstrained one, and most of the time, the constraint will create a cost. In one of the few cases where honesty seems to have prevailed over platitudes, the TIAA-CREF Social Choice Equity Fund explicitly acknowledges this cost and uses it to explain its underperformance, stating that “The CREF Social Choice Account returned 13.88 percent for the year [2017] compared with the 14.34 percent return of its composite benchmark … Because of its ESG criteria, the Account did not invest in a number of stocks and bonds ... the net effect was that the Account underperformed its benchmark.” In fact, there is an inherent contradiction, at least on the surface, between the argument that ESG leads to higher value and stock prices, made to CEOs and CFOs of companies, and a simultaneous argument that investors in ESG stocks will earn higher (positive excess) returns, by investing in these companies.
Value, Price and Returns: The InterplayWhatever your beliefs may be on whether ESG increases or decreases value, you have to start with a fresh slate, and incorporate market behavior, to make judgments on whether investors will benefit from ESG investing, as can be seen in the table below:
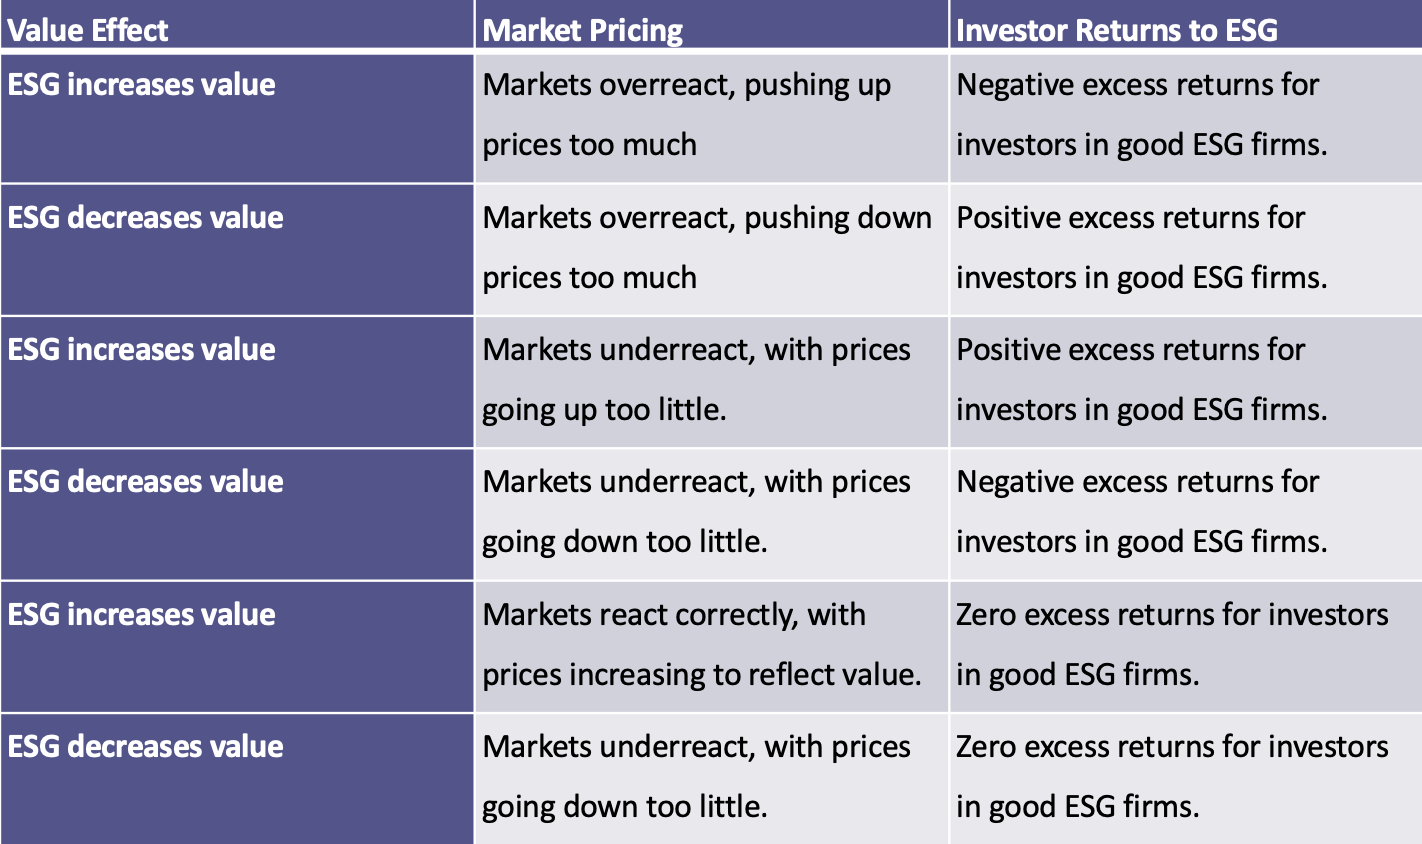
Consider the first outcome, where ESG increases the value of a company, but markets overreact to the goodness of the company, pushing up the price too much: investors in good companies will earn lower returns (negative excess) returns over the long term. Flipped around, this table also yields the counter intuitive result that studies that conclude that ESG investing earns positive (or negative) returns tell us nothing or very little about the underlying benefits of ESG, since the market acts as the intervening variable.
The Evidence on ESG and ReturnsIt should come as no surprise then, that the research on the link between ESG and investor returns comes to split results:Invest in bad companies: There are the studies that we referenced earlier as backing for good firms having lower discount rates, including the ones that showed that sin stocks deliver higher returns than socially conscious companies. A comparison of two Vanguard Index funds, the Vice fund (invested in tobacco, gambling, and defense companies) and the FTSE Social Index fund (invested in companies screened for good corporate behavior on multiple dimensions) and note that a dollar invested in the former in August 2002 would have been worth almost 20% more by 2015 than a dollar invested in the latter.Invest in good companies: At the other end of the spectrum, there are studies that seem to indicate that there are positive excess returns to investing in good companies. A study showed that stocks in the Anno Domini Index (of socially conscious companies) outperformed the market, but that the outperformance was more due to factor and industry tilts than to social responsiveness. In a different study, researchers looked at the payoff to socially responsible investing by comparing the returns on two portfolios, created based upon eco-efficiency scores, and concluded that companies that are more eco-efficient generate higher returns. Some of the strongest links between returns and ESG come from the governance portion, which, as we noted earlier, is ironic, because the essence of governance, at least as measured in most of these studies, is fealty to shareholder rights, which is at odds with the current ESG framework that pushes for a stakeholder perspective. ESG has no effect: Splitting the difference, there are other studies that find little or no differences in returns between good and bad companies. A Morningstar Quantitative study of ESG stocks in 2020 found that companies that scored high on ESG generated mildly lower returns than companies that scored poorly, though the difference was statistically insignificant. In fact, studies that more broadly look at factors that have driven stock returns for the last few decades find that much of the positive payoff attributed to ESG comes from its correlation with momentum and growth.In steady state, it is internally inconsistent to argue that good companies will benefit from lower funding costs (lower costs of equity) and that investors can also earn higher returns at the same time.
Glimmers of Hope for ESG InvestingThere are two possible scenarios where being good may benefit both the company (by increasing its value) and investors in the company (by delivering higher returns).Transition Period Payoff: The first scenario requires an adjustment period, where being good increases value, but investors are slow to price in this reality. During the adjustment period the highly rated ESG stocks will outperform the low ESG stocks, as markets slowly incorporate ESG effects, but that is a one-time adjustment. Once prices reach equilibrium, highly rated ESG stocks will have greater values, but investors will have to be satisfied with lower expected returns. The presence of a transition period, where markets learn about ESG and price them in can also explain why there may be a payoff to more disclosure and transparency on social and environmental issues, by speeding the adjustment. It is perhaps this hope of transition period excess returns that that has driven some institutional investors to become more activist on ESG issues and can explain why some have been able to show excess returns from increasing (reducing) their holdings in good (bad) companies. It is not just the large players like Blackrock and Vanguard that have jumped on this bandwagon, but also pure return-focused investors like Elliott Management and Third Point which recently targeted utility companies about their excessive carbon footprints. Their activism goes well beyond jawboning management and includes efforts that range from stopping mergers to proxy fights to altering boards of directors. This study examined 613 public firms that were targeted by an activist institutional investor focused on improving ESG practices and found positive excess returns in the 18% of engagements where the activism succeeded. Limit Downside: The other scenario where incorporating ESG into investing may yield a payoff is when investors are concerned about limiting downside risk. To the extent that socially responsible companies are less likely to be caught up in controversy and to court disaster, the argument is that they will also have less downside risk than their counterparts who are less careful. There is some evidence of this in this paper that finds that companies that adopt better ESG practices are less likely to see large drops in value. If there is an investing lesson embedded here, it is the unsurprising one that investors who hope to benefit from ESG cannot do so by investing mechanically in companies that already identified as good (or bad), but have to adopt a more dynamic strategy built around either aspects of corporate social responsibility that are not easily measured and captured in scores, or from getting ahead of the market in recognizing aspects of corporate behavior that will hurt the company in the long term.
The COVID effectThe last few months have been a test of ESG investing, and while the consensus view seems to be that ESG has passed the test, it is worth separating the facts from what is debatable. Fund Flows (not debatable): It is not debatable that investors, whatever their reasons, have been investing more in ESG funds, both passively (through index funds) and actively (through ESG funds that contend that they can do better than the market). By early September 2020, impact investing index funds had risen to $250 billion in the US and more than a trillion dollars globally, with both numbers rising over the course of the COVID months.

Performance (debatable): The question of whether ESG funds have outperformed during the COVID crisis is more debatable. Early in the crisis, Blackrock asserted that sustainable investing had shown its value added, pointing to the fact that ESG indices were outperforming their market counterparts during the crisis months. The problem, though, is that Blackrock is not a neutral commenter on this issue, partly because Larry Fink has been a vocal salesman for ESG and partly because Blackrock has ESG products to sell. It is true that Morningstar seems to provide backing for this proposition, when they presented the results on ESG funds during the first half of 2020:
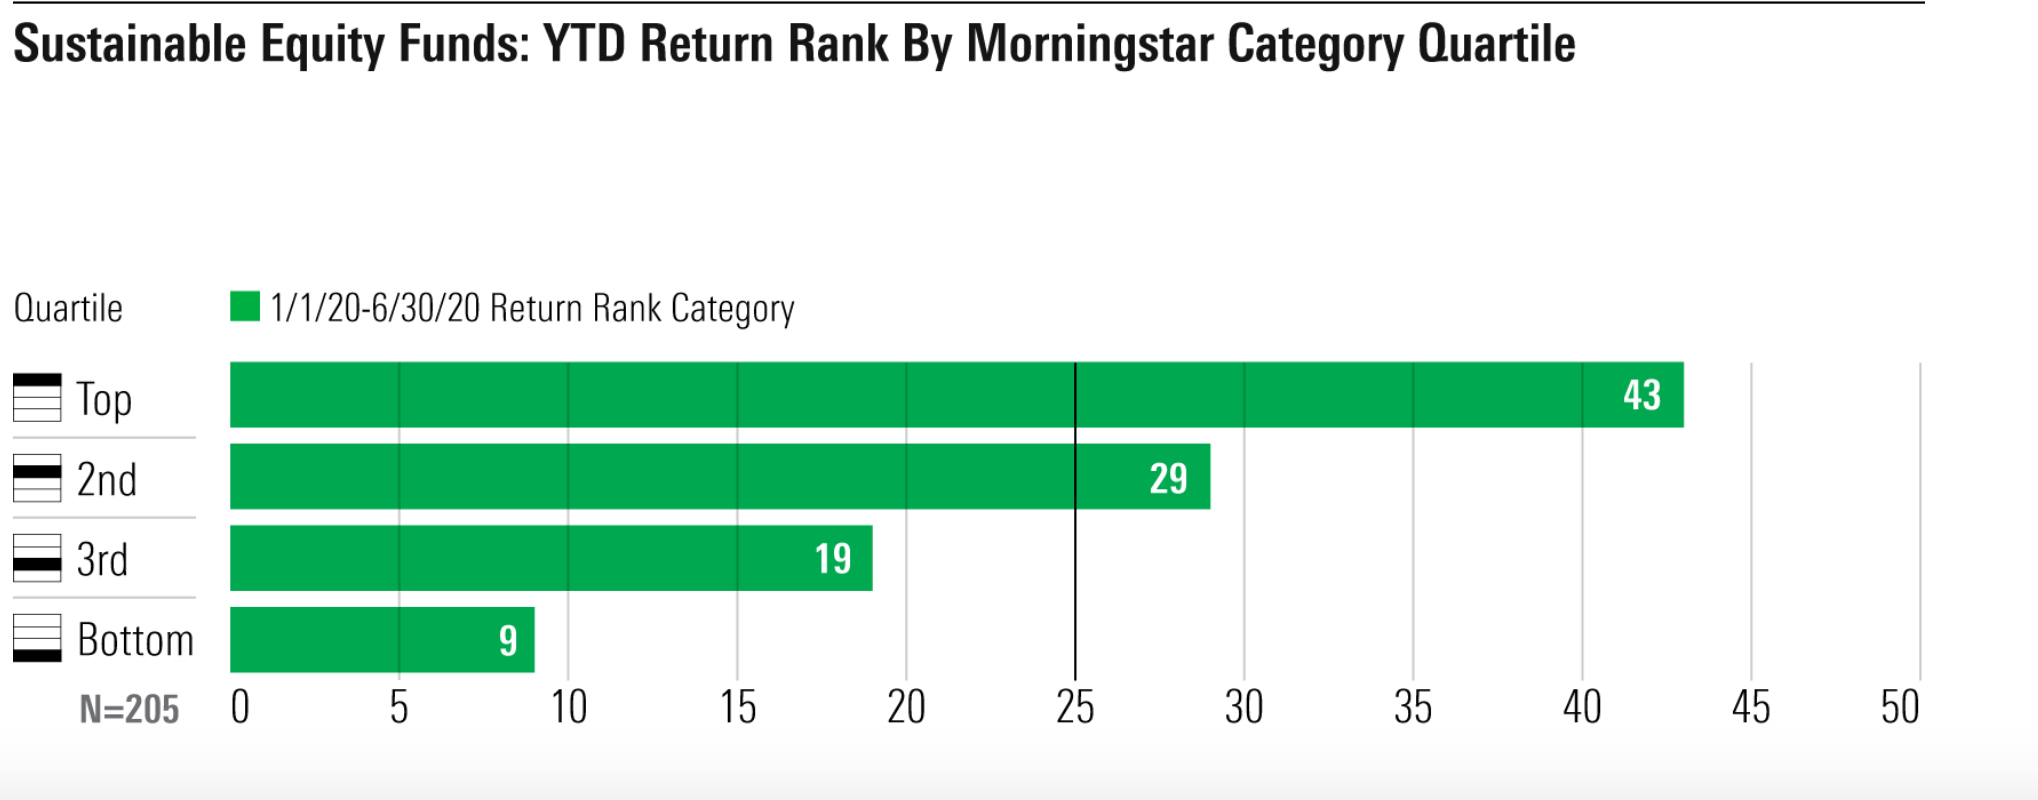
Morningstar noted that ESG funds in all 26 categories that they track outperformed their conventional index fund counterparts. The consensus view that ESG investing outperformed the market is now getting push back, with this paper arguing that once you control for the sector tilt of ESG funds (they tend to be more heavily invested in tech companies), ESG, by itself, provided no added payoff during the down period of the crisis (February and March 2020) and pushed returns down during the recovery phase.If success in active investing is defined as attracting investor money, ESG has had a successful run during COVID, but if it is defined as delivering returns, it is far too early to be doing victory dances in the end zone.
The Bottom LineIn many circles, ESG is being marketed as not only good for society, but good for companies and for investors. In my view, the hype regarding ESG has vastly outrun the reality of both what it is, and what it can deliver, and the buzzwords are not helpful. That is the reason I have tried to under use words like sustainability and resilience, two standouts in the ESG advocates lexicon, in writing this post. I believe that the potential to make money on ESG for consultants, bankers and investment managers has made at least some of them cheerleaders for the concept, with claims of the payoffs based on research that is ambiguous and inconclusive, if not outright inconsistent. The evidence as I see it is nuanced, and can be summarized as follows:There is a weak link between ESG and operating performance (growth and profitability), and while some firms benefit from being good, many do not. Telling firms that being socially responsible will deliver higher growth, profits and value is false advertising. The evidence is stronger that bad firms get punished, either with higher funding costs or with a greater incidence of disasters and shocks. ESG advocates are on much stronger ground telling companies not to be bad, than telling companies to be good. In short, expensive gestures by publicly traded companies to make themselves look “good” are futile, both in terms of improving performance and delivering returns.The evidence that investors can generate positive excess returns with ESG-focused investing is weak, and there is no evidence that active ESG investing does any better than passive ESG investing, echoing a finding in much of active investing literature. Even the most favorable evidence on ESG investing fails to solve the causation problem. Based on the evidence, it appears to me that just as likely that successful firms adopt the ESG mantle, as it is that adopting the ESG mantle makes firms successful.If there is a hopeful note for ESG investing, it is in the payoff to being early to the ESG game. Investors who are ahead of markets in assessing how corporate behavior, good or bad, will play out in performance or priced, will be able to earn excess returns, and if they can affect the change, by being activist, can benefit even more.Much of the ESG literature starts with an almost perfunctory dismissal of Milton Friedman’s thesis that companies should focus on delivering profits and value to their shareholders, rather than play the role of social policy makers. The more that I examine the arguments that advocates for ESG make for why companies should expand mission statements, and the evidence that they offer for the proposition, the more I am inclined to side with Friedman. After all, if ESG proponents are right, and being good makes companies more profitable and valuable, they are on the same page as Friedman. If, on the other hand, adopting ESG practices makes companies less valuable, the onus is on ESG’s proponents to show that societal benefits exceed that lost value.
The ESG bandwagon may be gathering speed and getting companies and investors on board, but when all is said and done, a lot of money will have been spent, a few people (consultants, ESG experts, ESG measurers) will have benefitted, but companies will not be any more socially responsible than they were before ESG entered the business lexicon. What is needed is an open, frank, and detailed dialogue concerning ESG-related corporate policies, with an acceptance that being good can add value at some companies and may destroy value at others, and that in the long term, investing in good companies can pay off during transition periods but will often translate into lower returns in the long term, rather than higher returns.
YouTube Video
Paper on ESG (with Brad Cornell)Valuing ESG: Sounding good or Doing good? (with Brad Cornell)My blog posts on stakeholder wealth maximizationFrom Shareholder Wealth to Stakeholder Wealth: CEO Capitulation or Empty Doublespeak? (August 2019)
September 1, 2020
Illusion, Perception and Reality: Stock Splits and Index Inclusions
After big market movements, we are eager to look for explanations, fundamental reasons why a stock or stocks collectively moved on that day, but the reality is that a great deal of the price movement on a day-to-day basis has nothing to do with earnings, cash flows or risk. On August 31, this reality was brought home by two events, neither with a strong connection to fundamentals, that represented the news of the day and contributed to price movements. The first was that two of the highest profile stocks in the market, Apple and Tesla, had stock splits that day (August 31), though the market had been trading on the expectation of these stock splits, for weeks leading into the day. On the same day, the Dow 30, a hopelessly flawed, but still among the most followed indices in the market, also announced a major reshuffling, replacing Exxon Mobil, Pfizer and Raytheon, three of its components, with Honeywell, Amgen and Salesforce. That gave rise to a wave of speculation about whether these new entrants would be helped or hurt by their inclusion in the index. While it is easy to dismiss stock splits and index inclusions as non-events, that dismissal is contradicted by market behavior, which, rational or not, seems to view them as consequential.
Value, Price and the Gap
I have long argued that value and price, while used interchangeably by many, are different concepts, driven by different forces, and lead to different numbers.
If you are an investor, no matter what your philosophy, this picture should not surprise you, since every philosophy is built around beliefs about the value and price processes.
A value-based investor, for instance, believes that value and price can diverge, often by large amounts and for long periods, but that the price will eventually converge on value, delivering profits to those with the patience to hold on to the investment. A trader, in contrast, has little interest in value and plays the pricing game, gauging momentum and mood shifts to make money, and using liquidity or the lack of it to magnify these gains. An efficient marketer may agree that the price and value processes can diverge, creating gaps, but also believes that investors are incapable of finding and taking advantage of the gaps.When an event occurs, whether precipitated by the company or an outside force, it can play out in one of three ways. A value event changes cash flows, alters expected growth and/or impacts the uncertainty/risk in these cash flows, and by doing so, change a company's value. A gap event does not change value, but is designed to get markets to notice mistakes that cause price to diverge from value, and to correct those mistakes, closing the gap. A pricing event is one designed to either alter mood and momentum or to change the liquidity characteristics of a company, causing price to change, even if that price change widens the gap with value. In the graph below, I have expanded the value and price distinction to include these events and the expected effects:
 Without examples, these are abstractions, but before I cite examples for each, I want to emphasize that there are very few events that have only one effect, and that most have a dominant effect (on value, price or the gap) with secondary effects on the others.Mostly value events: When a manufacturing company adds to its production capacity or a retailer opens new stores, the effects will almost entirely be on value. Since these actions are generally in the normal course of operations for these firms, they are unlikely to attract new market attention (which you need for gap events) or change market mood and momentum. Higher profile actions, though, almost always have spillover effects, and here are two examples. When Walmart recently announced its intent to partner with Microsoft to buy TikTok, there is clearly a value impact that this action will have, costing tens of billions in current cash flows, while promising to deliver higher growth and cash flows in the future. At the same time, though, this action, by attracting tech investors to buy Walmart, may alter momentum and have a secondary impact on pricing. When a California court ruled against ride sharing companies a few weeks ago, on the issue of drivers being employees rather than independent contractors, that decision had consequences for cost structure and value for Uber and Lyft, but it may have induced some investors to look at the gap between price and value at these companies.Mostly gap events: Gap events can be initiated either by the companies that are being mispriced (or at least perceive themselves to be mispriced) or by investors with the same perception. In academic finance, these events are termed signals, and while there is no guarantee that they will work, the motivation is to try to close the perceived gap between price and value. The cleanest example that I can offer for a gap event is a spin off or a split up, where a multi business company spins off one or more of its businesses or splits itself up, with no consequential changes in how it is run as a company, but with two objectives. One is that the action will expose the disconnect between the underlying fundamentals and the pricing, by providing more transparency on cash flows, growth and risk of individual businesses. The other is that the action will draw investor attention to the company, and that the attention can lead to a repricing of the stock. Not all gap events originate with the company. When activist investors target a company either as a buy or a short sale, they are attempting to provide the catalysts for the pricing gap to close, though their end games may involve changing the way the company is run, thus affecting cash flows, risk and value.Mostly pricing events: With mostly pricing events, the end game is altering mood and momentum or changing the liquidity in the stock, and by doing so, affecting the pricing of a stock. An emerging market company that lists its shares on a more liquid, developed market exchange, for instance, has clearly not altered its fundamentals through that action, but may benefit from higher liquidity pushing up price. There can be spillover effects from increased information disclosure, perhaps helping to close gaps between price and value, and perhaps even greater access to capital, allowing for a value effect.Finally, there are some events that can fall into any of the three buckets, depending upon who initiates the event and how the market views the initiator. Stock buybacks are perhaps the best example, since there are arguments you can make for buybacks to be value, gap or pricing events. If companies buy back stock, using borrowed money, the primary intent may be to change value by altering the financing mix and the overall cost of capital for the companies. In contrast, if companies buy back stock, but only if they perceive their shares to be under valued, the buyback becomes a gap event, focused on moving prices up to intrinsic value. Finally, if companies buy back stock to feed pricing momentum or to provide a floor to the price, buybacks are primarily pricing events. The question for today then becomes where stock splits and index inclusions fall in this spectrum of value, gap and pricing events.There is one final point that needs to be made about all these events. With each event, there are two dates of note. The first is the announcement date, when the market learns about the event, albeit it with some leakage to insiders ahead of the date. The second is the action date, when the event actually happens. Almost every effect that I described in this section should happen on or around the announcement date, and action dates are largely ceremonial. Put simply, if you believe that an acquisition, a spin off or a developed market listing is going to have an effect on price, the time to take investment action is at the time that it is announced, not when it happens.
Stock Splits
A stock split is a change in share count, without altering ownership shares. If you are an Apple stockholder, for instance, after Apple's four for one stock split on August 31, you would own four times as many shares as you did on August 30, but so would everyone else in the company.
The Evidence: In one of the earliest empirical studies in academic finance, Fama, Fisher, Jensen and Roll looked at the effects on stock splits on stock prices in 1969 and found (not surprisingly) that, on average, they happened after big stock price run-ups and that the splits themselves create no additional run-up, at least in the aggregate. However, when the sample was broken down into companies that subsequently increased and decreased dividends, they found that stock prices rose after splits for the former and dropped for the latter.
 Download paper
In the decades since, there have been dozens of studies and while they generally find that split announcements are accompanied by small stock price increases, they disagree on the reasons. Some argue that it is because of post-split changes in liquidity, some posit that it is because splits operate as signals and some claim that they change value.
Value Effect: I pride myself on being creative in coming up with value effects for almost any corporate action, but I must confess that I am floored with stock splits. It is a purely cosmetic action, and the analogy that I would offer is that a pizza, sliced into six pieces, will not taste better and nor will there be more of it, if it is sliced into twelve pieces. Neither Tesla nor Apple become more valuable companies, because of their stock splits, because nothing fundamental has changed in either company, as a consequence of the split. In short, if you thought Apple was overvalued on August 30, trading at $500/share, you would still find it overvalued trading at $125/share, after a four for one stock split, since both price and value will be a fourth of what they were the prior day.
Gap Effect: There is an argument to be made that stock splits can operate as gap events, especially if a company is lightly followed and little attention is being paid to it, leading it to be under valued. The split, while just cosmetic, can bring the company (at least briefly) into the news and that attention may be sufficient to causing the gap to close, by pushing the price towards value (which remains unchanged). This argument does not hold for Apple, the most highly valued company in the world, and Tesla, a company that clearly has never had a problem with attention seeking, but it could be used by a company like Marten Transport, which announced a 3 for 2 split on July 17, 2020, after seeing its stock price stagnate for a three year period.
Pricing: There are two components to a pricing argument for stock splits. The first is that stock splits, by altering price per share, can affect liquidity, which can change the price. Ironically, a stronger case can be made for this with reverse stock splits, where as a stock falls to low levels, say less than a dollar, folding in five or ten shares into a single share can reduce transactions costs. With high priced stocks, the argument that stock splits reduce transactions costs and increase liquidity had more resonance in the past when trading shares in less than round lots often cost substantially more than in odd numbers. In addition, an argument can be made that when share prices reach really high levels, some investors will be shut out of the stock, because they cannot afford to buy any shares in it, round lot or not. Here, a stock split, by bringing the price down to more affordable levels expands its investor base, and by doing so, its stock price. The second argument for stock splits being pricing events is that they feed momentum that is already prevalent in the stock, perhaps because of the perception that lower priced shares (even if there are more of them out there) just seem cheaper to investors. In effect, those investors (like me) who bought Apple at $75/share in 2017 and have seen it go up to $500, and are troubled by how much it has gone up in a short time period, will feel more comfortable when the stock price settles back in at around $125 after the stock split, because we compare this price (perhaps irrationally) to $75/share instead of $18.75/share. With Tesla and Apple, the fact that these splits are coming after a unprecedented run-up in both stocks suggests that the primary reason for the splits is pricing, and that it more momentum-feeding than liquidity-building. You will be able to test the latter, by tracking trading volume and bid-ask spreads on both stocks in the coming weeks, since a liquidity story should show up in higher trading volume and lower spreads (as a percent of the stock price).
Index Inclusion/Exclusion
We use stock market indices to track market movements, but we also attribute qualities to companies, based upon the indices that they are part off. Thus, a company that is part of the S&P 500 is considered to be safer and more secure, and with good reason, since market capitalization is one of the key factors that determine whether a company is part of the index. It is not the only reason, though, since based upon its market cap, Tesla should clearly be in the index, but it is not, because its cumulated profits over four consecutive quarters have never been positive, a requirement for index listing. In recent decades, another phenomenon has fed into the index game, and that is the growth in index funds and ETFS, tailored to mirror indices, often by buying shares in companies that are part of the index. When a company is added to an index, these passive investors will then buy its shares, altering both its stockholder base and the demand for its shares.
The Evidence: Not surprisingly, the evidence on index inclusion has been focused on the S&P 500, with studies examining how stock prices are impacted by a company's inclusion in or exclusion from the index. While there are dozens of papers, the findings can be broadly summarized as follows:
Positive or negative: The consensus view across studies is that a company that is added to the S&P 500 sees its stock price increase modestly, and that the increase is permanent, and that companies that are removed from the index see small drops in stock prices that persist. There are two caveats. The first is that this increase may be more a consequence of the circumstances that led to the the company being added on to the index than the index addition. This paper, for instance, looked at a matched sample, where companies added to the index were paired with companies with similar characteristics (high momentum, rising earnings etc.) that were not added to the index and concluded that there was no index addition effect. The second is that there seems to be some evidence that the index effect has become smaller over time, rather than larger, even as passive investing has become a larger part of the index.Volatility and variance: There is some evidence that a stocks that get added to the index see increased volatility, as institutions become bigger players, and move more with the index, for the obvious reason that they are now part of it.Value Effect: As with stock splits, it is difficult to make an argument that index inclusion or exclusion changes value, but there is a possible, albeit unlikely, path. When a company becomes part of a widely followed and tracked index like the S&P 500, its investor base will change to become more institutional and more passive. You can argue that these investors bring very different views on risk and preferences investing, capital structure and cash return than investors in the rest of the market. For instance, this study documents that companies that become part of the S&P 500 tend to behave more like their peer group on dividends and buybacks and become less profitable, after the index inclusion than before the inclusion, and these changes can affect value adversely.
Gap Effect: As far as I know, there is no index that looks at how much a company is under or over valued in making a judgment on whether to include it. That said, though, companies that get added on to the index tend to be companies whose stock prices have done better in the period prior to that add on, than the companies removed from it were doing prior to their removal. For some contrarians, the act of being included in an index may therefore be a signal that the stock price has outrun value.
Pricing Effect: The pricing argument for index inclusion is that it can increase the investor base for a company, by drawing in investors who invest only in that index (like index funds) or primarily in the index (like many large active institutional investors), and that increase should play out in a jump in stock prices on the stock. The effect, though, will vary depending upon the company in question and the index on which it is listed. The Dow 30 may be widely followed index, but it is not an index fund favorite or even one that institutional investors use to track their returns. Consequently, I don't think that Honeywell, Salesforce and Amgen are going to be helped by being added to that index or that Exxon Mobil, Pfizer and Raytheon will be hurt by their exclusion from it. In contrast, when ServiceNow was added to the S&P 500, its stock price climbed 4%, reflecting both the company's status (low profile, not widely followed) and the S&P 500's standing as an index. I know that many Tesla bulls are awaiting its inclusion in the S&P 500, and with the full recognition that I will be wrong in hindsight, there is nothing that leads me to be believe that it will be a game changer for the company. In fact, you could argue that this company's rise in market capitalization has come from individual investors with strong views on the company, and that the investors that may be drawn to the company post-index-inclusion may not be in sync with the company's business practices.
Why should you care?At this stage, you may be wondering what all of this means for you, especially if your focus is on whether to buy, sell or hold Apple or Tesla, and the answer is that it depends on your philosophy. If you are an investor, nothing that happened on August 31 should alter your views on the company. In other words, if you believed that Tesla and Apple were (under) over valued on August 30, 2020, you will continue to do so on August 31, notwithstanding the stock splits and the chatter of Tesla becoming part of the S&P 500. If you believe that one or both of these stocks is under or over valued, and you are hoping that the stock splits will close the gap, I am afraid that you are disappointed. These are among the most widely followed stocks in the world and stock splits are not going to draw new attention or cause neglected details to come to the surface.However, if you are a trader and you play the momentum game, this is your moment of maximum pain and gain. It is conceivable, and perhaps even likely, that the split will keep the momentum going for the near term, and that you can take advantage by buying today and holding for a period. The problem with momentum is that it is fickle and for those who bought the stock expecting the stock split to be their big payday, if the results fall short of expectations, there will be disappointment. If it sounds like I am playing both sides when I say this, I am, and that is one reason I stay on the sidelines as a trader. I am not good at it.At the risk of sounding cynical, much of the commentary (including mine) that you read or hear on why stocks move is more post-mortem than analysis, an attempt to provide a rational veneer to a process where human beings move prices, sometimes for good reasons, and sometimes not.YouTube Video<iframe width="560" height="315" src="https://www.youtube.com/embed/P_W2qGp..." frameborder="0" allow="accelerometer; autoplay; encrypted-media; gyroscope; picture-in-picture" allowfullscreen></iframe>
August 20, 2020
A Viral Market Update XIII: The Strong (FANGAM) get stronger!
When I started these updates on February 26, 2020, about two weeks after the markets went into free fall, my first six posts were titled "Viral Market Meltdowns", reflecting the sell off across the globe. About half way through this series, I changed the title, replacing the word "meltdown" with "update", as markets turned around. In fact, by August 14, the date of this update, US equities had recouped all of their crisis losses, and were trading higher than they were on February 14, the start of the crisis. In that six-month period, though, there has been a reallocation of value, from old to young, value to growth and manufacturing to technology companies, and I have tried to both chronicle and explain these shifts in earlier posts. In this one, I plan to focus on a subset of these companies, the FANG (Facebook, Apple, Netflix and Google) stocks, younger companies that have soared in value over the last decade, and two other tech companies of longer standing, Apple and Microsoft. These FANGAM stocks, which have dominated the market for the last decade, have become even more dominant during the crisis, and explaining (or trying to explain) that phenomenon is key to understanding both the market comeback and to assessing whether it is sustainable.
Market Outlook
My crisis clock started on February 14, 2020, and it is now six months since its start, and as with my previous updates, I will begin with a quick overview of financial market action over this period. I start by looking at selected equity indices, spread geographically, and how they have performed over the period:
 Download data
On August 14, the S&P 500 was almost back to where it was on February 14, which was an all-time high, and the NASDAQ was 13.46% higher than its February-levels, hitting new highs. In local currency terms, the Latin American indices were still showing double-digit declines, as of August 14, but the Asian indices have recouped much of their early losses. As equities have gone on a roller-coaster ride, US treasuries have settled into a holding pattern, with rates across maturities at much lower levels than prior to it:
 Download dataAlmost all of the drop in rates occurred in the first few weeks of the crisis, but rates are now close to zero at the short end of the maturity spectrum, less than 1% for the 10-year treasuries and approaching 1.5% for the 30-year treasuries. The Fed's two big action announcements, the one of March 15 on expanding quantitative easing and the other on March 23, on operating as a backstop in lending markets, have had only a muted effect on treasury rates, but they do seem to have caused a shift in corporate bond markets, as can be seen in the graph below, showing corporate default spreads for bonds in different ratings classes:
 Download data
Corporate bond spreads, which surged in the first five weeks of the crisis, have dropped back almost to pre-crisis levels for the highest rated bonds. For the lowest rated bonds, spreads have followed the same pattern, but they remain at elevated levels, relative to pre-crisis values. The ebbs and flows in equity and bond markets have also played out in commodities, where I track oil and copper on a daily basis in the graph below:
 Download data
Copper, after dropping 15.36% between February 14 and March 20, has more than recovered its losses and was trading 10.57% higher on August 14, than on February 14. Oil had a much steeper fall in the early weeks, down more than 50% in the first five weeks of the crisis, and while it too has recovered, it was trading about 20% below where it was on February 14. Finally, I look at gold and bitcoin during the crisis period:
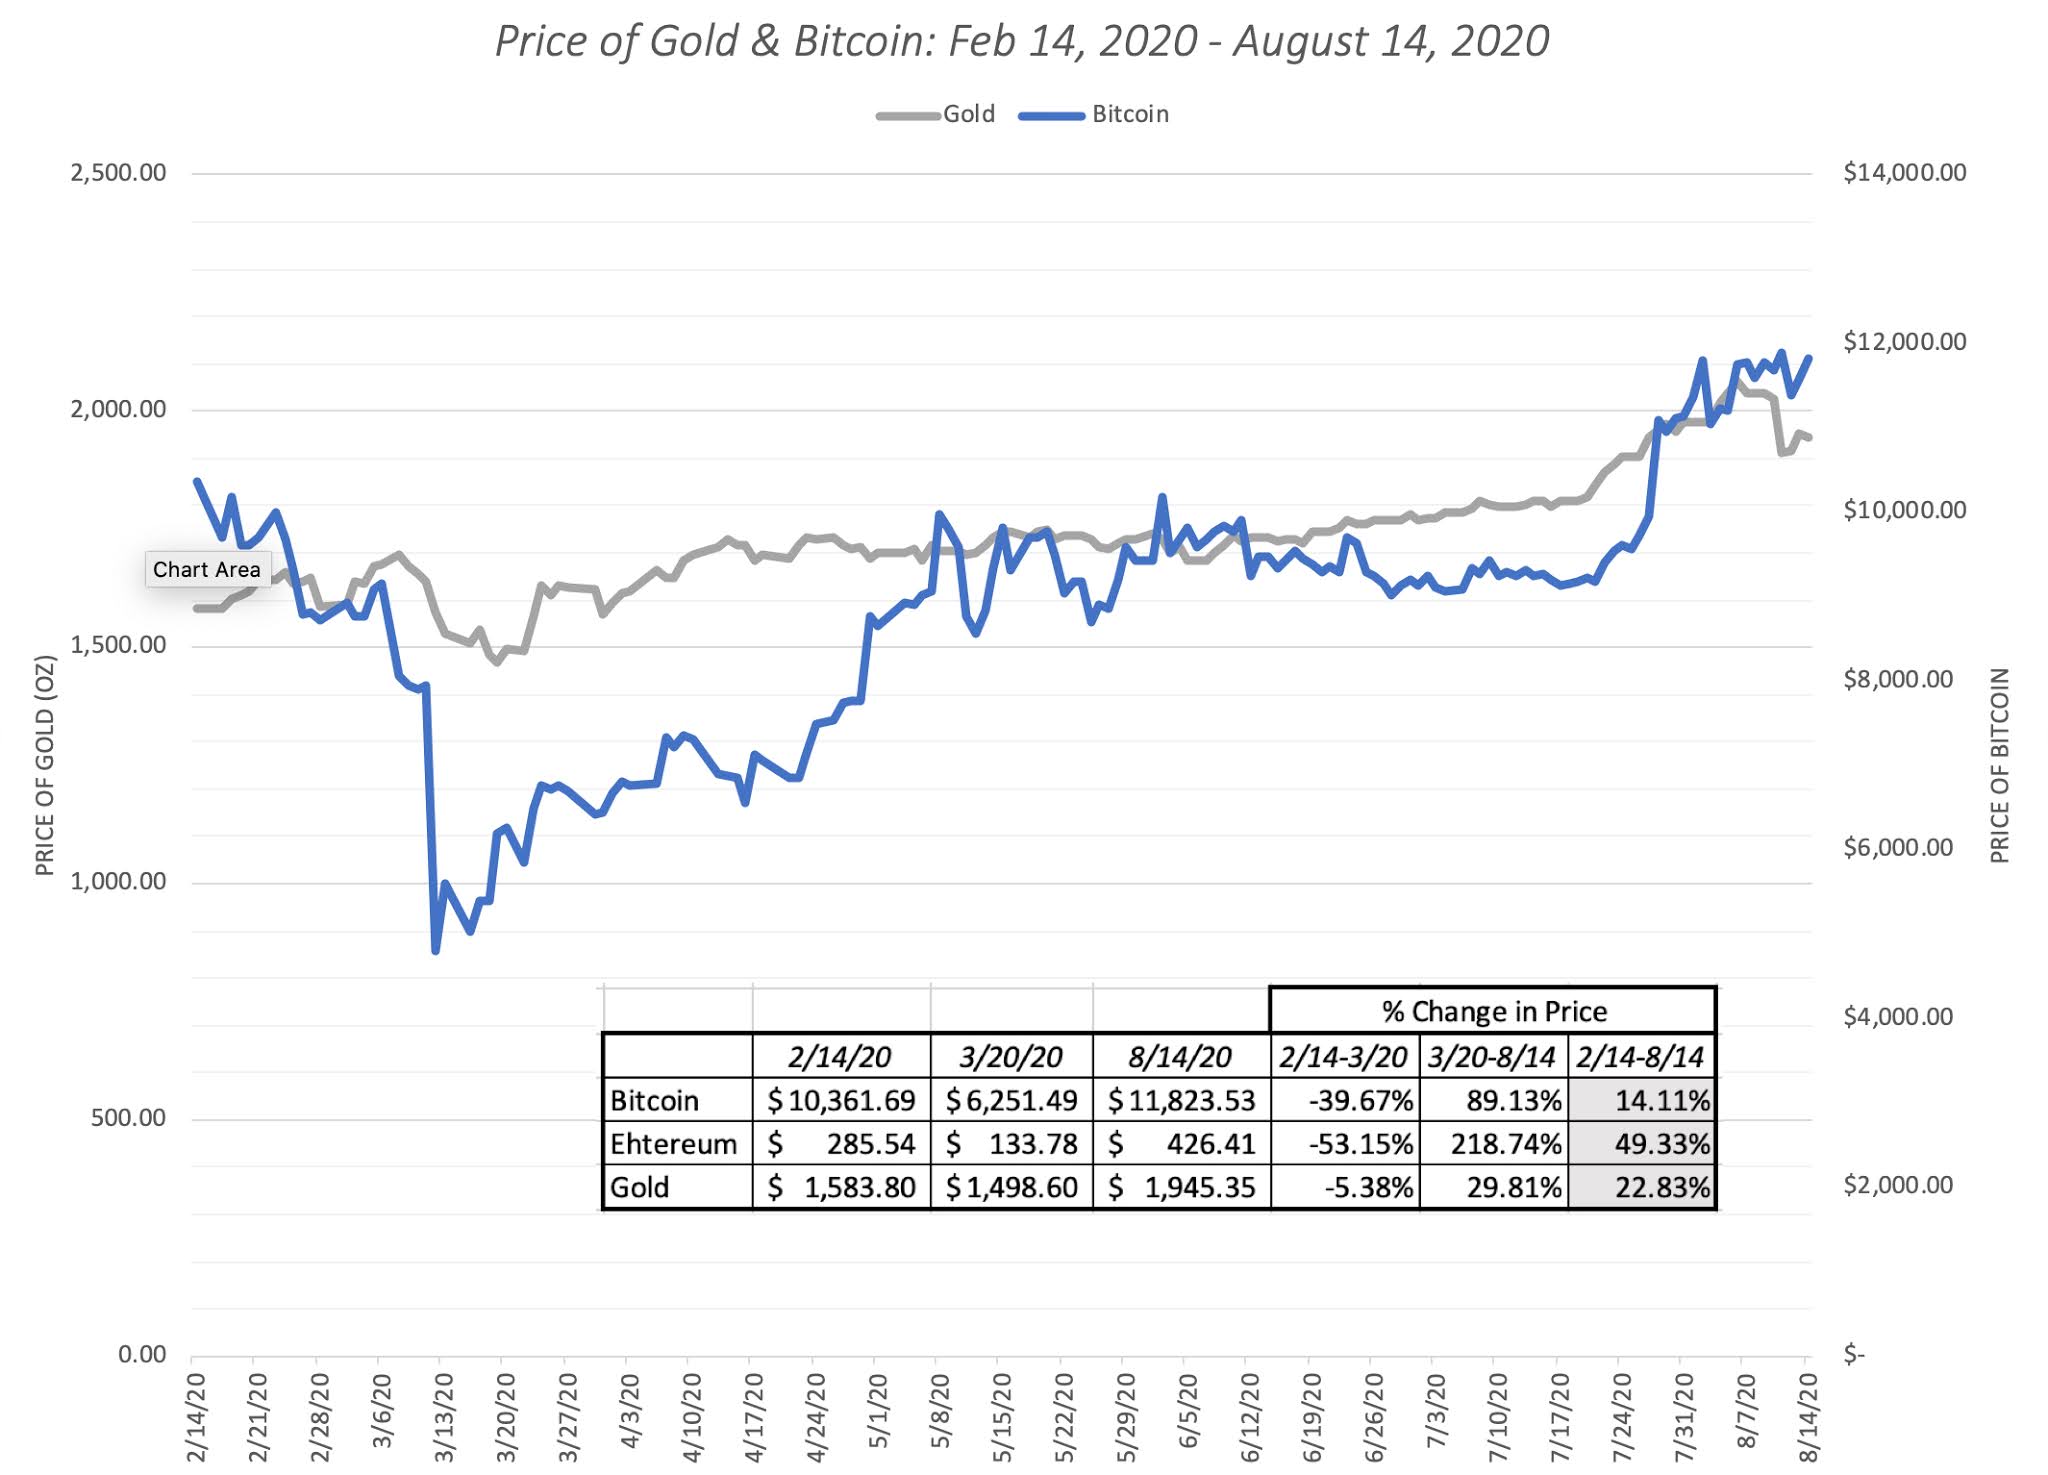 Download data
Comparing Bitcoin to gold, the cumulative return over the six-month period is not dissimilar, with gold up about 23% from its February 14 level, while Bitcoin is up 14%, but the performance over the six month period is telling. Gold has held its value through the crisis, reinforcing its crisis investment status, but bitcoin has been on a wild ride, falling about 40% in the first five weeks, when stocks were down, and rallying almost 89% in the weeks since, as stocks have risen, behaving more like very risky equity than a crisis investment.
Equities Breakdown
While looking at equity indices can provide a big-picture perspective on how stocks are doing, looking at individual companies can yield much richer insights. As in prior weeks, I updated my company-level data on market capitalizations to include the four weeks since my last update, and I report the changes in market capitalization, by region, in the table below:
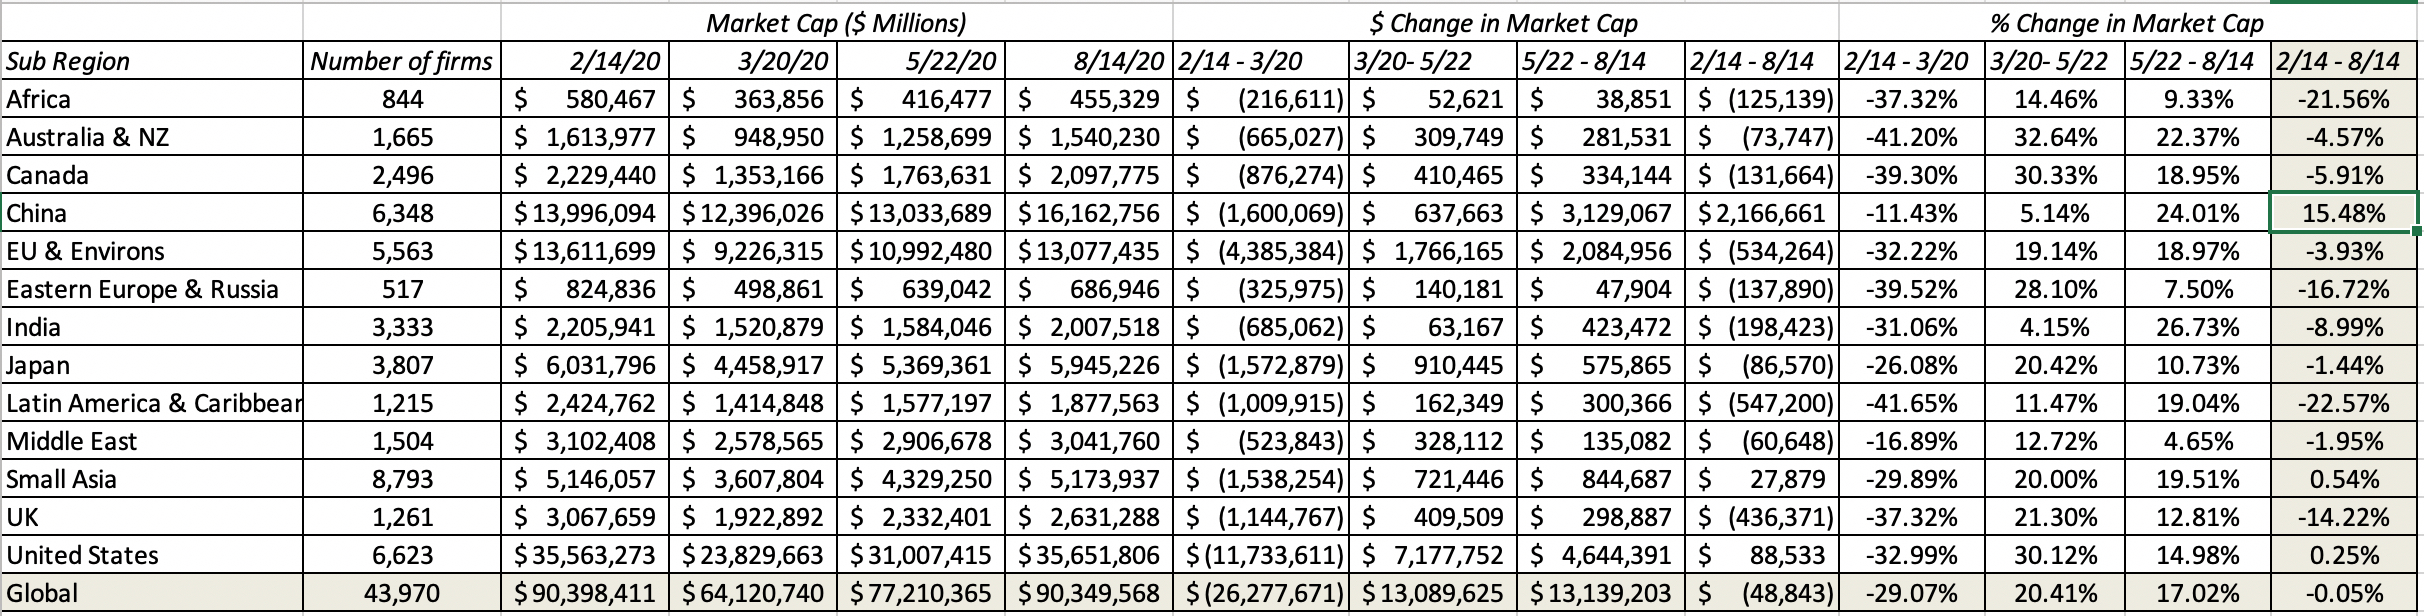 Download data
All of these returns are computed in US dollar terms, for comparability, and they are based upon the aggregate market capitalization of all companies traded in each of these markets. As you can see, a subset of emerging markets (Africa, Eastern Europe, Latin America), are showing the most damage, with weakening local currencies exacerbating market damage. Collectively, global equities on August 14 are back to where they were on February 14, reflecting the comeback story that the indices were telling. Breaking down global stocks by sector, here is what I see:
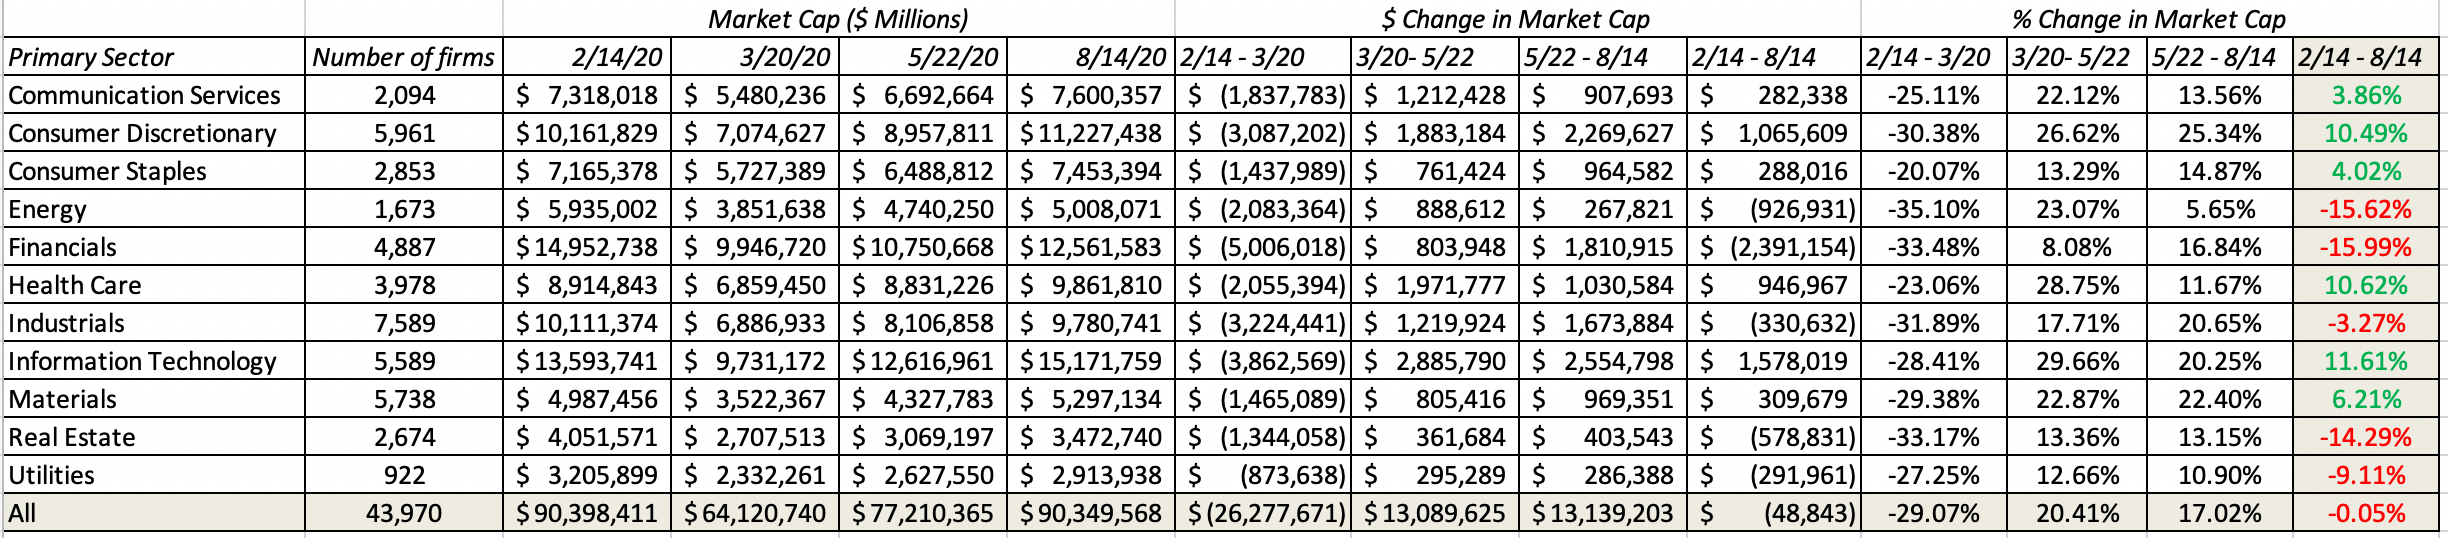 Download data
Of the eleven sectors that S&P uses to classify stocks, six now have positive returns over the crisis period, and technology has now overtaken health care as the best performing sector. The worst performing sectors are energy, real estate and utilities, all businesses that are capital intensive and debt laden, and default worries about that debt burden may explain why financials remain the worst performing sector. Breaking sectors down into finer detail in industry groups, I list the ten worst performing and best performing industries, over the six-month period:
 Download data
The message in this table reinforces what you saw in the sector returns, with infrastructure, commodity and financial service industries making up the bulk of the loser list, and technology, health care and retail dominating the winner list.
The FANMAG Phenomenon
In my earlier posts, I argued that the market effects of this crisis have been disparate, with capital-intensive, debt-laden and rigid firms being worse affected than firms that are capital-light and flexible. You see this play out in the returns you see across sectors, industries and regions. In fact, with returns updated through August 14, 2020, technology companies are now showing healthy gains from where they were at the start of this crisis, up 11.82% since February 14, 2020. There is an inside story to this success, and it revolves around six companies - the original FANG stocks and Apple and Microsoft. They have been responsible not just for the bulk of the returns among technology companies, but have also provided the thrust for the overall market's recovery.
FANGAM - Tale of the Tape
To understand the FANGAM story, let's retrace our steps to when there were only four young companies in this group, Facebook, Amazon, Netflix and Google (FANG) and look at how two of their senior counterparts, Apple and Microsoft, entered this group. In the table below, I list out the founding date for each of these companies, together with the date of their public offerings, the market capitalization at the time of the offering and the years in which each company hit market cap milestones ($100 billion, $500 billion and $1 trillion):
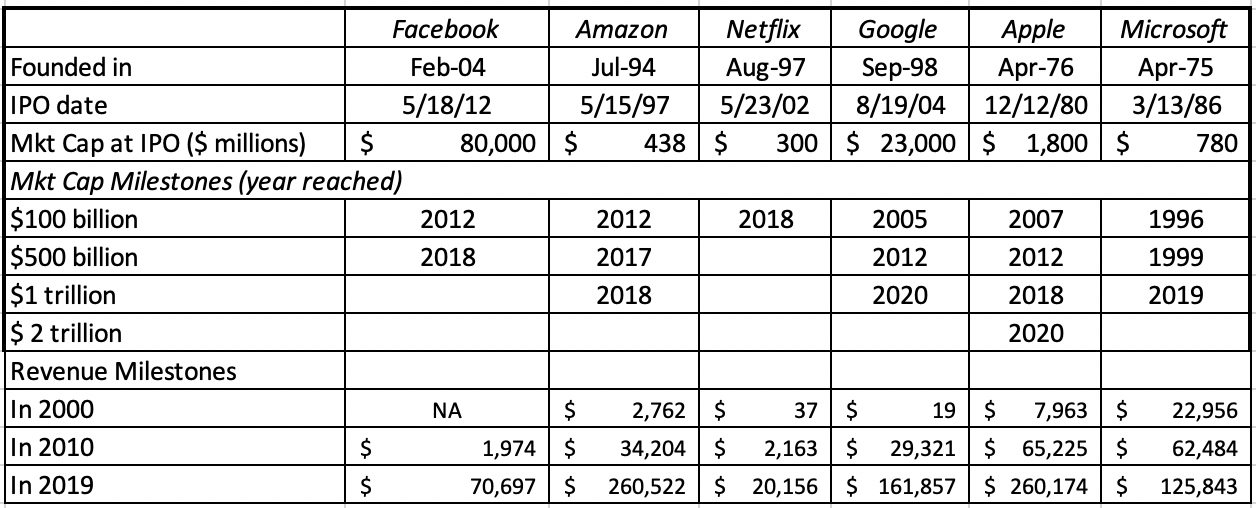
Looking at the six companies, they vary in age, with Microsoft being the oldest and Facebook the youngest, but they have also had extraordinary revenue growth in the last two decades, albeit from different bases. Coming into 2020, Apple, Amazon and Microsoft had already hit trillion-dollar market caps, and they were joined by Alphabet in 2020, and Apple crossed the $2 trillion threshold just two days prior to this post. I find the construct of a corporate life cycle useful in explaining the evolution of companies over time, in both corporate finance and valuations.

For most companies, aging is accompanied by three phenomena. The first is that revenue growth decreases as companies scale up, with the speed of deceleration in growth a function of competition in the business. The second is that profit margins, which are negative or very low when companies are young, improve as companies grow, with the magnitude of improvement depending upon the economies of scale in the business, but plateau as new competitors emerge. The third is that even the very best companies reach mature growth, where they remain profitable, but struggle to grow and create value at the same time. The FANGAM stocks stand out from the rest of the market, since they have, at least so far, found the antidote to aging, continuing to grow even as they get larger, while sustaining or even improving profit margins. Breaking down how each of these companies deviate from the norm, here is what I conclude:
Amazon, the Original: In an era, where every company claims to be the "next Amazon", it is worth remembering that the original company's rise to global dominance came with hiccups and interruptions. After its stint as the poster child for the dot com boom, Amazon's online retail business flirted with failure in 2001, but survived and prospered in the next decade. By the end of the decade, though, it seemed like Amazon's story had run its course, but just as investors were readying for the company becoming a mature retailer, the company reinvented itself as a disruption platform, ready to go after any business it chose to, with an army (Amazon Prime) backing it up.Apple and Microsoft, the Reincarnation Duo: By tech company standards, Apple and Microsoft are old companies that should be struggling to hold on to their customers and fighting off competition. Both companies though seem to have found a way to move the clock back, and retain their status as growth companies. Apple, given up for dead in the late 1990s, found its answer in streamed music, smartphones and tablets in the following decade. Office and Windows were the cash cows that kept Microsoft going for much of its corporate life, but after seeing growth flatline in the software business, the company found new growth in a subscription model (Office 365) and the cloud business.Alphabet and Facebook, the Advertising Juggernauts: Google and Facebook have had almost uninterrupted growth, since their founding, as they have not only taken advantage of the shift to online advertising, but also dominated that shift, while also delivering profit margins in the stratosphere. Along the way, they have accumulated huge user bases, giving them the power to influence not only where people shop, but also what they think, and perhaps even how they vote.Netflix, the Shape Shifter: Of the six stocks, the one that has had to make the most mid-course corrections, changing its business model to reflect a changing world, is Netflix. It started life as a video rental service, mailing DVDs to its customers, and undercutting Blockbuster, the dominant player in the business then. It pivoted quickly to become the leading streaming player, renting its content from movie and TV producers, and offering them to subscribers. As content producers squeezed the company, it shifted its business model again to make its own shows and movies, becoming the largest spender on content in the business. Along the way, it has gone global, and its business machine not only has a huge base of subscribers, but finds ways to keep adding to that base.Every investing generation has its share of legendary companies, but I do not believe that there has been another grouping of companies that has dominated the market as completely as these six have done over the recent past.
A Decade of Domination
To understand how the FANGAM stocks made the last decade their own, you need to go back to the start of 2010, and see how the market viewed each one then:
The Lagging Giant: At the start of 2010, Microsoft had a market capitalization in excess of $270 billion, and was second only to Exxon Mobil, with a market cap of $320 billion, among US companies, but that represented a come down from its status as the largest market cap company at the start of 2000, with a market cap exceeding $500 billion.The Rising Star: At the start of 2010, Apple's market cap was approaching $200 billion, making it the fifth largest US company in terms of market cap, but that was a quantum leap from its market cap of $16 billion, ten years earlier.The Field of Dreams Company: By early 2010, Amazon had cemented its status as online retailer, capable of growing its revenues at the expense of its brick and mortar competitors, but without a clear pathway to profitability. The market seemed to be willing to overlook this limitation, giving the company a market cap of more than $50 billion, a significant comeback from the dot-com bust days of 2001, when it was valued at less than $4 billion. The New Tech Prototype: In January 2010, Google was already the prototype for the new tech company model, having reached a hundred-billion dollar market cap threshold faster (a little more than a year after going public) than any other company in history, and with its market capitalization of more than $160 billion in early 2010, the company was already on the top ten list among US companies.On the cusp: In early 2010, it is unlikely that anyone would have put Netflix on the list of big-time winners, since its market capitalization was less than $4 billion and its business model of renting content and signing up subscribers was seen as successful, but not scalable.The glimmer in the market's eye: At the start of 2010, Facebook was still a private business, though venture capitalists were clearly excited about its prospects, pricing it at roughly $14 billion in January 2010, based primarily on its user numbers. Looking at the FANG or FANGAM grouping, there is an element of revisionist history at play, since the stocks that are part of this group are there primarily because they have done so well in the last decade. In short, no one was talking about FANG stocks in early 2010, and Microsoft would never have made this list even as late as 2012, when it was viewed as a stodgy and fading company. Notwithstanding this hindsight bias, the FANGAM stocks collectively saw their market capitalizations increase from $719 billion (albeit without Facebook) to a staggering $5 trillion between January 1, 2010 and January 1, 2020. In the graph below, I show that collective market cap figure as well as the market capitalizations of all other US equities, each year from the start of 2010 to the start of 2020.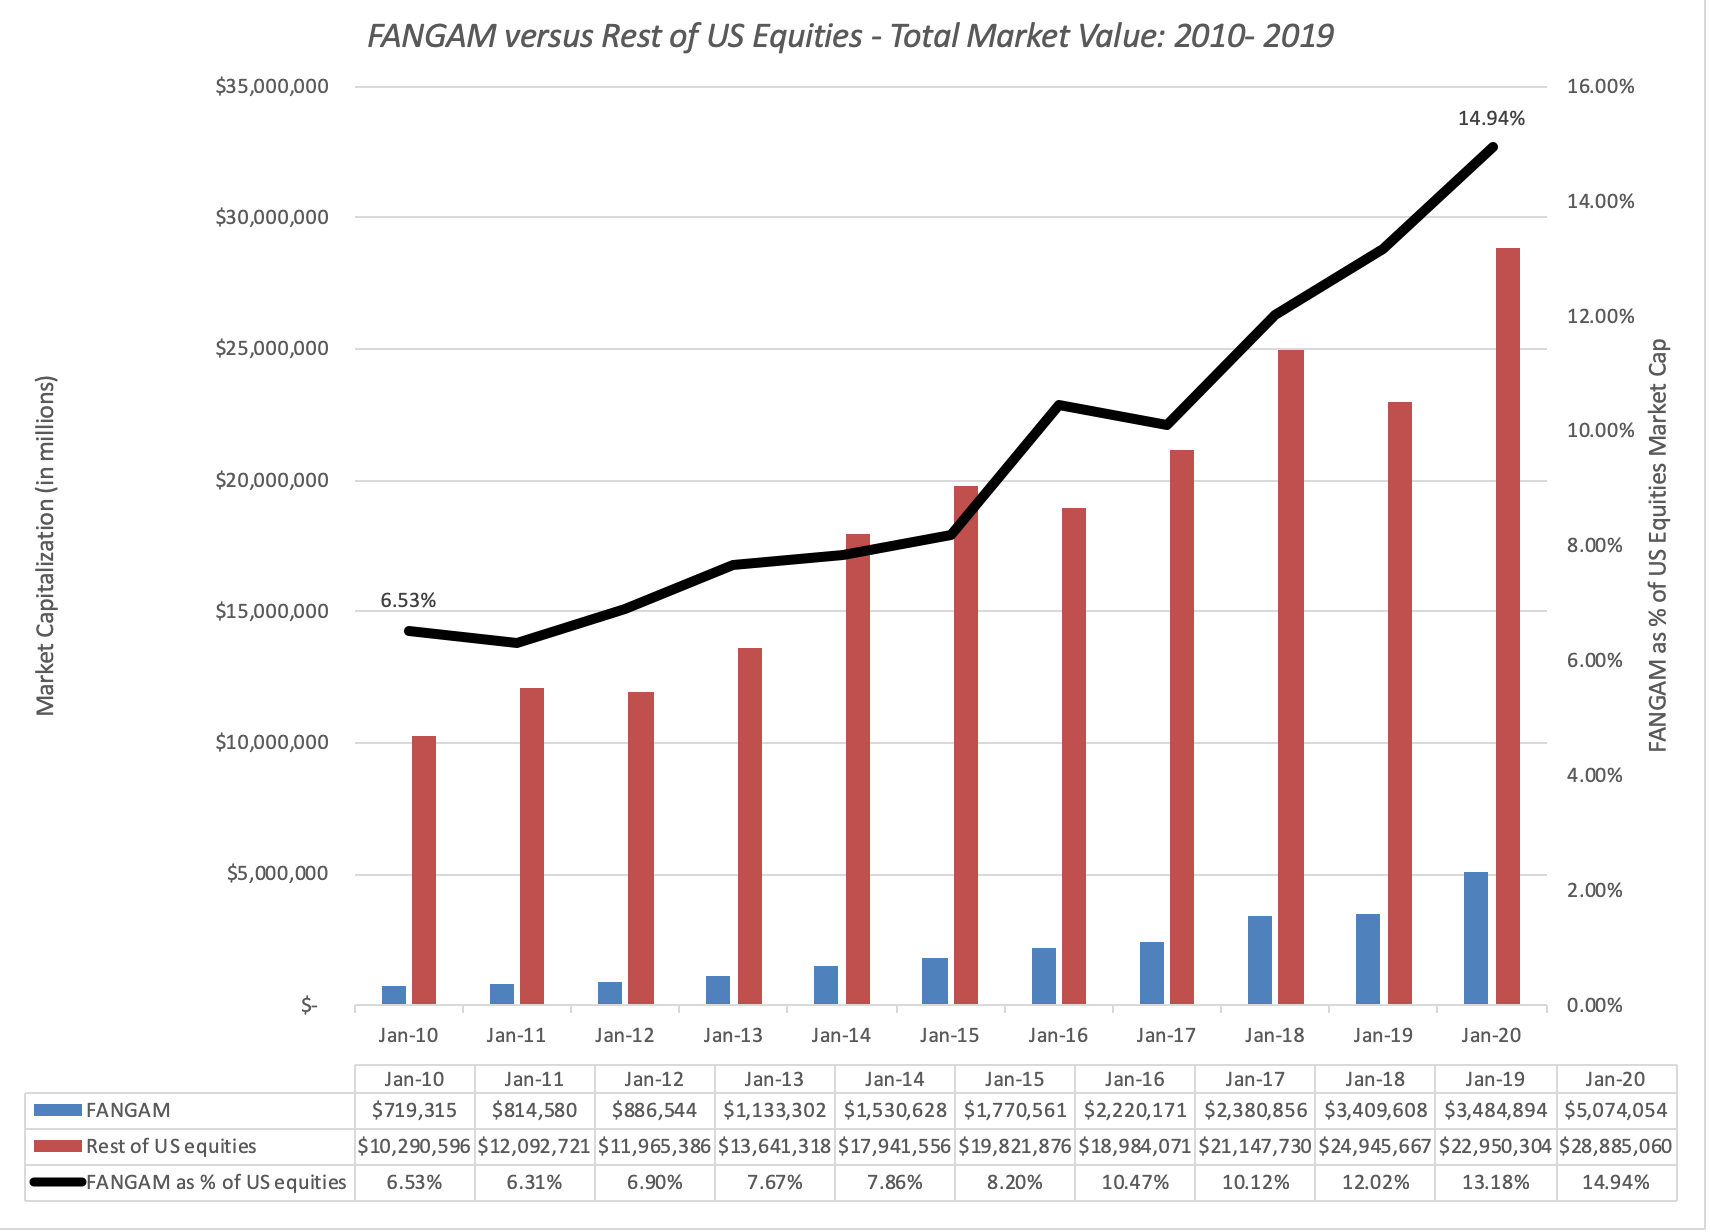 Download data
It is true that US equities did well over the decade, but the FANGAM stocks rose much more, rising from 6.5% of the overall market capitalization of all US equities, in January 2010, to close to 15% in January 2020. To provide perspective on how much the FANGAM stocks contributed to the overall equity market's rise, I compute the change in market capitalization each year at the FANGAM stocks and all other US equities, each year from 2010 to 2019:
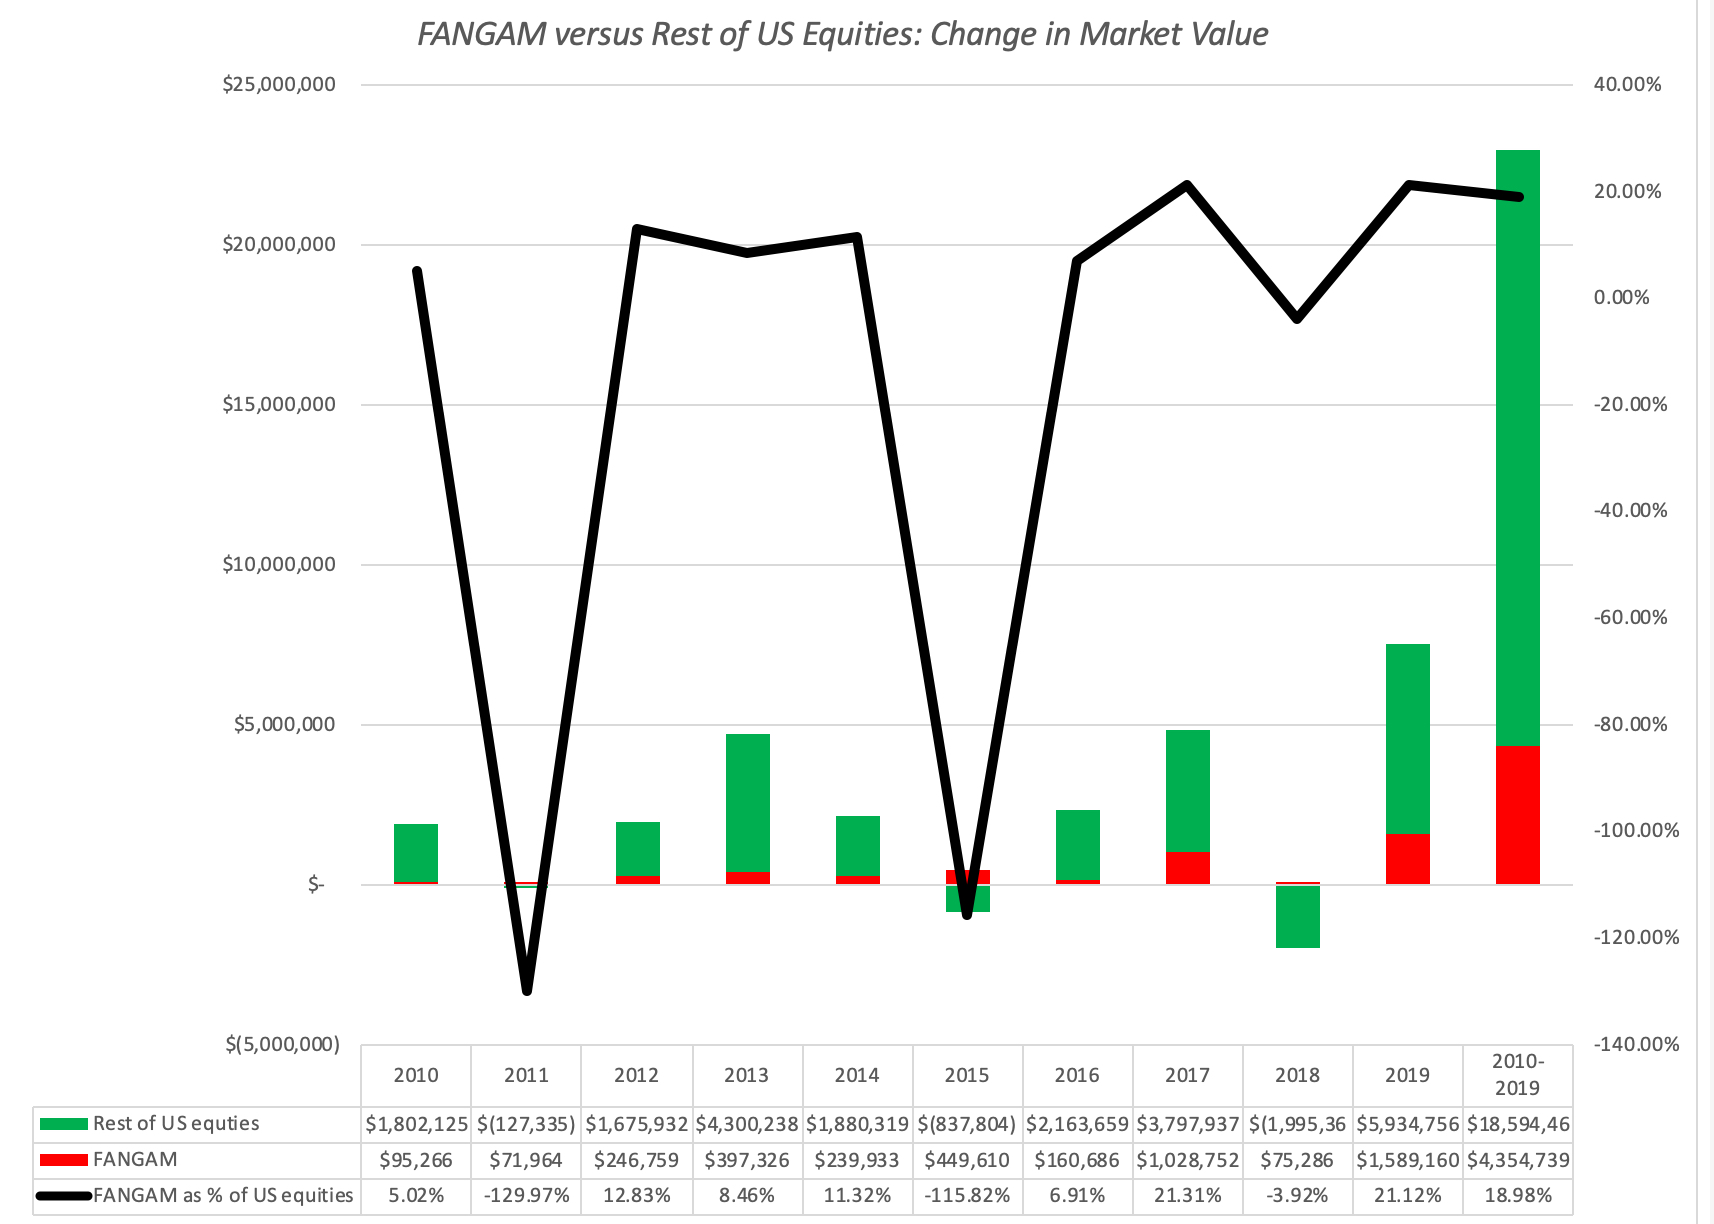 Download data
The $4.35 trillion in market cap added by the FANGAM stocks accounted for 19% of the overall increase in equity value across all US equities (>7000 stocks).
The COVID Rally
At the start of 2020, there was no denying the dominance of the FANGAM stocks in US equity markets, but there was a debate about whether they were over priced, at least collectively. For many old-time value investors, the FANGAM stocks had became a symbol of growth and momentum run amok, though a legendary member of this group (Warren Buffet) had invested in one of the companies (Apple). Between January 1, 2020 and February 14, 2020, the FANGAM stocks continued to rise more than the rest of the market and they collectively accounted for 16.08% of the market cap of all US equities on February 14, up from the 14.94% at the start of the year. When the crisis hit, there were some value investors who felt that the market correction would be felt disproportionately by this group, given their run-up in the years before. In the graph below, I look at the market capitalization of the FANGAM stocks and the rest of US equities, on a week-to-week basis from February 14, 2020 to August 14, 2020:
 Download dataDuring the first five weeks of the crisis (2/14- 3/20), the FANGAM stocks lost about $1.44 trillion in value, providing partial vindication to value investors, but in spite of that loss, saw their share of the market rise to 17.94% of US equities. Between March 20 and August 14, the FANGAM stocks more than recouped the early losses, and were up $1.39 trillion from their February 14 levels, on August 14, while the rest of US equities have collectively lost $1.29 trillion in market capitalization. On August 14, 2020, the FANGAM stocks accounted for 19.94% of the market capitalization of all US equities. While much has been made about how technology has led the comeback on stocks, it is worth noting that US technology companies collectively are up only $973 billion in the last six months, implying that without the FANGAM stocks, there would be no tech comeback.
 From Strength to Strength
We may lump the FANGAM stocks as a group, but these are different companies in different businesses. In fact, lumping them together as technology companies misses the fact that Netflix is closer to Disney in its business than it is to Microsoft's software offerings, and Google and Facebook are advertising companies built on very different technology platforms. There are three elements that they do share in common:
Cash Machines: Each of these companies has a business or segment that is a cash machine, generating large profits and huge amounts of cash for the company. With Apple, it is the iPhone business that allows it to generate tens of billions in cash flows each year, and with Microsoft, it is a combination of its legacy products (Office & Windows) and cloud services that plays this role. With Facebook and Google, their core online advertising businesses not only generate sky high margins, but require very little capital investment to grow. Amazon, until a few years ago, had no segment of equivalent profitability, but AWS (Amazon’s cloud business) is now delivering those cash flows. Netflix remains the weakest of the six companies on this dimension, but even it can count on the subscription revenues from its "sticky" subscriber base for its cash needs. Platform of users/subscribers: The FANGAM stocks also share user bases that are immense, with Facebook leading that numbers game with close to 2.7 billion users, many of whom spend large portions of each day in its ecosystem. Microsoft, Google and Apple all also have more than a billion users apiece, with multiple ways to entangle them. Amazon and Netflix may not be able to match the other four companies on sheer numbers, but each has hundreds of millions of users.Proprietary and Actionable Data: I know that big data is the buzzword of business today, and in the hands of most companies, that big data is of little use, since it is neither exclusive to them, nor the basis for action. What sets the FANMAG companies apart is that they use big data to create value, partly because the data that they collect is proprietary (Facebook from your posts, Amazon/Alexa from your shopping/interactions, Netflix from your watching habits, Google from your search history and Apple from your device usage). Even Microsoft, a late entrant into big data, has stepped up its game. On top of the data is actionable, since these companies clearly use the data to advance their business models, Each of these strengths has contributed to helping these companies not just ride out the COVID storm, but to also emerge stronger from it. The cash machines embedded in each company, combined with light debt loads (relative to their earnings and valuations), have left them unscathed, while their debt-laden competitors are hamstrung by default and distress concerns. The economic shut down has left people home-bound and more dependent than ever before on the FANGAM companies to get through the day, increasing the power of the user platforms and the data collected on them by these companies.In fact, it is the fact that these companies are doing so well that is giving rise to the biggest threat to their continued success, which is regulatory and legal pushback. With Facebook and Google, this is already a reality, especially in the aftermath of the privacy debates and worries about their platforms being used for political influence, with the EU being the forefront of writing restrictions on their data collection and usage. Amazon's disruption of retail, and the devastation it has wrought on its brick and mortar competitors has long been a source of concern for critics, but voices pushing for the use of legal restraints and anti-trust laws on the company are growing louder. Apple has been able to operate under the radar of political and legal scrutiny for a long time, but recent attempts to force app sellers to sell only through its App Store, leaving it with a hefty slice of revenues, has drawn calls for government action. While Microsoft is now viewed as the most virtuous of the six, and is in fact the most widely held stock in ESG portfolios, I am old enough to remember when Microsoft was viewed as the Darth Vader of technology and targeted by the Justice department for breakup, because of its monopoly power.
Value and Pricing
I know that this has been a long lead in, but interesting though it might be to explain why the FANMAG stocks are where they are, the question of the moment in investing is whether you should buy, sell or just watch these stocks. Having valued all these stocks in the past, and acted on those valuations, with mixed results, I will draw on my past history with each company, to craft my stories and valuations of the companies.
 Download valuations: Facebook, Amazon, Netflix, Google, Apple and Microsoft
Simulation results: Facebook, Amazon, Netflix, Google, Apple and Microsoft
With each company, I report an estimated median (or most likely) value, as well as the range (1st decile, 1st Quartile, 3rd Quartile and ninth decile) of values that I estimated from running simulations. Given how much these stocks have gone up over the last six months, it should come as no surprise that I find only one (Facebook) to be under valued. Among the remaining, Apple looks the most overvalued (>30%), to me, followed by Amazon and Microsoft (10%-20%) and Netflix and Alphabet (<10%). I have also computed the internal rates of return for these stock, based upon the current market capitalization, and my estimates of expected cash flows. I would expect to earn an IRR of 7.16% on Facebook, for instance, if I bought at its current market capitalization, and it generates the cash flows I expect it to. That may not sound like much to you, but in a world of low interest rates and equity risk premiums, it is high enough for the stock to be undervalued. Even Apple, the most overvalued stock in this group can be expected to generate a 5.30% IRR, at its current market capitalization, lower than what I would need it to make, given its risk, but not bad given the alternatives. That said, I expect you to disagree with me, perhaps even strongly, on my stories and assumptions, which is one reason the spreadsheets are yours to download and change to reflect your views.
In Closing
In the interests of full disclosure, at the time that I started on this post, I owned three of these six stocks, Apple, Facebook and Microsoft, with each having spent significant time in my portfolio; my posts detailing their acquisitions are here, here and here. As you look back at the valuations that I used to justify those investments, they seem laughably low, and I will not claim any semblance of clairvoyance. In fact, I bought Microsoft in 2013, even though I perceived it to be an aging company with little left in the tank in 2013, Apple in 2016, notwithstanding my expectations of low growth in the future, and Facebook in 2018, in the aftermath of the Cambridge Analytica scandal, because I found the companies cheap, even with my stilted narratives.
I did sell my Apple holdings today (August 19, 2020) as the company crested the $2 trillion mark, will continue to hold Microsoft, even though I believe that it is moderately overvalued, and Facebook, hoping for more upside. In case you are tempted to follow my lead, let me hasten to add that I also sold my Tesla holdings in January 2020 at $640, and the stock is now trading at close to $2000. Google and Netflix will remain on my watch list, and I plan to add either stock, on weakness. I will not tempt fate, and sell short on Amazon, partly because I have seen what the market does to Amazon short sellers and partly because I struggle to think of a catalyst that will cause the price to adjust. If history is any guide, these companies, unstoppable though they seem now, will hand the baton, for carrying the market forward in this decade, to other companies.
YouTube Video
<iframe width="560" height="315" src="https://www.youtube.com/embed/Hr2XfCA..." frameborder="0" allow="accelerometer; autoplay; encrypted-media; gyroscope; picture-in-picture" allowfullscreen></iframe>
Data
Market data (August 14, 2020)Regional breakdown - Market Changes and Pricing (August 14, 2020)Sector breakdown - Market Changes and Pricing (August 14 2020)Industry breakdown - Market Changes and Pricing (August 14, 2020)FANMAG: Valuations and Simulation Results
Facebook: Valuation and Simulation ResultsAmazon: Valuation and Simulation ResultsNetflix: Valuation and Simulation ResultsGoogle/Alphabet: Valuation and Simulation ResultsApple: Valuation and Simulation ResultsMicrosoft: Valuation and Simulation ResultsViral Market Update PostsA Viral Market Meltdown: Fear or Fundamentals?A Viral Market Meltdown II: Pricing or Valuing? Investing or Trading?A Viral Market Meltdown III: Clues in the Market DebrisA Viral Market Meltdown IV: Investing for a post-virus EconomyA Viral Market Meltdown V: Back to BasicsA Viral Market Meltdown VI: The Price of RiskA Viral Market Update VII: Market MultiplesA Viral Market Update VIII: Value vs Growth, Active vs Passive, Small Cap vs Large!A Viral Market Update IX: A Do-it-Yourself S&P 500 ValuationA Viral Market Update X: A Corporate Life Cycle PerspectiveA Viral Market Update XI: The Flexibility PremiumA Viral Market Update XII: The Resilience of Private Risk CapitalA Viral Market Update XIII: The Strong (FANGAM) get Stronger!August 5, 2020
From Class Rooms to Class Zooms: Teaching during COVID times!
A Teacher's LamentI have been a long time advocate of using technology to deliver classes online, and my first attempts to do so date back to the 1990s, well before the appearance of Coursera, EdX and a host of other online platforms. When classes had to be moved online mid-semester in the spring of 2020, I was more prepared than most to deliver my classes online, having had some experience in the game. As this crisis has stretched from days to weeks, and from weeks to months, my office at home has become a home recording studio, but my updated camera still captures me in shades of dishevelment, and my new microphone cannot completely shut out the sounds of home, from my dog barking at the front door, to Alexa notifying me that a new package has arrived, to the microwave pinging.
That said, this semester was a reminder, in case I needed one, of how much of what I love about teaching comes from physically being a classroom. Don't get me wrong! I love what Zoom, Cisco WebEx, Microsoft Team and Google Classes have created as platforms, to allow me to teach my classes online, but as I explain in this long-ago session I did on teaching as a craft, there is an element of magic that can show up only in a classroom, and even there only rarely. If you ask me where the magic comes from or how it is created, my answer would be that I do not know, and that if I did, I would bottle it and drink it myself. I am aware, though, when it happens, and it does so suddenly, and in settings and moments where you least expect it, and when it does, there is no experience quite like it. It is the reason that I would not trade in what I do for a living for any other profession in the world, no matter how lucrative the payoffs.
I am sure many of you find yourself working in unfamiliar settings, as you struggle to get your job done from home, and juggle multiple roles (parents, teachers, handymen). I also know that some of you were expecting to be back in school soon and have been disappointed to find out that you will be taking your classes online again. The last thing that many of you may want to do is to add another online task to your to-do list, but just in case you do have the time and the inclination, I thought I would give you a look at the courses that I teach (or have taught) and the platforms that I offer them on, to find a course/platform combination that is to your liking.
Picking your PoisonI have been lucky in my academic life that I have never been good enough at any one area of finance to become a specialist/expert, and have had to develop diverse interests in both teaching and research and different ways of delivering (timing, platform) what I know, to create something resembling a niche.
Courses In 1985, in my very first year of teaching at the University of California at Berkeley, I taught five different classes from corporate finance to investments to central banking, knowing just enough of each to stay one step ahead of my students. In the years since, my primary teaching at the Stern School of Business has been focused on two courses, corporate finance to the first year MBAs, and valuation to the second year MBAs, with occasional forays into undergraduate teaching. Along the way, I also developed the material to teach a third course on investment philosophies that I have never delivered in a classroom at NYU but have taught in shorter programs elsewhere. In fact, over the last three decades, I have unpacked and repacked these three classes and delivered them on every continent, and in different durations, ranging from an hour (yes, really!) to a day to three days. I don’t require much in terms of pre-prep for any of these classes, but there are a few very basic financial building blocks and economic concepts that I draw on repeatedly that I have now packaged into a course that I unimaginatively call my foundations of finance class.
1. Foundations of FinanceCoverage: I have always thought of finance as a hybrid discipline, with roots in economics, and substantial contributions from statistics, accounting and psychology. In this short class, more a collection of tools and topics than a real course, I look at how the time value of money, an incredibly simple construct built around cash flows and risk, underlies much of what we do in finance, and the mechanics of putting it into practice. I also do a brief introduction to three macroeconomic variables that show up repeatedly in finance, inflation, interest rates and exchange rates, more from the perspective of a practitioner who has to deal with them on a daily basis and less from that of an economist.Objective: To provide a basic understanding of the building blocks that I will use in my corporate finance and valuation classes. Intended audience: If you have no background in finance or economics, the topics that I cover in this class will be useful. If you do, you may find the sessions going over familiar ground, and may find yourself skipping forward. Structure: The class is built around 12 sessions, starting with an introduction to how finance views businesses, moving on to the time value of money and a basic introduction to how we value contractual, residual and contingent cash flows and closing with sessions on three macroeconomic variables (inflation, interest rates, exchange rates) that show up repeatedly in financial analysis.

2. Corporate FinanceCoverage: Corporate finance is the ultimate big-picture class laying out the first financial principles that govern how to run a business. Consequently, it covers every aspect of business, from whether and how much to invest back into the business to how to finance (borrowed money or your own) these investments to how much cash to take out of the business (dividends and cash return).Objectives:
(1) To provide perspective on the core principles that govern investing, financing and dividend decisions, and how choices on one of these dimensions can and often do affect choices on the other.(2) To get comfortable with the tools, models and theories that lead to the "right" corporate finance decisions.(3) To understand why managers and owners often choose to deviate from the script and make sub-optimal decisions.Intended audience: Everyone, from business owners to managers to consultants to investors, but I am biased... Structure: This class starts with an assessment of corporate governance (and where power resides in a company), moves on to how best assess investments, then to financing mix and type and ends with dividend policy. Since it is an applied class, I use corporate finance tools on a diverse group of companies to see how they work.
3. ValuationCoverage: This class is about attaching a number to an asset, item or investment, and given that broad mission, it draws a contrast between valuing and pricing an investment and develops the tools of each approach, with intrinsic and discounted cash flows determining value, and multiples/comparable assets driving pricing. Objective: (1) To value and price publicly traded companies, small and large, young and old, developed and emerging markets, as an investor.(2) To value and price privately owned and non-traded businesses(3) To value and price stand-alone assets(4) To price collectiblesIntended audience: Investors of every stripe, from individuals to venture capitalists to fund managers, equity research analysts, value consultants and financial managers at public companies.Structure: The class begins with an examination of broad themes that animate valuation and pricing, and then spends a significant portion of time in the weeks of intrinsic value, talking about cash flows, growth and risk, before moving on to pricing and real option valuation. Along the way, we will look at valuation through different perspectives (investors, acquirers, managers).

4. Investment PhilosophiesCoverage: This class is designed to provide you with a menu of investment philosophies, from old-time value investing to day trading, with descriptions of the market beliefs that underlie each one, the historical evidence on how well each philosophy as performed, as well as the skills and strengths you will need to make that philosophy work.Objective: To find the investment philosophy that is right for you, given your risk preferences, strengths and personal make up.Intended audience: Investors of all types, from individuals to professionals, novice to experienced and young to old.Structure: In keeping with the idea that there is no one best investment philosophy, the class will begin with the much maligned philosophy of technical analysis and charting, before moving on to value investing and growth investing in its different forms. We then look at trading strategies built around information and arbitrage-based strategy, before ending with a sobering assessment of how difficult it has proved for active investors to beat the market.

Sequencing and OverlapIf you an uninterested in any of these classes, there is clearly nothing more to say. If you are, I can offer my subjective road map through the classes. The course to start with is the Foundations class, since it is only twelve sessions and covers the basics. Feel free to jump ahead if you find the material too basic or just do the sessions that you are interested in.Of the remaining three classes, the one that I think has the widest reach is corporate finance, since understanding how to run a business is something that I believe everyone can benefit from. Put simply, whether you are corporate lawyer, a marketing executive, a consultant or a strategist, understanding corporate finance can make you better at your job. In terms of sequencing, it also lays the foundations for getting more out of the valuations class and should precede it.Valuation builds on corporate finance, but is most useful to those in the business of valuing companies (appraisers, equity research analysts, M&A analysts), but understanding what drives value can also help entrepreneurs and private equity investors. I think that understanding value can be useful even if you consider yourself more of a trader, but that may be my biases speaking.The investment philosophies class is aimed at people interested in investing, whether they be individual investors or professional money managers. Thus, if you have little interest in actually valuing companies from scratch, and more interest in getting a broad perspective on how to invest money, you can skip both corporate finance and valuation and just take this class.
 Will there be some topics that get covered in more than one of these classes? Of course, but in my view (and remember again that I am biased), these are topics that are worth repeating and looking at through a different lens. Thus, I will cover the basics of estimating cost of capital in corporate finance, but with the perspective of estimating hurdle rates for companies that are evaluating projects, and again in valuation, but from the perspective of investors trying to value a company.
 Delivery Platforms With each class that I teach, I have multiple versions that you can access, and you are welcome to pick the one that best fits the time you have available to spend on the class, and what you hope to get out of it. I have tried to make the content equally accessible in all of the platforms.
1. Regular classes (Free): For the corporate finance and valuation classes, the classes that I teach at Stern are available in unvarnished, but complete, form (classroom recordings of lectures, slides, exams and even class emails). That detail, though, can be overwhelming, since no one was meant to watch a session that last 80 minutes (my regular class time) online, and you can drown in the weekly assignments, quizzes and other components that make for a regular class. That said, this is the closest you will get to a full time class experience in terms of content and if have patience and tolerance, you can make your way through these classes. You can find the entry pages to the classes below:Entry page for MBA Corporate FinanceEntry page for MBA ValuationWith each class, you can stream the class from the NYU server, at least for the latest semesters. The spring 2020 class was distorted by the crisis, and if you prefer a more conventional class, I have the 2019 versions listed as well:Webcast page for MBA Corporate Finance, Spring 2020Webcast page for MBA Corporate Finance, Spring 2019Webcast page for MBA Valuation, Spring 2020Webcast page for MBA Valuation, Spring 2019As you will see on these pages, each recorded lecture comes with the slides that I used for that lecture and a post-class test and solution. Since the NYU server gets wiped clean every two or three years, I have YouTube playlists of the same classes at the links below:YouTube page for MBA Corporate Finance, Spring 2020YouTube page for MBA Corporate Finance, Spring 2019YouTube page for MBA Valuation, Spring 2020YouTube page for MBA Valuation, Spring 2019The YouTube videos have the links to the slides and the post class tests/solutions.
2. Online Classes (Free): If you don't have the time or the patience to sit through 26 sessions of 80 minutes apiece (and who can blame you?), I have created online versions of all four classes, where I have tried to compress what I would say in an 80-minute session into a 12-15 minute session, and honesty requires me to confess that it was not that difficult, a testimonial to how much padding we put into two-year MBA programs. The webcast pages for all four classes are available below:Webcast page for Foundations of Finance OnlineWebcast page for Corporate Finance OnlineWebcast page for Valuation OnlineWebcast page for Investment Philosophies OnlineThe videos are also available as YouTube playlists for each class:YouTube playlist for Foundations of Finance OnlineYouTube playlist for Corporate Finance OnlineYouTube playlist for Valuation OnlineYouTube playlist for Investment Philosophies Online3. NYU Certificate Classes (definitely not free): The regular and online classes that I list above are free, but there are two catches. The first is that they come with no certification, since I have neither the inclination nor the resources to keep track of who is taking the class, how well they are doing and providing the certification. The second is that online classes require self-discipline, since there is no mechanism for me to prod or nag you to keep up with the class. For many of you, these are not deal breakers, and I know of many who have persevered to finish these classes. If you believe that you need both the structure of a real class (with deadlines and time schedules) and certification, there is a third option and that is to take these classes through New York University's Executive Education program. The links to the certificate versions of the classes are below:Foundations of Finance Online (Included in Corporate Finance and Valuation certificate classes)NYU Certificate in Corporate FinanceNYU Certificate in Advanced Valuation NYU Certificate in Investment PhilosophiesThese classes have more polished versions of the videos that I recorded for my online class, come with exams and projects, and I do live Zoom sessions every two weeks, with each class, for the clearing up of doubts and questions. They also include quizzes, an exam and a final project, the last of which I will grade and return to you with feedback. Since these are offered through NYU, they come with a price tag, that some of you may find too high. Since the content on these courses is identical to the free online versions (even though NYU has chosen to add advanced to the valuation class and applied to the corporate finance class names), you will have to decide whether these add ons are worth the price that NYU charges for them. And for those of you find that price to be too high, there is always the free version!
The University Model: Disruption Coming?You can accuse me of biting the hand that feeds me, but I have always though that the university model of education, especially as practiced by research universities, is dysfunctional and ripe for disruption. If a university were treated as a business, and we were asked to objectively assess its performance, we would give it failing grades on multiple counts. The university governance system stinks, investments are driven by ego and me-tooism, the funding process is unsustainable, and universities seem to revel in mistreating their primary customers, the students, who deliver the tuition revenues that represent the bulk of their revenues. That said, this mistreatment is not a new phenomenon and the university model has endured for centuries, foiling and co-opting potential challengers over this period. As recently as a decade ago, there were some who proclaimed that MOOCs (massive open online courses) would upend universities, but that assault, like others before, failed and EdX and Coursera now operate as extensions of universities, rather than competitors. I argued a few years ago that technology-driven disruptors of education were failing because of a fundamental misunderstanding of what a university degree package offers students, viewing a university education as a collection of courses. At the same time, I offered a cautionary note to my university colleagues that change was already here, undermining the moats that universities have erected against competitors. If you are interested in that presentation, you can click here.
In 2020, COVID may have accomplished what hundreds of years of competitors and critics have not, and exposed the underbelly of the university model. First, as classes moved online, there were many where students hardly noticed the difference, as classes taught without energy, enthusiasm and engagement in a physical classroom sound the same online, and are easier to mute. Second, of the many things that students misses after classes moved online, the classes themselves were low down the list, well below friends, college sports and parties. Third, the fact that most universities were unable or unwilling to cut tuition, even as classes move online, drew attention to the magnitude of the tuition and how little of it is directly connected to student education. Finally, it forced students and parents, who had been have been conditioned to believe that the only way to get an education is to spend four years at a university, out of their pre-conceptions and to experiment with alternative routes.My good friend, Scott Galloway, has been vocal in arguing that COVID is the tipping point that is going to upend the university model. He sees a world, where the strongest and most prestigious schools will survive and perhaps even thrive, while many small colleges and tuition-dependent universities will be decimated. While Scott and I agree on the trends and many of the problems with the university model, I have more hope than Scott does for the model. I think that COVID provides an opportunity for universities to remake themselves into institutions where real learning is delivered in classrooms, good teaching is valued, and the focus returns to educating students. This change will come with pain, felt disproportionately by the tenured faculty and administrators, who have benefited the most from the existing model, with the question of tenure itself being debated. As someone with tenure, I believe that no one is entitled to a job for life, and arguing that tenure is needed to allow researchers to express themselves freely sounds good, but is disingenuous. Much of academic research is so abstract and separated from reality that it is unlikely to be read, let alone be the basis for a firing.
The Bottom LineIt has always been true that learning is not restricted to classrooms, and that your education may begin in a classroom, but it finds its grounding when you practice it in the real world, warts and all. There is almost nothing I teach in my classes that is timeless or profound, and I have learned that there is so much more that I do not know about the topics that I teach, than I do. I don't believe that I have either the knowledge or the intellect to answer every question that I am asked, but my job in teaching is to expose the process by which I try to get an answer, misguided and incorrect though it may be. As I have said repeatedly, and in many contexts, I would rather be transparently wrong than opaquely right, and I hope that if you take one or more of my classes, you will not only learn from my mistakes but also develop your own processes for answering the big questions in finance. Good luck and Godspeed!
YouTube Video<iframe width="560" height="315" src="https://www.youtube.com/embed/9L8ScAI..." frameborder="0" allow="accelerometer; autoplay; encrypted-media; gyroscope; picture-in-picture" allowfullscreen></iframe>
July 23, 2020
A Viral Market Update XII: The Resilience of Private Risk Capital
Market OutlookLet me start, as I have in my prior posts on this crisis, start with a market overview. In the three weeks since my last update, equity indices have continued their recovery, albeit at a more modest pace, from the worst days of the crisis:
 Download data
Note that I have broken returns down into two periods for every index, the first period (2/14-3/20) marking the worst days of this crisis, and the weeks since (3/20-7/17) representing the comeback. By July 17, the NASDAQ had not just recouped its losses but was up 9.61% since February 14, my starting date for the crisis. Within each region, there remain divergences, with the DAX outperforming the FTSE and CAC in Europe, and the Nikkei and Shanghai doing much better than the Sensex in Asia. As stocks have gone through a roller coaster ride, US treasuries seem to have gone into a coma, after an initial period of frenetic activity:
 Download data
The rates on US treasuries dropped significantly in the first four weeks of the crisis, but since the middle of March, have shown almost no movement, with short term treasuries staying close to zero, and 10-year treasuries at or around 0.7%. Tracking oil and copper, two economically sensitive commodities, here is what I see:
 Download data
Both commodities saw prices drop between February 14 and the end of March, but oil dropped significantly more than copper in that period. In the weeks since, both commodities have recovered, with copper now trading 12.5% higher than it was on February 14, but oil his still down more than 20%. As the crisis has played out in the equity and bond markets, I also tracked gold and bitcoin price movements over the period:
 Download dataSince February 14, gold prices are up more than 14%, reaffirming its role as a crisis asset, but bitcoin has been on a wild ride, dropping more than 50% between February 14 and March 20, as stock prices dropped, and rising almost 75% in the weeks since, as stocks have recovered. In short, it has behaved like very risky equity, not a crisis asset.
Equity BreakdownWhile looking at indices, treasuries and commodities gives big picture perspective on this crisis, the real lessons are in the company-level data and to learn them, I examined market capitalization changes across all publicly traded companies, classified by region:
 Download data
Emerging markets, at least collectively, have lost more value than developed markets, with Latin America, Eastern Europe and Africa showing the biggest losses. Asian stocks have done better, with China being the best performing region of the world and India being the laggard in that region. Updating the values globally, stocks have lost $3.6 trillion in market capitalization since the start of the crisis, but that is quite a turn around from the $26 trillion that had been lost through March 20. Breaking down the changes in value, by sector:
 Download dataWhile every sector has seen improvement since the bottom on March 20, energy, financials and real estate still show substantial losses in market cap over the entire period, but six of the eleven sectors now show positive returns, with health care leading the way, up 9.5% since February 14. Breaking the sectors down further into industries, here is the list of the ten best and worst performing industries:
 Download dataThere are two striking features in this table. The first is that the worst performing industries are a mix of capital intensive businesses and financial services and the best performing industries are dominated by capital-light businesses and health care. The second is the divergence between the best and worst performing industries is striking, with the best performing industries (online retail and internet software) up more than 30% since February 14, while the worst performing industries (oil and airlines) are down more than 40% over the same period.
Risk CapitalThere is little that I have said in this post, so far, that is new, since it is a continuation of trends that I have seen since March. That said, and now that we have information on winners and losers over the last five months, it is worth taking a closer look at the broader forces that are driving the market to reward some companies, and punish others, and what it is that is making market behavior so disconcerting to long-time market observers. Specifically, I will argue that the behavior of risk capital during this crisis has been very different from prior ones, and it is that difference that explains anomalous market behavior.
Definition and Crisis Effects Risk capital is capital that is invested in the riskiest assets and markets, and it encompasses a wide range of investment activity. For young companies, private and in need of capital to be able to deliver on their potential, it takes the form of venture capital. In public markets, it manifests itself in the money that flows into initial public offerings and to the riskiest companies, often smaller and more money losing. It can also take the form of debt, lending to firms that are in or on the verge of distress, and investing in high yield bonds. In most market crises, risk capital becomes less accessible and available, as fear dominates greed, and investors look for safety. Thus, you will see venture capital, always a boom and bust business, become scarcer, and the young companies that are dependent on it have to either shut down or sell themselves to deep-pocketed and more established companies, often at bargain basement prices. In public markets, initial public offerings become rare or non-existent, and money flows out of the riskiest companies to safer companies (generally with stable earnings and large dividends). In corporate bond market, new issuance of corporate bonds drops off, across the board, but much more so for the riskiest companies (those below investment grade). As I will argue in the rest of this section, that has not been the case in this crisis. While the flight to safety was clearly a dominant theme in the first three or four weeks of this crisis, risk capital has not only stayed in the market through this crisis, but has become more accessible rather than less, at least in some segments.
Venture Capital Investing in young companies, especially start-ups and angel ventures, has always been a high-risk endeavors for two reasons. First, these businesses have to be priced or valued with much less information on business models or history than more mature companies, and many investors are uncomfortable making that leap. Second, the failure rate among these companies is high, since more than two-thirds of start ups do not make the transition to being viable businesses. Venture capital's role is to nurture these young companies through these early dangers, and in return, the hope is that the investment will earn outsize returns, when they exit. This accentuated risk return trade off makes venture capital the canary in the coal mine, during a crisis, and you can see that play out in the following graph, tracking venture capital raised by year, both in the US and globally:
 Source: NVCA Yearbook
In the last quarter of 2008 and in 2009, as the public markets plunged into crisis, note the drop of in venture capital invested, down more than 50% globally, and 60% in the United States. In fact, it took until 2014 for venture capital to return to levels seen before the crisis (in 2007), but once it did, it found new buoyancy leading into 2020. When the COVID crisis hit in February, the question was whether venture capital would retreat as it did in 2008, and the numbers so far don't seem to indicate that it will:
 Download data
Venture capital infusions did drop off in the first quarter of 2020, but not precipitously, and staged a recovery int he second quarter. It is true that less money is being invested in angel seed companies, presumably the riskiest class, and more in later stage businesses, but it does not look like venture capital has shrunk back into its shell, at least so far.
Public Equity Risk Capital In public markets, risk capital plays out in more subtle ways than in private markets, flowing in and out of the riskiest segments of the market, as fears rise during a crisis. In most crises, as I noted earlier, the money flow favors the safer companies, pushing up their pricing and valuation, and works against the riskiest companies.
1. Risk GroupingsOne measure of how risk capital has behaved in public markets is to look at market capitalization shifts from groupings of companies that are considered risky to groupings that can be considered safe. Since there can be disagreements about how best to create these groupings, I have considered multiple measures for the risk/safe continuum in the table below, and highlighted how market capitalizations have changed, in the aggregate, on each measure:

To make sense of this table, pick a grouping, say PE ratios. The Risk On/Off columns highlight the conventional wisdom that low PE stocks are safe and high PE stocks are risky. The returns columns report on what companies in the top and bottom deciles of PE ratios have earned during this crisis period, in both percentage and dollar terms. Thus, the stocks with the highest PE ratios (top decile) have seen their market capitalization increase by 10.81% ($674 billion) while stocks in the lowest PE ratio decline have seen their market values drop by 8.31% ($246 billion). On almost every measure that I use for risk in this table, this market has pushed up the valuations of the companies that would be considered riskiest and pushed down the values of the companies that would be considered safest. The only risk categorization where punishment has been meted out to the riskiest companies is financial leverage, with the companies that have the most debt (in net debt to EBITDA terms) seeing market capitalization decrease by 15.49% ($1,082 billion), while companies that have the least debt have seen market value increase by 12.32% ($300 billion). It is still only five months into the crisis, and markets can surprise and shift quickly, but at least from today's vantage point, this crisis has played out in a most unusual way, with the riskiest companies increasing in value, at the expense of the safest, with debt-driven risk being the exception.
2. IPOsOne of the most observable measures of market confidence in access to risk capital is initial public offerings, since companies going public are often younger, more risky companies. The best way to illustrate this is to look at initial public offerings over time, measuring both the number and dollar value raised in these offerings:
 Source: Jay Ritter IPO dataIn terms of number of initial public offerings, the 1990s clearly set a standard that we are unlikely to see in the near future, and while the dot com bust brought the IPO process back to earth, you can see the damage wrought by the 2008 crisis. In the last quarter of 2008, as the crisis unfolded, there was only one initial public offering made in the US and the drought continued through 2009. While the number of IPOs has remained well below dot com era levels, the value raised from IPOs bounced back in the last decade, reflecting the fact that companies were delaying going public until they were bigger in market cap terms, with 2019 representing a year with several high-profile IPOs that disappointed investors in the after-market. When the COVID crisis hit in February, the expectation was that just as in prior crisis, the IPO process would come to a grinding halt, as private companies waited for the return on risk capital. In the graph below, I look at initial public offerings (both in numbers and dollar proceeds), by quarter:
 Download dataAs with venture capital, there was a pause in the IPO process, in the first few weeks, and you can see that in the first quarter numbers. However, initial public offerings returned to the market in the second quarter, in both numbers and dollars, and the pipeline of IPOs is filling up again. In fact, I have not counted IPOs of SPACs (or blank check companies) in my statistics in my analysis, and there were quite a few of those in the second quarter of 2020, another indicator of investors willing to take risk.
 3. The Price of Risk (Equities)When risk capital is on the move, the number that best reflects its movement is the equity risk premium, rising as risk capital becomes scarcer and falling with access. During 2008, for instance, my estimates of the equity risk premium reflected this fear factor, rising from 4.4% on September 12 yo a high of 7.83% on November 20, before dropping back to 6.43% on December 31 (still well above pre-crisis levels):

I have reported that process during this crisis, but my estimates of the equity risk premium for the S&P 500 are in the graph below:
 Download data
The story embedded in this graph is the same one that you see in the VC and IPO pictures. In the first few weeks of the COVID crisis, the price of risk in the equity markets surged, just as it had in 2008, hitting a high of 7.75% on March 23. In the weeks since, equity risk premiums have almost dropped back to pre-crisis levels, as risk capital has come back into the market. Incidentally, this return of risk capital is not just a US-phenomenon, as can be seen in the picture below, where I report my estimates of the equity risk premiums, by country, through the crisis:
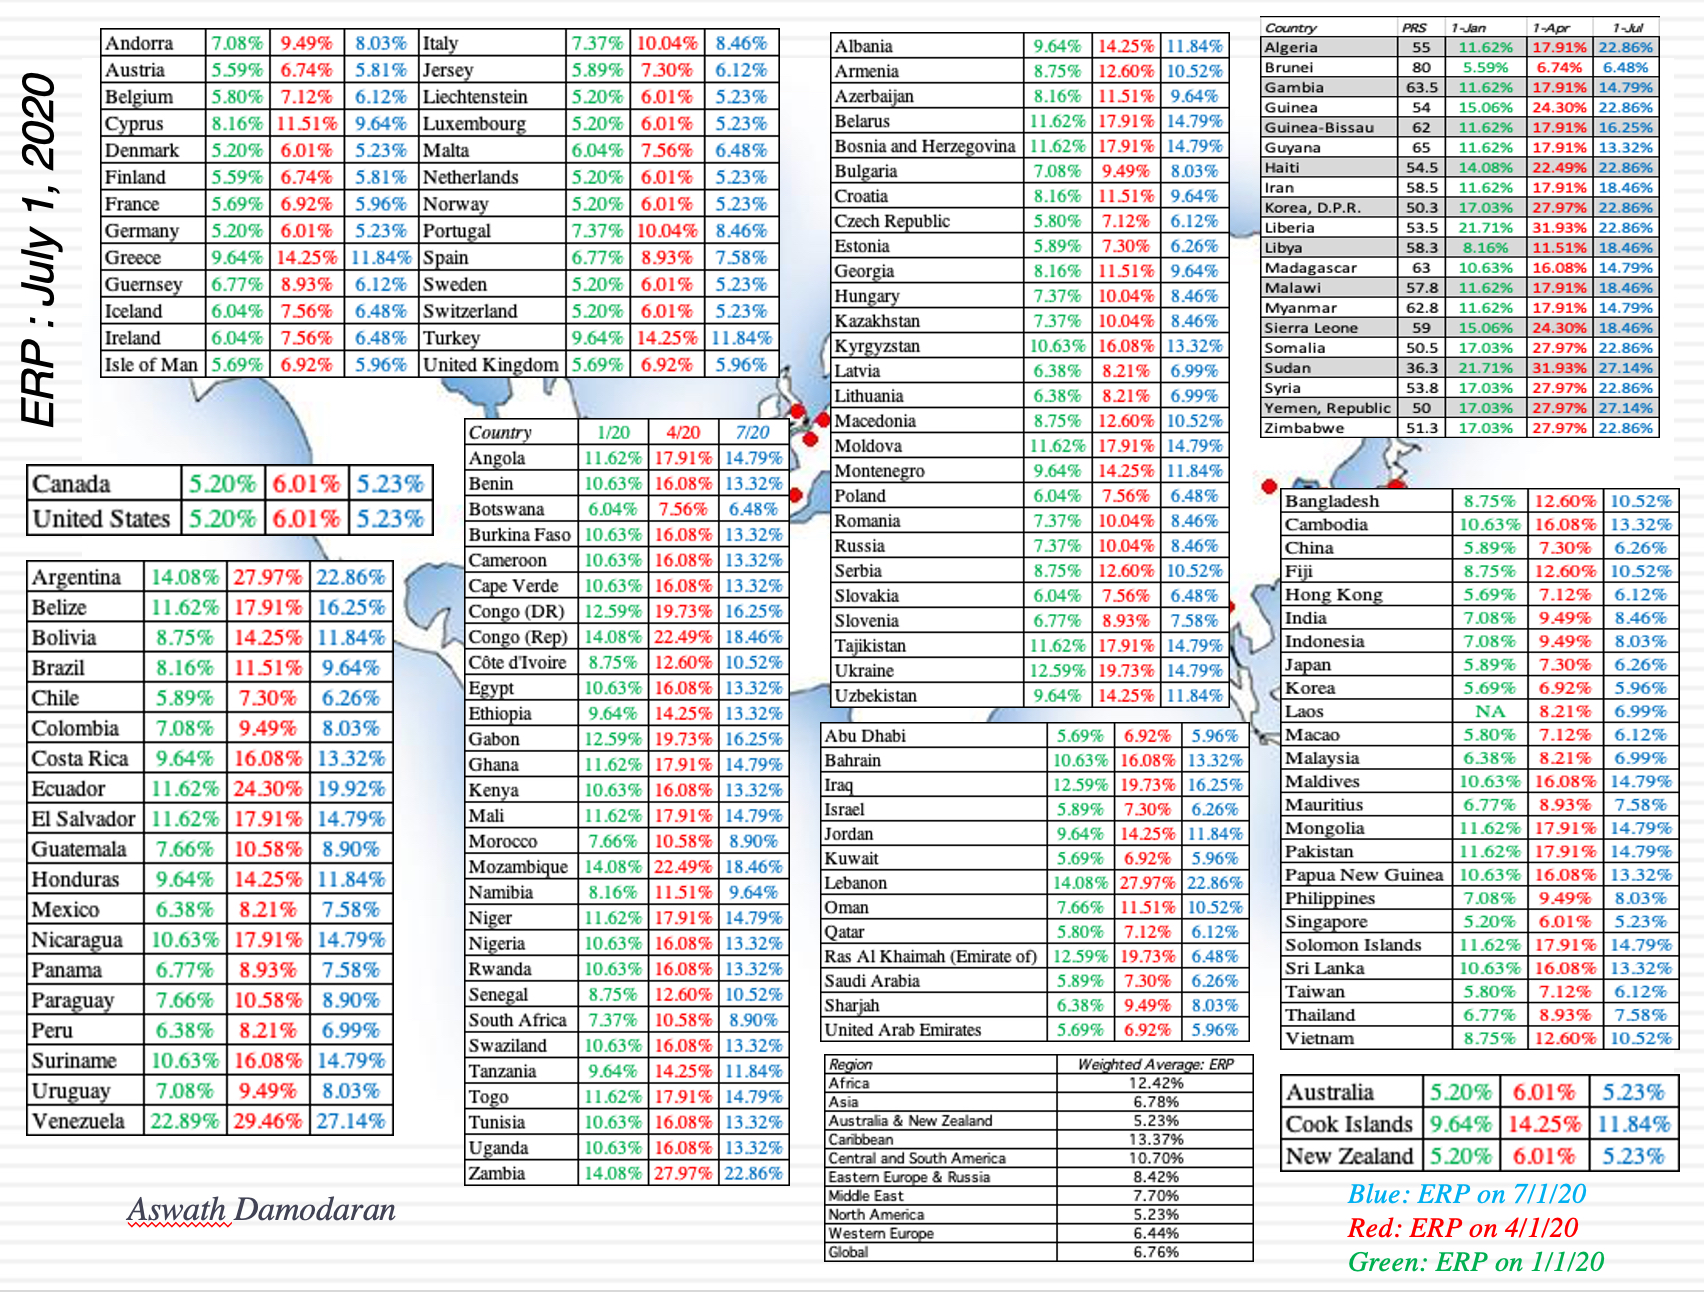 Download the data
With each country, I report three numbers, an equity risk premium from the start of 2020 (reflecting pre-crisis values), from April 1, 2020, at the height of the market meltdown, and from July 1, 2020, as capital has returned. Just to illustrate, Brazil saw its equity risk premium rise from 8.16% on January 1, 2020, to 11.51% on April 1, 2020, before dropping back to 9.64% on July 1, 2020. Put simply, risk capital has returned to the riskier emerging markets, though the return has not been as complete as it has been in the US.
Risky Debt Much of the discussion about risk capital so far has been focused on equity markets, but there is risk capital in other markets as well. In the private lending market, risk capital is what supplies debt to the companies most in need of it, often distressed, and in the corporate bond market, it manifests itself as demand for the riskiest corporate bonds, usually below investment grade.
The COVID Effect - Early DaysIn the first few weeks of the crisis, the key concern that investors had about the economic shut down was whether companies that carried significant debt loads would be able to survive the crisis. This fear manifested itself not only in concerns about bankruptcies, but also in government bailouts to save companies that were most exposed, such as airlines. There was also talk of how this crisis could spread to other sectors burdened with debt, and put the banking system at risk. It is these fears that led the Fed to announce on March 23, 2020, that it would be provide a backstop in the corporate lending market, proving loans to companies in distress and buying corporate bonds. There is debate about whether the Fed should be playing this role, but it cannot be denied that this action, more than any other by any entity (government or central bank) during this crisis, changed its trajectory. It is not a coincidence that Boeing which had been having trouble raising debt, in early March, was able to borrow $25 billion in the corporate bond market a few weeks after the Fed's announcement. In fact, as you will see in the section below, the Fed's announced opened the flood gates for corporate bond issuances and caused a turnaround in corporate bond yields.
The COVID Effect - Corporate Bond IssuancesIn the corporate bond market, risk capital is the lubricant that provides liquidity in the high yield bond market, and allows companies that are below investment grade to continue raising capital. Not surprisingly, during crises, it is this portion of the corporate bond market that is affected the most, with yields climbing and new bond issues becoming rarer. You can see this phenomenon play out in the graph below, where I look at corporate bond issuances by year:
 Download data
During the 2008 crisis, bond issuances declined across the board in the last quarter of 2008 and the first quarter of 2009, but the drop was much more precipitous for high yield portion. During the COVID crisis, the numbers look very different:

After a brief pause in issuances in the first few weeks (between February 14 and March 20), bond issuances returned stronger than ever, with high yield bond issuances hitting an all-time high (in dollar value) in June 2020. For the moment, at least, the Fed's backstop bet has paid off in the bond market.
The Price of Risk (Bonds)As with the equity market, there is a market measure of access in risk capital in the bond market, and it takes the form of default spreads. During a crisis, as risk capital leaves, you see spreads increase, as was the case in the last quarter of 2008:

Default spreads increased across the board for bonds in every ratings class, but much more so for the lowest rated bonds during the 2008 crisis. To provide a contrast, I looked at default spreads for bonds in seven ratings classes on February 14, March 20 and July 17:

As in 2008, default spreads surged between February 14 and March 20, as the crisis first took hold, but unlike 2008, the spreads have rapidly scaled down and are now lower for the higher investment grade classes than they were pre-crisis and only marginally higher for the lowest rated bonds.
Explaining the ResilienceIf you accept the evidence that risk capital has stayed in the market during this crisis, in contrast to its behavior in prior crises, the follow-up question is why. For some of you, I know the answer is obvious, and that is that this market recovery has been engineered and sustained by central banks. While there is some truth to the "Fed did it" argument, I think it is too facile and misses other ingredients that have contributed.Central Banks: Earlier in this post, I noted that the turnaround in this market can be traced to the Fed's announcement on March 23, that it would provide a backstop to the corporate bond/lending market. That said, the actual amount spent by the Fed on these programs has been modest, as can be seen in this graph:
 Source: Financial Times
While there is a healthy debate to be had about whether central banks have become too activist, I believe that the Fed's corporate backstop announcement is the type of action you want central banks to take, since in its absence, bankruptcies and bailouts would have been the order of the day. In fact, the very fact that the Fed has actually not needed to use it is evidence that it worked, since private lenders stepped in to fill the gap. I concede that some risk taking investors will take the wrong cues from this action, expecting that the Fed will protect them from the downside, while they take advantage of the upside. Investor Composition: The Fed's actions worked as well as they did because investors in both equity and bond markets responded quickly and substantively, and that response may reflect the changed composition of investors today. First, markets have become much more globalized, and investors are much more willing to invest across markets, with money moving from equity to debt markets, and across geographies, much more easily than it used to. Second, the investment world has flattened, as retail investors (the so called stupid money) catch up to institutional investors (smart money?) in terms of access to information, data and tools and are more willing to deviate from conventional wisdom. Unique Crisis: As I have noted in prior posts, this has been an unusual crisis, in terms of sequencing. Unlike prior crises, where market meltdowns came first and the economic damage followed, in this one, the economic shutdown, precipitated by the virus, came when markets were at all-time highs and risk capital was widely accessible. It is possible that risk capital, for better or worse, believes that this is crisis comes with a timer, and that economies will revert back quickly once the virus passes, and shut downs end.Change in Corporate Structure: After two decades of disruption, it is quite clear that center of gravity has shifted for both economies and markets, with the bulk of the value in markets coming from companies that are very different from the companies that dominated the twentieth century. While much is made of the fact that the biggest companies of today's markets (in market capitalization terms) derive their value from intangible assets, I think the bigger difference is that these companies are also less capital intensive and more flexible. That flexibility, allowing them to take advantage of opportunities quickly, and scale down rapidly in the face of threats, limits downside and increases upside. At the risk of using a buzz word, there is more optionality in the biggest companies of today, making risk more an ally than an enemy for investors, and with options, risk can sometimes be more ally than enemy.Five months into this crisis, I am still learning, and there is much that we still do not know about both the virus and markets.
YouTube Video<iframe width="560" height="315" src="https://www.youtube.com/embed/Oyq13Ac..." frameborder="0" allow="accelerometer; autoplay; encrypted-media; gyroscope; picture-in-picture" allowfullscreen></iframe>
Data
Market data (July 17, 2020)Regional breakdown - Market Changes and Pricing (July 17, 2020)Sector breakdown - Market Changes and Pricing (July 17, 2020)Industry breakdown - Market Changes and Pricing (July 17, 2020)Market Changes and Pricing by classes: PE, PBV, Size, Growth, Age, Debt, Div YldRisk Capital (VC, IPO and Bond Issuances) during crisisEquity Risk Premiums for S&P 500, by day: Feb 14, 2020- July 17, 2020Equity Risk Premiums for countries: July 1, 2020Viral Market Update PostsA Viral Market Meltdown: Fear or Fundamentals?A Viral Market Meltdown II: Pricing or Valuing? Investing or Trading?A Viral Market Meltdown III: Clues in the Market DebrisA Viral Market Meltdown IV: Investing for a post-virus EconomyA Viral Market Meltdown V: Back to BasicsA Viral Market Meltdown VI: The Price of RiskA Viral Market Meltdown VII: Market MultiplesA Viral Market Meltdown VIII: Value vs Growth, Active vs Passive, Small Cap vs Large!A Viral Market Meltdown IX: A Do-it-Yourself S&P 500 ValuationA Viral Market Meltdown X: A Corporate Life Cycle PerspectiveA Viral Market Meltdown XI: The Flexibility Premium
July 2, 2020
A Viral Market Update XI: The Flexibility Premium
Market UpdateIf you have been reading all of my viral market updates during this crisis, I admire your fortitude, and I know that you will get a sense of deja vu, as you read this section, since I follow the same road map on each of them. I start, as always, by looking at US dollar returns on selected equity indices around the world:
 Download data
Looking at the entire time period (2/14-6/26), US equity indices have done better than European equity indices, with a strong rebound from the lows of March 20 allowing for a complete recoupment of losses in the NASDAQ and an almost complete retracing for the S&P 500. Asian equities have diverged, with Japan and China performing better than India. As equities have seesawed, US treasury bonds have stabilized, after a steep drop in yields in the first four weeks of the crisis:
 Download data
The treasury rates have settled in, at least for the moment, at close to zero at the short end of the maturity spectrum and at about 0.65-0.75% for the 10-year bonds and 1.2-1.4% for 30-year bonds. I know that there is a widely held view that it is the Fed that has engineered the rate drop, but note that much of the decline occurred before the Fed made its quantitative easing announcements in mid-march. I think that the Fed’s real impact has been on private lending, with its March 23rd announcement that it would operate as a backstop in corporate bond and lending markets. You can see the effects of that announcement on default spreads for corporate bonds, across ratings classes:
 Download data
Note the climb in default spreads between February 14 and March 23, with investment grade (BBB) rated bonds almost tripling during that period, and the pull back in spreads since, to end at levels higher than on February 14, but well below the March 23rd levels. Mirroring the changes in the price of risk in the corporate bond markets, the price of risk in equity markets (measured with an implied equity risk premium) has been on a wild ride, rising dramatically between February 14 and March 23, before sliding down towards pre-crisis levels:
 Download dataAt one level, the fact that equity risk premiums are above 5% and well above historic norms (4.86% between 2000-2019 and 4.20% between 1960-2019) may seem comforting, but there is a disconcerting component to these expected values. The equity risk premium of 4.83% on February 14 was earned on top of a ten-year bond rate of 1.59%, yielding an expected return of 6.42% on equities, already low by historic standards. The equity risk premium of 5.23% on June 30 was earned over and above a ten-year bond rate of 0.66%, yielding an annual expected return of 5.89% on equities for the long term, a number well below the 7-8% that investors were pricing stocks to earn during much of the last decade. Paraphrasing Winston Churchill, equities don't look good as an investment class, until you compare them to the alternatives.
Looking at oil and copper, the two economically-sensitive commodities that I have tracked through this crisis, the divergence between the two remains, with oil prices down almost 30% since February 14 and copper prices up 4.31% since that date:
 Download data
Finally, I keep tabs on gold, a crisis investment of long standing, and bitcoin, a more recent entrant into the game.
 Download data
If this were a contest for a crisis asset, gold wins by a knock out, since bitcoin, at least during this crisis has moved with stocks, dropping more than 50% between February 14 and March 20 and rising more than 70% from its lows after March 20. It is possible that bitcoin can still live up to the promise of being a good currency, but it has not even come close to being one yet, snd if you are a Bitcoin advocate, you have your work cut out for you.
Equities: An OverviewI stick with my practice of downloading the market capitalizations of all publicly traded companies in the world, and then computing aggregated changes in value by groupings. In my first grouping, I look at how equities have performed across the regions of the world:
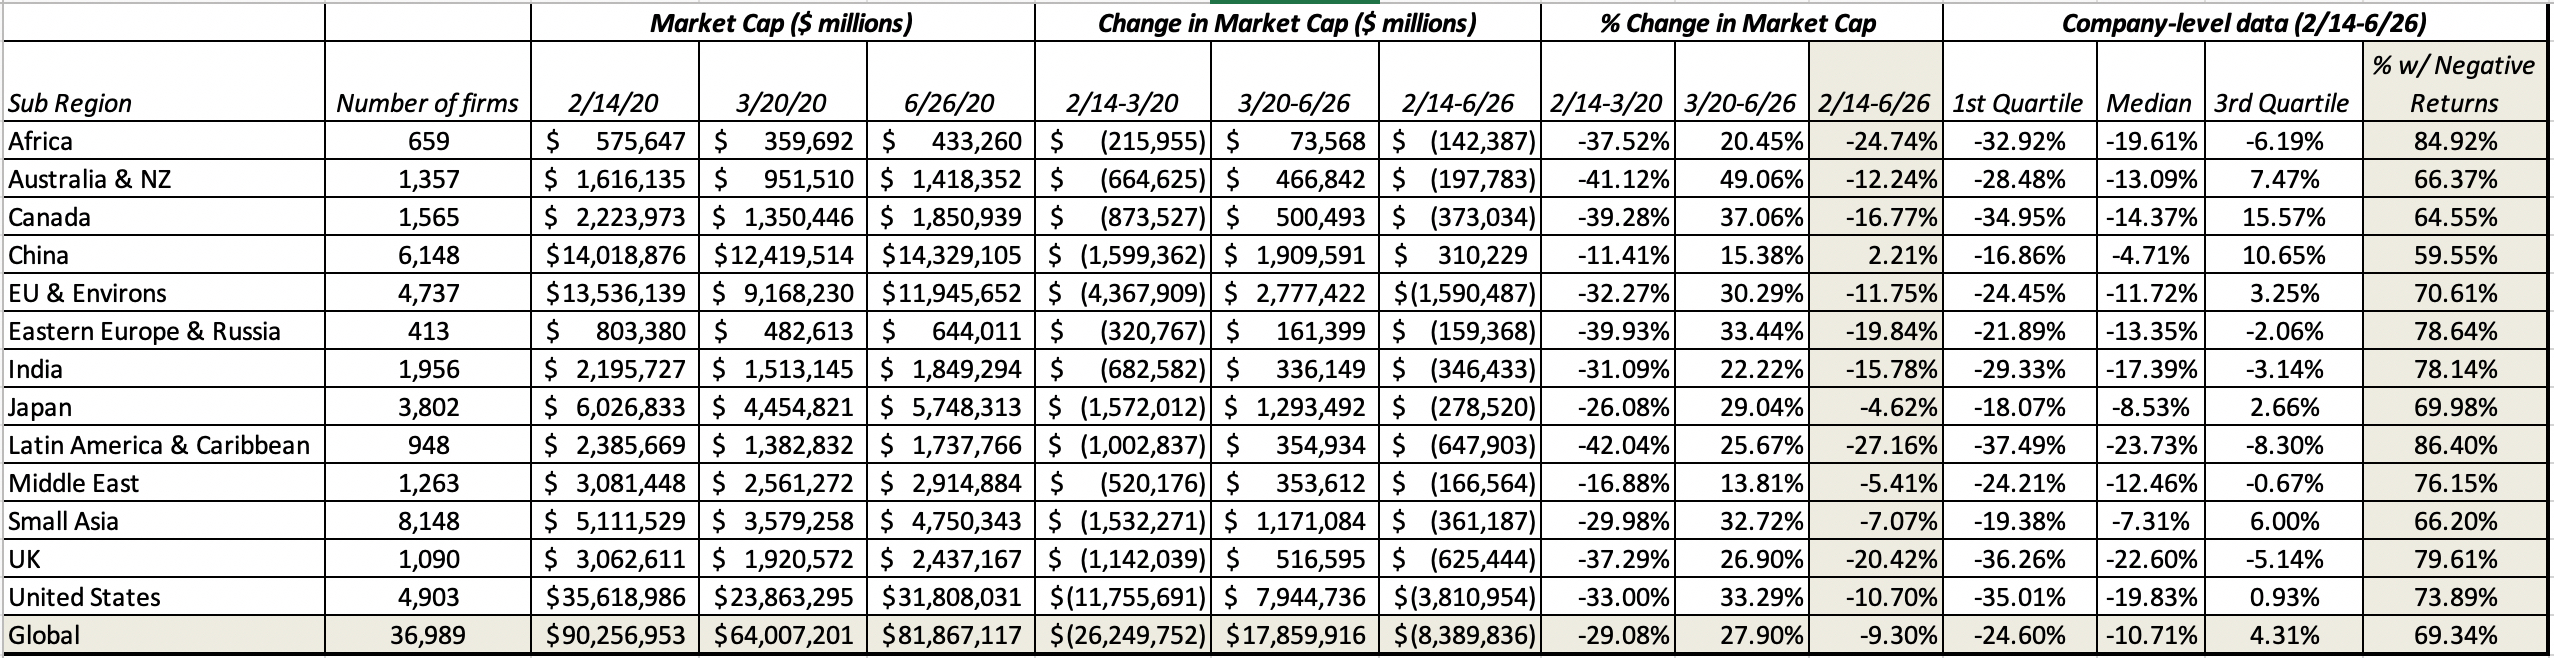 Download data
Looking at percentage change in aggregate market capitalization between February 14 and June 26, global equities have lost 9.30% of their value ($8.4 trillion), but that is quite a comeback from the 29% loss ($26.3 trillion) recorded on March 20. Emerging markets in Africa, Latin America and Eastern Europe show far more damage than developed markets over the entire period (February 14-June26), though the UK is an exception, down almost 20%. Breaking down the market action by sector:
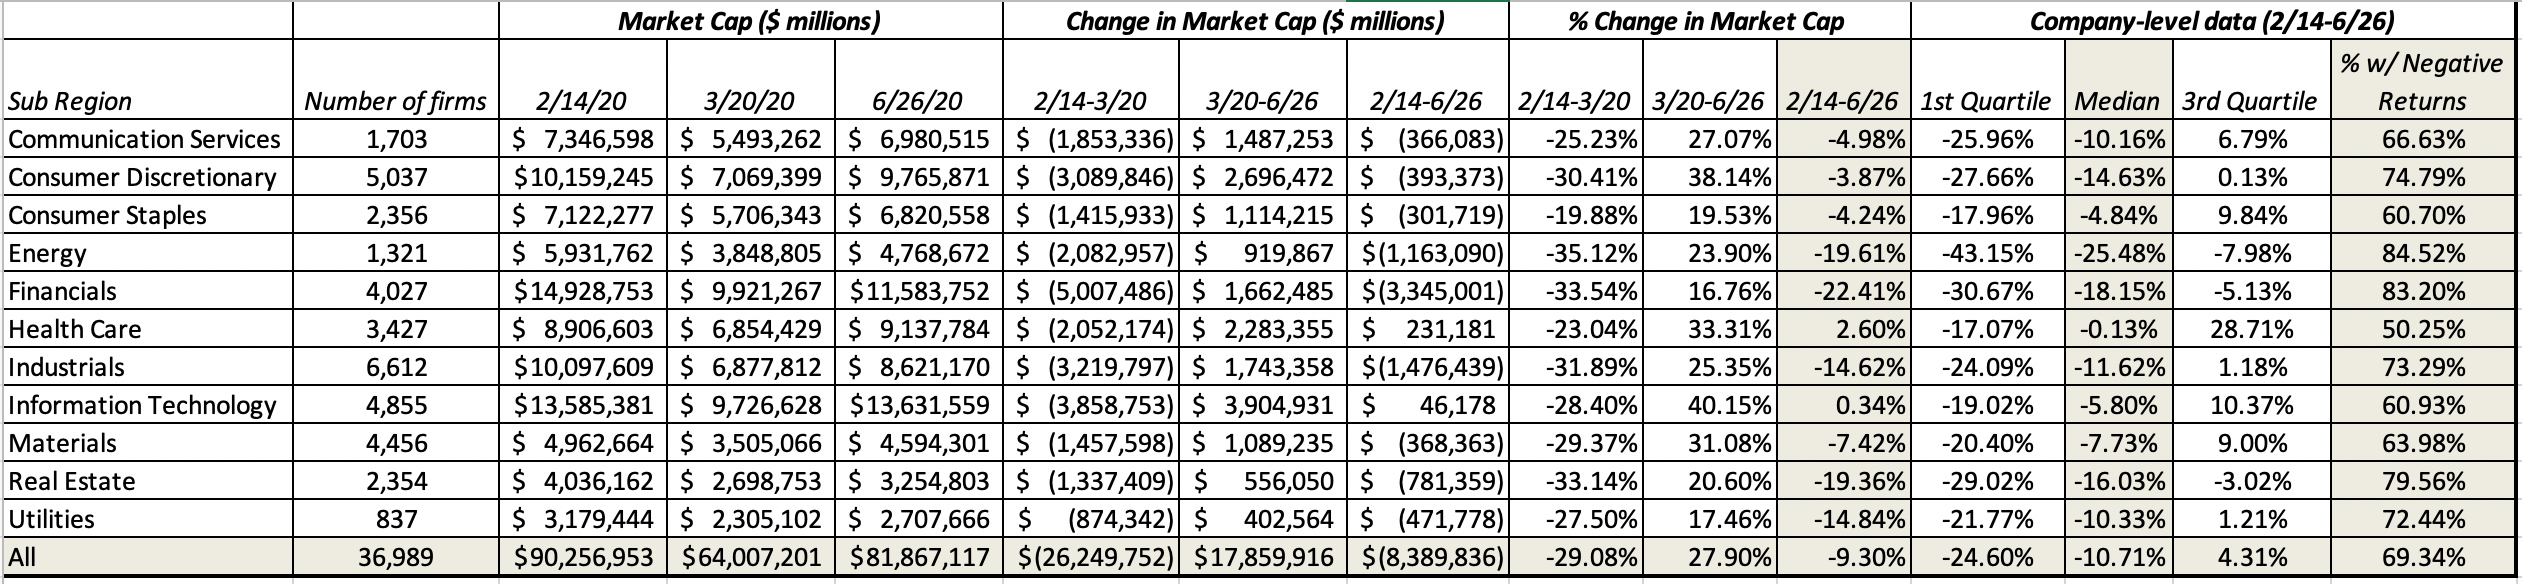 Download data
If you were primarily invested in technology and health care, your reaction to the crisis might be "What crisis?", since those sectors are now ahead of where they were on February 14, and consumer product companies (both discretionary and staple) are not far behind. Energy and real estate have lagged the market, as have utilities, but financials remain the worst performing sector remains. If you look at the last four columns, you can see that even in sectors that have held their own during this period, the recovery has been uneven, with more stocks down than up in every sector. Finally, I break down sectors into industries, and list the ten worst and best performing, in terms of market cap change from February 14 to June 26:
 Download dataAs in my prior week updates, there is a preponderance of infrastructure and financial services in the worst performing industry list, and a dominance of health care and technology on the best perfuming list. Education is a new entrant into the best performing list, perhaps reflecting the promise and potential of online education.
The Flexibility StoryAs the market makes its way back from its lows, it remains an uneven one, with wide divergences between winners and losers, and in my earlier posts, I have looked for clues in the data. In my fourth post from March 23, I noted that heavily indebted companies have under performed companies with lighter debt loads, and in my eighth post from May 13, I highlighted the fact that growth stocks are outperforming value stocks. In my last post from June 19, I used the concept of a corporate life cycle, and noted that younger companies seems to be doing much better than older companies. Others have noted that capital intensive businesses seem to have been worse affected during this crisis than capital-light businesses, and early in the crisis, buybacks were highlighted as a reason why some companies and sectors were doing worse than others. In fact, the new buzzword that business consultants are pushing is "resilience", arguing that the resilient companies have weathered this crisis better than the rest of the market. While there is some truth in all of these contentions, I would argue that if there is one quality that ties together all of these seemingly disparate factors, it is flexibility , and this crisis has reaffirmed the value of flexibility.
Flexibility across the Business ModelSimply put, the flexibility of an organization measures the speed and cost with which it responds to changed circumstances, with more flexible firms adjusting faster and at lower cost than less flexible firms. That definition, though, encompasses a range of actions that stretch across every aspect of business, covering everything from how investments are made, to how the business is operated, to how it is funded, and finally to how much cash is returned to owners (in the form of dividends and buybacks).
a. Investment FlexibilityTo grow, businesses have to reinvest and investment flexibility measures how much they have to reinvest to deliver a given growth rate, and how long it will take for the investment to pay off.
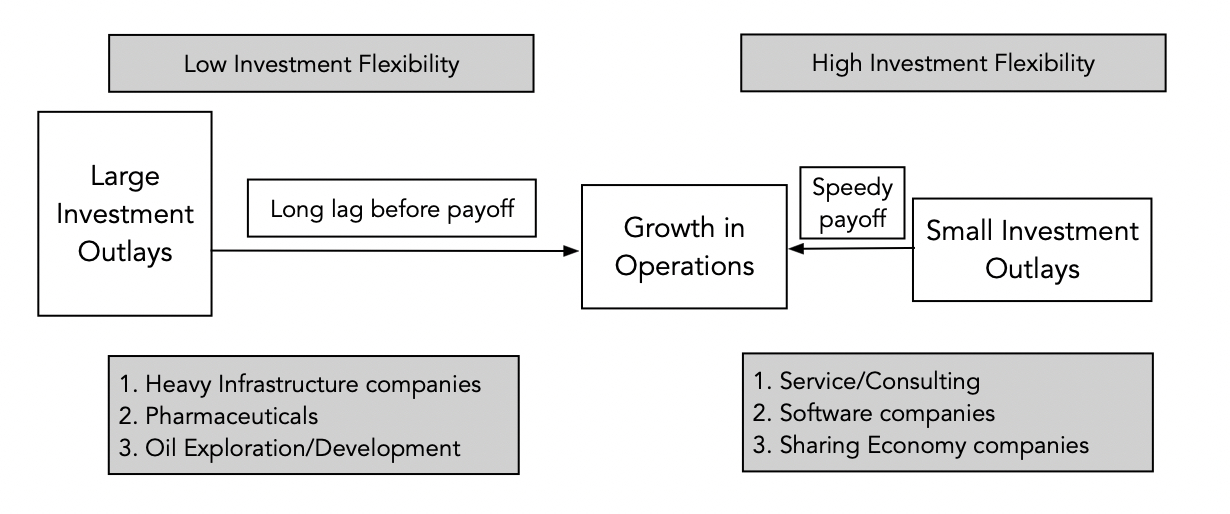
While it is true that companies that are in businesses that require heavy infrastructure investment (toll roads, telecommunications, automobiles) have low investment flexibility, and service and software firms generally have high investment flexibility, the divide is not necessarily on whether the investments are in tangible or intangible assets. Pharmaceutical companies, for instance, have low investment flexibility because they have to spend large amounts in R&D, with significant leakage (as some R&D will not pay off) and have to wait long periods before commercial success. Over the last decade, disruption in many businesses with a history of low investment flexibility has come from new entrants with business models that allow them to scale up quickly, with relatively low investment. Uber and Airbnb are examples of sharing economy companies that have had a decisive advantage this dimension over their established competitors. To see how this crisis has played out on the financial flexibility dimension, I classified all non-financial service companies listed globally, based upon the ratio of sales to invested capital, on the (questionable) assumption that invested capital (computed from the accounting balance sheet values of debt, equity and cash) measures reinvestment, into ten deciles:
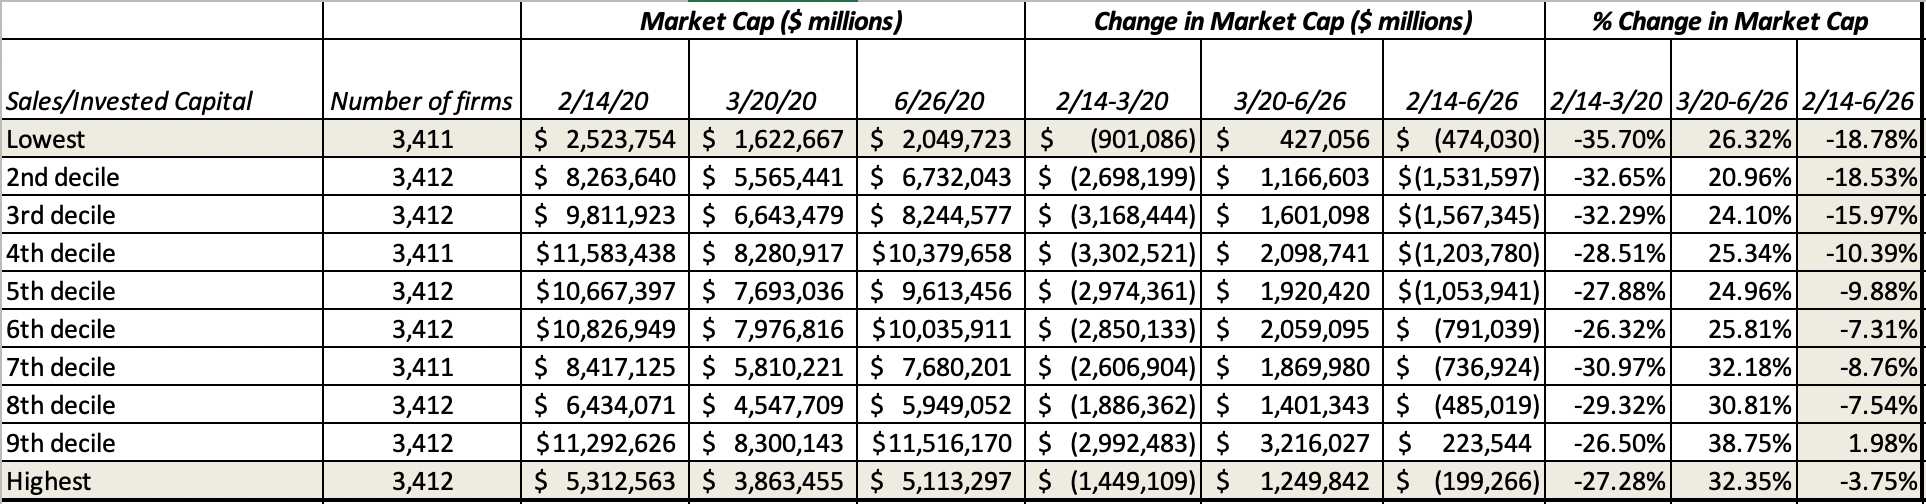 Download dataNote that companies that can generate the most revenues per dollar of invested capital are signaling the highest investment flexibility and they have done far better during this crisis than firms that are in lowest decile of this measure. Some of this may be spurious correlation, but it is an interesting first take on how investment flexibility has been treated by the COVID market.
b. Operating FlexibilityDuring the course of operations, businesses will be hit by shock that cause their revenues to unexpectedly increase or drop, and operating flexibility measures how those revenue changes flow through into operating profitability. The key to decoding this effect is to break down the operating expenses of a company into fixed and variable, with the latter moving up and down with revenues, while the former stays fixed:

Companies with high fixed costs, as a percent of revenues, will see much more dramatic swings in operating income, as revenues change, than companies that have more flexible cost structures. It is not surprising, therefore, that airlines have wild swings in profitability from good years to bad ones, whereas online retailers and service businesses have more muted effects. To see how operating flexibility has played out in this market, I would have liked to have broken costs down into fixed and variable for all companies, but lacking clean accounting measures of either, I settled for gross profit margins, on the assumption that companies with high gross margins have far more flexibility in dealing with revenue shocks than companies with low margins. Breaking down companies based upon gross margin into deciles, here is what I find:
 Download data
With a full admission that gross margin is a flawed measure of operating flexibility, companies with higher gross margins have done better than companies with lower gross margins, as this crisis has unfolded.
c. Financing FlexibilityAs revenues go up and down, and operating income tracks those changes, financial flexibility measures how much net income (to equity investors) is altered, with firms with low financial flexibility showing much bigger swings in net income for a given change in operating income. The key drivers of financial flexibility are debt obligations and cash holdings, with the interest expenses on the former pushing up net income volatility, and the interest income from the latter dampening that volatility:
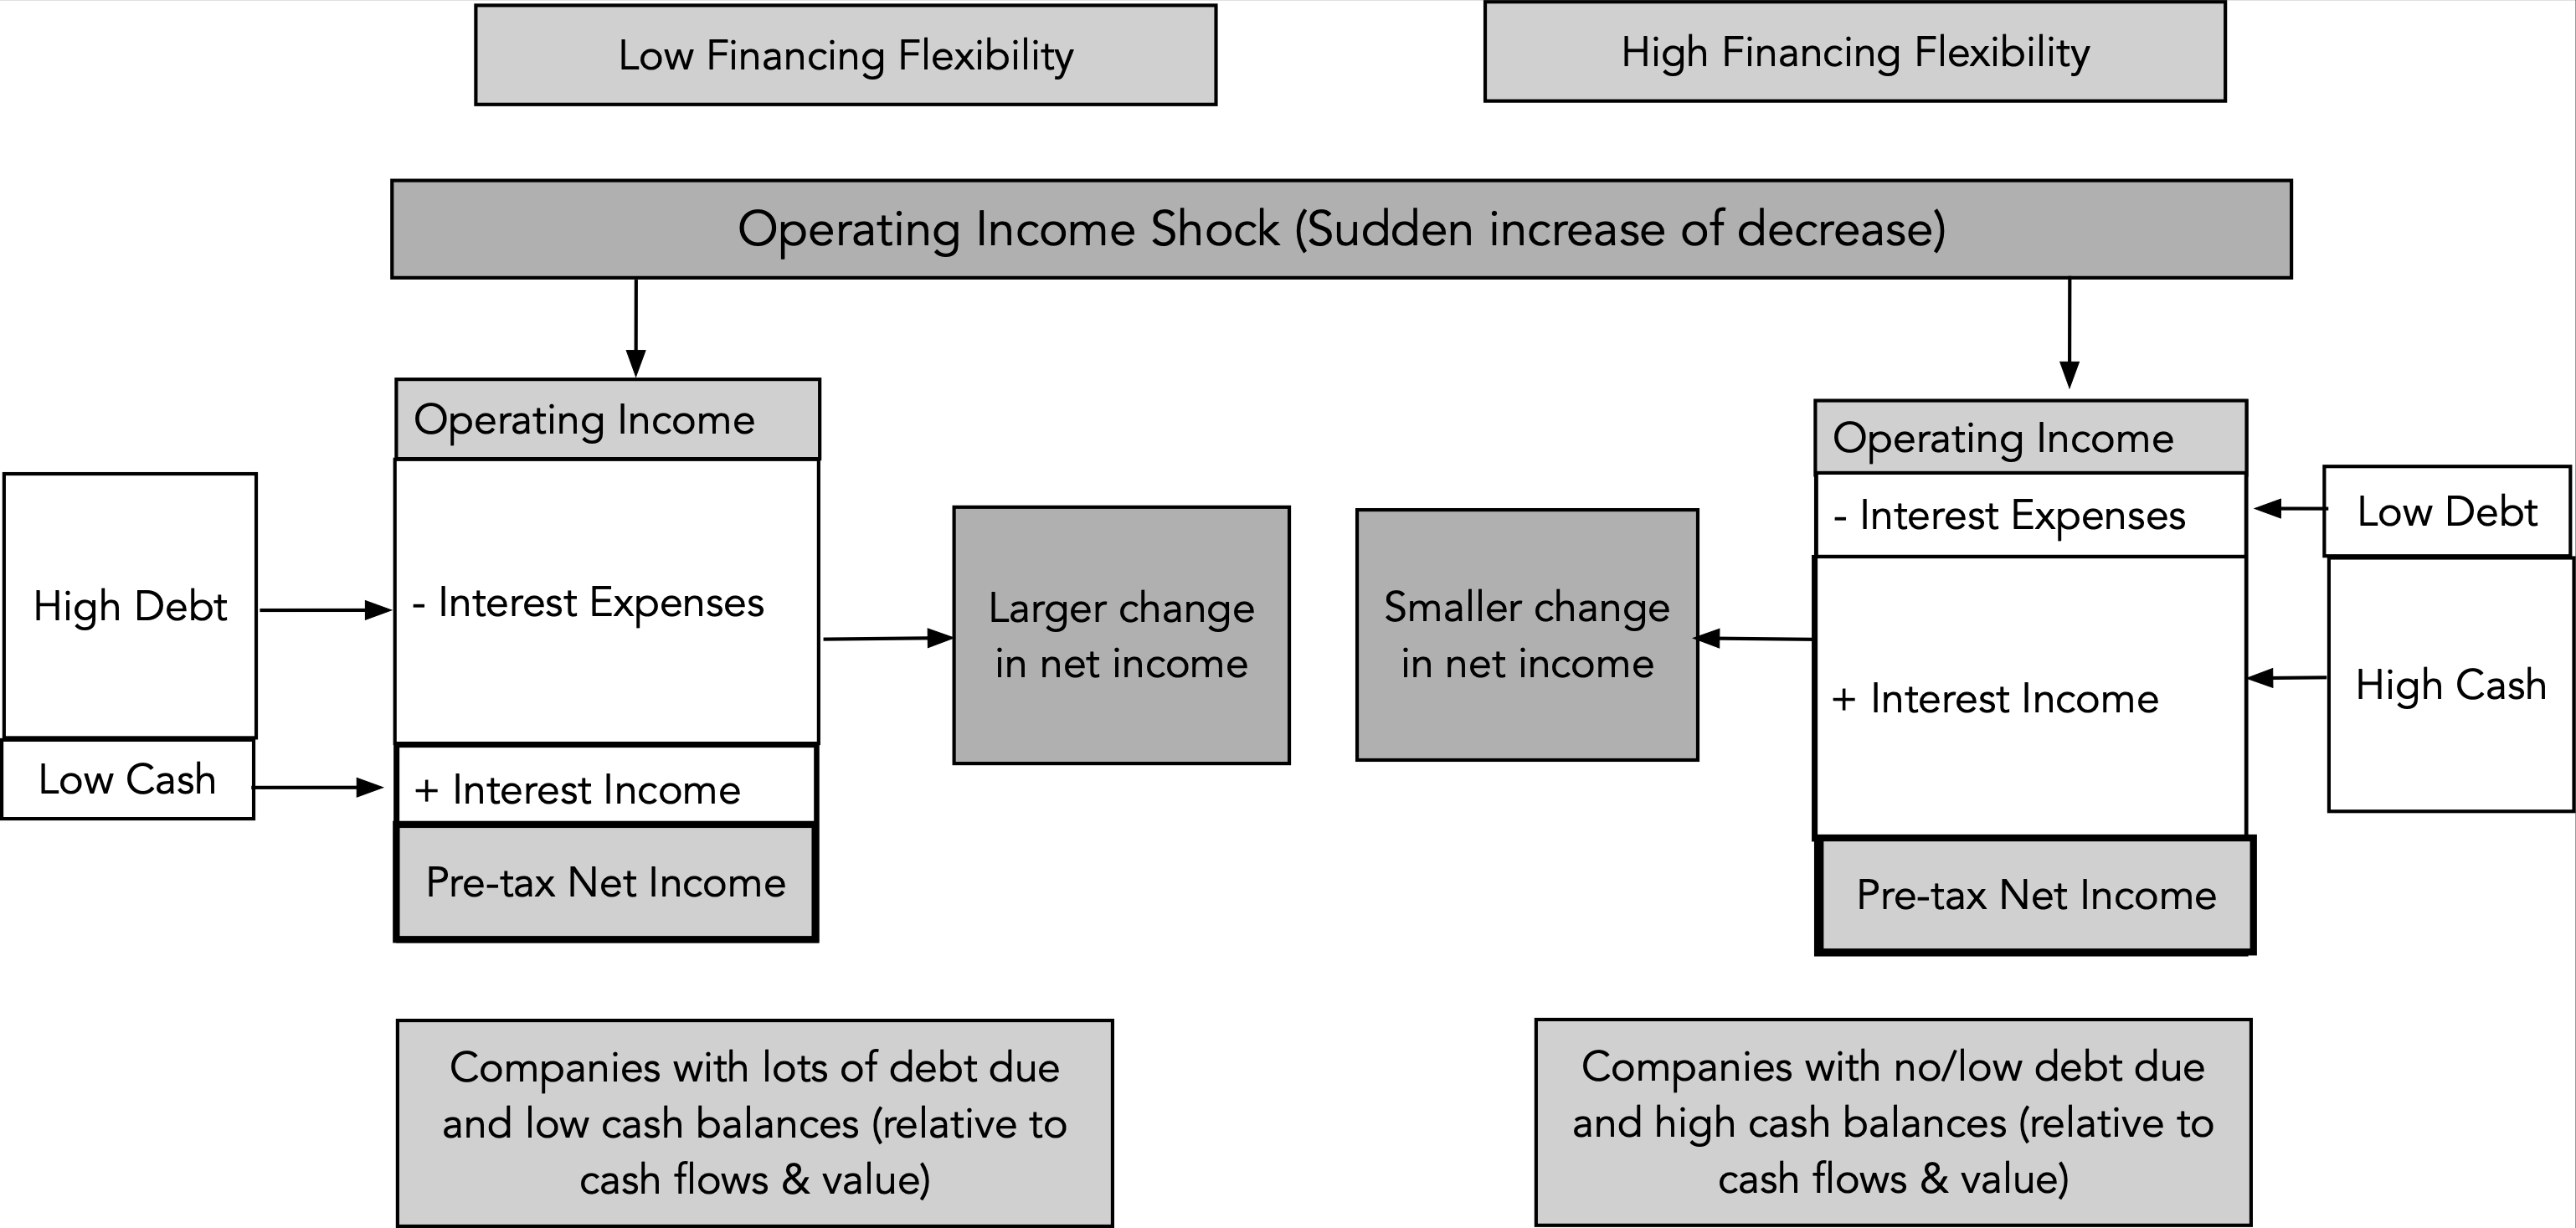
If net debt, as a percent of cash flows or value, is the driver of financial flexibility, we can see how financial flexibility has played out in this crisis by breaking companies down into deciles based upon Net Debt as a multiple of EBITDA:
 Download dataCompanies with high net debt ratios have low financial flexibility and they have been damaged far more than companies with low net debt ratios. Note that the lowest decile of net debt ratios includes firms that have negative net debt, i.e., cash balances that exceed the debt, and they show an increase in market capitalizations between February 14 and June 26.
d. Cash Return FlexibilityThe end game, when investing in publicly traded company stocks, is to collect cash flows from that investment, and companies have two choices when it comes to returning cash. The conventional approach has been to pay dividends, but over the last three decades, US companies in particular have turned to returning cash in the form of buybacks. Both dividends and buybacks have to be funded by cashflows to equity investors, and cash return flexibility measures how quickly companies can adjust their cash returns to reflect changes in cash flows to equity:

Obviously, companies that return little or no cash, relative to their free cash flows to equity, are not only accumulating cash, but have far more cash return flexibility than companies that return a large proportion of their cash flows. Since dividends still remain the primary mechanism for returning cash across the world, I start by looking at dividend yield, classified into deciles, and looking at the market action in each decile for global companies:
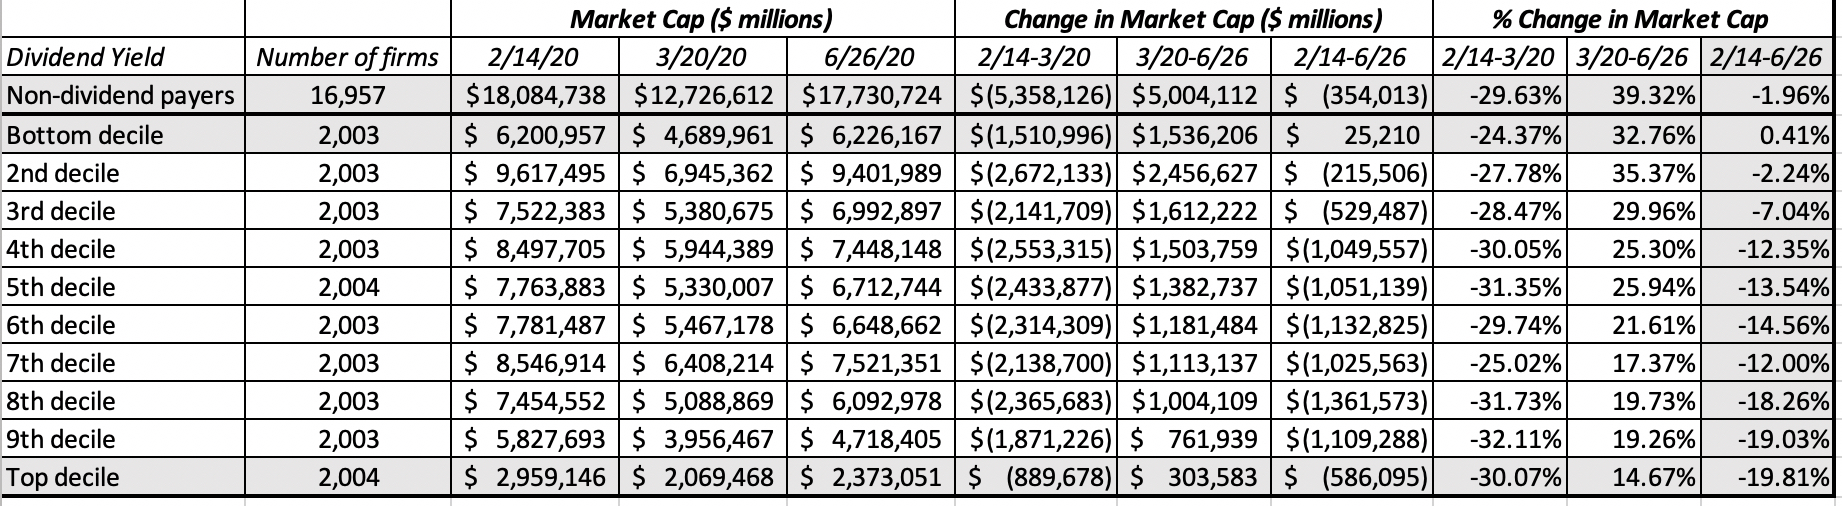 Download data
Clearly non-dividend paying stocks and stocks with low dividend yields have done much better than companies with high dividend yields. Among companies that do return large portions of cash, those that return the bulk of their cash flows in the form of dividends have far less flexibility than those that buy back stock, mostly because dividends are sticky, since once they are initiated and set, companies are reluctant to change them. To examine whether the mode of cash return has been a factor in the market action, I break companies into four groups based upon whether they pay dividends and/or buy back stock:

While companies that pay both dividends and buybacks have been worst affected and companies that use neither have performed the best over the period, isolating only companies that pay only dividends or buy back stock, companies that pay only dividends have under performed companies that buy back only stock. While the results are only indicative, they do suggest that making buybacks the bogeyman in this crisis is not backed up by the evidence.
Implications and ConclusionDuring this crisis, markets have rewarded flexible companies, a continuation of a trend that predate the crisis to the last one. If the last decade has been a disruptive one, that disruption has been largely driven by companies that have not only built flexible structures, but also used that flexibility to gain competitive advantages over their status quo competitors. As companies get pushed to increase flexibility, it is worth noting that this quest comes with costs, and these trade offs have to be acknowledged:Compressed Corporate Life Cycle: Earlier in this post, I argued that one of the benefits of having high investment flexibility is that companies can scale up faster; Uber and Airbnb have been able to go from start ups to large companies (at least in terms of operations and value) in very short time periods. However, the same forces that allow these companies to scale up faster also create business models which are more difficult to defend against new competitors, leading to shorter periods of maturity and more speedy decline, with important consequences.
 Losses on the upside: With operating and financial flexibility, the trade off is much simpler, since companies with greater operating and financial flexibility will be more protected on the downside, but at the expense of giving up some of the upside. Having large fixed costs and/or high net debt will result in bigger losses when times are bad, but it will also create larger profits on the upside.Social costs: As new business models are built to have motor flexibility, some of the actions that increase flexibility come with costs that are borne by society, rather than the company. For instance, Uber's business model of treating drivers as independent contractors rather than employees gives the company a more flexible cost structure, but it does pass on the costs of providing a safety net (health care and pensions) to society. As a society, we need to debate whether the benefits we gain by having a more nimble economy outweigh the social costs. YouTube Video<iframe width="560" height="315" src="https://www.youtube.com/embed/215r6v4..." frameborder="0" allow="accelerometer; autoplay; encrypted-media; gyroscope; picture-in-picture" allowfullscreen></iframe>
Data
Market data (June 26, 2020)Regional breakdown - Market Changes and Pricing (June 26, 2020)Country breakdown - Market Changes and Pricing (June 26, 2020)Sector breakdown - Market Changes and Pricing (June 26, 2020)Industry breakdown - Market Changes and Pricing (June 26, 2020)Investing Flexibility (Sales to Cap) breakdown: Market Changes and Pricing (June 26, 2020)Operating Flexibility (Gross Margin) breakdown: Market Changes and Pricing (June 26, 2020)Financing Flexibility (Net Debt Ratio) breakdown: Market Changes and Pricing (June 26, 2020)Cash Return Flexibility (Dividend Yield) breakdown: Market Changes and Pricing (June 26, 2020)Viral Market Update PostsA Viral Market Meltdown: Fear or Fundamentals?A Viral Market Meltdown II: Pricing or Valuing? Investing or Trading?A Viral Market Meltdown III: Clues in the Market DebrisA Viral Market Meltdown IV: Investing for a post-virus EconomyA Viral Market Meltdown V: Back to BasicsA Viral Market Meltdown VI: The Price of RiskA Viral Market Meltdown VII: Market MultiplesA Viral Market Meltdown VIII: Value vs Growth, Active vs Passive, Small Cap vs Large!A Viral Market Meltdown IX: A Do-it-Yourself S&P 500 ValuationA Viral Market Meltdown X: A Corporate Life Cycle PerspectiveA Viral Market Meltdown XI: The Flexibility Premium
Aswath Damodaran's Blog

- Aswath Damodaran's profile
- 725 followers

