
Aswath Damodaran's Blog, page 10
October 4, 2021
The Indian Smartphone Revolution: Paytm's Coming of Age IPO!
A few weeks ago, I valued Zomato, the Indian online food delivery company, just prior to its IPO, and argued that the excitement about its potential was tied to the potential for growth in India and the shifting habits of Indian consumers. Since its public offering, Zomato's stock price has reflected that excitement, more than doubling from its offering price of 74 rupees per share. Waiting in the wings for its public debut, is Paytm, a company that in many ways is even more closely tied to India's macro story, drawing on the growth of online commerce in India and a willingness of Indian consumers to use mobile payment mechanisms. In this post, I will look at the levers that drive Paytm's value, and you can make your judgments on where you think this offering will lead in terms of valuation and pricing.
Setting the Table
As the Paytm IPO speeds to offering date, it is worth looking back at its relatively short history as a company, and how much change has been packed into that period. Since so much of Paytm’s success has been driven by the rise if smart phone usage among Indian consumers, and the concurrent rise in mobile payments for goods and services, I will start with a review of that rise, before looking at how Paytm has put itself in position to take advantage of that market shift.
The Rise of the Indian Smartphone User
India was late to join the smart phone party, held back both by the relative expensiveness of these devices, as well as the absence of affordable and reliable cell service in much of the country. In 2010, fewer than 2% of Indians had smart phones, with most of them being well off and living in urban areas. In the decade since, that has changed, as the smart phone market has exploded to reach hundreds of millions of Indians in 2020.
 Source: World Bank Database
Entering 2021, more than 500 million Indians had smart phones, making it the second largest smartphone market in the world (after China), but its penetration rate of less than 50% of the market gave it more room to grow. There are multiple forces that have contributed to this shift, but two stand out.
The first is that the costs of smartphones have decreased, and especially so in India, as technology and competition have worked their magic. In particular, the entry of Chinese brands, with Xiaomi and Vivo leading the charge, played a major role in making smartphones more affordable to Indians.The second is that cell service costs have also dropped, and in India, the drop in costs has been precipitous, after Reliance Jio entered the game in 2016, and quickly acquired 100 million subscribers by offering free voice and data calls over its 4G network. Today, Jio has more than 400 million subscribers, and while it remains a lightning rod for criticism, it is undeniable that it has played a major role in the evolution of the market. As smart phones have become ubiquitous in India, their usage has soared, partly because they are the only digital devices that many Indians have available to them to get online, and thus use to access social media, entertainment and shopping. By 2020, Indians ranked third in the world in how much time they were spending per day on their phones, with COVID contributing to a surge in that year: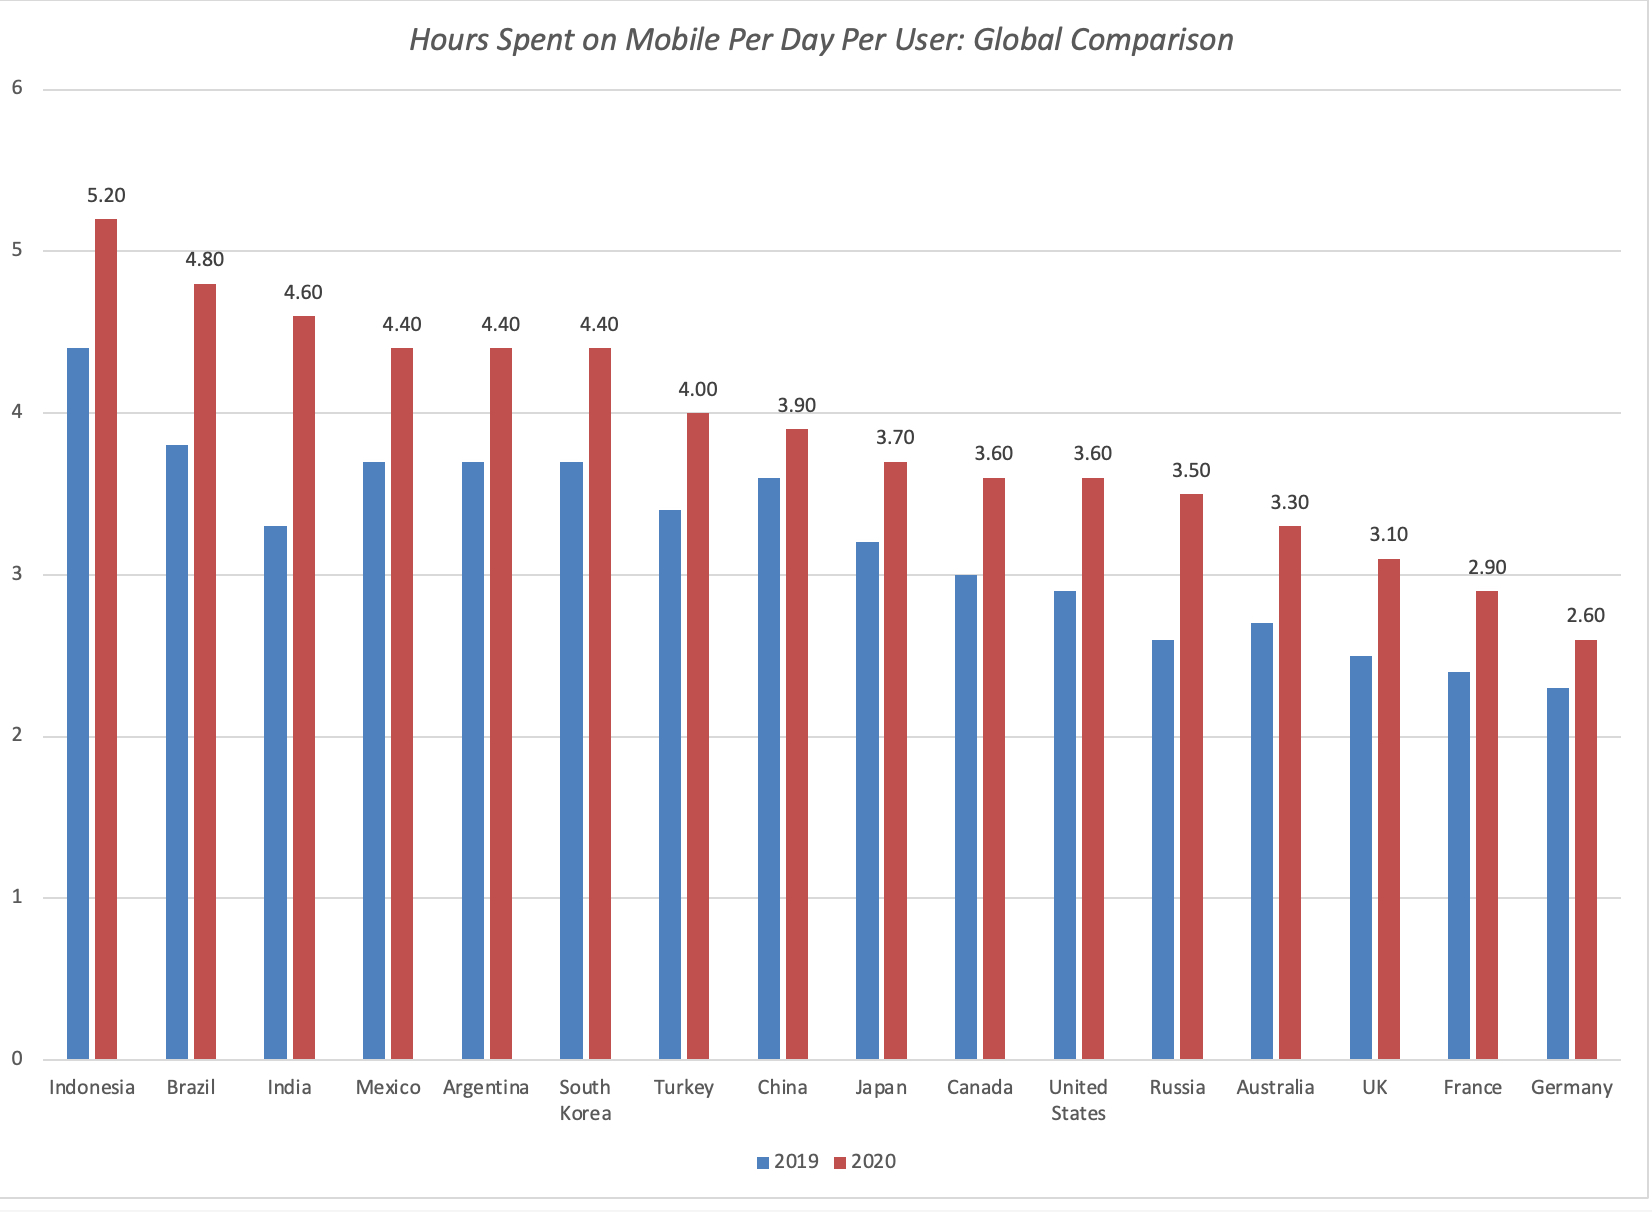 App Annie, State of Mobile 2021
Access to these smartphones, in conjunction with poor banking outreach in India, has created the perfect storm for a surge in mobile payments in India, and this graph bears out this trend:
 S&P, 2020 India Mobile Payments Market Report
Within the mobile payment space, there was also an external development that added to its acceleration, and that was the advent, in 2016, of United Payments Interface (UPI), a real-time payment interface devised by the National Payments Corporation of India, and regulated by the Reserve Bank of India, facilitating and speeding up inter-bank, person to person and person to merchant transactions.
Paytm: Operating History
The rise of Paytm (Pay through Mobile) as a company parallels the rise of mobile phones in India. When it was founded in in 2010 by by Vijay Sharma, it operated as a pre-paid mobile platform, but its market then was small both in terms of numbers and services offered. As mobile access improved, Paytm has relentlessly added to its suite of products. In 2014, it introduced Paytm Wallet, a digital wallet that was accepted as a payment option by leading service providers and retailers. In 2016, it added ticket booking to movies, events and amusement parks, with flight bookings soon after, and started Paytm Mall, a consumer shopping app, based upon Alibaba's Taobao Mall model. In 2017 it added Paytm Gold, allowing users to buy gold in quantities as little as 1 rupee, and Paytm Payments Bank, a messaging platform with in-Chat payments. In 2018, it added a Paytm Money, for investment and wealth management, and in 2019, it launched a Paytm for Business app for merchants to track payments. In short, over time, it has used its platform of users to launch itself into almost every online activity. As Paytm's product suite has expanded, its numbers reflect both its strengths and weaknesses, with four key statistics tracking its expansion.
The first is the number of users on its platform, using one or more of its many services. The transactions that these users make on the platform plays out in the gross merchandise value of all the products and services bought. The third is the take rate, i.e., the percentage of this gross merchandise value that Paytm records as its revenues. The last is the operating margin, it operating income (or loss) as a percent of operating income each year.The table below is my attempt to recreate how Paytm has performed on these key measures in recent years, with the caveat that some of the information (on users and GMV, especially prior to 2019) is cobbled together from claims by corporate executives, press reports and opaque disclosures from the firm. Take Rate = Revenues/ GMV
Looking at the numbers, we start to get a picture of Paytm, warts and all, over its lifetime. First, it is a growth company, if you define growth as growth in user count and number of transactions done on its platform, and perhaps in gross merchandise value. However, its growth in revenues has not kept track with those larger statistics, leading to a cynical conclusion that the company is adding new services and giving them away for nothing (or close to it) to pad its user/transaction numbers. Second, this is a company that seems to run on hyperbolic forecasts from its founders and top management, that are not just consistently higher than what the company deliver, but often by a factor of three or four. For instance, just to pick on one of many examples, Vijay Sharma claimed in an interview in 2019 with Business Standard that the company's GMV would be $ 100 billion (7500 billion rupees) by the end of the year, more than double what the company reported as GMV for that year or the next. Third, access to capital from its deep pocketed investors, especially Alibaba, seems to have made this company casual about its business model and profitability, even by young, tech company standards. In fact, there is almost never even a mention of profitability (or aspirations towards profitability) in any of the corporate soundbites that I was able to read. The picture that emerges of Paytm is that of a management that is too focused on racking up user numbers, and too distracted to care about converting those into revenues and profits, while making grandiose statements about its future. Using the corporate life cycle framework to assess Paytm, it resembles an adolescent with attention deficit issues, in its scattershot approach to growth and absence of attention to business details, and if you are an investor, you have to hope that going public will cause it to grow up quickly.
Paytm: Funding and Ownership
Paytm's ambitious growth plans have made it one of India's premier cash burning machines, and it has been able to pull these plans off, because it has found ample sources of capital to feed them. In the table below, I list Paytm's big capital infusions over its lifetime:

Along the way, there have been others who have provided capital to the firm (Reliance, Ratan Tata) who have exited as foreign investors, led by Alibaba and SoftBank, have muscled their way into the firm. Those capital infusions have naturally led to a diminution of the share of the company held by its founder, and the pie chart below lists the owners of Paytm, ahead of its IPO:
 Paytm Prospectus
Note that while the company's origins and business are in India, it is primarily a Chinese-owned company ahead of its IP0, with Ant Group, Alibaba and SAIF Partners (a Hong-Kong based private equity firm) collectively owning more than 50% of the shares, with the Softbank Vision fund as the next largest investor with 18%. Vijay Sharma's holdings in the company have dwindled to 15% of the company, and his tenure as CEO depends on whether he can keep his foreign shareholder base happy.
Paytm: Story and Valuation
With that lead in, the pieces are in place to value Paytm and I will start by laying out the value drivers for the company and follow with my valuation. In making this assessment, I will draw on the company's stated plans to raise money from the offering, though they may be altered as the company gets to its offering date.
The Story
The company's history provides some insight into the Paytm's value drivers, starting with a large and growing mobile payment market in India, and working down to the company's operating metrics.

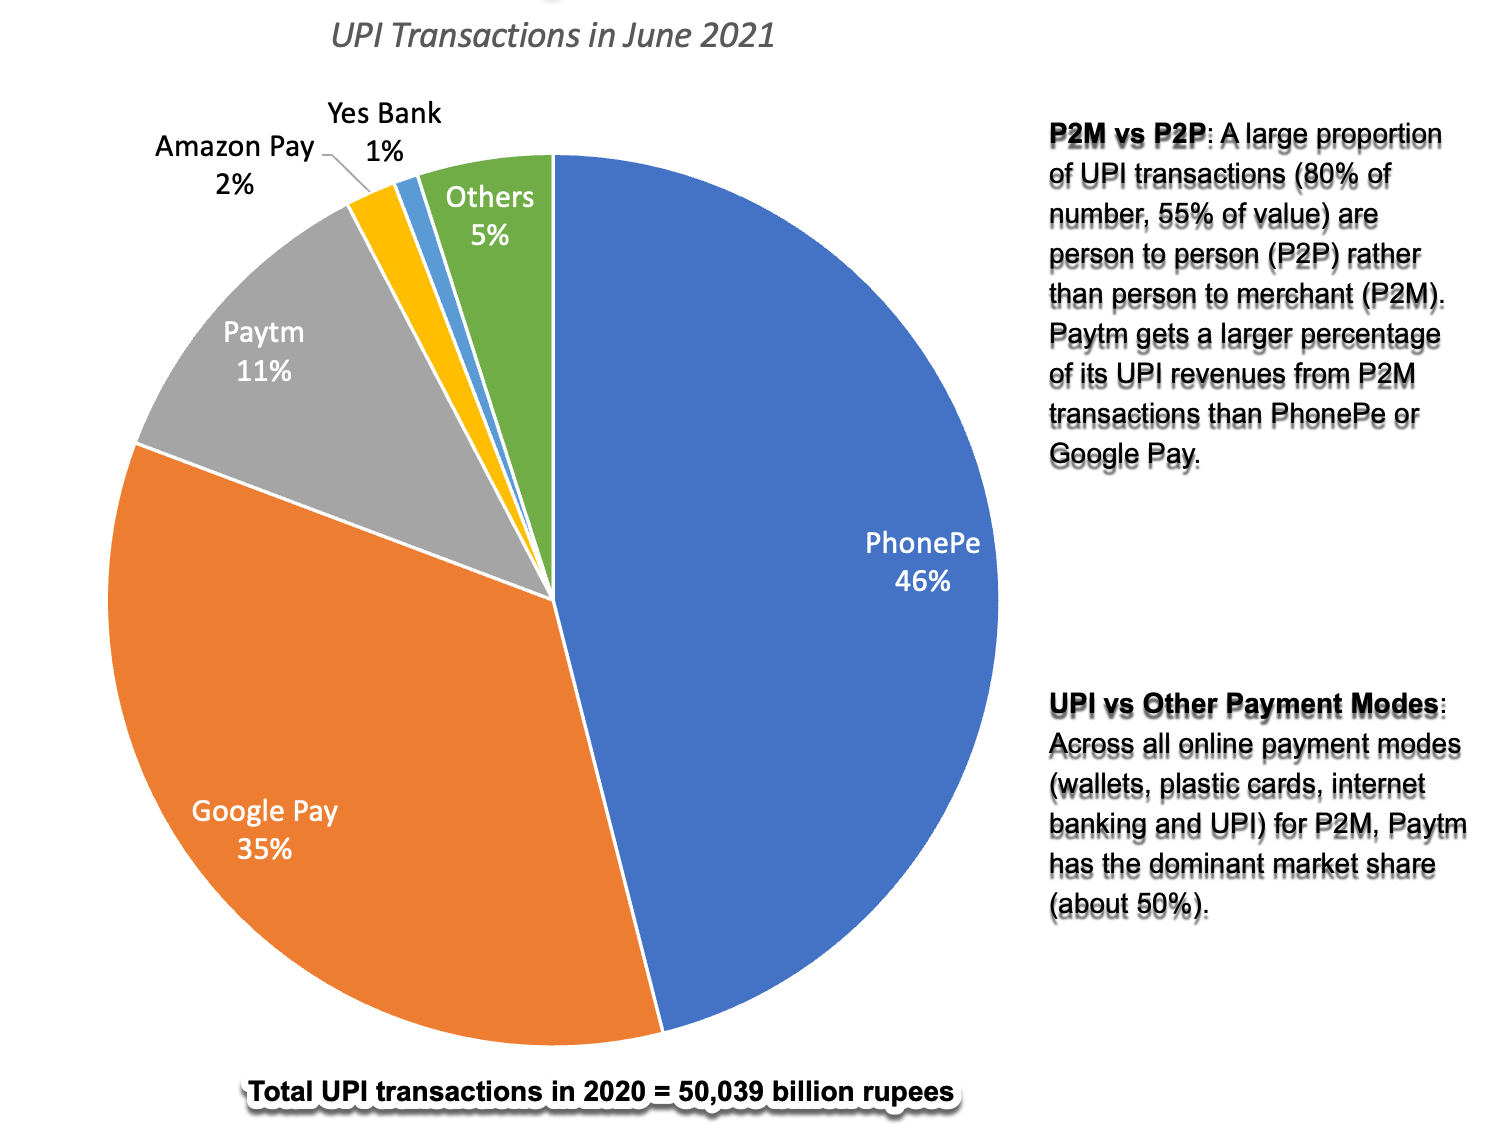
The value story for Paytm starts with a large and growing digital payment market in India, one that has surged over the last four years, and is expected to increase five-fold over the next five years, as the smart phone penetration rate rises for India and more merchants accept mobile payments. While Paytm has the advantage of having been in the Indian mobile payment market the longest, and having the largest user base, PhonePe and Google Pay have outmaneuvered Paytm in the UPI app ecosystem, claiming the lion's share of that market, though the bulk of the transaction in that ecosystem are person-to-person. Paytm's large user base, close to 350 million, and the wide acceptance of its wallets allow it to dominate the person to merchant (P2M) market in India, giving it a market share of close to 50% in early 2021.
The growth in the Indian mobile payment market will provide enough of a tailwind for Paytm to continue to grow its user base and transactions, but the bigger challenges for Paytm will be on the business dimensions where it has lagged in the past.
The first is in the take rate, where Paytm has seen its revenue share of GMV drop from 2.18% in 2016-17 to 0.79% in 2020-21, as the company has prioritized acquiring users and user transactions over actually generating revenues from these transactions. To get a measure of a reasonable take rate that the company can aspire to reach in the long term, I looked at larger, more established players in the payment processing space: From company 10Ks. Removed net interest income from Amex revenues and subscription/bitcoin/hardware revenues from Square revenues
Visa and Mastercard, the status quo players, still retain considerable market share, though Mastercard has a higher take rate (1.83%) than Visa does (1.11%); American Express has a higher take rate than the two larger players, because it gets a higher percent of its revenue from annual card fees. Paypal Shopify and Square, all of which derive their revenues from merchandising value, have take rates between 2% and 3%, though Square gets substantial additional revenues from bitcoin transactions (not counted in GMV or revenues in this table). Ant Financials, perhaps the company that Paytm has most closely modeled itself around, has a low take rate (1.37%), but makes up for it with huge transaction volumes. In modeling Paytm's take rate over time, I will begin by assuming that the company will spend the next few years putting user growth first, at the expense of generating revenues, and that the take rate will stay low over the next five years, rising slowly to 1% in 2026. In the years following, though, I expect the take rate to double (to 2%), as the focus shifts from users to revenues, and its business model approaches that of a more conventional payment processing company.The second big challenge that Paytm faces is generating profits, a feat the company has been unable to accomplish over its lifetime. While the operating margins posted by Visa and Mastercard may be unreachable, note that Paypal's operating margin has been trending up, as the company has become bigger. As Paytm increases its revenues, and user growth starts to level off, Paytm's marketing and personnel expenses should start to decrease, and I expect operating profits to turn positive and the operating margin to reach 5% in 2026, and for that improvement to accelerate in the following five years, as growth rates decrease, allowing for an operating margin of 30% in stable growth.As a technology company, whose most valuable asset is the platform that it offers and products and services on, Paytm's reinvestments have been mostly in the form of acquisitions and technology investments, and we assume that it will continue to follow this path, generating ₹3 in revenues for every rupee of capital invested in the near term, but ₹2.45 per dollar invested in the long term, converging on an industry average (for business and consumer services). Within the online payment space, this number has wide variance, with Paypal, perhaps the most mature of the companies, having a sales to invested capital of 2.54 over the last five years and Square, a younger and faster growing player, reporting a sales to invested capital of 5.68.On the risk front, there is little reason to reinvent the wheel. Paytm's cost of capital, in rupee terms, is 10.43%, reflecting its business risk, and puts the company just below the median Indian company, in risk terms. The company's capacity to burn cash will continue to expose it to risk, but with deep pocketed investors (Alibaba and Softbank), and a large cash balance (post IPO), the risk of failure is low (5%).To get from these numbers to a value per share, I use the existing share count, in conjunction with the information in the prospectus that the company plans to raise ₹16,600 million at the offering, with half of these proceeds staying in the firm to cover future investment needs and the other half going to existing shareholders, cashing out.
There are other Paytm businesses that may augment revenues in future years, but each one comes with caveats. The money deposited in Paytm wallets by users can potentially earn interest for the company, but restrictions that this money be kept in escrow accounts at banks, not always paying close to market interest rates, can crimp that income stream. Paytm Bank could expand from its very limited presence now to more traditional banking (taking deposits, making loans), but that is a capital and regulation intensive business. I believe that Paytm's core value comes from being an intermediary, in the payments business, and the story reflects that belief.
The Valuation
If you buy into my story of Paytm continuing to maintain a dominant market share of the mobile payment market in India, while also increasing its take rate over time and improving operating margins to those of an intermediary business, you have the pieces in place for a valuation of Paytm, captured in the picture below:
 Download spreadsheet; Price per share of ₹2950 is for unlisted shares.
I know that there are many on both sides of the value divide who will disagree with me on my story and valuation, and that is par for the course. On one side, there will be some who view a value of close to $20 billion (₹1500 billion) for a company with a pittance in revenues, a history of operating losses and distracted management as insanity. On the other side, there will be some who feel that I am not giving the company credit for all of the new businesses it can enter, using its vast platform of users, and thus under valuing the company. To both sides, my defense is that this is my story and valuation, and it will drive my investment, but that you are welcome to download the spreadsheet, change the inputs that you disagree with and come up with your own valuations.
In making my assessment, I fully understand that there is substantial operating and execution risk in this story, since this value presupposes that Paytm will remain a dominant player in the Indian mobile payment space, as it grows, and that Paytm's management will pivot from growing users to growing revenues and from growing revenues to growing profits, over time, with nothing in their history to back that up. Needless to say, if I invested in Paytm, it would not only have to be at the right price, i.e., trading at less than ₹1500 billion, but also with the acceptance that this cannot be a passive (buy and hold) investment, but one that will require active engagement and monitoring of the company's actions and performance. To assess how this uncertainty will play out in my estimates of overall equity value, I did a Monte Carlo simulation, with my point estimates on total GMV, take rate, operating margin and sales to invested capital replaced with distributions:
 Crystal Ball used for simulation
There are lessons, albeit some obvious, that emerge from this simulation. First, given that almost all of the value of Paytm comes from expectations of the future, and there is significant uncertainty on every single dimension, it should come as no surprise that the range on estimated value is immense, with a 3%chance that the company's equity is worth nothing to more than ₹2000 billion at the 90th percentile. Second, with this range in value, the potential for your priors and biases to play out on your final valuation are strong. Put simply, if you like the company so much that you want to buy the stock, you can find a way to make the assumptions that get to that value. Third, even if you strongly favor the company and find it under valued, it would be hubris to concentrate your portfolio, around this stock. In other words, this is the type of stock that you would put 5% or perhaps 10% of your portfolio in, not 25% or 40%.
Closing Thoughts
As human beings, it is natural for us to categorize choices we face into broad groupings, because those groupings then allow us to generalize. In the 1980s, when technology companies first entered the market in big numbers, we classified them all as high growth, high risk investments. While that categorization would have worked at the time, it is quite clear that the technology sector today is not only a dominant segment of the market (accounting for the largest slice of the S&P 500 market capitalization pie), but is also home to a wide array of companies. In fact, at one end of the spectrum, there are many older tech companies that are now mature, and perhaps even in decline, and several are stable, cash earning machines, akin to the consumer product companies of the 1980. At the other end, you see new sub-segments of technology-based companies that have emerged to claim the "high growth, high risk" mantle, deriving more of their value from the number of users on their platforms, than from conventional financial metrics. A few weeks ago, when I valued Zomato, I argued that it was a joint bet on the company's continued dominance of the food delivery market and the growth in the Indian restaurant/food delivery business. Paytm is also a joint bet on an early entrant into the Indian mobile payment market, continuing to maintain market share, in a growing digital payment market in India. That said, the companies have very different business models, with Zomato's 20% plus take of every dollar spent on its platform vastly exceeding Paytm's less than 1% take of every dollar spent on its platform. They are both big market bets, but the Paytm bet is much more dependent on management figuring out a way to grow, while improving take rates at the same time.
YouTube Video
Spreadsheets to download
Valuation of Paytm (for IPO)


September 14, 2021
The ESG Movement: The "Goodness" Gravy Train Rolls On!
Last year, I wrote a post on ESG and explained why I was skeptical about the claims made by advocates about the benefits it would bring to companies, investors and society. In the year since, I have heard from many on the topic, and while there are some who agreed with me on the internal inconsistencies in its arguments, there were quite a few who disagreed with me. In keeping with my belief that you learn more by engaging with those who disagree with you, than those who do, I have tried my best to see things through the eyes of ESG true believers, and I must confess that the more I look at ESG, the more convinced I become that "there is no there there". More than ever, I believe that ESG is not just a mistake that will cost companies and investors money, while making the world worse off, but that it create more harm than good for society.
ESG: Value and Pricing ImplicationsRather than repeat in detail the points I made in last year's post, I will summarize my key conclusions, with addendums and modifications, based upon the feedback (positive and negative) that I have received.
1. Goodness is difficult to measure, and the task will not get easier!The starting point for the ESG argument is the premise that we can come up with measures of goodness that can then be targeted by corporate managers and used by investors. To meet this demand, services have popped up around the world, claiming to measure ESG with scores and ratings. As I noted in my last post, there seems to be little consensus across services on how to measure goodness, and the low correlation across service measures of ESG has been well chronicled. The counter from the ESG services and ESG advocates is that these differences reflect growing pains, and just as bond ratings agencies found convergence on measuring default risk, services will also find commonalities. I think that view misses a key difference between default risk and goodness, insofar as default is an observable event and services were able to learn from corporate defaults and fine tune their ratings. Goodness is in the eyes of the beholder, and what you perceive to be a grevious corporate sin may not even register on my list, as a problem. To illustrate how investors can differ on core values, consider the chart below, where investors were asked to assess which issues should rank highest, when considering corporate goodness:

Based on this survey, younger investors want the focus to be on global warming and plastics, whereas older investors seem to focus on data fraud and gun control. If you expand these factors to include other social and religious issues, I would wager that the differences will only widen. As ESG scores and ratings get more traction, researchers are also looking at the factors that allow companies to get high scores and good rankings, and improve them over time. Studies of ESG scores find that they were influenced by company size and location, with larger companies getting higher ESG scores/rankings than smaller companies, and developed market companies getting higher scores and rankings than emerging market companies:
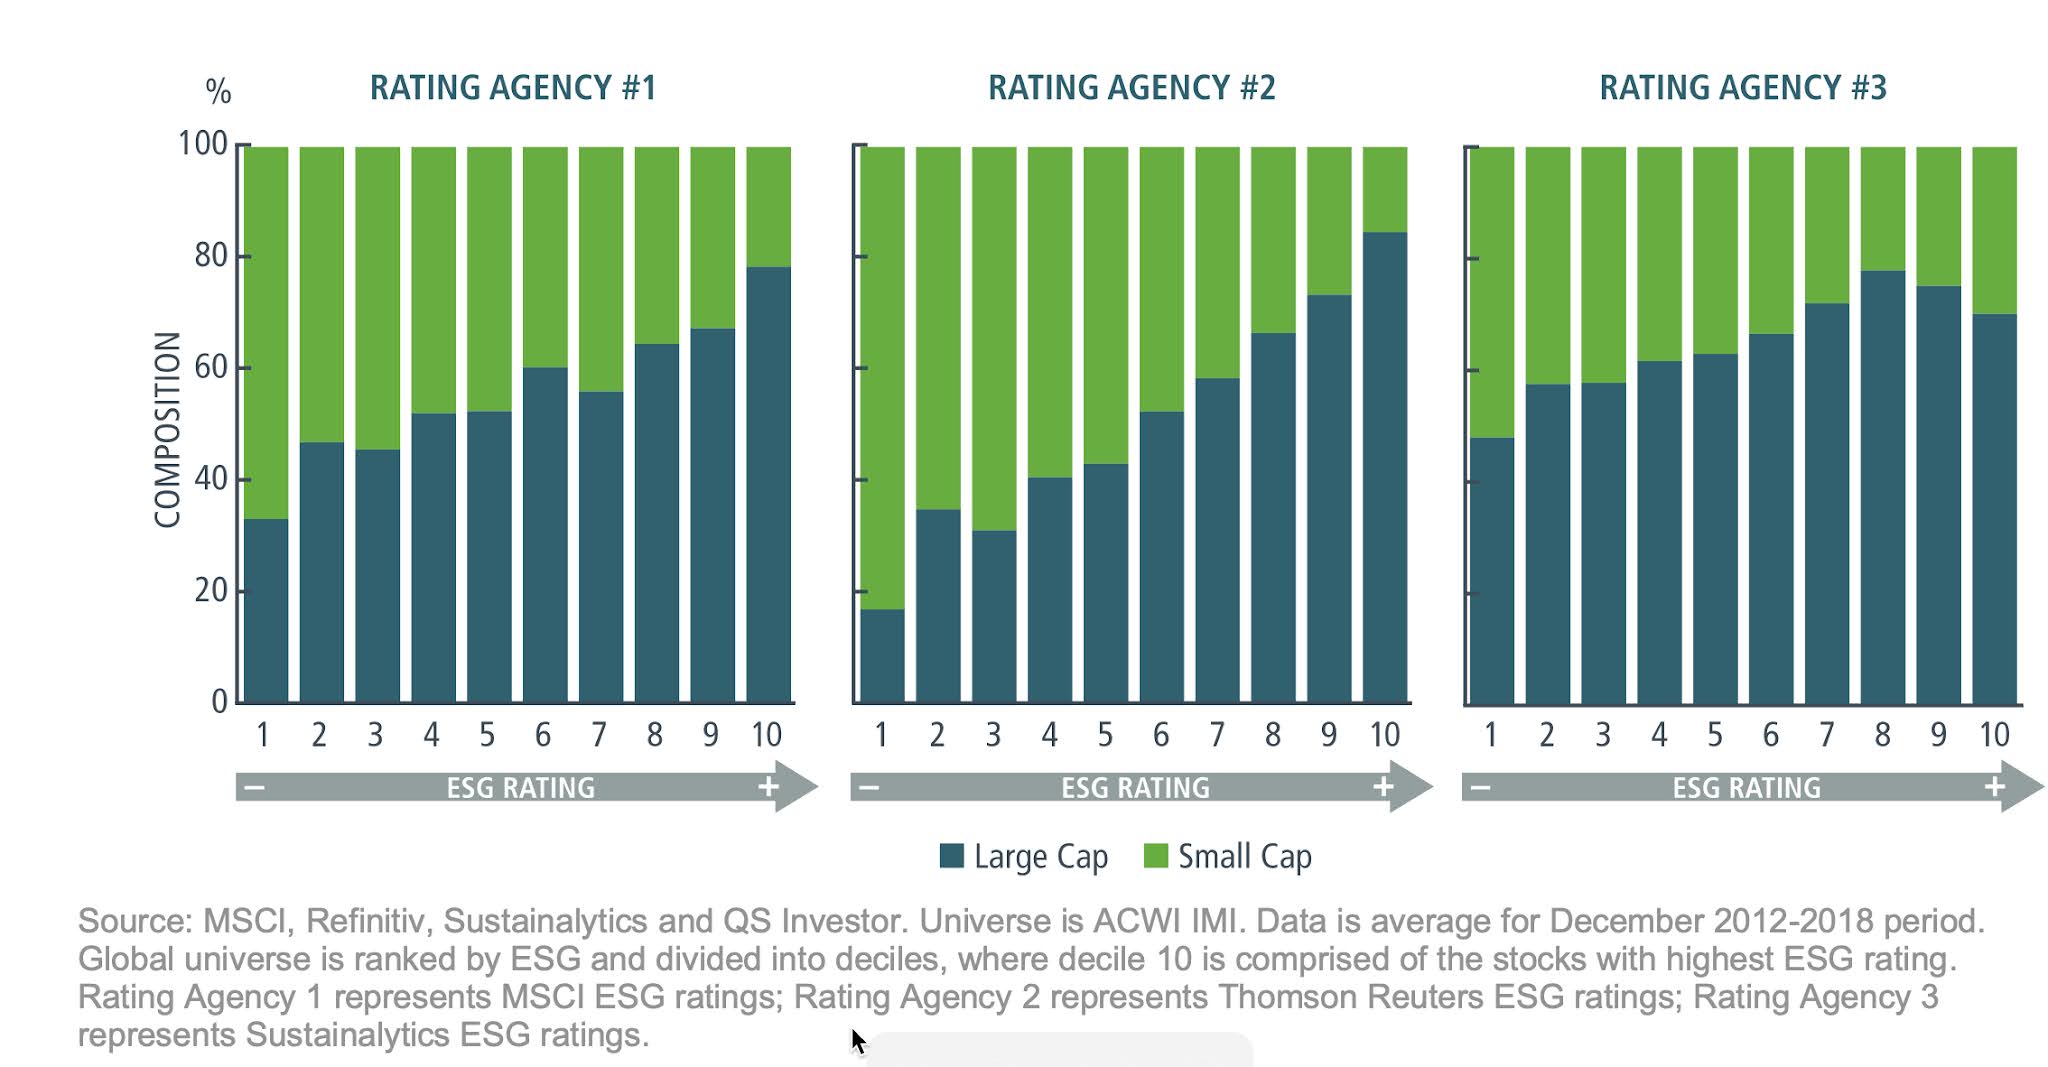 LaBella, Sullivan, Russel and Novikov (2019)
It is entirely possible that big companies are better corporate citizens than smaller ones, but it is also just as plausible that big companies have the resources to play the ESG scoring game, and that more disclosure is a tactic used by these companies that want to bury skeletons in their current or past lives, rather than expose them. In fact, a JP Morgan study of ESG Ratings and disclosures also points to a larger danger from enhanced ESG disclosure requirements, which is that the ESG ratings seems to increase across companies, as disclosure increase.
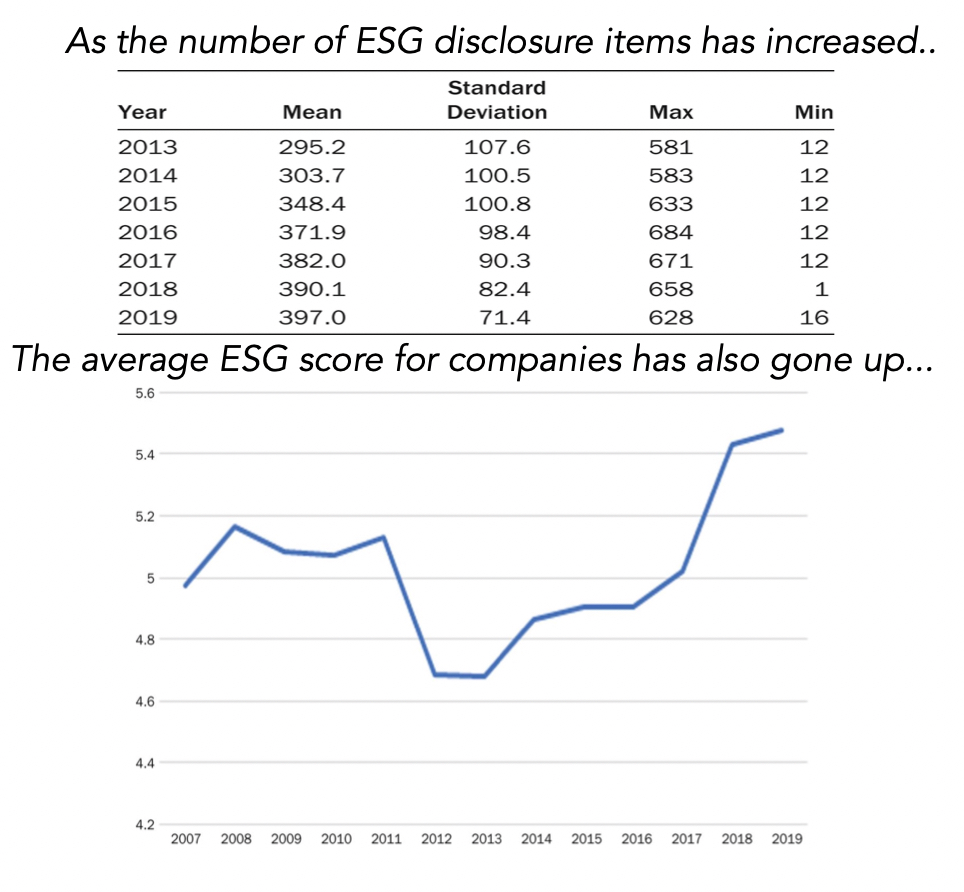 Chen et al, JP Morgan
While I am sure that there will be some in the ESG community who will view this as vindication that disclosure is inducing better corporate behavior, the cynic in me sees companies learning to play the ESG game, at least as designed by services, and using the disclosure process to check boxes and up their scores. To me, the parallels to the corporate governance movement from two decades ago are uncanny, where services rushed to estimate corporate governance scores for companies, accountants and rule writers added hundreds of pages of disclosure on corporate governance, and promises were made of a "golden age" for shareholder power. The fact that the corporate governance movement enriched services, consultants and bankers, and left shareholders more powerless than they were before the movement started, holding shares in companies with dual class shares or worse, should act as a warning for ESG disclosure/measurement advocates, but I have a feeling that it will not.
2. Being “good” will add to value some companies, hurt others, and leave the rest unaffected!
If the ESG sales pitch to companies, which is that if you are a "good" company, you will be worth more, is right, why do we need ESG? In fact, Milton Friedman, the bête noire of ESG advocates, would stand vindicated, and companies would do good, because it made them more profitable and valuable, and not because of lectures about morality and goodness. This may be cynical, on my party, but the very fact that ESG advocates keep insisting that being "good" increases value must be because they are themselves unsure why or whether this is true. The framework for tracing out the effect of ESG on value is a simple one, since ESG, if it affects value, has to affect one of four variables: revenue growth (by increasing or decreasing growth), operating profit margins, reinvestment efficiency (the payoff to investing in new capacity) or risk (through the cost of funding/capital and failure risk). In last year's post, I noted that the empirical evidence that ESG has a positive payoff is weak, at best, and inconclusive, for the most part: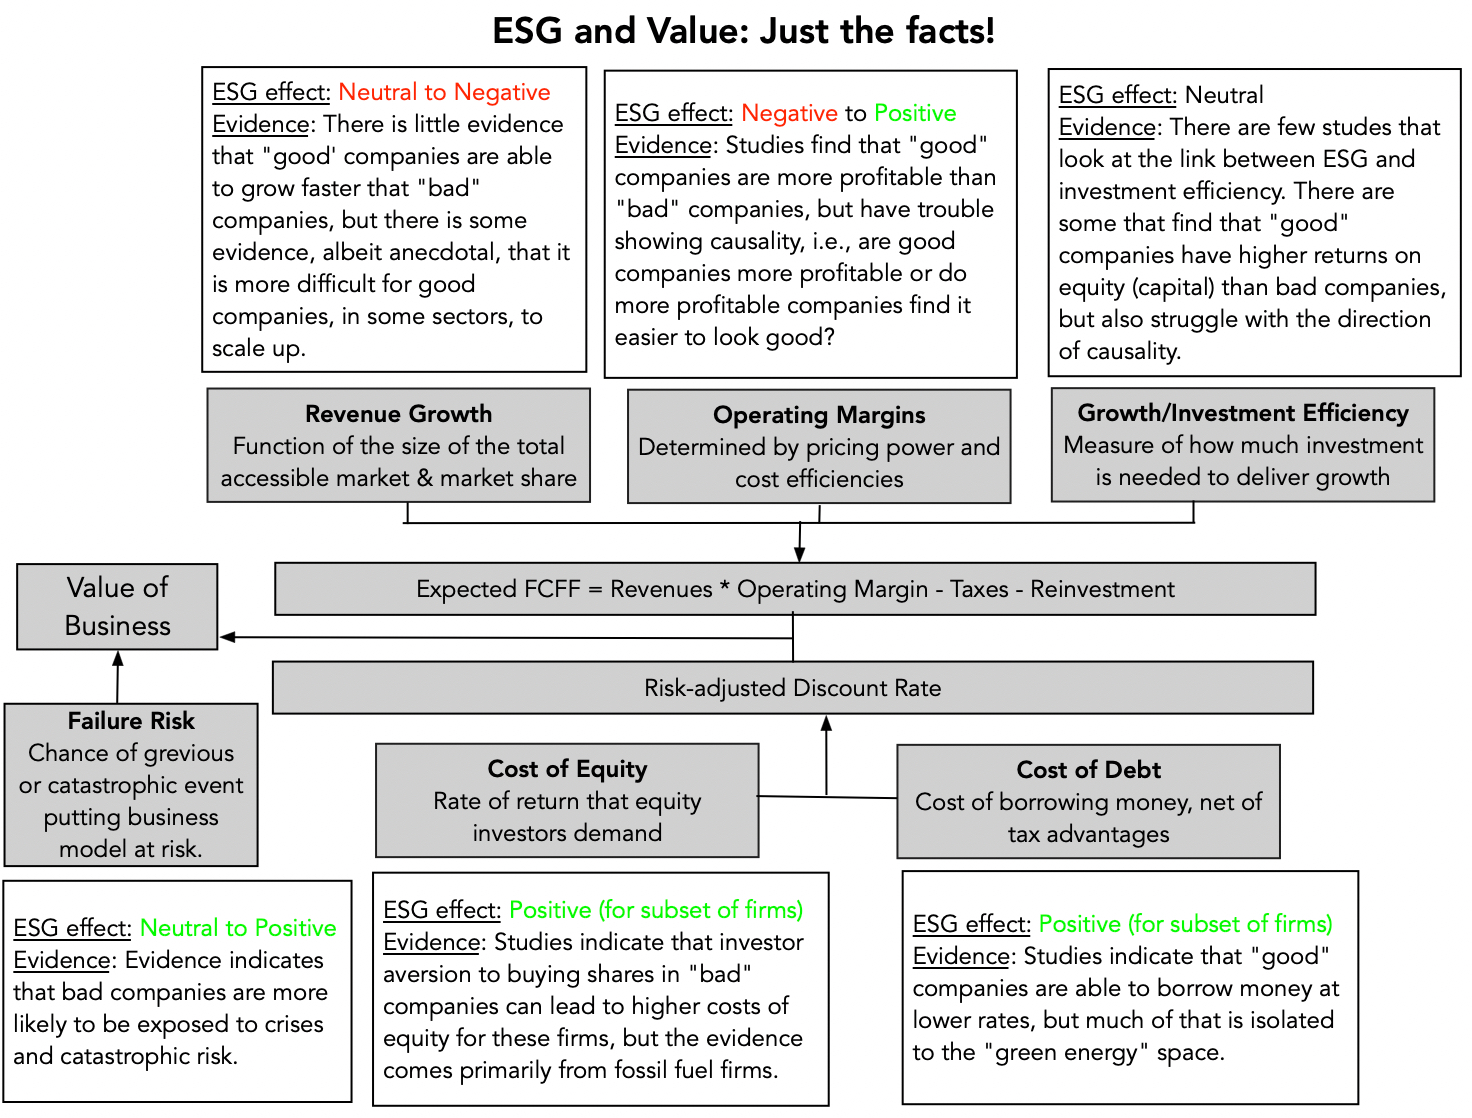 The strongest evidence that is supportive of ESG comes on the risk front, with evidence that it does not pay to be a "bad" company, with some a higher cost of funding and greater risk of catastrophes, but much of that evidence comes from fossil fuel companies. The weakest evidence in ESG's favor is on profitability and cash flows, since almost every study that purports to find positive correlation between profitability and ESG scores trips up on the causality question, i.e., are "good" companies more profitable or are companies that are more profitable able to take the actions that make them look good? An objective look at the data would lead us to conclude that while one can make a reasonable case that companies should work at "not being bad", there is very little evidence that there is a payoff to spending more money to be "good".
3. The ESG sales pitch to investors is internally inconsistent and fundamentally incoherent
If the argument that ESG translates into higher value is weak, the argument that incorporating ESG into your investing is going to increase your returns fails a very simple investment test. For any variable, no matter how intuitive and obvious its connection to value might be, to generate "excess" returns, you have to consider whether it has been priced in already. That is why investing in a well managed company or one that has high growth does not translate into excess returns, if the market already is pricing in the management and growth. Applying this principle to ESG investing, the question of whether ESG-based investing pays off or not depends on not only whether you think ESG increases or decreases firm value, but also on whether the market has already priced in the impact.
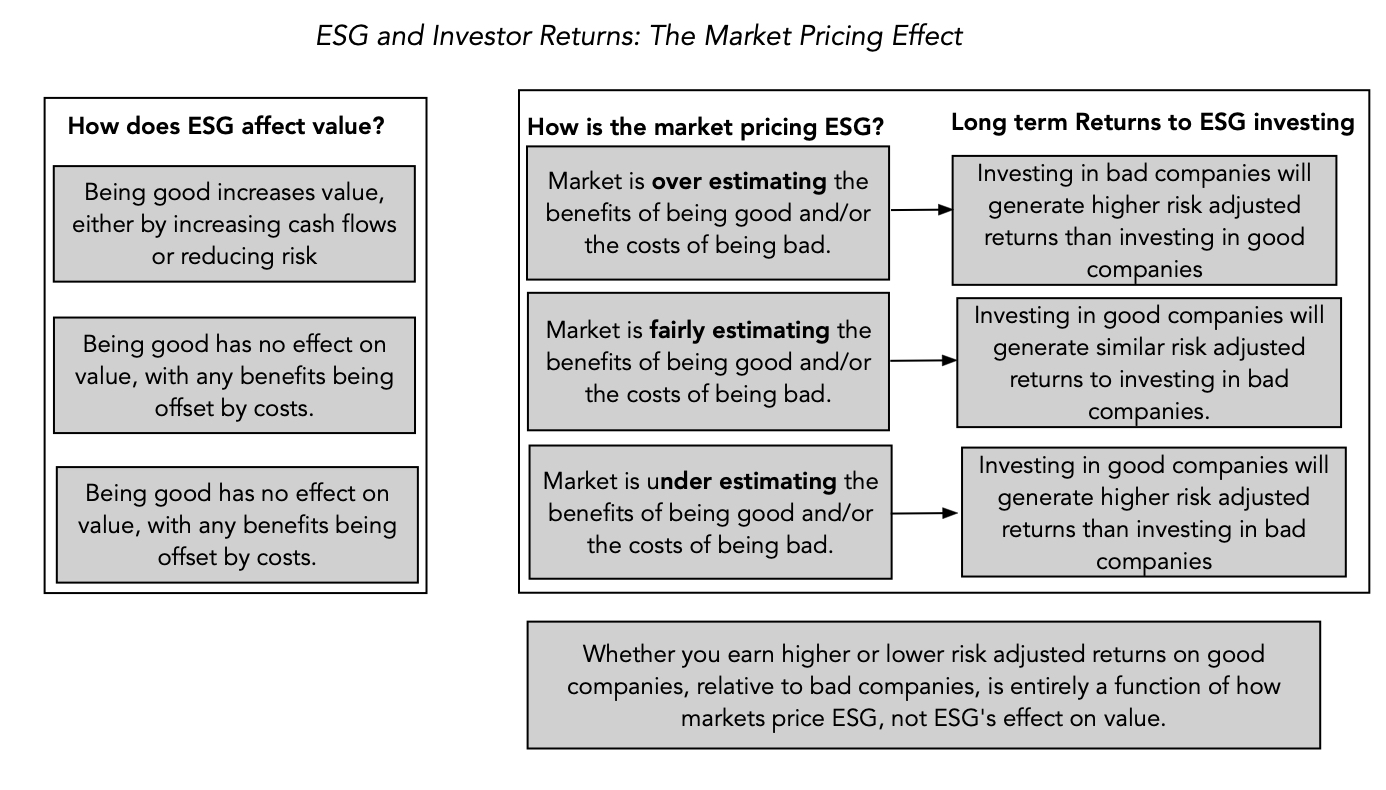 If the market has fully priced in the ESG effect on value, positive or negative, investing in 'good' companies or avoiding 'bad' companies will have no effect on excess returns. In fact, if being good makes companies less risky, investors in good companies will earn lower returns than investors in bad companies, before adjusting for risk, and equivalent returns after adjusting for risk.If the market is over enthused with ESG and is overpricing how much being "good" will add to a company's profitability or reduce risk, investing in 'good' companies will generate lower risk-adjusted returns than investing in 'bad' companies.If the market is underestimating the benefits of being good on growth, margins and risk, investing in 'good' companies will generate higher returns for investors, even after adjusting for risk.In the latter two cases, the excess returns (negative in the "markets are over estimating" case and positive in the "markets are under estimating") will manifest only when the market corrects its mistakes. Bringing in market pricing into the discussion is important for two reasons. The first is that it suggests that much of the research on the relationship between ESG and returns yields murky findings. Put simply, there is very little that we learn from these studies, whether they find positive or negative relationships between ESG and investor returns, since that relationship is compatible with a number of competing hypotheses about ESG, value and price. The second is that bringing in market pricing does shed some light on perhaps the only aspect of ESG investing that seems to deliver a payoff for investors, which is investing ahead or during market transitions. In my last post, I pointed to this study that find that activist investors who take stakes in "bad" companies and try to get them to change their ways generate significant excess returns from doing so. Another study contends that investing in companies that improve their ESG can generate excess returns of about 3% a year, but skepticism is in order because it is based upon a proprietary ESG improvement score (REIS), and was generated by an asset management firm that invests based upon that score. If you are interested in making market transitions on ESG work in your favor, you also have to be clear about the strengths you will need to get the payoffs, including skills in divining not only what social values are gaining and losing ground and which changes have staying power.
4. Outsourcing your conscience is a salve, not a solution!
Even if being “good” does not increase value or make investors better off, could it still help, by making the world a better place? After all, what harm can there be in asking and putting pressure on companies to behave well, even if costs them? In the short term, the answer may be no, but in the long term, I believe that this will cost us all (as society). The ESG movement has given each of us an easy way out of having to make choices, by outsourcing these choices to corporate CEOs and investment fund managers, asking them to be “good” for us, while not charging us more for their products and services (as consumers) and delivering above-average returns (as investors). Implicit in the ESG push is the presumption that unless companies that are explicitly committed to ESG, they cannot contribute to society, but that is not true. Consider Bill Gates and Warren Buffett, two men who built extraordinarily valuable companies, with goodness a factor in decision making only if it was good for business. Both men have not only made giving pledges, promising to give away most of their wealth to their favorite causes in their lifetimes, and living up to that promise, but they have also made their shareholders wealthy, and many of them give money back to society. As I see it, the difference between this “old” model of business and the proposed “new ESG” version is in who does the giving to society, with corporate CEOs and management taking over that responsibility from shareholders. I am willing to listen to arguments for why this new model is better, but I am certainly not willing to concede, without challenge, that a corporate CEO knows my value system better than I do, as a shareholder, and is better positioned to make judgments on how much to give back to society, and to whom, than I am.
For a perspective more informed and eloquent than mine, I would strongly recommend this piece by Tariq Fancy, whose stint at BlackRock, as chief investment officer for sustainable investing, put him at the heart of the ESG investing movement. He argues that trusting companies and investment fund managers to make the right judgments for society will fail, because their views (and actions) will be driven by profits, for companies, and investment returns, for fund managers. He also believes that governments and regulators have been derelict in writing rules and laws, allowing companies to step into the void. While I don’t share his faith that government actions are the solution, I share his view that entities whose prime reasons for existence are to generate profits for shareholders (companies) or returns for investors (investment funds) all ill suited to be custodians of public good.
Cui Bono? The ESG Gravy Train (or Circle)!
If ESG is a flawed concept, perhaps fatally so, and if the flaws are visible for everyone to see, how do we explain the immense push in both corporate and investment settings? I think the answer always lies in asking the question "Cui Bono, or who benefits?". With ESG, the answer seems to be everyone, but those it is purported to help, i.e. corporate stakeholders, investors and society. The picture below captures the groups that have primarily benefited from the ESG boom, and how they feed off each other.

Given how much ESG disclosure advocates, measurement services, investment funds and consultants feed off each other, it is no wonder that they have an incentive to sell you on its unstoppable growth and inevitable success. Given that shareholders in companies and investors in funds are paying for this gravy, you may wonder why corporate CEOs not only go along with this charade, but also actively encourage it, and the answer lies in the power it gives them to bypass shareholders and to evade accountability. After all, these are the same CEOs who, in 2019, put forth the fanciful, but great sounding, argument that it is a company’s responsibility to maximize stakeholder wealth, rather than cater to shareholders, which I argued in a post then that being accountable to everyone effectively meant that CEOs were accountable to no one. In some cases, flaunting goodness has become a way that founders and CEOs use to cover business model weaknesses and overreach. It is a point that I made in my posts on Theranos, at the time of its implosion in October 2015, and on WeWork, during its IPO debacle in 2019, noting that Elizabeth Holmes and Adam Neumann used their “noble purpose” credentials to cover up fraud and narcissism.
I should add that, notwithstanding my negative views about ESG, I do not think that ESG consultants, fund managers and analysts are venal, but I do think that they, like everyone else, are driven by self interest. I also believe that many in the ESG ecosystem are driven by good motives, a desire to do good for society and make the world a better place, but that are being used by a few at the top of the ESG pyramid, whose commitment to the cause is skin deep. If you are someone working in the ESG space or a true believer, please do look to the highest profile spokespersons for your cause, mostly corporate CEOs and investment fund titans, and remember the adage about waking up with fleas, if you lie down with dogs.A Roadmap for being and doing Good
My skepticism about ESG notwithstanding, I understand its draw, especially on the young. As individuals, each of us has a moral code, sometimes coming from religion, sometimes from family and sometimes from culture, but whatever its source, our actions should be consistent with that code. Since those actions involve what we do at work, and in investing, it stands to reason that there are some investments you will and should not make, because it violates your sense of right and wrong, and other investments that you will make, because they advance your view of goodness. It is for this reason that I would suggest a more nuanced and personalized version of ESG, built around the following principles:
Start with a personalized measure of goodness, and don’t overreach: The key with moral codes is that they are personal, and for goodness to be incorporated into your investment and business decisions, you have to bring in your value judgments, rather than leave it to ESG measurement services or to portfolio managers. I would also recommend that you focus on core values, rather than try to find a match on every one, not only because adding too restrictions will constrain you in your choices, perhaps to the point of paralysis, but also because you may find yourself accepting major compromises on your key values in order to meet secondary values. As a business person, be clear on how being good will affect business models and value: If you own a business, you are absolutely within your rights to bring your personal views on morality into your business decisions, but if you do so, you should work through the effects on growth, margins and risk, and be at peace with the fact that staying true to your values may, and probably will, cost you money. If you are making decisions at a publicly traded company, as an employee, manager or even CEO, you are investing other people’s money and if you choose to make decisions based upon your personalized moral code, you cannot justify these decisions with hand waving and double talk. In fact, you have an obligation to be open about what your conscience will cost your shareholders, a twist on disclosure that ESG advocates will not like.As an investor, understand how much goodness has been priced in: If you are an investor, you don’t have to compromise on your values, as long as you start with the recognition that, at least in the long term, you will have to accept lower returns than you would have earned without that constraint. If you are tempted to have your cake and eat it too, and who isn’t, you may be able to do so by getting ahead of the market in detecting shifts in social mores and pushing for change in the companies you invest in, to change. As a consumer and citizen, make choices that are consistent with your moral code: If you believe that owning a portfolio of “good” stocks or running a “good” business is all you have to do to fulfill your moral or societal obligations, you are wrong. Your consumption decisions (on which products and services you buy) and your citizenship decisions (on voting and community participation) have as big, if not greater, an effect. Put simply, if your key societal issue is climate change, your refusal to own fossil fuel stocks in your portfolio is of little consequence, if you still drive a gas guzzler, air condition your house to feel like an ice box all summer and take private corporate jets to Davos every year.On a personal note, I have always found that the people that I've known who do good, spend very little time talking about being good or lecturing other people on goodness. I would extend that perspective to companies and investment funds as well, and I reserve my skepticism for those companies that spend hundreds of pages of their annual filings telling me how much "good" they do.In conclusion The ESG movement’s biggest disservice is the message that it has given those who are torn between morality and money, that they can have it all. Telling companies that being good will always make them more valuable, investors that they can add morality constraints to their investments and earn higher returns at the same time, and young job seekers that they can be paid like bankers, while doing peace corps work, is delusional. In the long term, as the truth emerges, it will breed cynicism in everyone involved, and if you care about the social good, it will do more damage than good. The truth is that, most of the time, being good will cost you and/or inconvenience you (as businesses, investors or employees), and that you choose to be good, in spite of that concern. YouTube Video
September 1, 2021
China's Tech Crackdown: Its about Control, not Consumers or Competition!
 Angus Maddison, University of Groningen
In 1500, China had the largest GDP of any country in the world, followed by India, not surprising since output and population were tied together strongly at the time, when human labor was the key driver of economic output. With the advent of the Industrial Age, both India and China fell off the pace, and by the start of the twentieth century were punching well below their (population) weight.
Angus Maddison, University of Groningen
In 1500, China had the largest GDP of any country in the world, followed by India, not surprising since output and population were tied together strongly at the time, when human labor was the key driver of economic output. With the advent of the Industrial Age, both India and China fell off the pace, and by the start of the twentieth century were punching well below their (population) weight.I am not an historian or political scientist, and will not probe the reasons, but China spent much of the twentieth century with a stalled economy, and in 1970, China's GDP accounted for 4.63% of global GDP, down from more 30% in 1820. The turn around that occurred in China's economic growth occurred is one for the history books, and you can see the rise in the graph below, where I look at China's GDP, relative to the United States (which had the dominant share of global GDP) and to the rest of the world between 1960 and 2020:
 World Bank Database
The United States, which used to account for close to half of global GDP in 1960 has seen its share drop go global GDP drop to 25%, while China's share has climbed close to 20% in 2020. To get a sense of how dependent the world economy has become on China for its growth, take a look at the table below, where I report World GDP growth, by decade, with and without China:
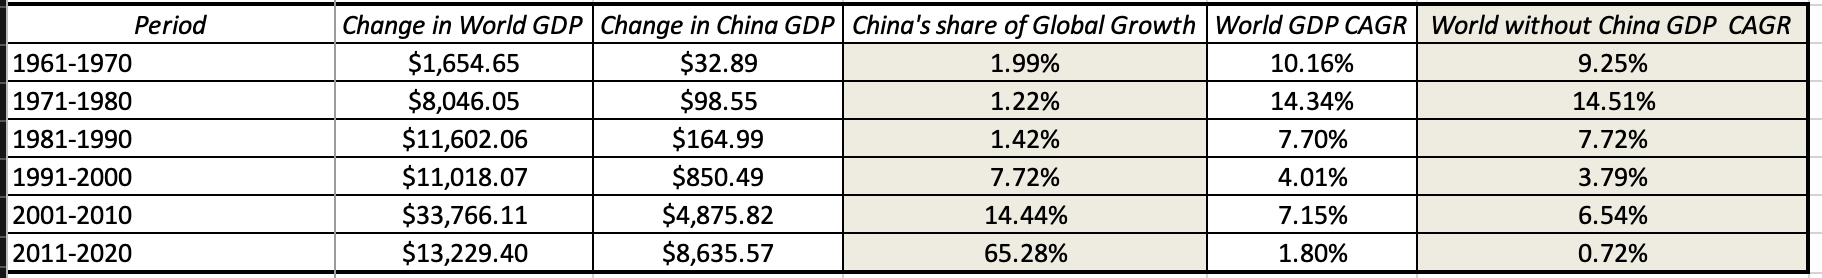 World BankPut bluntly, without China, the world economy would have tread water for the last decade, since China accounted for close to two thirds of global GPD added on during the decade. As China's economy has grown, its financial markets have also found their footing, albeit at a slower pace. In the graph below, I plot the market capitalization of Chinese listed companies, in dollar terms, and as a percent of market capitalization of all global companies:
 World Bank Database
Chinese equities have risen from a negligible share of global market capitalization, in 2000, to more than 10% of global market capitalization, in 2020. It is beyond debate that China's economy and markets have had a renaissance, cementing the country’s place as a leading economic power.
While many of the companies listed initially on the Chinese markets represented infrastructure and financial service companies, the last decade has seen the rise of the Chinese tech behemoth. That transition can be seen when you compare the fifteen largest Chinese companies, in market capitalization terms, at the end of 2010 to the fifteen largest Chinese companies, again in market capitalization terms, at the end of 2020.
 S&P Capital IQAt the end of 2010, of the fifteen largest market cap companies in China, only two were tech companies (Tencent and Baidu), and they were towards the bottom of the rankings; banks and insurance companies dominated the list. By the end of 2020, six of the top fifteen were technology companies, and Tencent and Alibaba topped the rankings.The Chinese Tech DecadeThe rise of technology as an economic force and market driver is not unique to China. After all, the FANGAM stocks (Facebook, Amazon, Netflix, Google, Apple and Microsoft) were the engine that drove market capitalization up in the US, for the last decade, with COVID super charging their rise in 2020. In this section, I will focus on the Chinese tech market, by looking at some its biggest success stores, and using them to gain an understanding of both the promise and peril in this business. Chinese Tech Plays - The Lead InIn this day and age, every business brands itself, at least in part, as a technology company, and it is always tricky to try to crystallize the diverse mix of technology into a tech sector. That said, there is an advantage to taking a deeper look at some of the biggest winners in the tech business, not only to understand why they succeeded, but also to get insights into whether they can sustain that success in the future. It is for that reason that I will focus on four Chinese tech companies (Tencent, Alibaba, JD.com and Didi) for the rest of this post, the first three because they make the top fifteen list of market cap companies in China, and Didi because of its high profile IPO, just a few weeks ago.
 I am not a fan of extensive corporate write ups, with long treatises about corporate history and developments, since they often operate more as distractions than as sources of information. Instead, I will try to compress what I know (which is not much) about the evolution and operations of each of the four companies. I will start with Tencent, in deference to its age (it is the oldest of the four) as well as its standing as the largest market cap company on the list.
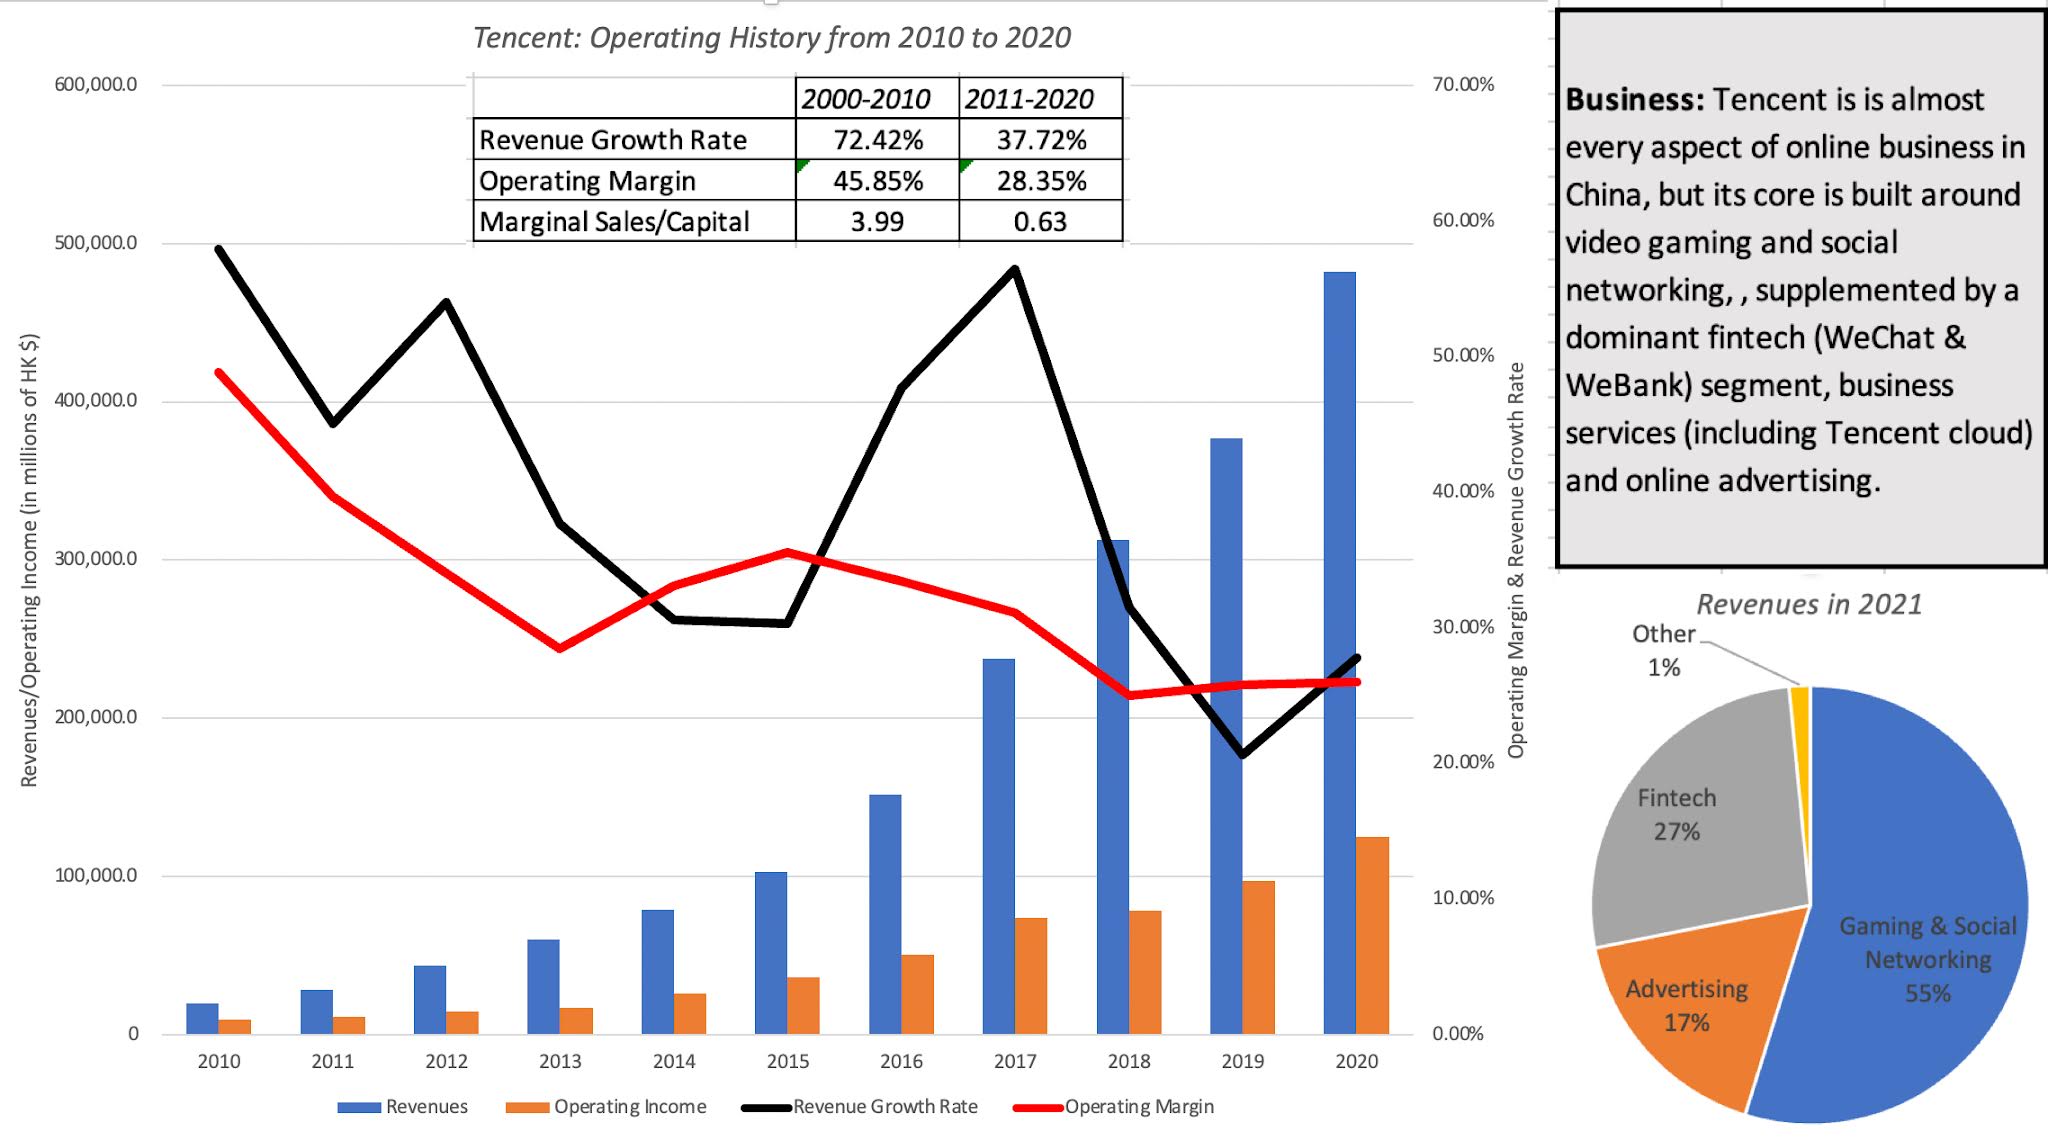
Tencent is the most versatile of the four companies, in terms of its business mix, and while it has been in existence for 20 years as a publicly traded company, its growth in the last decade has converted it from a minnow to a whale. Moving to Alibaba, the second largest Chinese tech company in 2020, I drew on a blog post that I wrote ahead of its IPO in 2014, where I described it as “the Real China Story”, because so much of Chinese retail traffic travels through its platforms (Taobao and TMall), with the company collecting a slice of the transaction revenues, in return for its intermediation services.

While Alibaba is sometimes characterized as China's Amazon, it is closer to Google in its business model, collecting most of its revenues from customers using its platforms to buy goods and services. Staying in the online retail space, I look at JD.com, which operates more as a retailer, selling goods and services through its platforms.
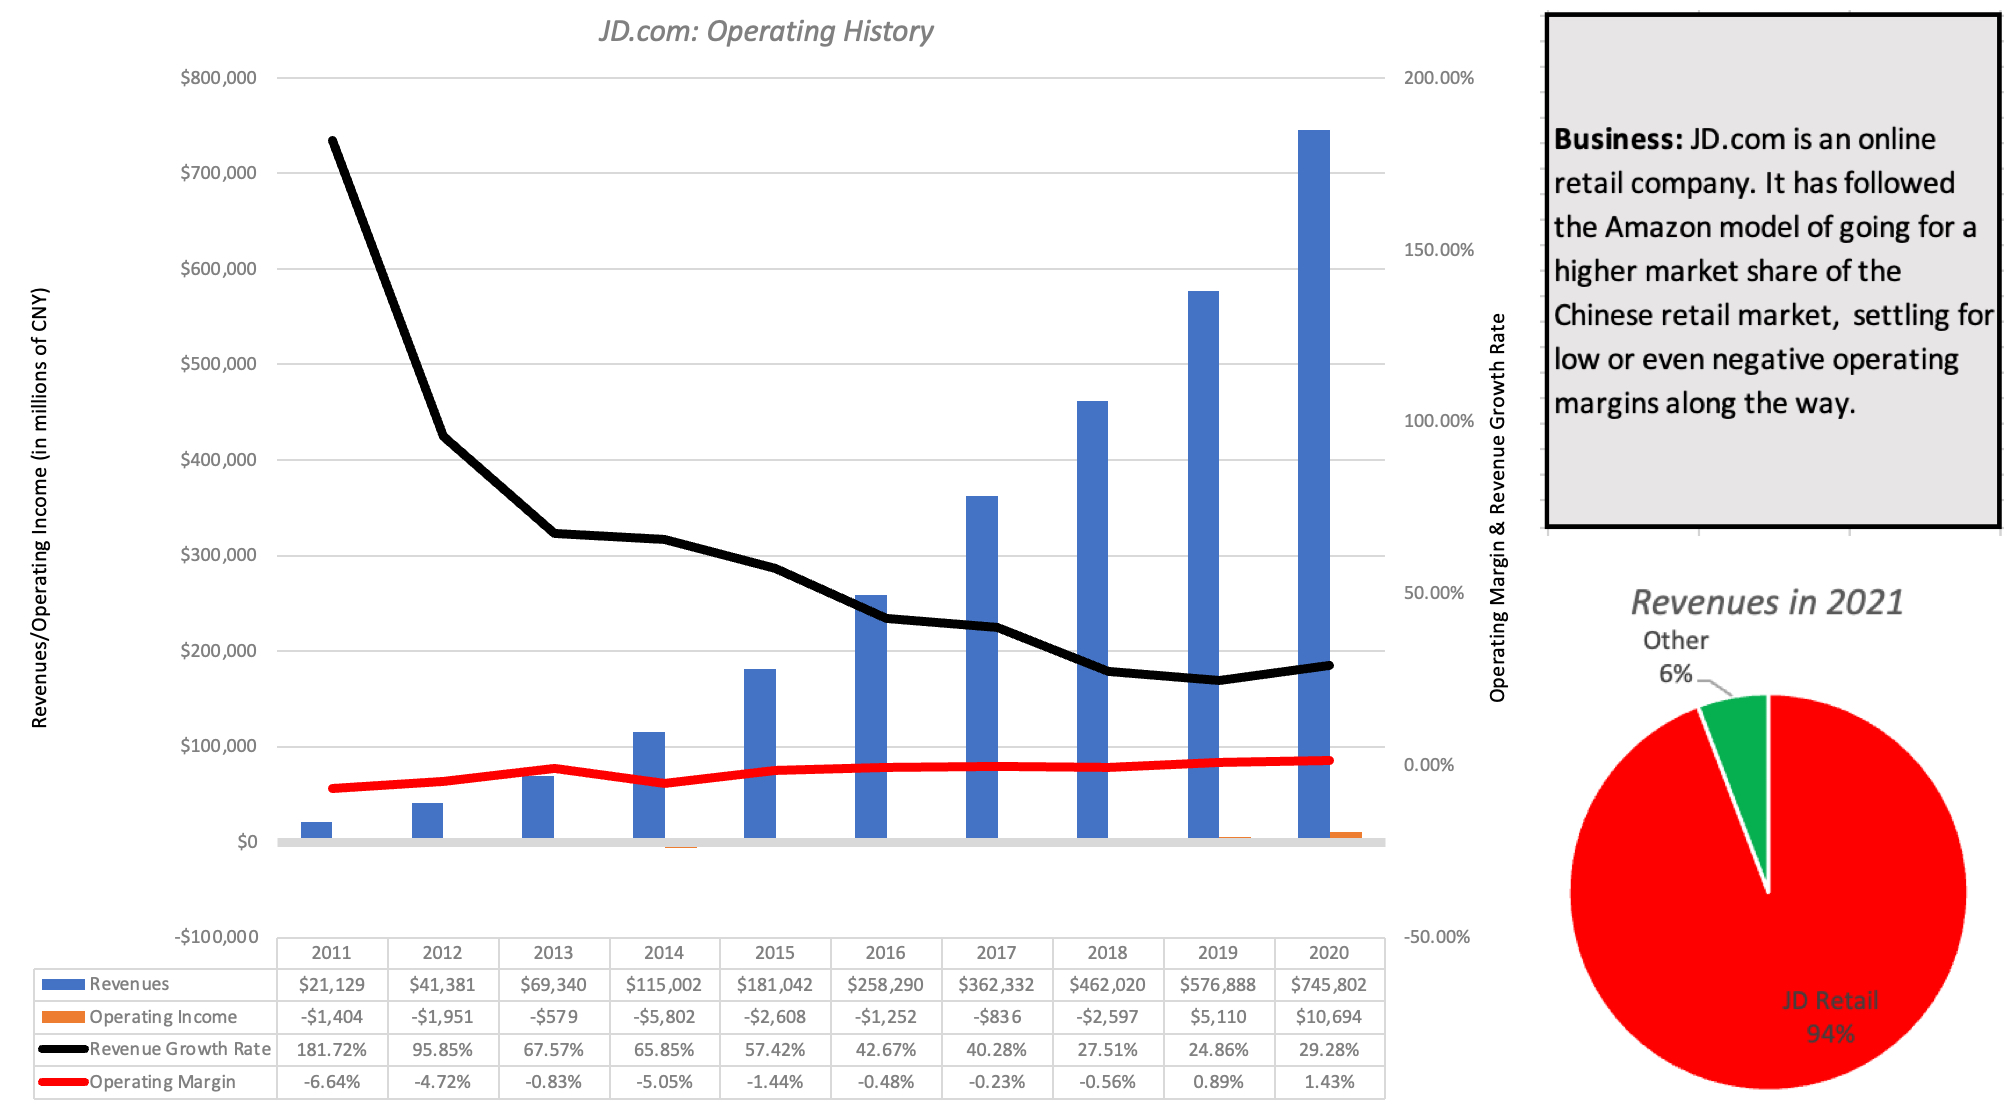
Note that JD.com, while posting strong revenue growth rates for much of the last decade, has had trouble generating significant operating profits. That, in my view, is not accidental, since the company has been open about its focus on increasing market share, at the expense of profitability, following the Field of Dreams model (If we build it, they will come)... The final company in my list is Didi, a company that I had tracked in the process of valuing Uber and Lyft, and it followed them into public markets in 2021:

Didi's acquisition of Uber China has given it dominance over the Chinese ride sharing market, but it is difficult to see the payoff in the numbers. Revenues have stagnated between 2018 and 2020, and the easy excuse of COVID does not explain the stagnation, since growth was tepid even in 2019. The company has also shown an almost unparalleled capacity to lose money and burn through cash, even by ride sharing company standards.Chinese Tech Plays - Valuation StoriesTo value the Chinese tech companies, I have to construct valuation stories that fit them, and as you can see there are big differences across the four companies (Tencent, Alibaba, JD.com and Didi) not only in where they are in terms of growth potential, but also in terms of profitability and business models. That said. there are some commonalities across these companies that I will explore in this section.
Big Markets (Squared)There are many aspects that make Chinese tech companies attractive to investors, but the one overriding attraction of these companies is their access to the Chinese market. As I noted in the first section, China was the engine that drove global growth over the last decade, and with that growth has come a surge in buying power for Chinese consumers. Companies that are positioned to take advantage of this growth, whether domestic or foreign, have been rewarded by investors with higher market capitalizations, even if the promise has not translated into profitability (yet). With tech companies that are disrupting conventional businesses, there is an added allure of growth occurring at the expense of the status quo. Tencent in the gaming business, Alibaba and JD.com, with retailing, and Didi, with logistics, are all disruptors of the status quo, in the businesses that they operate in. You could argue that this combination of China and disruption creates growth stories on steroids, as investors load on dreams of one big market (from disruption) on top of another (China).
As with any steroid-driven story, there are downsides. First, I have had multiple posts on the big market delusion, where I argue that investors often over estimate the likelihood and payoffs of success in big markets, because they fail to factor in new entrants, and changing technology fully. This argument applies to Chinese companies, generally, and to Chinese tech companies, specifically, as "the market is huge, the company's value has to be immense" argument often wins the day. Second, the size of the Chinese market, in conjunction with local dominance, has also meant that Chinese tech companies prioritize domestic market growth, simply because it is easier and often more profitable. Of the four companies that I am analyzing, Tencent is the only one where foreign market revenues are substantial enough to make a difference to its valuation. Alibaba has aspirations to grow in foreign markets but has little to show yet in terms of profits, and Didi and JD.com are almost entirely China-focused. Clearly, their global ambitions notwithstanding, Chinese tech companies have remained overwhelmingly Chinese. There are benefits to getting growth from domestic markets, but that dependence also makes these companies extraordinarily exposed to government regulations and restrictions in these markets.
Attuned to the Chinese MarketThe argument that the big (and growing) Chinese tech market explains the success of the winners (like Alibaba, Tencent, JD.com and Didi) short changes these companies, by underplaying what each of them brought to the game that allowed them to succeed. Note that these companies were very much part of the pack, competing with foreign and domestic players, just a decade or two ago, but have managed to separate themselves from their competitors, in the years since. While there are many factors that may have contributed, one in particular stands out. Rather than copying what successful US tech companies were doing to gain market share and profitability, these companies tailored their business models and product offerings to the Chinese market, adapting to what Chinese consumers cared about and wanted. In my IPO post on Alibaba, I argued that the reason it was able to vanquish eBay and more established competitors was because it created what the Economist called the "world's greatest bazaar" and a payment mechanism that Chinese consumers felt comfortable using online. Tencent not only built a gaming platform specifically focused on Chinese consumers, but was well ahead of its US tech competitors in building the world's leading social media platform in WeChat. Didi was conceived as a cab-hailing company in 2012, but it too tailored its services to the local characteristics of the Chinese market, acquiring its main domestic rival in Kuadi Dache in 2015, and forcing Uber to capitulate and sell its Chinese segment in 2017.
Corporate Governance NightmaresThere is another feature that Chinese tech companies share, and it is not a favorable one. While Alibaba, Tencent, JD.com and Didi are undeniably Chinese companies (both in terms of operations and where they get their revenues), three of these companies (Alibaba, JD and Didi) made their public market debuts in New York, with NASDAQ listings. In fact, these three companies are also incorporated in the Cayman Islands, and Tencent began its corporate life as a Cayman Island listing. In fact, the structure (called a variable interest entity or VIE) used by Alibaba, HD and Didi essentially means that shareholders are technically owners of shell companies (in the Cayman Islands) rather than the Chinese enterprises that they they think they are buying.
 Why do Chinese tech companies favor this convoluted structure? The answer lies in Chinese laws and regulations that restrict the types of business that foreign investors are allowed to own shares in, and technology is one of those restricted businesses. Variable interest entities are a technicality that allows Chinese tech companies to get around the law, but they hold up only because the Chinese government has looked the other way, perhaps because the benefits to China (of tapping into foreign capital) exceed the costs. The legality of variable interest entities is still much debates, but if its gets litigated, stockholders in these companies may find themselves with limited standing. As an added complication, each of these companies has elaborate subsidiary structures, including wholly owned, majority owned and minority owned subsidiaries that are, at best, opaquely reported upon, and at worst, a blank slate.Beijing: A Silent (or not-so-silent) Partner!The discussion of variable interest entities (VIE) its a good lead in to the third component that Chinese tech companies share in common, which is that the Chinese government is a player in the game, no matter what business you enter into in China. Note, though, that the notion that governments are neutral arbiters who don't affect company value is utopian, since governments in every market affect almost every dimension of value, sometimes positively and sometimes negatively. In the figure below, I have used my value drivers framework, where I connect the value of a company to key drivers of value (revenue growth, operating margins, capital intensity and risk), to examine how government action (or inaction) can affect each driver.

There are a myriad of ways in which governments can add or detract from value, and the net effect will depend on the company and government in question. I have found this framework useful in dealing with a effect on value of everything from crony capitalism and political connections to regulation.
If this is true for all companies, why make this an issue with just Chinese tech companies? There are two reasons. First, the Chinese government can not only change the competitive balance and business more decisively than democratic counterparts, where making laws involves trade offs and bargains, but also make the changes more permanent, since a change in government is not in the cards. Second, in most countries, government rules and regulations have to run a gauntlet of legal challenges, before becoming law, since a judiciary can over ride, delay or even set aside government actions. This may reflect my ignorance, but I have never heard of a Chinese government law or regulation that had to be withdrawn or suspended, because a Chinese court ruled it illegal. Put simply, the Chinese government has more power to give and to take away from its companies than any other government of consequence in the world. Sensible investors have always understood this power, and tried to price them in, but for much of the last decade that has led them to bid up Chinese companies, on the assumption that Beijing would tilt the playing field in favor of domestic companies, at the expense of foreign competitors, and that the governments' push for more economic growth would make it more likely to be an ally, rather than an adversary, to companies.
That calculation, though, does miss the other quality that the Chinese government has always valued, which is control, and the tussle between the two (growth and control), in my view, explains much of the crackdown on Chinese tech. As Chinese tech companies have become larger and more valuable, they have also become repositories for data on their customers, and that data is what Beijing not only fears, but covets. While the government may frame its crackdown on big tech as designed to protect Chinese consumers’ privacy or to prevent market domination, the truth is that this is mostly about the Chinese government increasing its control of data and markets. Just as a thought experiment, if the Chinese government had the information that Tencent and Alibaba have about their customers, do you believe that they would not keep it? Whatever the reasons for the Chinese government’s actions, it is undeniable that they have changed the calculus, at least for the moment, of how the Chinese government affects Chinese tech company valuations. As investors bring in the downside of the government effects on value, markets have reassessed the pricing of all four of the companies that I am valuing, dropping market capitalization by 17% for Tencent, 46% for Alibaba and 7% for JD.com in 2021, over the most recent year, and providing a frosty reception to Didi’s IPO, with the stock price dropping 42% from its offer price of $14 a share , just a few weeks ago. The question is not whether the mark down on price has a good reason (it does), but whether the market is over or under reacting to the new relationship between Chinese tech and the Chinese government.Investing in China TechWith that long lead in, I think that we are positioned to not only value Tencent, Alibaba, JD.com and Didi, but also to bring in the effect of activist government on their value drivers in the future. In the process, the question of whether these companies are cheap, given their recent mark downs, or expensive, will be answered.
Valuing Chinese Tech Companies As I noted in the last section, investors have priced Chinese tech companies for much of the last decade, on the presumption that the Chinese government would be a net plus for these companies, stifling competition from foreign companies and easing the pathway to growth to profitability. It is for that reason that investors have been shocked by the realization that what governments can give, they can take away. Rather than bury you in details of each company's valuation, I have summarized the key inputs and valuations of each company, under three scenarios, built around views of the government - the government as benefactor, the government as a net-negative (more likely to hurt the company than help it, reflecting my current view on the Chinese government's relationship with these companies) and the government as adversary - in the table below:
 Tencent: Government as benefactor, net negative and adversary
Alibaba: Government as benefactor, net negative and adversary
JD.com: Government as benefactor, net negative and adversary
Didi: Government as benefactor, net negative and adversaryThe effects of the Chinese government on the valuations of these technology companies can be seen in the range of values per share that you get for each company. In making my assessments of how government affects value, I believe that almost all of the effect will be in the cash flows for the companies, since most of the restrictions are on growth (constraints rising from anti-trust moves) or on margins (costs associated with meeting privacy needs). While there is talk of banning tech companies from listing on foreign markets, using shell structures, I don't believe it will be retroactive, and the companies on my list are big enough to transition. With Didi, I do believe that a strong push by the government to restrict how it does business will increase the chance that the company will not make it as a going concern, since its business model is still a work in process.
Based upon my assessments, the quick takeaway is that at current stock prices, all four of the companies are under valued, with what I believe are reasonable constraints brought in by government actions. Alibaba is the most undervalued (by 12.7%), followed by Tencent (by 8%), but Didi and JD.com are close to being fairly valued (undervalued by 3.65% and 2.07%). Digging deeper, there is substantial downside if the government becomes openly and actively adversarial, with Didi dropping to becoming almost worthless, if that happens. On the upside, if any of these companies finds a way into the government's good graces, the benefits that flow from it can increase the upside at each of these companies, but most at Didi. Didi is clearly more exposed to government actions than the other three, suggesting a broader principle at play, which is that young companies are more affected in terms of both upside and downside, by government actions and regulations, than older companies.
Investing in Chinese Tech Companies Valuation is a pragmatic, rather than a theoretic, exercise, where the end game is not just understanding and estimating the value of a company, but acting on that valuation. If you are an investor, you should be willing to buy under valued companies and sell short on over valued companies, with the caveat that you need a market correction to make money, and that correction may take time. Since I find all four of the Chinese tech companies under valued, what would I do next? First, I would remove Didi and JD.com from the mix, largely because they are closer to fairly valued, than under valued. In fact, I would argue that looking at Didi's still unformed business model, and the huge consequences of government action or inaction, it is closer to being an option than a conventional going-concern valuation. Second, with Alibaba and Tencent, both of which are under valued in my base case (government as a net negative), I have three choices:Buy both Alibaba and Tencent, and hope that the "government as adversary" scenario does not play out for either. Buy one of the two, based upon not just the valuation but also the rest of the company, including corporate governance and structure.Buy neither, because you believe that the "government as adversary" scenario is more likely than the "government as benefactor".I am not inclined to double down (buying both companies) on betting on how the Chinese government will behave in the future, and if I had to pick one, I would pick Tencent over Alibaba for three reasons. The first is that Tencent is a more rounded company in terms of being in business mix, and I think that the WeChat platform, like the Facebook platform, adds a premium to their valuation. The second is that I prefer buying Tencent on the Hong Kong stock exchange to buying Alibaba's Cayman Islands shell company on the New York Stock Exchange. The third is that while I admire Jack Ma as an entrepreneur, I am believe that personality-driven companies have an added layer of risk, since that personality can draw attention and fire. In fact, there are some who believe that the increased regulation of Chinese technology can be traced to Jack Ma's challenging Beijing in 2020.
With my Tencent investment, I faced a secondary choice of investing directly in Tencent or indirectly buying shares in Naspers, a South African holding company. If you are puzzled about why Naspers enters the equation, the company acquired 46.5% of Tencent in return for a $32 million VC investment in 2001, and as Tencent surged in market capitalization, Naspers has become a proxy for the stock, with 80% or more of its value coming from its Tencent holdings. The one difference is that the market is discounting the holding by 20-30%, in Naspers hands, reflecting concerns about taxes due and corporate governance at Naspers. That discount seems immune to almost every attempt by Naspers to make it disappear; for instance, Naspers spun off a Dutch entity, Prosus, and endowed it with a portion of the holding, in an attempt to eliminate the discount, but the discount persists in Prosus as well, albeit a little smaller. I decided that the potential upside of hoping that the discount narrows over time is exceeded by the downside of creating an extra layer between me and my Tencent investment. (For those of you who want to track my Tencent investment, and perhaps taunt me if (or when) I get wrong, I bought the ADR on August 31.)
ConclusionIn valuation, we seldom consider the explicit effects of government policy and regulations on company value. The rationale that is usually offered for this practice is either that the government's capacities to add and detract from value offset each other or that the current numbers for the company (growth, margin etc.) already incorporate the government effect. While ignoring governments may be defensible, when government policy is stable, it breaks down when governments deviate from the script, and behave differently that they have in the past. With Chinese tech companies, long used to the Chinese government being an ally in their search for growth and profits, the last year has been a rude awakening to a new reality of a more activist and punitive version. That said, I don't for a moment believe that the Chinese government cares about either consumers or competition, the stated reasons for the crackdown, and am convinced that this is more about the it exercising control over both companies and data. I also believe that the adjustment in market prices that we have seen in Chinese tech companies is reflecting the fear that investors have now that the government will act as a constraint rather than an accelerator on future growth and profitability. As markets recalibrate prices to reflect the new reality, there are opportunities for solid returns in this space, and I hope to one of the beneficiaries!
YouTube Video
ValuationsTencent: Government as benefactor, net negative and adversaryAlibaba: Government as benefactor, net negative and adversaryJD.com: Government as benefactor, net negative and adversaryDidi: Government as benefactor, net negative and adversary
August 2, 2021
A DIY (Do-It-Yourself) Valuation of Zomato
Just over a week ago, I valued Zomato ahead of its market debut, and as with almost every valuation that I do on this forum, I heard from many of you. Some of you felt that I was being far too generous in my assumptions about market share and profitability, for a company with no history of making money, and that I was over valuing the company. Many others argued that I was understating the growth in the Indian food market and the company's potential to enter new markets, and thus undervaluing the company, a point that the market made even more emphatically by pricing the stock at about three times my estimated value. A few of you posited that I was missing the point entirely, and that Zomato is a trader's game, and that there are plenty of reasons for traders to be optimistic about its future prospects. In this post, rather than impose my story (and value) on you, I offer a template for telling your own story about Zomato, and arriving at your own estimate of value.
The Prelude
After I posted my valuation last week, I did find some of the portrayals of my post to be a little unsettling. Some started by describing me as some kind of valuation luminary, and then proceeding to describe what I did to arrive at value as the result of deeply insightful research. Let me dispel both delusions. First, there is nothing in valuation that merits the use of “expert” or “guru” as a descriptor, since it is for the most part, common sense, layered with a few valuation basics. Second, while valuation practitioners have created their own buzzwords to create an aura of mystery, and added complexities, often with no reason other than to intimidate outsiders, I believe that anyone should be able to value a company, as I hope to show later in this post. There was also some who misread my post to imply that I disliked Zomato as a company, or that I was trying to talk others out of investing in the company. Neither assertion is true, and since they relate to what I view as fundamental truths about investing, let me elaborate:
Good Company versus Good Investment: While it is true that, at least in my assessment, Zomato is over priced, making it a bad investment, it does not follow that it is a bad company. I have written about the contrast between good investments and good companies before, but the picture below captures the essence:
In short, your assessment of whether a company is good, average or bad is based upon how you see their business model playing out in future earnings and cash flows, but your assessment of whether it is a good investment depends upon whether your expectations for the company are more positive or negative than the market expectations for that company. My story for Zomato is a very positive one, where the company not only maintains its market share of a growing Indian market, but preserves its profitability, in the face of competition. That is one reason that I emphasized that unlike some, who have concluded that its money-losing status and big ambitions make it a "bad" company, my conclusion is that it is a good company. That said, the market seems to be pricing in the expectation that it will be a great company, and in my view, that judgment is premature.Taking ownership of investment decisions: I value companies for an audience of one, and that audience member is forgiving and understanding, because I see him in the mirror every day. It has always been my belief that as investors, each of us needs to take ownership of our investment decisions, and that buying or selling a company because someone else is doing so, even if that person has legendary investment credentials, is a dereliction of investment due diligence. Thus, if you find Zomato to be cheap and buy it, I have no desire to talk you out of your decision, since it is your money that you are investing, and that decision should be based upon your assessment of the company's prospects, not mine.If investing is all about market price and how it relates to your assessment of value, it follows that there will never be consensus, and that disagreement is not only part and parcel of the process, but a healthy component in good valuation.
Valuation Storytelling: The Feedback Loop
In my valuation of Zomato, I laid out the story that I was telling about the company and how it played out in valuation numbers. It is part of a broader theme that I have harped on for years, which is that a good valuation is a bridge between story and numbers, and in my book on how to build that bridge, I talked about a five-step process:
 In my last post on Zomato, you saw much of this process play out, but I want to focus on the fifth step, i.e., keeping the feedback loop open, and what it requires:Talk to a diverse audience: We live in a world of specialization, in almost every aspect of life, and that trend comes with mixed blessings. On the plus side, we now have experts who have spent their entire lives delving into an extraordinarily narrow slice of a discipline, often at the expense of the rest of that discipline. On the minus side, this expertise creates tunnel vision, where these experts often lose the forest for the trees. To make things worse, we have created workplaces, where these specialists often interact only with each other, making their isolation almost complete. I am lucky that I am able to interact with people with very different backgrounds (bankers, VCs, founders, CFOs, regulators), from different geographies and with very different perspectives, through my teaching and writing, and my suggestion is that you hang out less with people who think just like you do (often because they have the same training and credentials) and more with people who do not.Transparency over opacity: You have all heard the old saying about economists (and market gurus) needing three hands, because they constantly seem to have two of them busy, with their "on the one hand, and the other" prevarications about the future, that leave listeners confused about what they are predicting. I start with my valuation classes with the motto that I would rather be transparently wrong than opaquely right. Consequently, when I value companies, I try to take a stand on value, and be open about process, data and mechanics, so that anyone can not only replicate what I did, but also find their own points of disagreement, and reflect those changes in their own assessed values. I am also well aware of the risk that by putting out valuation details, I will be proven wrong in the future, but I like the accountability that comes with disclosure. In commenting on my Zomato valuation, some of you pointed to how wrong I have been in valuing Uber and Tesla in the past, and while that is fair game, I have made peace (really) with my mistakes.Listen to those who disagree with you: I try to listen to those who disagree with me on any forum, whether it be social media or snail mail, for a very selfish reason. On every company that I value, I know that there are people out there who know more than I do about some aspect of the company (its products, market or competition) that I am valuing, and I can learn from them. With Zomato, for instance, I have learned about online food delivery and restaurants in India in the two weeks since I posted my Zomato valuation. I have some understanding of why Zomato Pro has not caught on as quickly as the company thought it would, why some of you prefer Swiggy, and even what you like to order from restaurants. (Biryani seems to a much bigger draw, for Indian diners, than it was in the days that I was growing up in India.)Be willing to change: The three most freeing words in investing and valuation are “I was wrong”, and I would be lying if I said they comes easily to me. That said, I find it easier to say those words now that I have had practice, and while some view this as an admission of weakness, saying it releases you to tell a better, and sometimes different, story. Bill Gurley’s critique of my narrow definitions of total market in my first Uber valuation significantly changed not only my valuation of that company, but has played a role in how I estimate total market size and value sharing economy companies.The feedback that I have received on Zomato has already had tangible effects on my valuation. For instance, some of you noted that the corporate tax rate in India is 25%, not 30%, and while the Indian tax code with its predilection to add in surcharges that seem to last forever, and exceptions, still leaves me confused, I will concede on this point (pushing up my value per share marginally from 41 INR/share to about 43 INR/share). I have had pushback on my story’s focus on Indian food delivery, with some pointing to the potential for Zomato to expand its market globally, and others to the expansion possibilities in Indian grocery deliveries and from cloud kitchens. While I believe that the networking advantage that works to Zomato’s benefits will stymie them if they try to expand to large foreign markets and that the grocery delivery market, at least for the moment, offers too small a slice of revenues to be a game changer for the company, those are legitimate points.
A DIY Valuation of Zomato
If, as you read my Zomato valuation, you found yourself disagreeing with me, I would like to offer you a way of valuing the company, with your disagreements incorporated into the value. Put simply, I will take care of the background work and the valuation mechanics, if you can supply the story. So, if you are ready, let’s go!
1. Total Addressable Market & Scaling Growth
The first and biggest part of the Zomato story is the total market that it can go after, since it defines how big a story you can tell, and by extension, how big your value can be. In my valuation, I assumed that Zomato’s primary revenues would continue to come from customers ordering food from restaurants for pickup and delivery, and that notwithstanding its global ambitions, India will remain its main market. That assumption led to my base case estimate of about 2,000 billion rupees (just over $25 billion) for the total market. This was the assumption that got the most pushback, on two fronts, first that I was ignoring the possibility that Zomato’s global reach could expand that market and second that adding grocery deliveries could make the market bigger. Some also mentioned the potential for growth from cloud kitchens, i.e., restaurants (small and large) that offer food only for delivery. So, with no further ado, here are your choices:
 DIY Valuation Spreadsheet
For pessimists about Indian growth and eating habits, I offer the possibility that the total market will grow to only 1,125 billion ($15 billion) in ten years. For optimists, allowing for more growth in the Indian market or adding global growth makes the market bigger, and adding grocery deliveries to the total market more than doubles the market. In addition, you can make a judgment on whether the growth will be front ended (more growth in the early years) or spread evenly over time:
 DIY Valuation Spreadsheet
This choice will be tied to how quickly you think that the Indian economy and food delivery market will develop over time.
2. Market Share
Zomato is currently one of the two largest companies in the Indian food delivery market, with a market share that is just above the the 40%. In my valuation, I assume that the food delivery market, following a pattern that seems to be forming globally, will remain dominated by a couple of players, and leave the market share at 40%. Many of you suggested that the Indian market’s diversity, across regions and income classes, would result in a more splintered market, with lower market share, but a few argued that Zomato’s capital raise would allow it to dominate the market, earning an even higher market share:
 DIY Valuation Spreadsheet
In making this judgment, keep in mind that the more expansively you define the total market, the more you may have to pull back on market share. Also, if you do choose a dominant market share (60% or higher), consider the potential for legal and regulatory pushback.
3. Revenue Slice
The driver for the online food delivery business remains the slice of the total food order that accrues to them as base revenues, and this slice is what has to use to pay delivery personnel, cover operating costs and be used to acquire new customers. In my base case valuation, I assumed that Zomato would get to keep the 22% of gross order value in the future, a little higher than its COVID-affected FY 2021 numbers and a little lower than its FY 2020 numbers. As Zomato tries to maintain its leading market share of the Indian market, this number will be the one that will come under the most pressure, since an aggressive competitor (like Amazon Food) may be willing to settle for a lower percentage. Note that there is also the possibility that the Indian food delivery market will end up dominated by two or three companies, and that these companies could come to an implicit agreement to leave the GOV slice untouched. That would be unfair to restaurants, but will improve the bottom line for the online delivery companies:
 DIY Valuation Spreadsheet
In making a choice on revenue slice, recognize that it will be affected by your choices on market size and market share. Thus, if your total market is much bigger, because you have added in grocery deliveries, you should also be using a lower revenue slice, since grocery stores, with their lower profit margins, are reluctant to let delivery companies keep more than 10% of the order. In the US, for instance, large grocers have pushed back against Instacart’s cut (about 9%) of gross order value, and have started their own delivery services.
4. Operating Margins & Pathway to Profitability
In my valuation of Zomato, I noted that one of the advantages of being an intermediary is that the gross and operating margins tend to be high, once growth subsides that the expenses (selling and advertising costs) associated with delivering that growth scale down. In my base case, I assumed a pre-tax target operating margin of 35%, but that margin will depend on how the competitive landscape evolves. If you have only two or three players, with a live-and-let-live attitude, margins will be high for all of the competitors, but if they continue to try to aggressively claw back from market share, through advertising and discounting, they will decline for all of the players.
 DIY Valuation Spreadsheet
In my Zomato valuation, I also assumed that the company would continue to lose money in the near term, but that operating margins would converge on the target value in year 7. This assumption implicitly stands in for your views on how smooth the pathway to profitability will be for Zomato, with rockier pathways leading to a longer time period before you reach the target margin:
 DIY Valuation Spreadsheet
Here again, the assumptions about margins will depend on the businesses that you believe that Zomato can enter, using its platform capabilities. In the last week, I have heard arguments that Zomato can go beyond food delivery into running cloud kitchens, enter the health/fitness market and even be a lender to restaurants. While all of these are possible, these are businesses with very different profitability profiles, and are unlikely to earn operating margins even remotely close to the margins that can be earned in the online food delivery business.
5. Reinvestment
The key ingredient connecting value to growth is the reinvestment needed to sustain that growth. Put simply, a company that has to reinvest large amounts to deliver a specific growth rate will have lower cash flows and be worth less than an another company with the same growth rate, but lower reinvestment needs. The input that I used in the Zomato valuation to bring in reinvestment is the sales to capital ratio, a metric measuring how much revenue is generated for each dollar of capital invested, with reinvestment defined broadly to include net capital expenditures (capital expenditures minus depreciation), working capital needs, technology investments in the platform and acquisitions, with a higher number reflecting more efficient reinvestment. In my story, I see a continuation of their historical pattern of reinvesting in acquisitions and technology, albeit with more efficient growth in the near term, as the company bounces back from the COVID effect; my sales to capital ratio for next year is 5.00, dropping to 3.00 in years 2-5, before settling into 2.50 in steady state. Here again, there is room for debate, since you could argue for less reinvestment in the future (than I am assuming), based upon past acquisitions paying off, or for more reinvestment, if the company tries to buy its way into new markets and businesses.
 DIY Valuation Spreadsheet
Since the sales to capital ratio is not one that is widely reported, you may find yourself lacking perspective on what comprises a high, low or typical number.
6. Risk
There are two risk parameters in intrinsic valuation, the cost of capital accounting for the risk or variability in expected cash flows and the failure probability incorporating the risk that your company will not make it as a going concern. In the Zomato valuation, I attached a 10% chance of failure, with the large cash balance (especially after the IPO) offsetting concerns from the company's money losing, cash burning status. For the cost of capital, I followed the traditional route of estimating the company's costs of equity (based upon its exposure to market risk) and after-tax cost of debt, to arrive at an initial cost of capital of 10.25%, which I lowered over time to 8.97%, with both numbers in Indian rupees. For those of you who may disagree with my estimates on these numbers, I will make the confession that in this valuation, this input is not on my top ten list of key inputs. To see why, consider this histogram of costs of capital (that I computed) for publicly traded Indian companies in July 2021:
 My Data Update from 2021
Note that 80% of Indian companies have costs of capital between 8.01% and 13.16%, and that half have costs of capital between 9.50% and 12.06%. To estimate a cost of capital for Zomato, consider this simplistic (but effective) approach, based on these estimates:
My Data Update from 2021
Note that 80% of Indian companies have costs of capital between 8.01% and 13.16%, and that half have costs of capital between 9.50% and 12.06%. To estimate a cost of capital for Zomato, consider this simplistic (but effective) approach, based on these estimates:
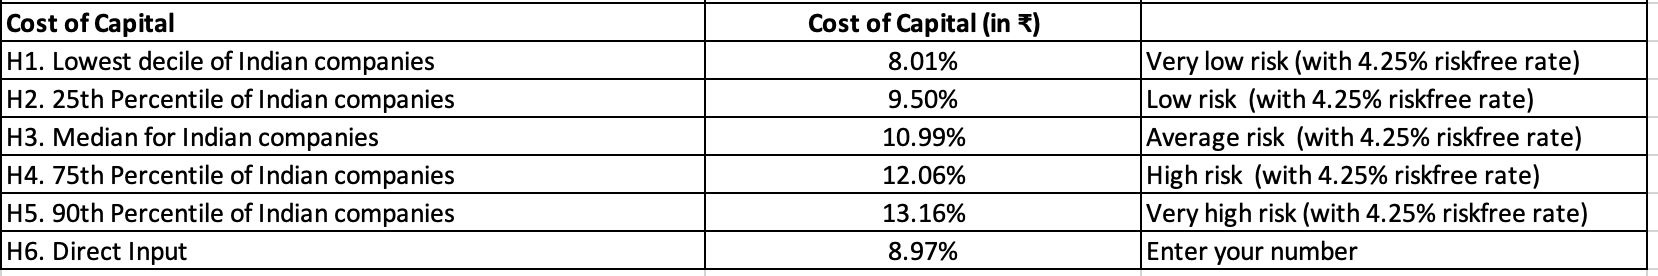 DIY Valuation Spreadsheet
Thus, if you feel that I have underestimated Zomato's risk in my valuation, consider going with an initial cost of capital of 12.06% (the third quartile), whereas if you believe that I have overestimated the risk, go with 9.50% (the first quartile). Then, move on to the inputs that really matter, since, in my view, this is not one of them.
DIY Valuation Spreadsheet
Thus, if you feel that I have underestimated Zomato's risk in my valuation, consider going with an initial cost of capital of 12.06% (the third quartile), whereas if you believe that I have overestimated the risk, go with 9.50% (the first quartile). Then, move on to the inputs that really matter, since, in my view, this is not one of them.Possible, Plausible and Probable
A common pushback against story telling is that it allows investors, analysts and appraisers to let their imaginations run riot, creating fairy tale valuations. It is to counter that possibility that I argue that every valuation story has to go through a three part test:

As you navigate your way through the choices, you may be tempted as an optimist to go with the most positive (for Zomato's value) choices on each variable (biggest market, highest market share, highest margin, lowest cost of capital) or the most negative (smallest market, lowest market share, lowest margin, highest cost of capital). In fact, the former if often labeled a "best case" and the latter a "worst case" valuation, when in fact, neither passes the possible/plausible/probable test, since assuming that you will go after the biggest market will mean accepting lower margins and higher reinvestment. Thus, I could tell you that the best case value is ₹423 and that my worst case value is ₹0, but that would be both useless and misleading. That said, you can already see, no matter what your priors, that there is a whole range of stories for Zomato that pass the test, and that they can yield values per share that are very different:
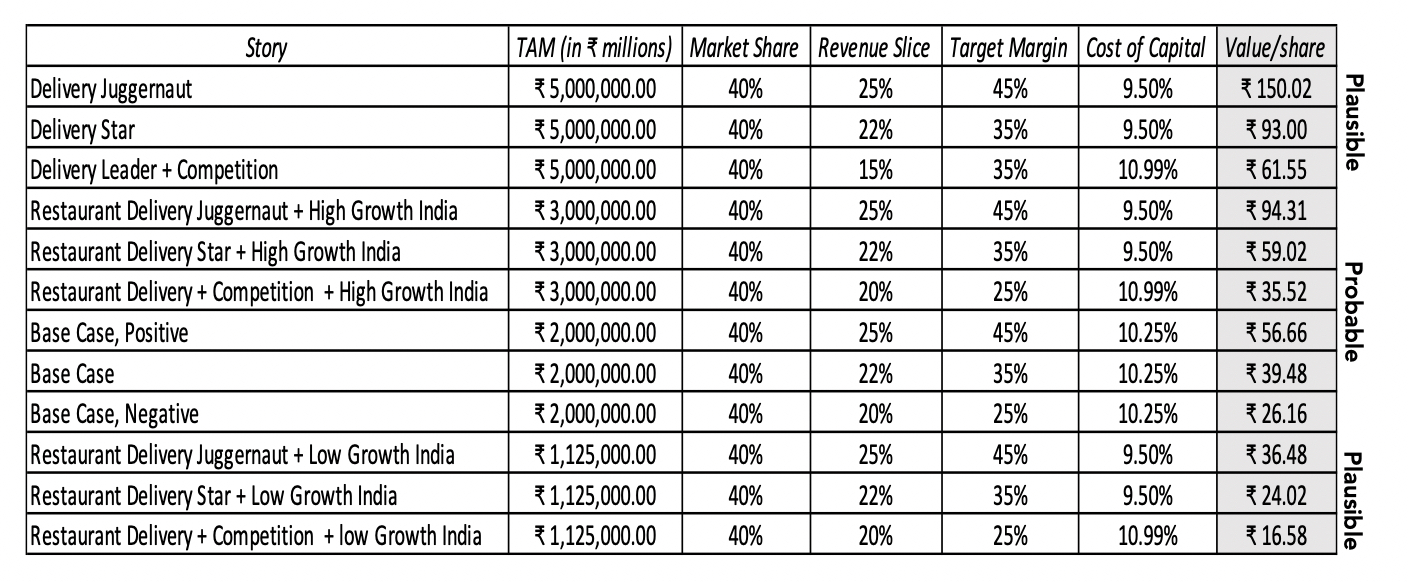 No failure risk in juggernaut stories, 10% risk in others
The most upbeat story that passes the plausibility test, albeit barely, is the one where Zomato targets the food and grocery delivery markets, while maintaining its revenue slice at 25% and margins at 45% (duopoly levels) and a low risk profile, and even with that unlikely combination of assumptions, the value per share is ₹150, about 10% higher than its stock price of ₹140, on August 2nd. Most of the plausible stories fall between ₹30 and ₹60, with your views about growth in the Indian economy & delivery market, revenue slice, margins and risk determining where you fall in the spectrum. This table contains only a small subset of the stories that can be told about Zomato, and I would encourage you to try your hand at the DIY valuation. Once you are done, please go to this Google shared spreadsheet and stake out your value. In a world where we trust crowds to get things right on every aspect of our lives from what restaurant to eat at to what movies to watch, let's get a crowd valuation of Zomato going.
Playing the Zomato Game
I am sure that there are some of you are wondering whether any of this discussion matters, if the market pricing is based upon mood and momentum. After all, if enough buyers line up to buy Zomato shares, perhaps drawn to it by the success of others, there is no reason why the price cannot continue to rise, no matter what the value. I don't disagree with that sentiment, and it goes back to the contrast I draw not just between value and price, but between investing and trading. As an investor, I am having trouble finding a pathway to justify paying 140 INR per share, for Zomato, even with the most upbeat stories that I come up with, for the company. That may of course reflect a failure of imagination on my part, and you may be able to find a narrative for the company that allows you to invest in the company. As a trader, the question of whether you should buy Zomato comes down squarely to how good you are at playing the momentum game, knowing when to get on, and more importantly, when to get off. For you, the value of Zomato may be irrelevant, and you will need a different set of metrics (charts, price and volume indicators) to make your decisions. I wish I could help you on that front, but trading is not my game, and I have neither the tools nor the inclination to play it. I wish you the best!
YouTube Video
Spreadsheets
A DIY Valuation of ZomatoGoogle Shared Spreadsheet (Crowd Valuation)
July 22, 2021
The Zomato IPO: A Bet on Big Markets and Platforms!
Zomato, an Indian online food-delivery company, was opened up to public market investors on July 14, 2021, and its market debut is being watched for clues by a number of other online ventures in India, waiting in the wings to go public. The primary attraction of the company, to investors, comes not from its current standing (modest revenues and big losses), but from its positioning to take advantage of the potential growth in the Indian food delivery market. In this post, I will value Zomato, and rather than just make a value judgment (which I will), I will also tie the value per share to macro expectations about the overall market. In short, I will argue that a bet on Zomato is as much a bet on the company’s business model, as it is a bet on Indian consumers not only acquiring more buying power and digital access, but also changing their eating behavior.
Setting the Stage
As a lead in to valuing Zomato, it makes sense to look not just at the company’s history, but also at its business model. In addition, since so much of the excitement about the stock comes from the potential for growth in the Indian food delivery market, I set the stage for that analysis by comparing the Indian market to food delivery markets in other parts of the world, as a prelude to forecasting its future path.
History and Business Model
Zomato was founded in 2008 by Deepinder Goyal and Pankaj Chaddah, as Foodiebay, in response to the difficulties that they noticed that their office mates were having in downloading menus for restaurants. Their initial response was a simple one, where they uploaded soft copies of menus of local restaurants, in Delhi, on to their website, initially for people in their office, and then to everyone in the city. As the popularity grew, they expanded their service to other large Indian cities, and in 2010, they renamed the company "Zomato", with the tagline of "never have a bad meal". The business model for the company is built upon intermediation, where customers can connect to restaurants on the platform, and order food, for pick up or delivery, and advertising. Along the way, the company has transitioned from an almost entirely an advertising company to one that has become increasingly focused on food delivery, and in 2021, the company derived its revenues primarily from four sources:
Transaction Fees: The bulk of Zomato's revenues come from the transactions on its platform, from food ordering and delivery, as the company keeps a percentage of the total order value for itself. While Zomato's revenue slice varies across restaurants, decreasing with restaurant profile and reach, it remains about 20-25% of gross order value. It is worth noting that Swiggy, Zomato's primary competitor in India, also takes a similar percentage of order revenues, but Amazon Food, a new entrant into the market, aims to take a smaller portion (around 10%) of restaurant revenues.Advertising: Restaurants that list on Zomato have to pay a fixed fee to get listed, but they can also spend more on advertising, based upon customer visits and resetting revenues, to get additional visibility. Subscriptions to Zomato Gold (Pro): Zomato also offers a subscription service, and subscribers to Zomato Gold (now Zomato Pro) get discounts on food and faster deliveries. The service was initiated in 2017 and it had 1.5 million plus members in 2021, delivering subscription revenues of 600 million rupees (a little less than $ 10 million, and less than 5% of overall revenues) in 2021.Restaurant Raw Material: In 2018, Zomato introduced HyperPure, a service directed at restaurants, offering groceries and meats that are source-checked for quality. While direct measures of revenues from HyperPure are difficult to come by, the revenues that the company shows under traded goods (which include HyperPure revenues) suggests that it accounts for about 10% of the total revenues.In conjunction with the other services it offers to restaurants, including consulting and data, it suggests that while food delivery and advertising are the company's primary revenue generators today, it has ambitions extending into the broader food business. Zomato has grown at exponential rates for much of the last decade, with a surge in the number of cities that it serves in India, especially in the last few years, from 38 in 2017 to 63 in 2018 to more than 500 in 2021, extending its reach into smaller urban settings.
Revenues did drop in 2020, as COVID restrictions put a crimp on the restaurant business, but the quarterly data suggests that business is coming back. Along the way, the company has expanded its business outside India, with the United Arab Emirates being its biggest foreign market. That revenue growth has been driven partly by acquisitions that the company has made along the way:
 Source: Crunchbase
To fund these acquisitions and other internal growth investments, the company has been reliant on venture capitalists, who have supplied it with capital in multiple rounds since 2011:
 Source: Crunchbase
These capital infusions created a diverse ownership structure at the company, even prior to its going public:
 Source: Zomato Prospectus
The share of the equity owned but the original founders of the company has dropped dramatically over time, as the company has had to raise capital to fund its ambitious growth agenda, and Deepinder Goyal owns only 5.55% of the company's shares, prior to the IPO. Uber's ownership in Zomato is a result of Zomato's acquisition of Uber Eats India, where Uber received a share of Zomato's equity in exchange. As revenues have grown, the business model for the company has been slower to evolve, as the company has reported extensive losses along the way, as you will see in the next section.
The Market
Zomato's business model is neither innovative, nor groundbreaking, resembling other online food delivery companies in other parts of the world, like DoorDash, which had its initial public offering in 2020. The allure to investors comes from Zomato's core market in India, and the potential for growth in that market. To get a measure of this potential, I start by comparing the size of food delivery markets in India to the food delivery markets in China, the United States and the EU.
 Zomato Prospectus and Other Sources for EU data
The Indian food delivery market is small, relative to markets elsewhere in the world, and especially compared to China, the only other market of equivalent size in terms of population. There are three reasons for the smaller food delivery market in India, and they are highlighted in the table above:
Lower per-capita income: Eating out and prosperity don't always go hand in hand, but you are more likely to eat out, as your discretionary income rises. Thus, it should come as no surprise that the number of restaurants increases with per capita GDP, and that one reason for the paucity of restaurants(and food delivery) in India is its low GDP, less than a fifth of per capital GDP in China and a fraction of per capital GDP in the US & EU.Less digital reach: To use online restaurant services, you first need to be online, and digital reach in India, in spite of advances in recent years, lags digital reach in China, and is about half the reach in the US and the EU.Eating habits: Looking across the regions, it seems clear that there is a third factor at play, a pre-disposition on the part of the populace, to eat out. Looking at the number of restaurants in China and the size of its food delivery market, it is quite clear that Chinese consumers are far more willing to eat out (either in person at or with delivery from restaurants) than people living in the US and EU, especially if you control for per capita income differences. The Zomato story, or at least the upbeat version of it, is that the Indian food delivery/restaurant market will grow, as Indians become more prosperous and have increased online access. A simplistic way to illustrate the difference is to adjust the size of the market for per-capita income and digital reach, and I attempt to do that, relative to the Chinese market, in the table below:
Put simply, even if Indians had the same per-capita income and digital reach as Chinese consumers, the food delivery market in India would be far smaller than the Chinese market, perhaps because eating out is not as much as entrenched in Indian eating behavior. You can find multiple flaws with these comparisons, but the core fundamentals that will determine the size of the Indian food delivery market are clear. The size of the market in future years will be determined by how robustly the Indian economy will grow in the next few years, how quickly digitization continues its advance in the country and if and whether Indians become more open to eating out than they have historically.
Zomato: Story and Valuation
With the lead in on Zomato's history and business model, I can start constructing a story and valuation for the company, with the recognition that the biggest part of the story is in its macro elements. It stands to reason that disagreements about the story will be largely on those macro components, rather than in the company-specific components.
The Prospectus
To get the assessment of the company started, I began by looking at Zomato's prospectus and all of the concerns I noted about excessive and distracting disclosure that I laid out in last week's post on the topic, came rushing back to me. The Zomato IPO clocks in at 420 pages, much of it designed to bore readers into submission. Let's start with the useless or close to useless parts:
Definitions and abbreviations: The prospectus starts, and I wonder whether this is by design, with 17 pages of abbreviations of terms, some of which are obvious and need no definition (board of directors, shareholders), some of which are meaningless even when expanded (19 classes of preferred shares, all of which will be replaced with common shares after the IPO) and some of which are just corporate names.Risk Profile: If you did not believe my assertions about the pointlessness of risk sections in IPOs, please do read all 30 pages of Zomato's risk profile (pages 39-68 of the prospectus). The company lists 69 different risks investors may face from investing in the company, and after you have read them all, I dare you to list three on that list that you would remember. The risk profile starts with a statement that the company has a history of net losses and anticipates increased expenses in the future and goes on to add invaluable nuggets such as the "COVID-19 pandemic, or a similar public health hazard, has had an impact on the our business". Subsidiary/Holdings Mess: I find it mind boggling that a company that is only thirteen years old has managed to accumulate as many subsidiaries, both in India and overseas, as Zomato has done. Since Zomato owns 100% of most of these subsidiaries, there may be legal or tax reasons for this structure, but there is no denying that it adds complexity (and pages) to the prospectus, with no real information benefits. If you do make your way through this mush, there is useful information in the prospectus about the company's economics:Growth & Profitability trends: The company provides three years of financial statements in the prospectus (2018-19, 2019-20 and 2020-21) and you can get a sense of the company's growth and profitability trends by looking at the annual numbers: Zomato Prospectus
Since the numbers for 2020 are distorted by the COVID shutdown, the company provides quarterly numbers for the most recent quarters to argue that the growth reversal in 2020 will be quickly put in the rearview mirror:
 Zomato prospectus, with 2020 Q1 & Q2 numbers estimatedNote the sharp and predictable drops in gross orders in the first two quarters of the 2021 fiscal year, but also the increase in gross orders in the last quarter of FY 2021 (the first quarter of the 2021 calendar year), as the shut downs ease up.Unit Economics: The company does provide a sprinkling of unit economics to suggest that the underlying business is moving towards profitability. The lead in their argument is the contribution margin, i.e., the slice of the a typical order that is left as profits, after covering the costs of catering to that order:
 Zomato Prospectus
While the graph shows improvement, it is worth noting that the improvement is based upon a single year's (2021) numbers. There are, however, other facts about the unit economics that lend to optimism on the story. In particular, there is some evidence in the cohort table, where Zomato customers are broken down by how long they have been using the platform, that usage increases for more long-standing customers:
 Zomato Prospectus
The users who joined the Zomato platform in 2017 were not only ordering three times more than they were initially by the time they had been on the platform four years, but were also more likely to continue ordering at those levels in the 2021 fiscal year, when COVID put a dent in the Indian food delivery business. This is good news, but to make full sense of it, it would have been informative to see what percent of each year's users stayed active on the platform in subsequent years, but I could not find that statistic in the prospectus.Competitive Advantages: The competitive advantage section could have been cut and pasted from a dozen Silicon Valley companies in the last decade, with the networking benefit captured in a loop, where the more a platform gets used, the more benefits it provides to those on it, thus creating more usage:
Zomato Prospectus
The users who joined the Zomato platform in 2017 were not only ordering three times more than they were initially by the time they had been on the platform four years, but were also more likely to continue ordering at those levels in the 2021 fiscal year, when COVID put a dent in the Indian food delivery business. This is good news, but to make full sense of it, it would have been informative to see what percent of each year's users stayed active on the platform in subsequent years, but I could not find that statistic in the prospectus.Competitive Advantages: The competitive advantage section could have been cut and pasted from a dozen Silicon Valley companies in the last decade, with the networking benefit captured in a loop, where the more a platform gets used, the more benefits it provides to those on it, thus creating more usage:
 Zomato Prospectus and Uber Prospectus
Note the similarities between the picture to the left, from the Zomato prospectus, and the picture to the right is from the Uber prospectus, from 2019. That said, there is an element of truth in these pictures about how growth can lead to more growth, but neither picture addresses the fundamental business question of how to monetize this growth, since neither ride sharing nor food delivery has figured out how to be profitable. Proceeds: The company's plans for what it intends to do with the proceeds are mixed. A portion of the initial offering will represent the cashing out of Info Edge, one of the first venture capital providers to Zomato, and that has no direct effect on the valuation. Another portion, amounting to approximately 9 billion INR will remain in the firm, to cover future cash needs. It would be churlish on my part to take issue with the bloat and selective disclosure in Zomato's prospectus, since they are following the script that other technology companies around the world have written for going public, but it is frustrating to read through 420 pages, and still be left in the dark on key numbers.
The Story & Valuation
The story that I will tell for Zomato has several moving parts to it, but it can be broken down into the following components:
With the story in place, and the inputs that come out of it, the valuation, in a sense, does itself, and you can see the summary of the numbers below:
 Download spreadsheet
With my upbeat story of growth and profitability, the value that I derive for equity is close to 394 billion INR (about $5.25 billion), translating into a value per share of 41 INR. That may seem like a lot to pay for a money-losing company with less than 20 billion INR in revenues in the most recent year, but promise and potential have value, especially when you have a leader in a market of immense size. That said, the stock's pricing (72-75 INR, per share) makes it too expensive, notwithstanding my story.
Facing up to Uncertainty
If you who are wondering whether the assumptions that underlie my Zomato valuation could be wrong, let me set your mind at rest by assuring you that they most certainly are, and it does not bother me in the least. The reason that they are wrong is simple. I do not control the future, and no matter how many tools and current information I bring to the process, there will be surprises down the road. The reason it does not bother me is because, as I have said many times before, you don't have to be right to make money, just less wrong than everyone else. I do think there is a benefit to being open about uncertainty and facing up to it, rather than viewing it as something to be avoided or acting as if it is not there. I will use one of my favorite tools, a Monte Carlo simulation, and quantify the uncertainty I foresee in three of my most critical assumptions.
Total Market Size: A major driver of Zomato's value is the expected evolution of the Indian food delivery market. While I projected the market to increase to about $25 billion in my base case, that is based upon assumptions about economic growth and digital reach in India that could be wrong. In the simulation, I allow for a market size of between $10 billion (about 750-800 billion rupees) to $40 billion (3000-3200 billion INR).Market Share: In the base case, I assume that Zomato's share of the market will stabilize around 40% by year 5, premised on the belief that this will be a market with two or three big players, a a multitude of niche businesses. Given the regional diversity of the Indian market, it is possible that there may be more players in the market, in steady state, resulting in a lower market share (as low as 20%) or that the niche players will get pushed out, because of economies of scale, yielding a higher market share (up to 50%).Operating Margin: The operating margin of 30% that I predicted in my base case for Zomato is built on the presumption that the status quo will prevail, and that the delivery companies will be able to continue to see economies of scale, while holding their slice of the order value stable. If one of the players decides to aggressively go for higher market share (by offering discounts or bidding more for delivery personnel), operating margins will tend lower (15% is my low end). If, on the other hand, Zomato is able to keep its advertising business intact as it moves forward, it could delivery higher margin (45% is my upper end).Notice that there are two assumptions that analysts often lose sleep over that I am ignoring. The first is the reinvestment each year, that I estimate using a sales to capital ratio that varies across time. It affects my cash flows, but its effect on value is dwarfed by changes in assumptions about market size and share. The second is the cost of capital, a number that most valuation classes and books (including mine) belabor to the point of diminishing returns. Raising or lowering the cost of capital has an effect on value, but changing my assumptions about risk premiums, betas or debt ratios has a much smaller effect that changing assumptions that alter cash flows. The results of the simulations that I ran with distributions replacing point estimates for market size, share and operating margin are shown below:
Put simply, I think it is hubris to dismiss those who invested in Zomato at 72 INR per share or higher, as speculators or ill-informed, since there are plausible stories that get you to values higher than 100 INR per share. That said, given my story and valuation for the company, I think that at a 70-75 INR per share price, the stock looks over valued to me.
Add ons and Distractions
The most dangerous moments, when valuing a company, are after you think you are done, as those who disagree with your valuation (on either side) come up with reasons for adding premiums for positives about the company that you may have missed, if they want a higher value, or discounts for negatives about the company that you should have incorporated, if they want a lower value. In this section, I will start with the argument that a platform with millions of users offers optionality, a reasonable basis for a premium, but one where it can be difficult to attach a number to the value. Second, I will consider whether the fact that India is a big market makes Zomato deserving of a premium, and make a case that it is not. Third, I will confront the oft used contention that value is in the eye of the beholder, i.e., that Zomato is worth a lot because other investors believe it to be worth a lot, and examine a pricing rationale for Zomato. Finally, dismissing Zomato as an investment, just because it does not make money now, or fails to meet some conventional value tests on pricing (PE, Price to Book), is investing malpractice.
1. Platform Optionality
As a company with millions of users on its platform, there is an added layer to value for Zomato or any other platform-based company, that goes beyond the intrinsic valuation above. In effect, if Zomato can deliver other products and services to the users of the platform, it can augment its earnings and value. This is the "optionality" that some investors highlight in companies with large user bases (Amazon Prime, Uber, Netflix), but while I see the basis for the argument, I would offer some caveats.
First, not all platforms are created equal, in terms of being adding value, with platforms with more intense users and proprietary data having more value than platforms where users are transitory and there is little exclusive data being collected. One reason that I bought Facebook shares in 2018, after the Cambridge Analytica scandal, was my belief that its platform has immense value because of its reach (more than 2 billion users in its ecosystem), their engagement (Facebook users stay in the ecosystem for long periods) and the data that Facebook collects, through their engagement (posts, comments etc.). Second, even if you believe that there is optionality, attach a numerical value to that option is one of the most difficult tasks in investment. While there are option pricing models that can be adapted to do the valuation, getting the inputs for these models, especially before the optionality takes form, is difficult to do. With Facebook, in 2018, I arrived at an intrinsic value that was only modestly higher than the price (<10%), but used the optionality as the argument for pulling the buy trigger.Zomato's platform has the benefit of large numbers, but it falls short on both intensity and proprietary data. Thus, Zomato app users are on the system only when they order food, and the engagement is often restricted to food ordering and delivery. If Zomato plans to expand its offerings to its platform-users, it is very likely that these add-on businesses will be food-related, perhaps extending into grocery shopping, creating some option value.2. A Big Market Premium?
Indian and Chinese companies, especially in young and nascent businesses, have an advantage that they often play to, which is immense local markets. It is not surprising that companies play up this advantage, when marketing themselves to investors, with some analysts attaching premiums to value, just because of market size. I believe that this is a distraction, because that market size should already by incorporated into the intrinsic value, through growth and margin expectations. In my base case valuation of Zomato, I assume that revenues will increase more than twenty-fold over the next 10 years, because the Indian market is expected to grow so strongly. In fact, the danger to investors, when faced with Indian and Chinese companies, is not that they will under value these companies, but that they will over value them, precisely because the markets are so big. In a post and companion paper, I describe this as the big market delusion, where investors do not factor in the competition that will come from existing and new players, drawn into the business by the size of the market, and the resulting drop in profitability.
3. A Pricing Rationale
When you value young companies with promise, the most common push back that you will get is that value is whatever people perceive it to be, and young companies can therefore have any value that investors will sustain. This is a distortion of the word value, but it is true that young companies are more likely to be priced than valued, and the pricing will be based upon a simple pricing metric (anything from PE to EV/Sales) and what investors perceive to be the peer group. With Zomato, for instance, there are two ways in which investors may attach a pricing to the company.
VC Pricing: The first is to look at venture capitalists priced the company at, in their most recent funding rounds, and extrapolating from that number. In its February 2021 VC round, Zomato was priced at close to 400 billion INR ($5.4 billion) by a group of venture capitalists (including Fidelity and Tiger Global), who invested almost 50 billion INR (about $660 million) in the company. Comparable companies: The only direct comparable that Zomato has in India is Swiggy, which is still privately funded, At the risk of stretching the definition of "comparable firm", I compare Zomato's pricing (using the projected 72-75 INR share price on the IPO) to the pricing of Doordash, which went public in 2020:
One of the perils of pricing is that you can find almost always find a way to back up your preconceptions, if you try hard enough. Thus, if you are a Zomato bull, you could point to the EV/User and argue that it is cheap, relative to Doordash, whereas if you are a bear, you can point to Current revenue and GOV multiples, to make the case that Doordash is cheaper. To make the argument even messier, using forward multiples, where you scale the current enterprise value to expected revenues or earnings in 2031, make the Zomato case stronger, since it has higher expected growth than Doordash does.
The bottom line is that pricing is not a panacea for uncertainty or a cure for bias, since the uncertainty is just pushed into the background and there is plenty of room for biases to play out, in how you standardize price (which multiple you use) and and what your comparable are.
4. It is a money loser
There are good arguments to be made against investing in Zomato at is proposed offering price, but one of the emptiest, and laziest, is that it is losing money right now. I know that for some value investors, trained to believe that anything that trades at more than 10 or 15 times earnings or at well above book value, this argument suffices, but given how badly this has served them over the last two decades, they should revisit the argument. The biggest reason that Zomato is losing money is because it is a young company that is trying to take advantage of a market with immense growth potential, not because it cannot make money. In fact, if Zomato cut back on customer acquisitions and platform investments, my guess is that it could show an accounting profit, but if it did so, it would be worth a fraction of what it is today.
Conclusion
In investing and valuation, there is the presumption that rules and even the first principles of investing change as you go from one market to another, and this is particularly true when comparisons are made between developed and emerging markets. I believe that the first principles of valuation are the same in all markets, and I hope that I have stayed true to that belief in this post. I valued Zomato, using the same process that I used to value Doordash, with the country-specific effects being incorporated into my growth and risk projections. While I did take issue with some of the holes and over reach in Zomato's disclosures, I ran into the same challenges, when I valued Doordash. Zomato is a money-losing, cash burning enterprise now, but it has immense market potential and is on track to delivering on a viable business model. It will face plenty of challenges on that path, both at the micro level (management, competition) and at the macro level (economic and political developments in India). I believe that the company is currently over priced, given its potential, but I would have no qualms about investing in the stock, if the price drops in the near future, with the full understanding that this is a joint wager on a company, a sector and a country.
YouTube Video
Data & Spreadsheets
Zomato ProspectusZomato Valuation SpreadsheetPosts/PapersThe Big Market Delusion (Post and Paper)July 14, 2021
Disclosure Dilemma: When more (data) leads to less (information)!
In the last few decades, as disclosure requirements for publicly traded firms have increased, annual reports and regulatory filings have become heftier. Some of this surge can be attributed to companies becoming more complex and geographically diversified, but much of it can be traced to increased disclosure requirements from accounting rule writers and market regulators. Driven by the belief that more disclosure is always better for investors, each market meltdown and corporate scandal has given rise to new reporting additions. In this post, I look at trends in corporate reporting and filings over time, and why well-meaning attempts to help investors have had the perverse effect of leaving them more confused and lost than ever before.
Time Trends in Reporting
Publicly traded firms have always had to report their results to their shareholders, but over time, the requirements on what they need to report, and how accessible those reports are to the public (including non-shareholders) has shifted. Until the early 1900s, reporting by public companies was meager, varied widely across firms, and depended largely on the whims of managers, with smaller, closely held firms among the most secretive. Between 1897 and 1905, for instance, Westinghouse Electric & Manufacturing neither published an annual report, not held a shareholder meeting. In the years before the First World War, the demands for more disclosure came from critics of big business, concerned about their market power, but few companies responded. It took the Great Depression for the New York Stock Exchange to wake up to the need for improved and standardized disclosure requirements, and for the government to create a regulatory body, the Securities and Exchange Commission (SEC). The SEC was created by the Securities Act of 1933, which was characterized as "an act to provide full and fair disclosure of the character of the securities sold in interstate and foreign commerce", and augmented by the Securities Exchange Act of 1934, covering secondary trading of securities. Almost in parallel, accounting as a profession found its footing and worked on creating rules that would apply to reporting, at least at publicly traded companies, with GAAP (Generally Accepted Accounting Principles) making its appearance in 1933. In the years since, disclosure requirements have changed and expanded, with companies in foreign markets creating their own rules in IFRS (International Financial Reporting Standards), with many commonalities and a few differences from GAAP. To get a measure of how disclosures have changed over time, I will focus on two filings that companies have been required to make with the SEC for decades. The first is the 10-K, an annual filing that all publicly traded companies have to make, in the United States. The second is the S-1, a prospectus that private companies planning to go public have to file, as a prelude to offering shares to public market investors.
The 10-K (Annual Filing)
The Securities Exchange Act of 1934 initiated the rule that companies of a certain size and number of shareholders have to file company information with the SEC both annually and quarterly. The threshold levels of company size and shareholder count have changed over time (it currently stands at $10 million in assets and 2000 shareholders), as have the information requirements for the filing. In the early years, the SEC summarized the company filings in reports to Congress, but the general public and investors had little access to the filings, relying instead on annual reports from the companies, for their information. It was the SEC's institution of an electronic filing system (EDGAR) in 1994 that has made both annual (10-K) and quarterly (10-Q) filings easily and more freely accessible to investors, leveling the playing field.
I valued my first company in 1981, using an annual report as the basis for financial data, but my usage of 10-Ks did not begin until the 1990s. I have always struggled with both the language and the length of these filings, but I must confess that these struggles have become worse over time. Put simply, there is less and less that I find useful in a 10-K filing, and more verbiage that seems more intended to confuse rather than inform. Let me start with how this filing has evolved at one company, Coca Cola, between 1994 and 2020, using the most simplistic metric that I can think of, i.e., the number of pages in the filing:
 Coca Cola Investor Relations
This is clearly anecdotal evidence, and may reflect company-specific factors, but there is evidence to indicate that Coca Cola is not alone in bulking up its SEC filings. In a research paper focused almost entirely on how 10-K disclosures have evolved over time, Dyers, Lang and Stice-Lawrence count not just the words in 10-K filings (one advantage of having electronic filings is that this gets easier), but also what they term redundant, boilerplate and sticky words (see descriptions below chart):
 Dyers, Lang and Stice-Lawrence
Redundant words: Number of words in sentence repeated verbatim in other portions of reportBoilerplate words: Words in sentences with 4-word phrases used in at least 75% of all firms' 10KsSticky words: Words in sentences with 8-word phrase used in prior year's 10KWhile this paper goes only through 2013, a more updated study suggests that the word count has continued to climb in recent years:
 Lesmy, Muchnik & MugermanBoth studies referenced to above also point to another troubling trend in the 10-K filings, which is that they have become less readable over time. Lesmy, Muchnik and Mugerman use two popular measures of readability, the Gunning-Fog Index and the Flesch-Kincaid readability test on 10-Ks, and find that not only are 10-Ks much less readable than most texts (they use the Corpus of Contemporary English or COCA Academic texts) and the newspapers (they use the financial and general section of The Daily Telegraph, a UK paper), but that the gap is also getting wider:
 Lesmy, Muchnik & Mugerman
To be honest, I think that the authors are being charitable in their assessment of 10-Ks, by linking their reading to higher education. The complexity in the filings does not come from using bigger words or advanced language, but from using a mix of legalese, double-talk and buzzwords to leave readers, no matter how educated they are, in a complete fog. Why have 10-Ks become longer and less readable? Dyers, Lang and Stice-Lawrence make a creative attempt to answer this question, by first breaking down the filing information into thirteen topic categories and graphing how
 Dyers, Lang and Stice-Lawrence
After placing the lion’s share of the blame for bloat on the SEC and rule writers, Dyers et al, also note three topics account not just for much of the verbosity, but also the redundancy, stickiness and lack of readability: risk factors, internal control and fair value/impairment.
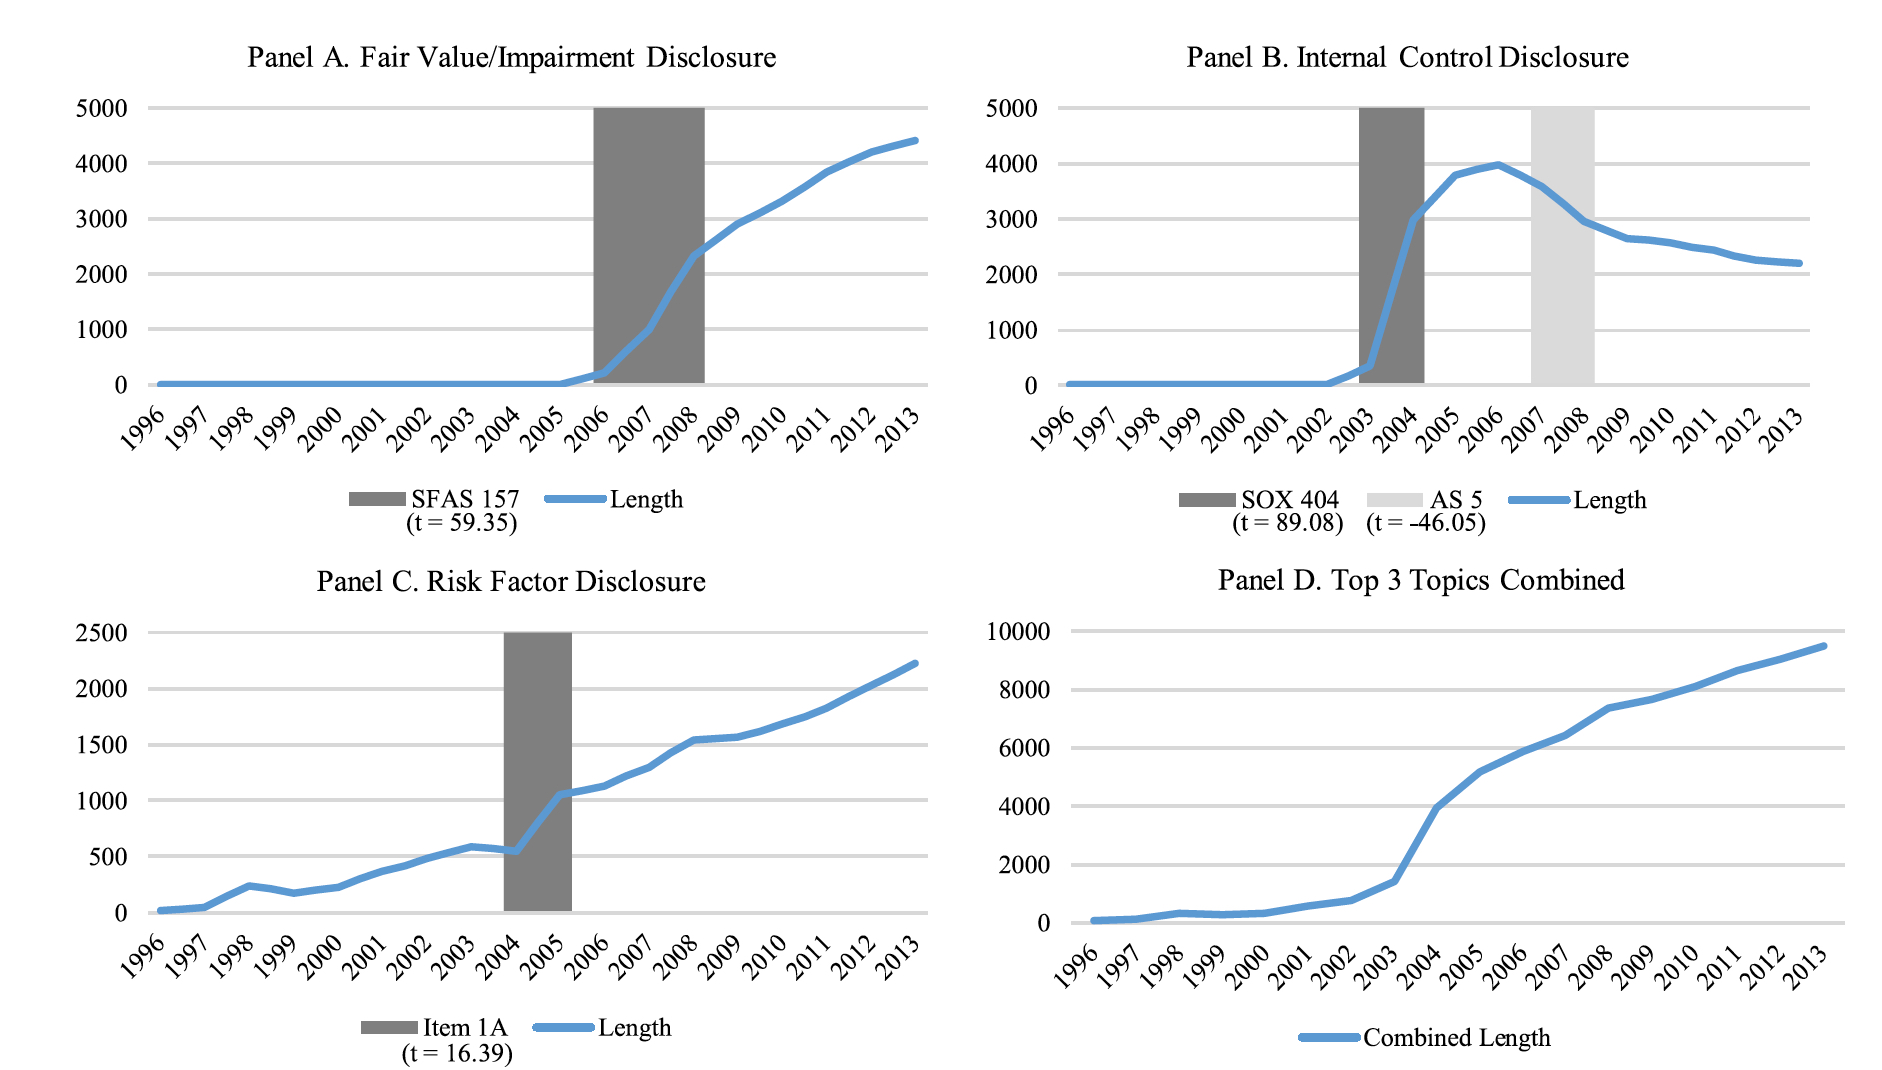 Dyers, Lang and Stice-Lawrence
While the risk factor section may provide employment for lawyers, internal control for auditors and fair value/impairment for accountants, I have always found these sections to be, for the most part, useless, as an investor. The risk factors are legalese that state the obvious, the internal controls section (a special thanks to Sarbanes-Oxley for this add-on) is a self-assessment of management that they are "in control", and the fair value/impairment by accountants happens too late to be helpful to investors; by the time accountants get around to impairing or fairly valuing assets, the rest of the world has moved on.
The S-1 (Prospectus)
The S-1 is a prospectus filing that companies that plan to go public in the US have to make, and it plays multiple roles, a recording of the company’s financial history, a descriptor of its business models and risks and a planner for its offerings and proceeds. As with the 10-K, the requirements for the prospectus go back to the Securities Exchange Act of 1934, but the disclosure requirements have become more expansive over time. To provide a measure of how much the S-1 has bulked up over time, consider the table below, where I compare the number of pages in the prospectus filings of two high profile companies from each decade, from the 1980s to today:
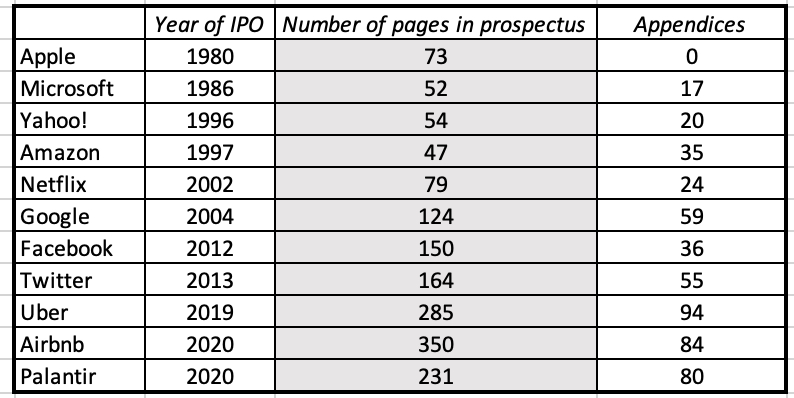 SEC Filings
Consider two high profile offerings from the 1980s, Apple and Microsoft, and contrast them with the filings from IPOs in more recent years. Apple’s prospectus from 1980 was considered long, running 73 pages, and Microsoft’s prospectus in 1986 was 69 pages long, with the appendices containing the financials. In contrast, Uber’s prospectus in 2019 was 285 pages long, with a separate section of 94 pages for the financial statements and other disclosures, itself an increase on the Facebook prospectus from 2012, which was 150 pages, with 36 pages added on for financial statements and other add-ons. Along the way, prospectuses have become more complex and less readable, and there are three forces that have caused these changes. The first is that the added verbiage on key inputs has made them more difficult to understand, rather than provide clarity. Consider, for instance, the disclosure requirements for share count, which have not changed substantially since the 1980s, but share structures have become more complex at companies, creating more confusion about shares outstanding. Airbnb, in its final prospectus, before its initial public offering asserted that there would 47.36 million class A and 490.89 million class B shares, after its offering, but then added that this share count excluded not only 30.87 million options on class A shares and 13.79 million options on class B shares, but also 37.51 million restricted stock units, subject to service and vesting requirements. While this is technically "disclosure", note that the key question of why restricted stock units are being ignored in share count is unanswered.The second is that companies have used the SEC's restrictions on making projections to their advantage, to tell big stories about value, while holding back details. For some companies, a key metric that is emphasized is the total addressable market (TAM), a critical number in determining value, but one that can be stretched to mean whatever you want it to, with little accountability built in. In 2019, Uber claimed that its TAM was $5.2 trillion, counting in all car sales and mass transit in that number, and Airbnb contended that its TAM was $3.4 trillion, five times larger than the entire hotel market's revenues in that year.Finally, while most companies, that are on the verge of going public, lose money and burn through cash, they have found creative ways of recomputing or adjusting earnings to make it look like they are making money. Thus, adding back stock-based compensation, capitalizing expenses that are designed to generate growth (like customer acquisition costs) and treating operating expenses as one-time or extraordinary, when they are neither, have become accepted practice.In sum, prospectuses like 10-Ks have become bigger, more complex and less readable over time, and as with 10-Ks, investors find themselves more adrift than ever before, when trying to price initial public offerings.
The Investor Perspective
As companies disclose more and more, investors should be becoming more informed and valuing/pricing companies should be getting easier, right? In my view, the answer is no, and I think that investors are being hurt by the relentless urge to add more disclosures. I am not the first, nor will I be the last one, arguing that the disclosure demon is out of control, but many of the arguments are framed in terms of the disclosure costs exceeding benefits, but these arguments cede the high ground to disclosure advocates, by accepting their premise that more disclosure is always good for investors and markets. On the contrary, I believe that the push for more disclosure is hurting investors and creating perverse consequences, for many reasons:
Information Overload: Is more disclosure always better than less? There are some who believe so, arguing that you always have the option of ignoring the disclosures that you don't want to use, and focusing on the disclosures that you do. Not surprisingly, their views on disclosure tend to be expansive, since as long as someone, somewhere, can find a use for disclosed data, it should be. The research accumulating on information overload suggests that they wrong, and that more data can lead to less rational and reasoned decision for three reasons. First, the human mind is easily distracted and as filings get longer and more rambling, it is easy to lose sight of the mission on hand and get lost on tangents. Second, as disclosures mount up on multiple dimensions, it is worth remembering that not all details matter equally. Put simply, sifting though the details that matter from the many data points that do not becomes more difficult, when you have 250 pages in a 10-K or S-1 filing. Third, behavioral research indicates that as people are inundated with more data, their minds often shut down and they revert back to "mental short cuts", simplistic decision making tools that throw out much or all of the data designed to help them on that decision. Is it any surprise that potential investors in an IPO price it based upon a user count or the size of the total accessible markets, choosing to ignore the tens of pages spent describing the risk profile or business structures of a company? Feedback loop: As companies are increasingly required to disclose details about corporate governance and environmental practices in their filings, some of them have decided to use this as an excuse for adopting unfair rules and practices, and then disclosing them, operating on the precept that sins, once confessed, are forgiven.. This trend has been particularly true in corporate governance, where we have seen a surge in companies with shares with different voting rights and captive boards, since the advent of rules mandating corporate governance disclosure. For a particularly egregious example of overreach, with full disclosure, take a look at WeWork's prospectus and especially the rules that it explicitly laid out for CEO succession.Cater to your audience: Company disclose data to multiple groups, to governments to meet regulatory requirements and for taxes, to consumers about the goods and services they they sell, to their bankers about loan obligations due and to shareholders about their overeat financial performance. Rule writers on disclosure sometimes seem to forget that each of these groups need different information, and trying to meet all their needs in one disclosure is a disservice to all of them. It is worth remembering that the reason that we have 10-Ks and S-1s at companies is for shareholders, interested in investing in the company, not regulators, consumers, accountants or lawyers. That said, it is also worth remembering that not everyone investing in a company is an investor and that many are traders. Drawing on a contrast that I have used many times before, investors are interested in the value of a stock, which, in turn, is determined by cash flows, growth and risk, and buying stocks that they believe trade at a price less than the value. Traders, on the other hand, have little interested in fundamentals, focusing instead on mood and momentum, and how those forces can lead to prices increase.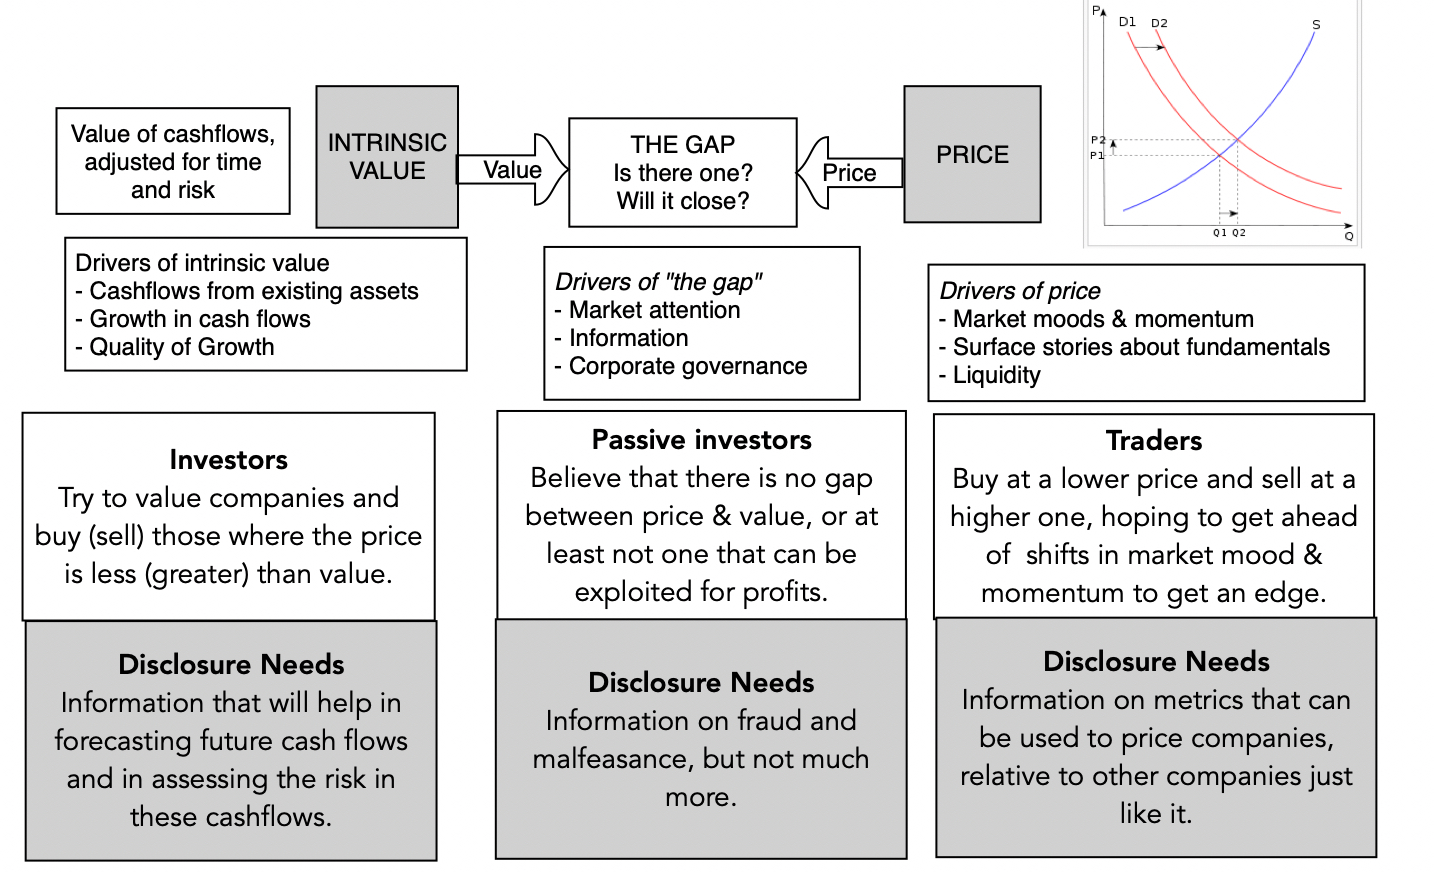 Much of the regulatory disclosure has been focused on what investors need to value companies, albeit often with an accounting bias. However, there are for more traders than investors in the market, and their information needs are often simpler and more basic than investors. Put simply, they want metrics that are uniformly estimated across companies and can be used in pricing, whether it be on revenues or earnings. With young companies, they may even prefer to use user or subscriber counts over any numbers on the financial statements. Make it about the future, not just the past: While I don't think that anyone would dispute the contention that investing is always about the future, not the past, the regulatory disclosure rules in the US and elsewhere seem to ignore it. In fact, much of regulatory rule making is about forcing companies to reveal what has happened in their past, and while I would not take issue with that, I do take issue with the restrictions that disclosure laws put on forecasting the future. With the prospectus, for instance, I find it odd that companies are tightly constrained on what they can say about their future, but that they can wax eloquently about what has happened in the past. Given that much or all of the value of these companies comes from their future growth, what is the harm in allowing companies to be more explicit about their beliefs for the future? Is it possible that they will exaggerate their strengths and minimize their weaknesses? Of course, but investors know that already and can make their own corrections to these forecasts. More importantly, stopping companies from making these forecasts does not block others (analysts, market experts, sales people), often less scrupulous and less informed than the companies, from making their own forecasts.Mission Confusion: Should disclosures be primarily directed at informing investors or protecting them? While it is easy to argue that you should do both, regulators have to decide which mission takes primacy, and from my perspective, it looks like protection is often given the lead position. Not surprisingly, it follows that disclosures become risk averse and lawyerly, and that companies follow templates that are designed to keep them on the straight and narrow, rather than ones that are more creative and focused on telling their business stories to investors.
Disclosure Fixes
The nature of dysfunctional processes is that they create vested interests that benefit from the dysfunction, and the disclosure process is no exception. I am under no illusions that what I am suggesting as guiding principles on disclosure will be quickly dismissed by the rule writers, but I am okay with that.
Less is more: I do think that most regulators and investors are aware that we are well past the point of diminishing returns on more disclosure, and that disclosures need slimming down. That is easier said than done, since it is far more difficult to pull back disclosure requirements than it is to add them. There are three suggestions that I would make, though there will be interest groups that will push back on each one. First, the risk profile, internal control and fair value/impairment sections need to be drastically reduced, and one way to prune is to ask investors (not accountants or lawyers) whether they find these disclosures useful. A more objective test of the value to investors of these disclosures is to look at the market price reaction to them, and if there is none, to assume that investors are not helped. (If you apply that test on goodwill impairment, you would not only save dozens of pages in disclosures, but also millions of dollars that are wasted every year on this absolutely useless exercise) Second, I would use a rule that has stood me in good stead, when trying to keep my clothes from overflowing my limited closet space, in the disclosure space. When a new disclosure is added, an old one of equivalent length has to be eliminated, which of course will set up a contest between competing needs, but that is healthy. Third, any disclosures that draw disproportionately on boilerplate language (risk sections are notorious for this) need to be shrunk or even eliminated.Don't forget traders: Almost all of the disclosure, as written today, is focused on investor needs for information. Thus, there is almost no attention paid to the pricing metric being used in a sector, and to peer group comparisons. Rather than adopt a laissez fare approach, and let companies choose to provide these numbers, often on their own terms and with little oversight, it may make more sense that disclosure requirements on pricing and peer groups be more specific, allowing for different metrics in different sectors. Just to provide one illustration, I believe that the prospectus for a company aspiring to go public should include details of all past venture capital rounds, with imputed pricing in each round. While investors may not care much about this data, it is central for traders who are interested in pricing the company. Let companies tell stories and make projections: The idea that allowing companies to make projections and fill in details about what they see in their future will lead to misleading and even fraudulent claims does not give potential buyers of its shares enough credit for being able to make their own judgments.With the S-1, the disclosure status quo is letting young companies off the hook, since they can provide the outlines of a story (TAM, multitude of users, growth in subscribers) without filling in the details that matter (market share, subscriber renewal and pricing).With triggered disclosures: To the extent that some companies want to tell stories built around non-financial metrics like users, subscribers, customers or download, let them. That said, rather than requiring all companies to reveal unit economics data, given the misgivings we have about disclosures becoming denser and longer, we would argue for triggered disclosure, where any company that wants to build its story around its user or subscriber numbers (Uber, Netflix and Airbnb) will have to then provide full information about these users and subscribers (user acquisition costs, churn/renewal rates, cohort tables etc.)I hope that we can keep these principles in mind, as we embark on what is now almost certain to become the next big disclosure debate, which is what companies should be required to report on environmental, social and governance (ESG) issues. You are probably aware of my dyspeptic views of the entire ESG phenomenon, and I am wary about the disclosure aspects as well. If we let ESG measurement services and consultants become the arbiters of what aspects of goodness and badness need to be measured and how, we are going to see disclosures become even more complex and lengthy than they already are. If you truly want companies to be good corporate citizens, you should fight to keep these disclosures in financial filings limited to only those ESG dimensions that are material, written in plain language (rather than in ESG buzzwords) and focused on specifics, rather than generalities. Speaking from the perspective of a teacher, put a word limit on these disclosures, take points off for obfuscation and then think of what existing disclosures should be removed to make room for it!YouTube Video
Company FilingsEDGAR Company Filings (US companies)Companies House (UK company filings)ResearchThe Evolution of 10-K Textual Disclosure: Evidence from Latent Dirichlet Allocation (Dyers, Lang & Stice-Lawrence)Doyoureadme? (Lesmy, Muchnik and Mugerman)
June 9, 2021
The Rise of SPACs: IPO Disruptors or Blank Check Distortions?
For decades, the process that companies in the United States have used to go public has followed a familiar script. The company files a prospectus, providing prospective investors with information about its business model and financials, and hires an investment banker or bankers to manage the issuance process. The bankers, in addition to doing a roadshow where they market the company to investors, also price” the company for the offering, having tested out what investors are willing to pay, and guarantee that they will deliver that price, all in return for underwriting commissions. During the last decade, as that process revealed its weaknesses, many have questioned whether the services provided by banks merited the fees that they earned. Some have argued that direct listings, where companies dispense with bankers, and go directly to the market, serve the needs of investors and issuing companies much better, but the constraints on direct listings have made them unsuitable or unacceptable alternatives for many private companies. In the last three years, SPACs (special purpose acquisition companies) have given traditional IPOs a run for their money, and in this post, I look at whether they offer a better way to go public or are more of a stop on the road to a better way to go public.
What is a SPAC?
The attention that SPACs have drawn over the last few months may make it seem like they are a new phenomenon, but they have been around for a long time, though not in the numbers or the scale that we have seen in this iteration. In fact, “blank check” companies had a brief boom in the late 1980s, before regulation restricted their use, largely in response to their abuse, especially in the context of "pump and dump" schemes related to penny stocks.
SPAC structure
To understand how the modern SPAC is different from the blank check companies of the 1980s, let’s revisit the regulations written in 1990 to restrict their usage. To protect investors in these companies, the SEC devised a series of tests that need to be met related to the creation and management of blank check companies:
Restricted purpose: The company has to have the singular purpose of acquiring a business or entity. Thus, it cannot be used as a shell company that chooses to alter its business purpose after the acquisition. Time constraints: The acquisition has to be completed within 18 months of the company being formed or return the cash to the its investors.Use of proceeds: The IPO proceeds, net of issuance costs, from the company going public have to be kept in an escrow account, invested in close to riskless investments, and returned if a deal is not consummated.Shareholder approval: During the process of finding an acquisition target and accomplishing the acquisition, shareholder approval is required, first when the target company is identified, and later when the acquisition price and terms are agreed to. As a prelude to shareholder approval, they have to be provided with the financial information on the proposed target and the necessary information to make an informed judgment.Opt out provisions: If shareholders in the company choose to redeem their shares, they are entitled to get their initial investment back, net of specified costs, but with interest earned.While these restrictions were onerous enough to stop the blank check company movement in its tracks, special purpose acquisition companies (SPACs) eventually were created around these restrictions. A SPAC is initiated by a sponsor, a lead investor who brings or claims to bring special skills to the acquisition process, either because of an understanding of an industry in which they plan to find a target or because of deal making skills. As sponsors, they receive a significant stake (~20%) in the SPAC (called a promote), contributing little or nothing to capital, and in addition to finding and negotiating the price for a target company, they sometimes provide more capital to the target company through PIPEs (private investment in public equity). The picture below summarizes the time line for a SPAC, and the role of the sponsor along the way:

Unlike the blank check companies of the 1980s, investors in SPACs get multiple layers of protection, both in terms of being able to approve or reject the choice of target companies and the terms of the deal, as well as being able to redeem their shares and receive their money back, with interest, if a deal is not done, or if they are dissatisfied with a proposed target/deal. That said, the SPAC sponsors are clearly in the driver's seat, not only because they are the deal makers, but also because they control a significant portion of the shares in the deal, much of it subsidized by other SPAC investors. At the end of the time window (usually, eighteen months to two years), the SPAC is wound up, with success (an approved merger) resulting in the target company becoming a publicly traded company, and failure (no target found or target deal rejected) translating into a return of cash to the SPAC investors. In a significant proportion of SPACs, the sponsors create an entity (a private or PIPE) to supply additional capital, with two reasons for the add on. The first is to provide additional capital, if needed, for the target company in the deal for its business needs. The second is to cover capital withdrawals from SPAC shareholders who choose to opt out and get their money back.
Going Public? The Choices
The process that a private company follows to go public, for the last few decades, has been built around bankers as intermediaries. Borrowing from an earlier post on the topic, I have summarized the traditional IPO process, with a list of reasons of why many venture capitalists and issuing companies have soured on the process:

Put simply, the traditional IPO process takes too long, costs too much and leaves both issuing companies and investors dissatisfied, the former because the the process takes too long and is too inefficient, and the latter because they feel that only a select few can partake at the offer price.
While banker-led IPOs will not disappear, you can see why the search is on for alternatives. In my earlier post, I looked at direct listings, where the company dispenses with the banking services (setting an offering price and roadshows) and lets the market set the price on the offering date.

This process, by doing away with the banking intermediaries, is less costly but it still takes time and comes with constraints, especially in the context of raising capital from the offering to cover future business needs. It may also be difficult for low-profile private companies to list directly, when investors are reluctant to invest based upon a prospectus, without someone else doing the due diligence (asking questions of management, checking the financials).
Looking at SPACs in the context of banker-run IPOs and direct listings, you can see some of the reasons for their surge in popularity. First, since SPACs go public and raise capital first, and then go on a search for targets, they may be more time efficient, where they can do deals to take advantage of short windows of market opportunity. Second, on the disclosure front, while the information disclosure requirements for SPACs largely resemble those for conventional IPOs, SPACs have more freedom to make projections and spin stories, albeit with basis and within reason. Finally, the SPAC sponsors take on the search and deal-making roles, using their industry knowledge to do due diligence and negotiate the best prices, in effect replacing investor due diligence with their own.
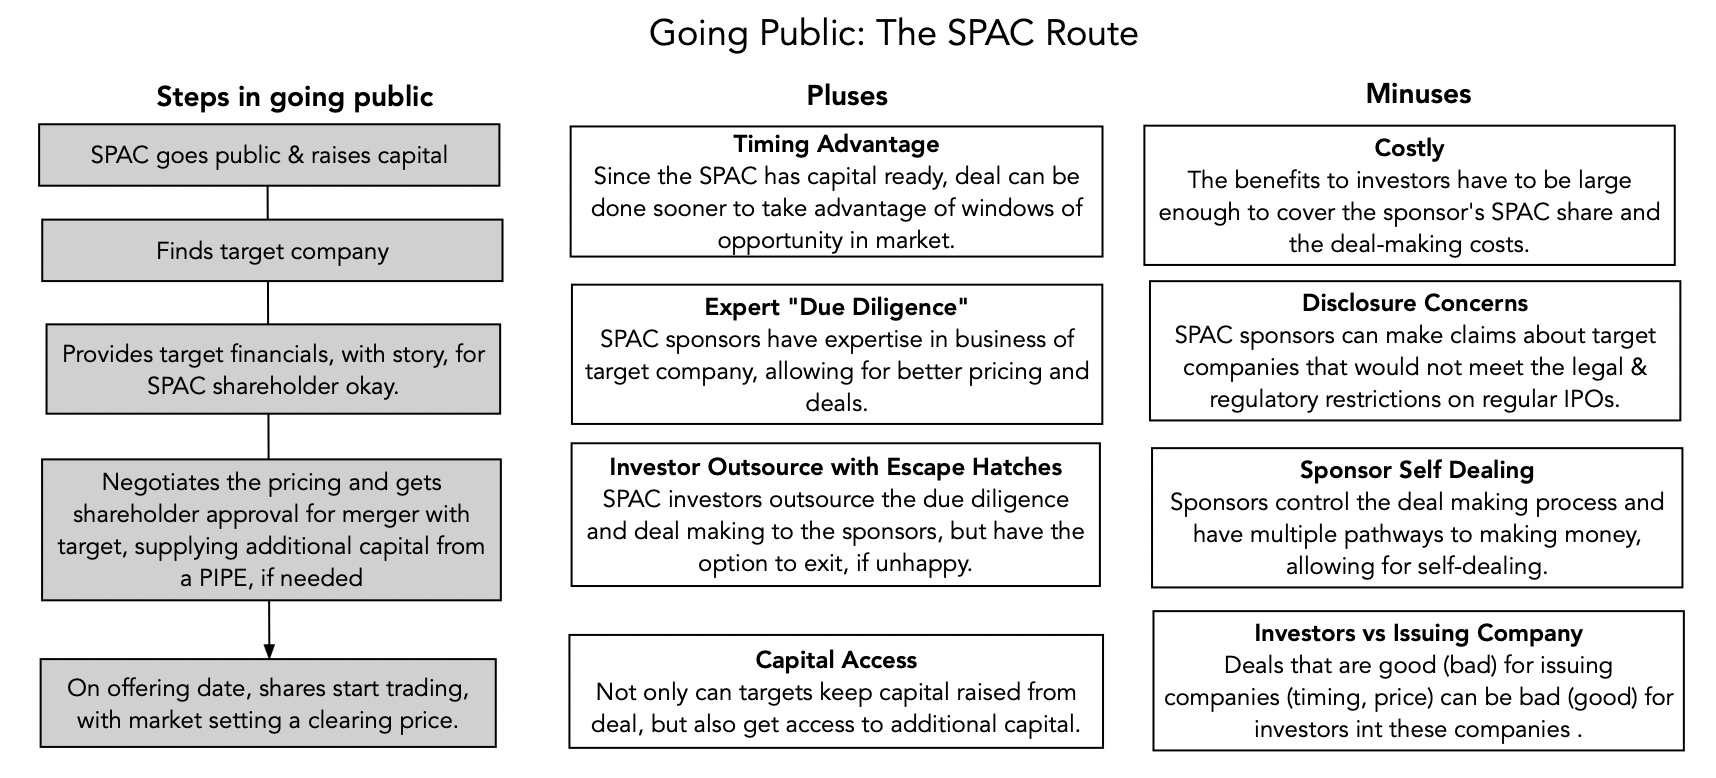 The benefits of the SPAC route to going public have to be weighed against its many costs. The first is that the SPAC sponsor's subsidized share of the SPAC (which can amount to more than 15-20% of the capital raised) and the deal-making costs (underwriting fees are 5% or more of the merger value) may be large enough to wipe out any potential timing and pricing benefits in the deal. The former effectively dilutes a SPAC investor's holding, right at the start, and the latter drains value from the deal. The second is that the SPAC sponsors, notwithstanding the protections built in for investors, are in control not only when it comes to the deal making, but also of the side aspects on the deal that can benefit them disproportionately. For instance, the capital provided by a PIPE in a SPAC can be at a discounted price, relative to the deal price. Finally, to the extent that SPACs are being marketed as being good for private companies planning to go public, because they allow these companies to time their offerings better and receive higher market prices, it is worth noting that these benefits come at the expense of investors in these SPACS. In other words, SPACs claiming that they deliver value to both issuing companies and to their own investors are trying to eat their cake and have it too.
The Rise of SPACs
As noted at the start of this post, the SEC regulations put into place in 1990 to restrict the use of blank check companies removed them from the market landscape for about a decade. It was not until 2003 that the modern SPAC was born, but its usage stayed limited until 2016. In fact, the real boom in SPACs has been in the last three years, with the pace picking up in the second half of 2020 and in 2021: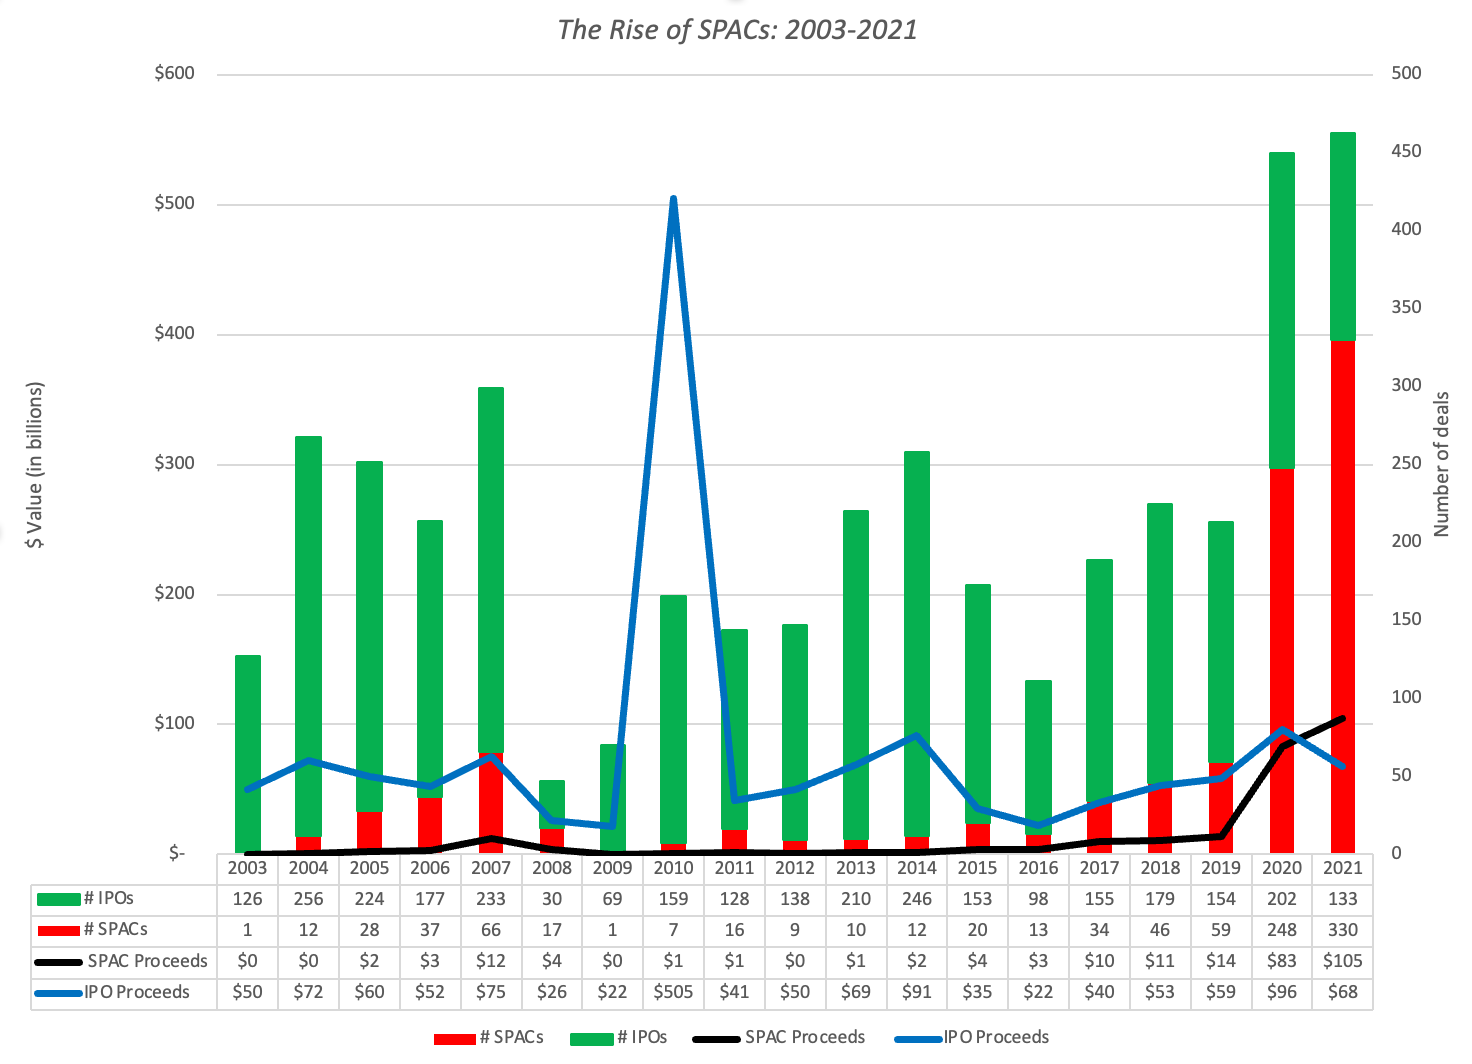 In 2020, SPACs accounted for more than half of all deals made, in terms of dollar value, and SPACs are running well ahead of that pace in 2021. Since there were no regulatory changes in 2020 that could explain the dramatic rise, the explanations for the surge have to lie in developments in the market and I would list four contributing factors:Low interest rates: Investors in SPACs effectively give up use of their proceeds, while the sponsors look for a deal. In a world, where interest rates were higher, the opportunity cost of idle cash may have repelled some investors, but in a world where interest rates, even on long term investments, is close to zero, that is not the case.High stock prices: It is no coincidence that the explosion in SPACs has come about while markets have been booming, and especially so for high-growth companies. There are two benefits that SPACs derive, as a consequence. The first is that the opt out clauses that SPAC investors possess to return their shares and ask for their money back are less likely to be triggered in up than down markets. The second is that investors tend to be sloppier and more willing to outsource their analysis and decision making, when markets are rising than when they are falling.Where pricing rules: Not only have markets been rising steeply for most of the last three years, but they have also been centered on the pricing game, where mood and momentum rule the roost, rather the value game, where fundamentals are key drivers. Since getting the timing right is key in the pricing game, it is not surprising that investors are attracted to SPACs, which at least in theory, are better positioned to take advantage of shifts in mood and momentum.And celebrities move markets: Markets have always had their sages and gurus, who move markets with their views and perspectives, but until recently these market movers were either investors with long track records of success (Warren Buffett is the iconic example) or perceived rule-changing powers (Fed chairmen, Presidents). The last decade, though, has seen the rise of celebrity market movers, including not just Mark Cuban, Elon Musk and Mark Cuban, who have some basis for their investor following, but also social media influencers, whose primary claim to fame is the number of people that track and follow their ideas. It cannot be a coincidence that many SPACs have signed up athletes and actors, hoping perhaps to use their followers to advance their investing aims, and that some of the highest profile SPAC sponsors are masters of social media.In sum, SPACs are as much a reflection of the times that we live in, as they are a potential solution to the going-public problem. As market fervor fades, and fundamentals reassert their importance, it is inevitable that there will be a pull back from the highs, but I think that SPACs are here to stay.
Disentangling the SPAC effect: Cui Bono?
I am neither a lawyer, nor do I know Latin, but I love the expression, Cui Bono (Who benefits). When faced with a shift in market practices, it is worth asking the question of who benefits and at whose cost, and with SPACs, and to answer this question, it makes sense to start by looking at who invests in SPACs, how SPACs are structured, and how investors use (or do not use) their powers to cash out, before or after a deal. In perhaps the most comprehensive look at the phenomenon, researchers at Stanford and NYU law schools took a look at SPACs last year, and in addition to finding that 85-90% of investors in SPACs are large institutions, they record a troubling fact. While SPAC shares raise $10 per share at the time of their offering, the median SPAC holds only $6.67 per share, at the time it seeks out a target, with the loss due to the dilution caused by subsidizing sponsor ownership and other deal-seeking costs.
SPAC Sponsors: The sponsors of SPACs, at least given their current structure, are the clear winners from this trend. When you receive shares of ownership that are three, four or even five times your invested capital stake, you have effectively tilted the game in your favor. At worst, if the deal does not go through, you return the cash to your investors, and walk away almost unscathed (at least, as an investor). If a deal does get done, you get a multiple of your original investment, presumably as compensation for finding a target, and negotiating the price. In the research study quoted above, the returns to SPAC sponsors reflect these advantages they bring to the game: Source: Klaussner, Ohlrogge and Ruan (2021)
Investors in SPACs: There are clearly some deals, where SPAC investors emerge as winners, as the merged company's stock price soars in the aftermath. An investor in the SPAC that took Draftkings public in 2019, for instance, would be showing returns of more than 500% in the period since, and an investor in the Virgin Galactic IPO would have more than quadrupled their money. That anecdotal evidence, though, obscures a more mixed story, and to understand it better, you have to examine SPAC investor returns in two periods, one from the time a SPAC is taken public to when it announces a merger deal, and one from the weeks and months after the merger deal. In one study, researchers looked at 110 SPACs from 2010 -2018, and conclude that SPAC investors do reasonably well, earning an annual return of 9.3%. More impressively, the downside protection on these deals put a floor on their losses, with even the worst deal generating a positive return (0.51%). In contrast, if you look at returns to SPAC investors in the weeks and months after a SPAC merger, the results are not edifying:
 Source: Klaussner, Ohlrogge and Ruan (2021)
Put simply, no matter which measure of returns you look at, and over almost every time period, investors in SPAC-merged companies lose money. It is true that repeat sponsors do better than first-time SPAC sponsors, at least in the near term (three months), but the magic fades quickly thereafter. Finally, the median returns are much worse than the average, because of a few outsized winners, and that may explain part of the allure, is that these winner stories get told and retold to attach new investors. If there is a cautionary note in these findings, it is for investors who invest in SPAC-merged companies, after the deal is consummated, since it looks like for many of these companies, prices peak on the day of the deal, and wear down in the months after, partly because the hype fades and partly because SPAC warrant conversions continue, upping share count and the dilution drag on value per share.Owners of issuing companies: There are three levels at which you can assess whether companies that plan to go public benefit from the SPAC phenomenon. The first is in whether some of the companies that used SPACs to go public would have been unable or unwilling to do so, in their absence. The second is whether the companies that did go public, using SPACs, generate higher proceeds than they would have received, if they have followed the traditional IPO route. While it is almost impossible to test either proposition, I would assume that given the number of companies that have gone public using SPACs, some of them would have chosen to stay private, if their only option had been to use the banker-run process. I would also assume that at least some of the companies that were able to take advantage of the speedier SPAC process to generate higher prices, by timing their issuances better. The third is how the company's stock price does in the period after going public, and it is here that I think SPACs have not served private companies well. By creating layers of dilution, first to sponsors, next when raising capital from PIPEs and finally from the warrants granted along the way, they impose burdens on the stock that are difficult for it to overcome. I don't think that too many private companies would be happy with the post-merger performance that SPAC-merged companies posted in the table above, since it poisons the well for both future stock issuances, as well as for owners (VCs, founders) planning to cash out later in the game.The bottom line is that SPACs, at least as constructed now, are games loaded in favor of the sponsors. There are some SPAC investors who are canny players at this game, usually cashing out at the time the deal is announced and using warrants to augment their returns, but those SPAC investors who stay on as shareholders in the merged company find themselves holding a loser's hand. Finally, while there are issuing companies that may be able to go public because of SPACs and collect higher proceeds, the dilution inherent in the process acts as an anchor dragging and holding down stock prices in the aftermarket. While there are some who are pushing for the SEC to ban or constrain SPACs, the problem, as I see it, is not that there is insufficient regulation, but that investors in SPACs who are sometimes too trusting of and too generous to big name sponsors, and too lazy to do their own homework. In fact, there is a path to redemption for SPACs and it will require the following changes:Reduce the sponsor subsidy: The sponsor subsidy in most SPACs creates a hole that is too deep for investors to dig out of, even if the SPAC merger goes smoothly and is at the right price, since there isn't enough surplus in this process to cover a 20% dilution or more. Align SPAC sponsor and SPAC investor interests: There are too many places where sponsor and shareholder interests diverge in the SPAC structure. Since sponsors get to keep their subsidy only if the deal goes through, there is an incentive now to push deals through, even if it is not in the best interests of shareholders, and then dressing it up enough to get it approved.Level the playing field on disclosures/capital: You cannot have two sets of rules on forecasts and business stories, a tighter one for traditional IPOs and a loose one for SPAC IPOs. Rather than tighten the rules on what SPACs can spin as stories, I would suggest loosening the rules for traditional IPOs. To the response that this could create misleading disclosure, I would suggest trusting investors to make their own judgments. To be honest, I would take three pages of pie-in-the-sky forecasts from a company going public, and decide what to believe and what not to, than twenty pages of mind numbing and utterly useless risk warnings (which you get in every prospectus today). On the fairness front, I also think that the restrictions on capital raising for companies that go the direct listing route are also outmoded, and may need to be removed or eased. Given that it has the fewest encumbrances and intermediaries, without this handicap, the direct listing approach to going public may very well beat out both the banker-based and SPAC IPO approaches.Reduce deal underwriting costs: I am having a difficult time understanding why the deal fees on a SPAC deal are as high as they are (5-6%), especially if the sponsors are being compensated for finding the right target and negotiating the best price. Who is being paid these deal fees, and what exactly are the services that are being provided in return? In an ironic twist, the SPAC process, designed to disrupt the traditional IPO, may be seeing the beginnings of a disruption of its own. Bill Ackman's Pershing Square Tontine SPAC, created in 2020, pointed to one possible variation, where the sponsors reduced their upfront subsidy and increased their holdings of out-of-the-money warrants, giving them a greater stake in getting a good deal done. Last week, that SPAC announced that it would be acquiring a 10% stake of Universal Music for $4 billion from Vivendi, and that shareholders in the company would get shares in Universal as well as the rights to invest in a SPARC (a special purpose acquisition rights company), with the intent of raising capital, in the event of a future deal. (Unlike a SPAC, which raises money first and then looks for a deal, in a SPARC, the capital raise occurs only in the event of a deal.)
Conclusion
As markets change, both in terms of investor mix and information sharing, it is not surprising that corporate finance and investing practices, that were accepted as the status quo until recently, have come under scrutiny. The banker-centric IPO process has had a good run, but it is showing its age, and it is good that alternative approaches are emerging. The problems for these alternatives is that going public, no matter which approach you use, is much easier when you are in a hot market, as we are in right now. That said, IPO markets though go through cold periods, where investor reception turns frigid and the number of public offerings drops off, and it is then that the weaknesses and failures of approaches become most visible. Neither direct listings nor SPACs have gone through that trial by fire yet, but if history is a guide, it will come sooner, rather than later.
YouTube Video
References
A Sober Look at SPACs, 2020, Klaussner, Ohrlrogge and RyanSPACs, 2021, Gahng, Ritter and Zhang.
May 24, 2021
Inflation and Investing: False Alarm or Fair Warning?
As we approach the mid point of 2021, financial markets, for the most part, have had a good year so far. Looking at US equities, the S&P 500 is up about 11% and the NASDAQ about 5%, from start of the year levels, and the underperformance of the latter has led to a wave of stories about whether this is start of the long awaited comeback of value stocks, after a decade of lagging growth stocks. Along the way, it has been a bumpy ride, as the market wrestles with two competing forces, with an economy growing faster than expected, acting as a positive, and worries that this growth will bring with it higher inflation and interest rates, as a negative. As inflation makes its way back into market consciousness, there are debates raging from whether the higher inflation numbers that we are seeing are transitory or permanent, and if it is the latter, how they will play out in financial markets.
Inflation: Measures and Drivers
For those who are under the age of forty and have grown up in the United States or Europe, inflation is an abstraction, a number that governments report on and experts talk about, but not something that is central to their investing or regular lives. For those who are older or grew up in countries with high inflation, inflation is far more than a number, wreaking havoc on savings and exposing fault lines in economies and societies.
What is inflation?
Put simply, inflation is a measure of the change in purchasing power in a given currency over time. Implicit in this definition are two key components of inflation.
The first is that to define purchasing power, you have to start with a definition of what you are purchasing, and this detail, as we will see, can lead to differences in inflation measured over a given period, across measures/services. The second is that inflation is tied to currencies, and different currencies can be exposed to different levels of inflation over the same period. Understanding these differences is key to understanding why interest rates vary across currencies and changes in exchange rates over time.With that definition in place, a loss of purchasing power over time is inflation, and an increase in purchasing power over time is deflation. If there is inflation in a currency, and the loss of purchasing power over a period is acute, you have hyper inflation, though the exact cut off that leads to that label is subject to debate and disagreement. Thus, while everyone agrees that inflation in the thousands of percent, as seen in Germany in the 1920s, Brazil in the 1990s, Zimbabwe in the last decade, or Venezuela today is hyperinflation, the cut off point in terms of inflation rates that qualifies is unclear.How do you measure inflation?
In inflation is the change in purchasing power, in a currency, over time, how do you measure inflation? Most inflation indices start by defining a bundle of goods and services to use in measuring inflation and a process for collecting the price levels of those goods and services, to come up with a measure of inflation. Consider the consumer price index (CPI) in the United States, perhaps the most widely reported inflation measure. It starts by creating a basket of goods and services for the average urban US consumer, with weights for each item based upon how much is spent by the consumer on the item, and then reestimate the price of the good/service in a subsequent period. The percentage change in the weighted-average price of all of the goods and services in the basket is the inflation rate for the period. Almost every country measures inflation within its borders using a variant of this approach, and you can see that inflation measures can be affected by three choices:
Consumption basket is misspecified: While inflation-measuring services try their best to get the basket of goods and services right, there are two fundamental problems that they all face. The first is that within a country, the consumption basket varies widely across consumers, and identifying the representative consumer is inherently subjective. In the US, consumption patterns vary across income levels, regionally and age, and inflation can be different, even over the same period, for different consumers. The second is that the basket is not stable over time, as consumers adjust to changing tastes and prices to alter what and how much they consume of different goods and services. You can find the most recent breakdown, for the US CPI, by going to the source at the Bureau of Labor Statistics.Prices of goods and services are wrong/biased: Even if you had consensus on the consumption basket, the prices for goods and services still have to be estimated each period. While services use sampling techniques to obtain prices of goods and service from sellers, and often double check them against consumer expenditures, there is no practical way that you can survey every retailer and consumer. The sampling used to arrive at the final numbers can create error in the final estimate. In some countries, especially when high inflation has political consequences, the measurement services may use prices that do not reflect what consumers actually pay, to arrive at measured inflation rates that are much lower than the true inflation rates. Prices of goods and services have seasonal patterns and/or volatility: There are some goods and service, where there are seasonal patterns in prices, and services sometimes try to control for the seasonality, when measuring changes in pricing power. With other items, where prices can be volatile over short period, like gasoline, services often measure inflation with and without these items to reduce the effect of volatility.All of these measures, no matter how carefully designed, give a measure of inflation in the past, and markets are ultimately concerned more with inflation in the future. To get measures of expected inflation, there are three approaches that can be used:Inflation surveys: There are measures of expected inflation, obtained by surveying economic experts or consumers. The IMF has expected inflation rates, by country, that it updates every year that you can find here. In the United States, the University of Michigan has been surveying consumers about their inflation expectations for decades, and reports those survey numbers every month. That said, inflation surveys suffer from two limitations. The first is that survey projections are heavily influenced by past inflation, thus rendering them less useful, when there are structural changes leading to changing inflation. The second is that words are cheap, and those providing the surveyed numbers have no money riding on their own predictions. Interest rates: To understand the link between expected inflation and interest rates, consider the Fisher equation, where a nominal riskfree interest rate (which is what treasury bond rates) can be broken down into expected inflation and expected real interest rate components. Put simply, if you expect the annual inflation rate to be 2% in the future, you would need to set the interest rate on a bond above 2% to earn a real return. With the addition of inflation-protected treasuries, you now have the ingredients to compute expected inflation rate as the difference between the nominal riskfree rate and a inflation-protected rate of equal maturity. Thus, if the 10-year T.Bond rate is 3% and the TIPs rate is 1.25%, the expected inflation rate is approximately 1.75%. In the graph below, I look at the 10-year US T.Bond rate and the 10-year TIPs rate on a monthly basis, going back to the start of 2003, when TIPs started trading: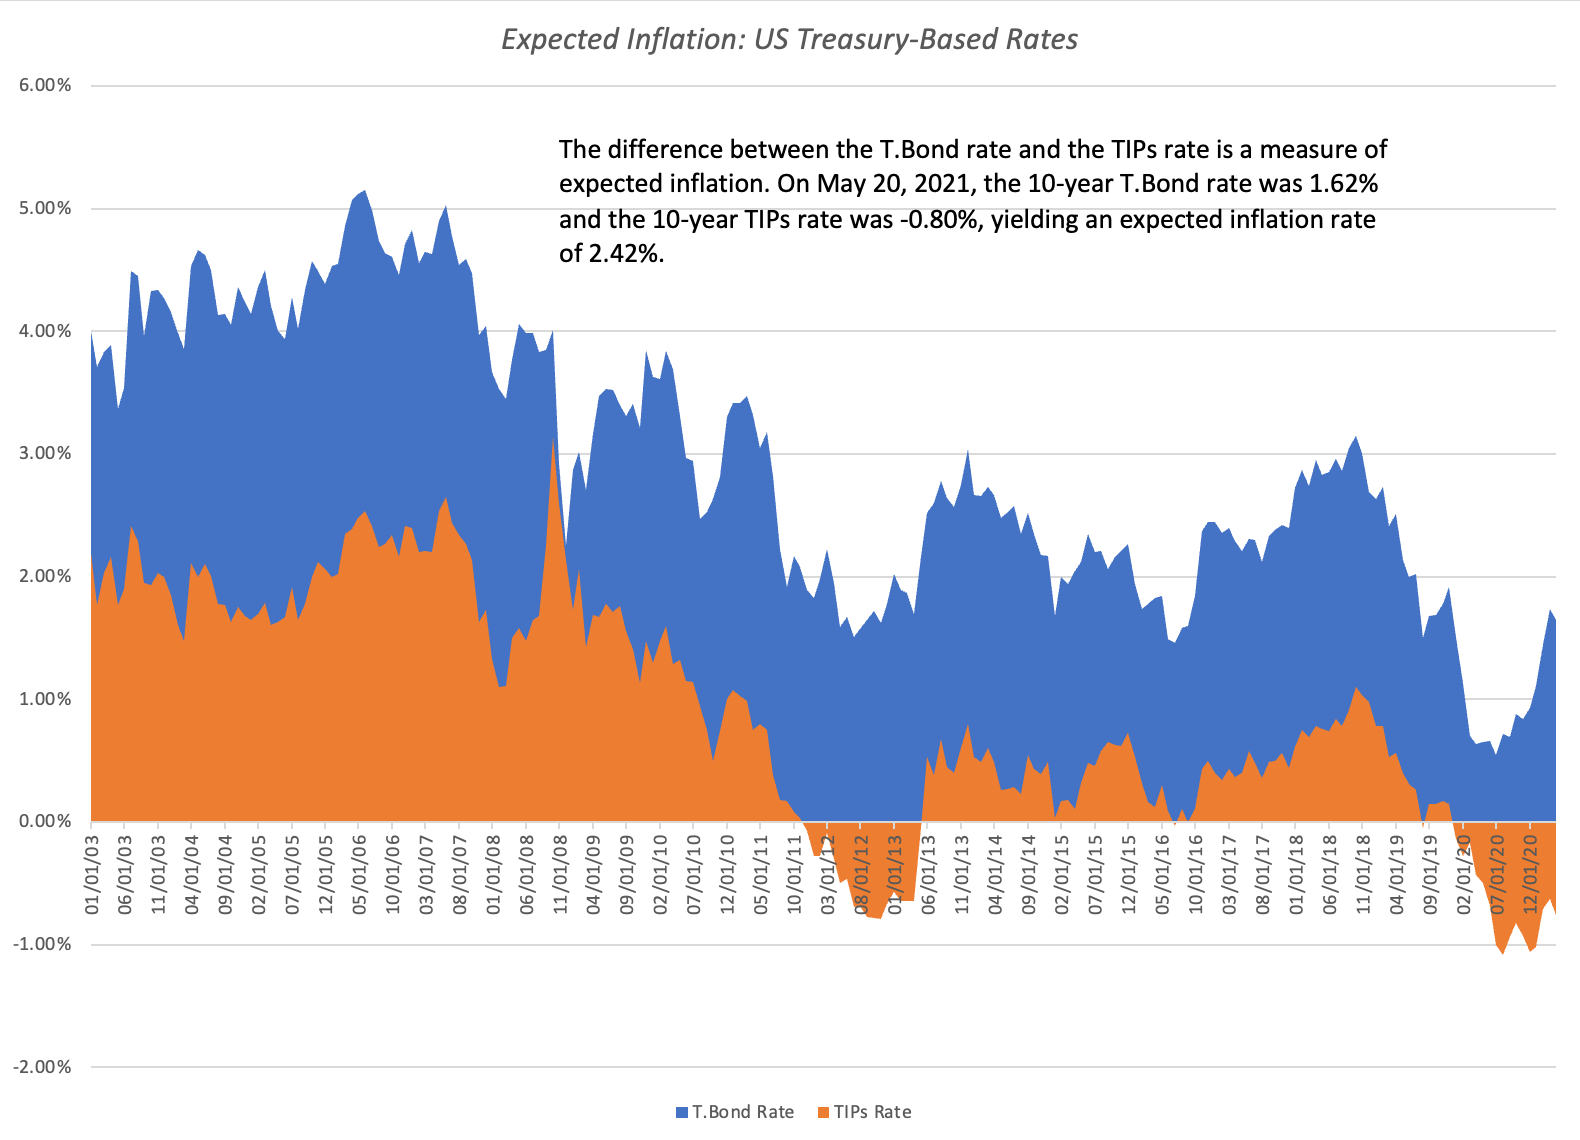
The advantage of using interest rates to forecast inflation is that it not only is constantly updated to reflect real world events, but also because there is money riding on these bets. The graph below contrasts the expected inflation rates from the Michigan survey with the expected inflation rate from the treasury markets.
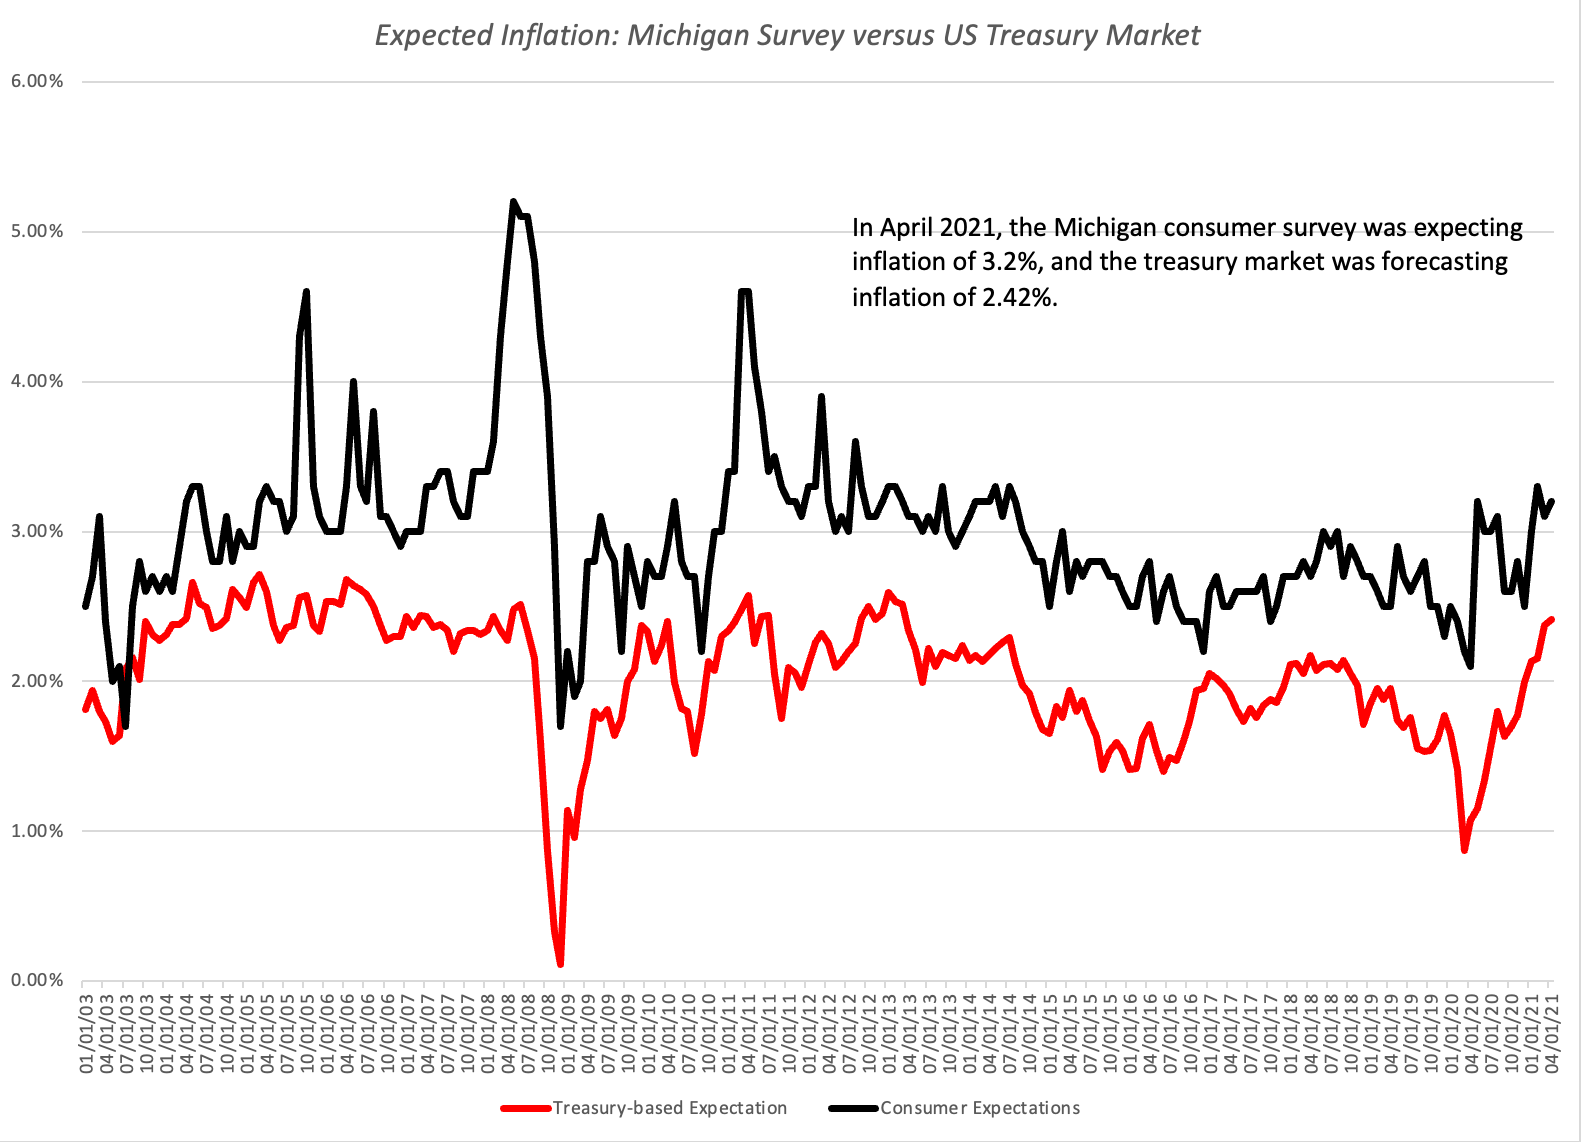 Source Data
The two estimates move together much of the time, but the consumer expectations are consistently higher, and at the end of April 2021, the consumer survey was forecasting inflation of 3.2%, about 1.1% higher than a year earlier, and the treasury markets were signaling a 2.42% expected inflation, about 1.35% higher than a year earlier. Exchange rates: The third approach to estimating inflation rates is to use forward exchange rate, in conjunction with spot rates, to back out expected inflation in a currency. To use this approach, you need to have a base currency, where you can estimate expected inflation, say the US dollar and forward exchange rates in the currency in which you want to estimate inflation. The calculation is below:
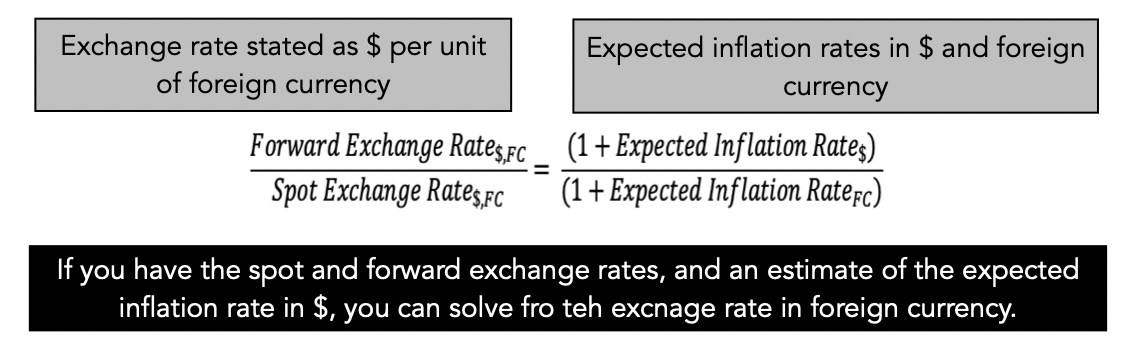
Note that you are assuming purchasing power parity is the sole or at least the most critical determinant of changes in exchange rates over time, when you use this approach.There is one final way to link actual to expected inflation. In any period, the actual inflation rate can be higher or lower than what was expected during that period. That difference is unexpected inflation, a positive number when inflation is greater than expected, and negative when it is lower than expected.
Unexpected inflation in period t = Actual inflation in period t - Expected inflation in period tLater in this post, I will argue that expected and unexpected inflation play different roles in affecting the values of assets, and that while one can be protected against, the other cannot.
What causes inflation?
Inflation, at its core, is a monetary phenomenon, created by too much money chasing too few goods. For pure monetarists, all else is noise, and expansive money supply will see inflation in the aftermath. That said, it is true that in the near term (which can extend to years), inflation is affected by other forces as well.
Economic slack: When an economy has employment and production slack, as is the case after recessions or economic crises, you could see inflation stay subdued, even in the presence of fiscal and monetary stimuli, as it grows back to fill in capacity. This is the rationale that Keynesians would adopt to argue that central bankers need to ease monetary policy, in the face of economic slowdowns.Structural Changes: There are times when structural changes in the economy, arising as it transitions from a manufacturing to a service economy, or from one that is domestically focused to one that is export-oriented, can create periods where inflation stays subdued in the face of monetary expansion.Consumer/investor behavior: Consumers are the wild card in this process, as changes in demographics and behavior can have consequences for inflation. For instance, as consumers age and/or save more, relative to the past, you can see decreases in inflation or even deflation in economies. Size of the economy: It is not fair, but larger economies with currencies that are used globally, also have the capacity to absorb monetary stimuli that would put a lesser economy into an inflationary spiral. Thus, the EU and the United States have more degrees of freedom to set monetary policy than does Brazil or Chile. You can see why forecasting inflation can be tricky, especially at times like now. As the economy climbs back from the shutdown in 2020, there are some who argue that the monetary and fiscal stimuli of the last year, unprecedented though they may be in size and scale, will not cause inflation because the economy has substantial excess capacity. There are a few arguing that the shift to a technology-based economy has removed inflationary pressures permanently, pointing to the last decade where inflation fears never came to fruition. On the other side of the debate, there are investors and economists who believe that adding trillions of dollars to an economy that is already recovering strongly will overheat it, leading to a return of inflation. In a sign of how volatile inflation expectations have been over the last year, I looked at the probabilities that the Federal Reserve Bank of St. Louis estimates for inflation rates exceeding 2.5% and for deflation on a monthly basis: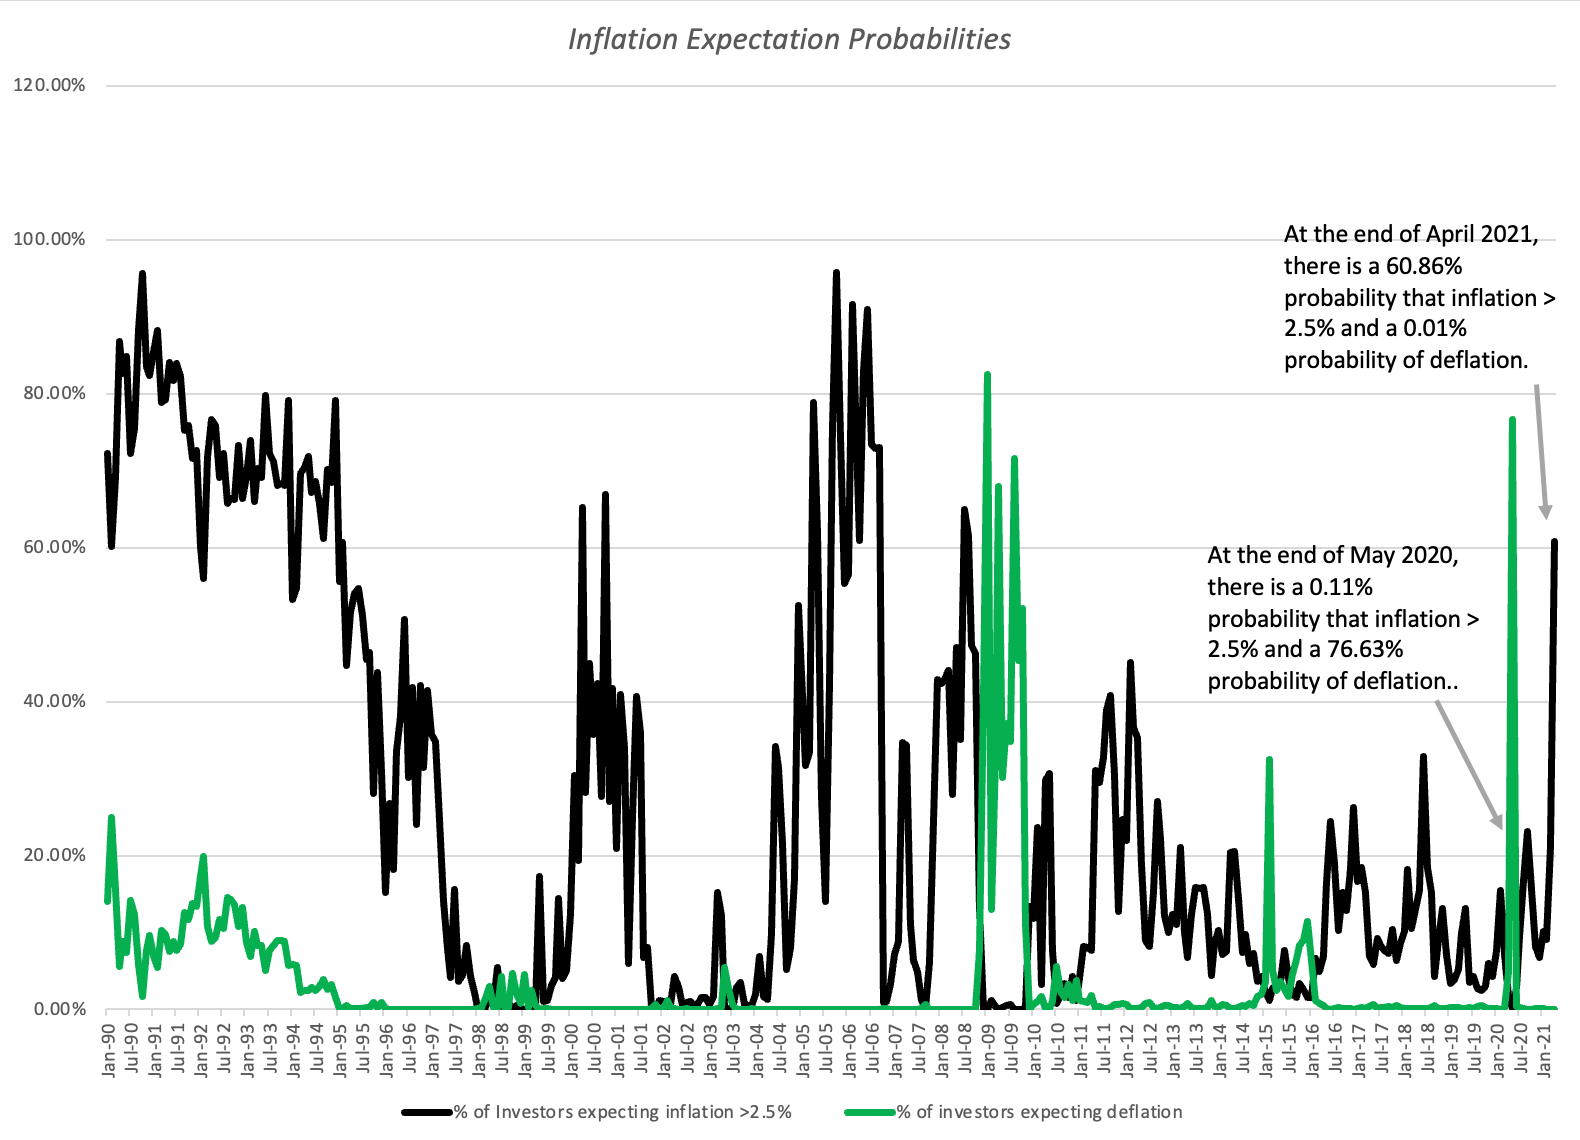 Source Data Note that these probabilities are estimated from statistical models (PROBIT) that uses both real inflation data and survey expectations. The probability of inflation exceeding 2.5%, which was 0.11% in May 2020, soared to 60.86% in April 2021, whereas the probability of deflation, which was 76.63% in May 2020, dropped to 0.01% in April 2021.
Currency and Inflation
The best counter to those who somehow believe that inflation has been conquered forever is the response that inflation is currency-specific. Thus, even in this new technology-driven global economy, there remain some currencies where inflation rates are high, and others where inflation rates are not just low, but negative (deflation). In the table below, I use IMF forecasts of inflation from 2021 to 2026 to generate a geographical heat map and to find the ten countries with the highest expected inflation and the ten with the lowest expected inflation, from 2021-26:
 Source Data
Drawing on my earlier point that interest rates convey inflation expectations, I would argue that the biggest, though not the only, reason for differences in riskless rates across currencies is differences in expected inflation:
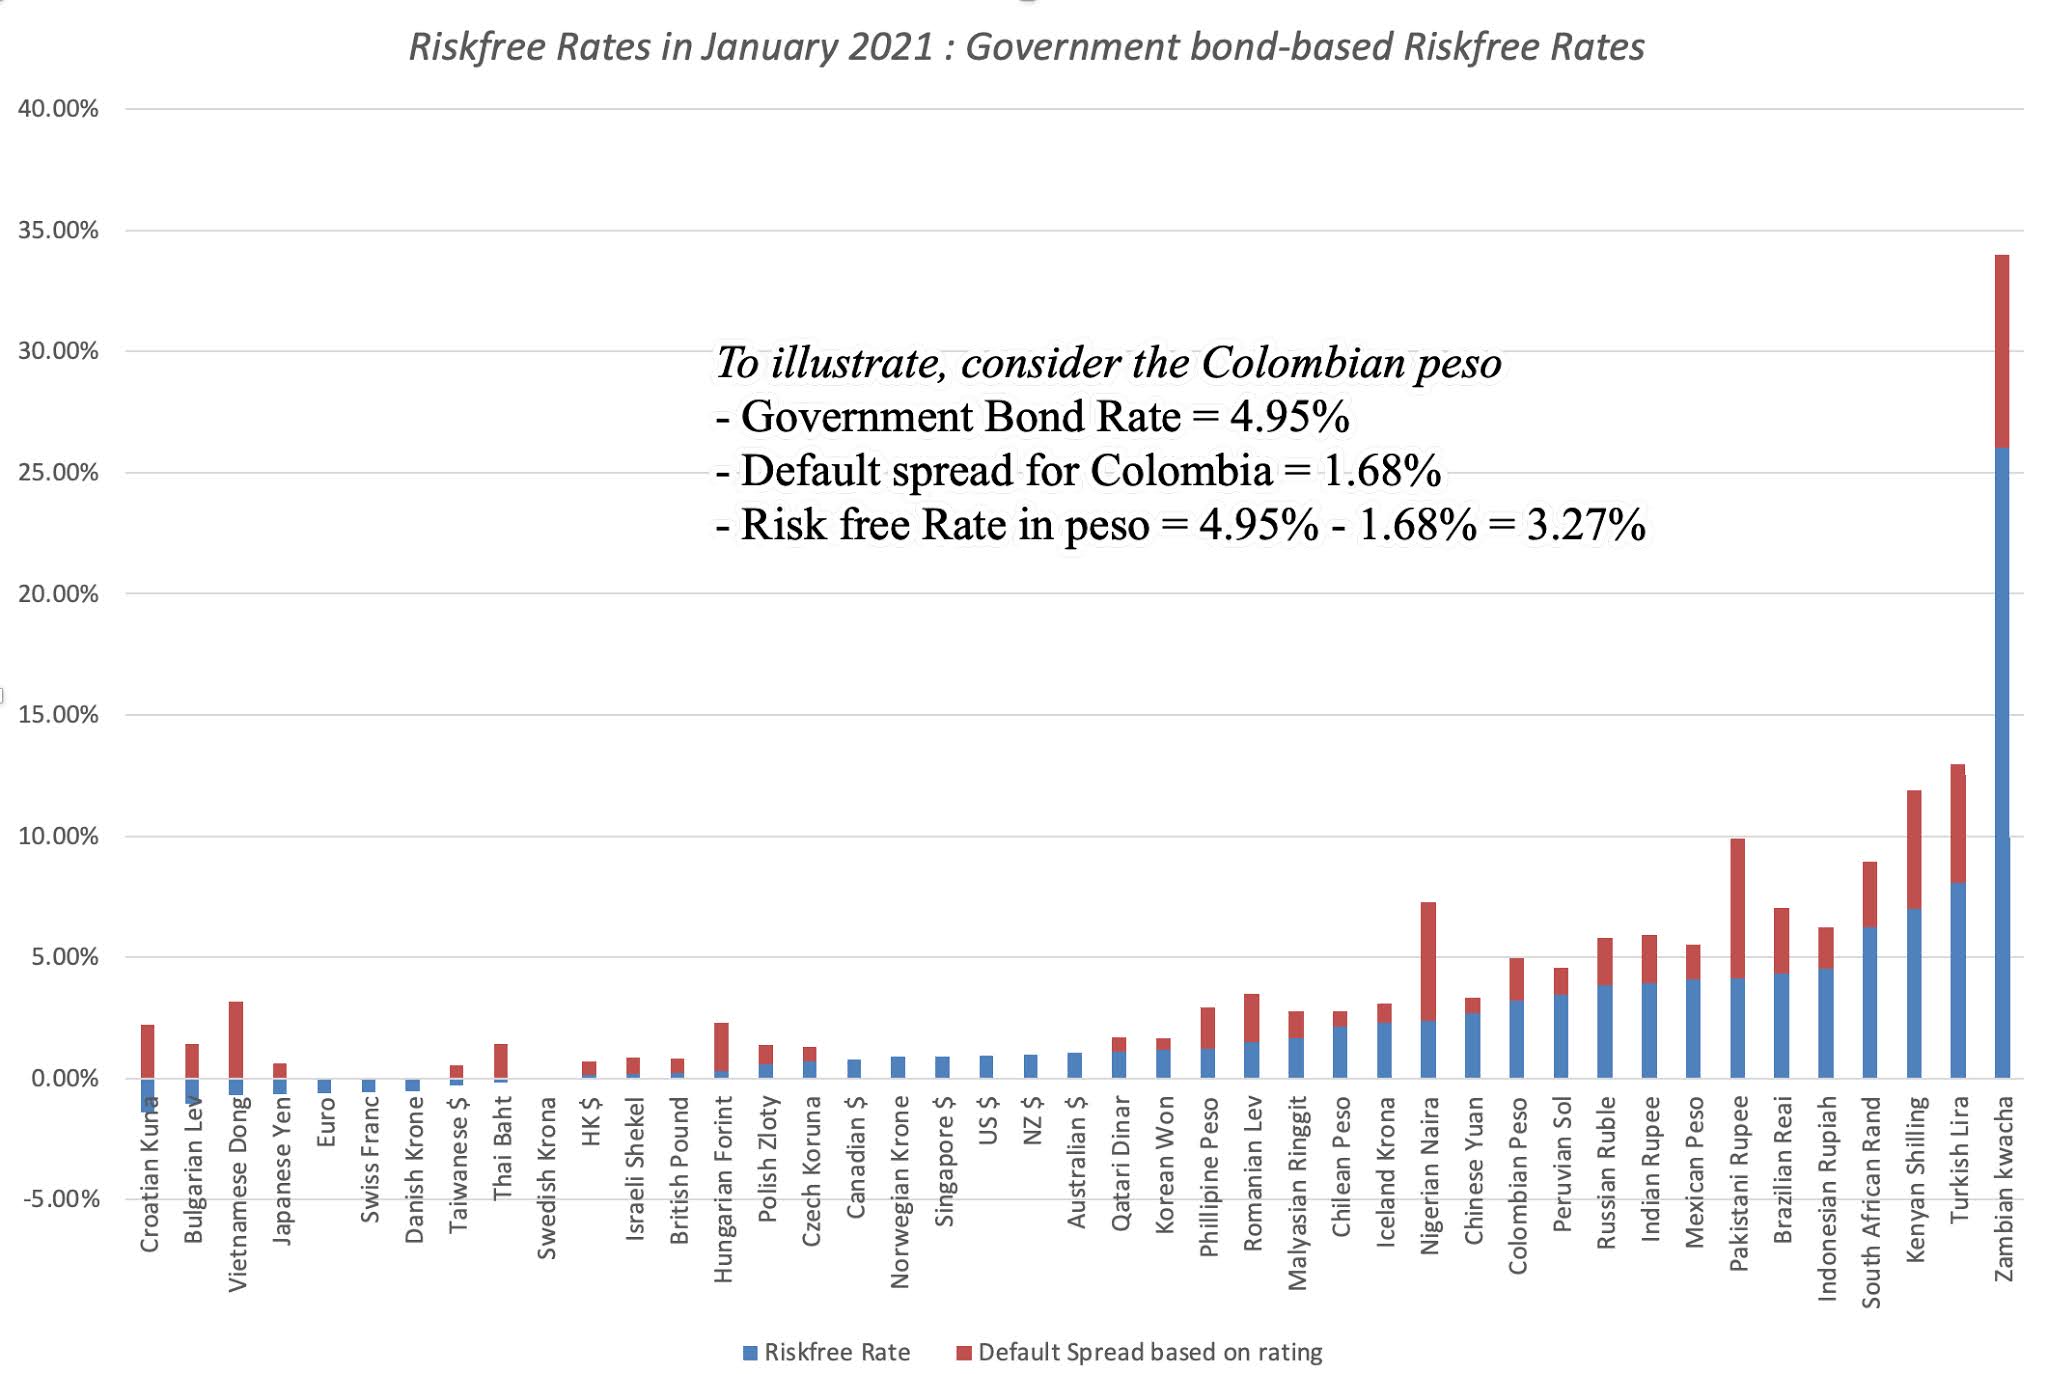
It should come as no surprise that the currencies with the highest expected inflation also have the highest riskfree rates, that currencies with lower expected inflation has lower riskfree rates and currencies where deflation is expected could have negative riskfree rates. Those inflation differences also explain currency appreciation/depreciation, over time, with high inflation currencies losing value, relative to low inflation currencies, in the long term.
A History of Inflation in the United States
As I noted in the earlier section on measuring inflation, different inflation measures can yield different values, even over the same period, largely as a consequence of whose perspective (consumer, producer) is taken, how the basket of goods and services is defined and how prices are collected and aggregated. In the graph below, I look at four measures of US inflation. The first two measures are urban consumer price indices, one without seasonal adjustments that has been reported since 1913, and the other with seasonal adjustments, available since 1948. The third is a producer price index, where price changes are measured at the producer level, for goods and services that they consume. The final measure is the GDP price deflator, computed from the BEA’s estimates of nominal and real GDP, and designed to capture the price change in goods and services produced in the United States, including exports.
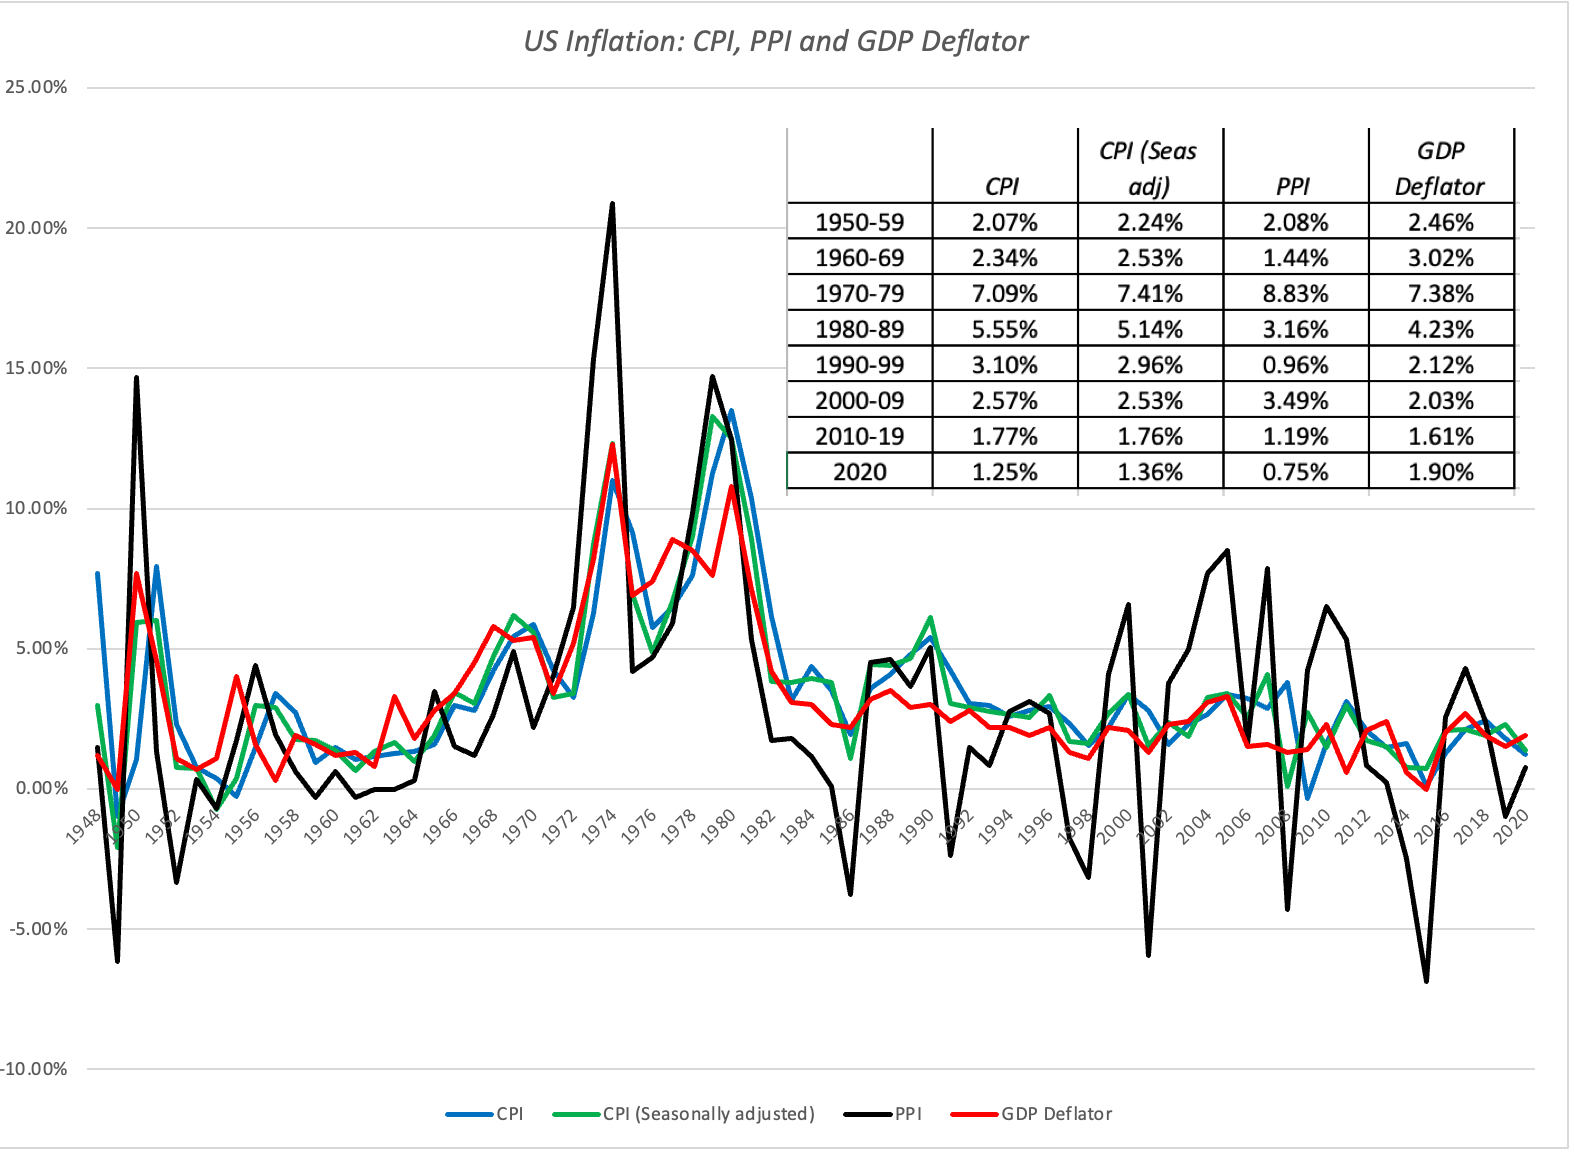 Source Data
As you can see, the four inflation measures are highly correlated, and there is no indication, at least historically, that one measure delivers higher or lower values than the others systematically. The PPI does show a lot more volatility than the other price indices, but there is also no indication that it or any of the other measures leads the others. Over the seven decades for which we have data on all four measures, there are two standout periods. Inflation was highest in the 1970s and it spilled into the first few years of the 1980s; that was the closest the US has come to being confronted with runaway inflation, and we will look at how investments behaved during the period. Inflation was lowest in the last decase (2010-19), and that low inflation continued in 2020.
Inflation and Value
Having spent a substantial portion of this post talking about the mechanics of inflation and how it is measured, I would like to turn to the focus of this post, which is the effect inflation has on asset value. I will start with fixed income securities, and trace out the effect of expected and unexpected inflation on value, and then move on to the more complicated case of equities, and how they are affected by the same forces.
Inflation and Fixed Income Securities
To understand how inflation affects the value of a fixed income bond, let's start with the recognition that in a fixed income security, the buyer has a contractual claim to a pre-specified cash flow and that cash flow is in nominal terms. Thus, expected inflation and unexpected inflation affect bond buyers in very different ways:
Expected Inflation: At the time that the bond contract is initiated, the buyer of a bond takes into account the expected inflation, at that time, when deciding the coupon rate for the bond. Thus, if expected inflation is 5%, a rational bond buyer will demand a much higher interest rate than when expected inflation is 3%. Unexpected Inflation: Subsequent to the contract being created, and the bond being issued, both the bond buyer and seller are exposed to actual inflation, which can be higher or lower than the inflation that was expected at the time the bond was issued. If actual inflation is lower than expected inflation, the bond interest rate will drop and the bond price will increase. Alternatively, if actual inflation is higher than expected, interest rates will rise and the bond price will decrease.The return that the bond buyer will earn on the bond has two components, a coupon portion that incorporates the expected inflation at the time the bond was issued, and a price appreciation portion that will move inversely with unexpected inflation.Inflation value proposition 1: In periods when inflation is lower than expected, treasury bond returns will be boosted by price appreciation and in periods when inflation is higher than expected, treasury bond returns will be dragged down by price depreciation.
With corporate bonds, inflation will have the same direct consequences as they would on default-free or treasury bonds, with an added factor at play. As inflation comes in above expectation, corporate borrowing rates will go up, and those higher interest rates can increase the risk of default across all corporate borrowers. This higher risk may manifest itself as higher default spreads for bonds, pushing down corporate bond prices, creating additional pain for corporate bondholders.
Inflation value proposition 2: In periods when inflation is higher (lower) than expected, corporate default risk can increase (decrease), leading to corporate bond returns lagging (leading) treasury bond returns.
Inflation and Equities
To understand how inflation affects equity value, I will draw on a picture that I have used many times before, where I look at the drivers of value for a business.
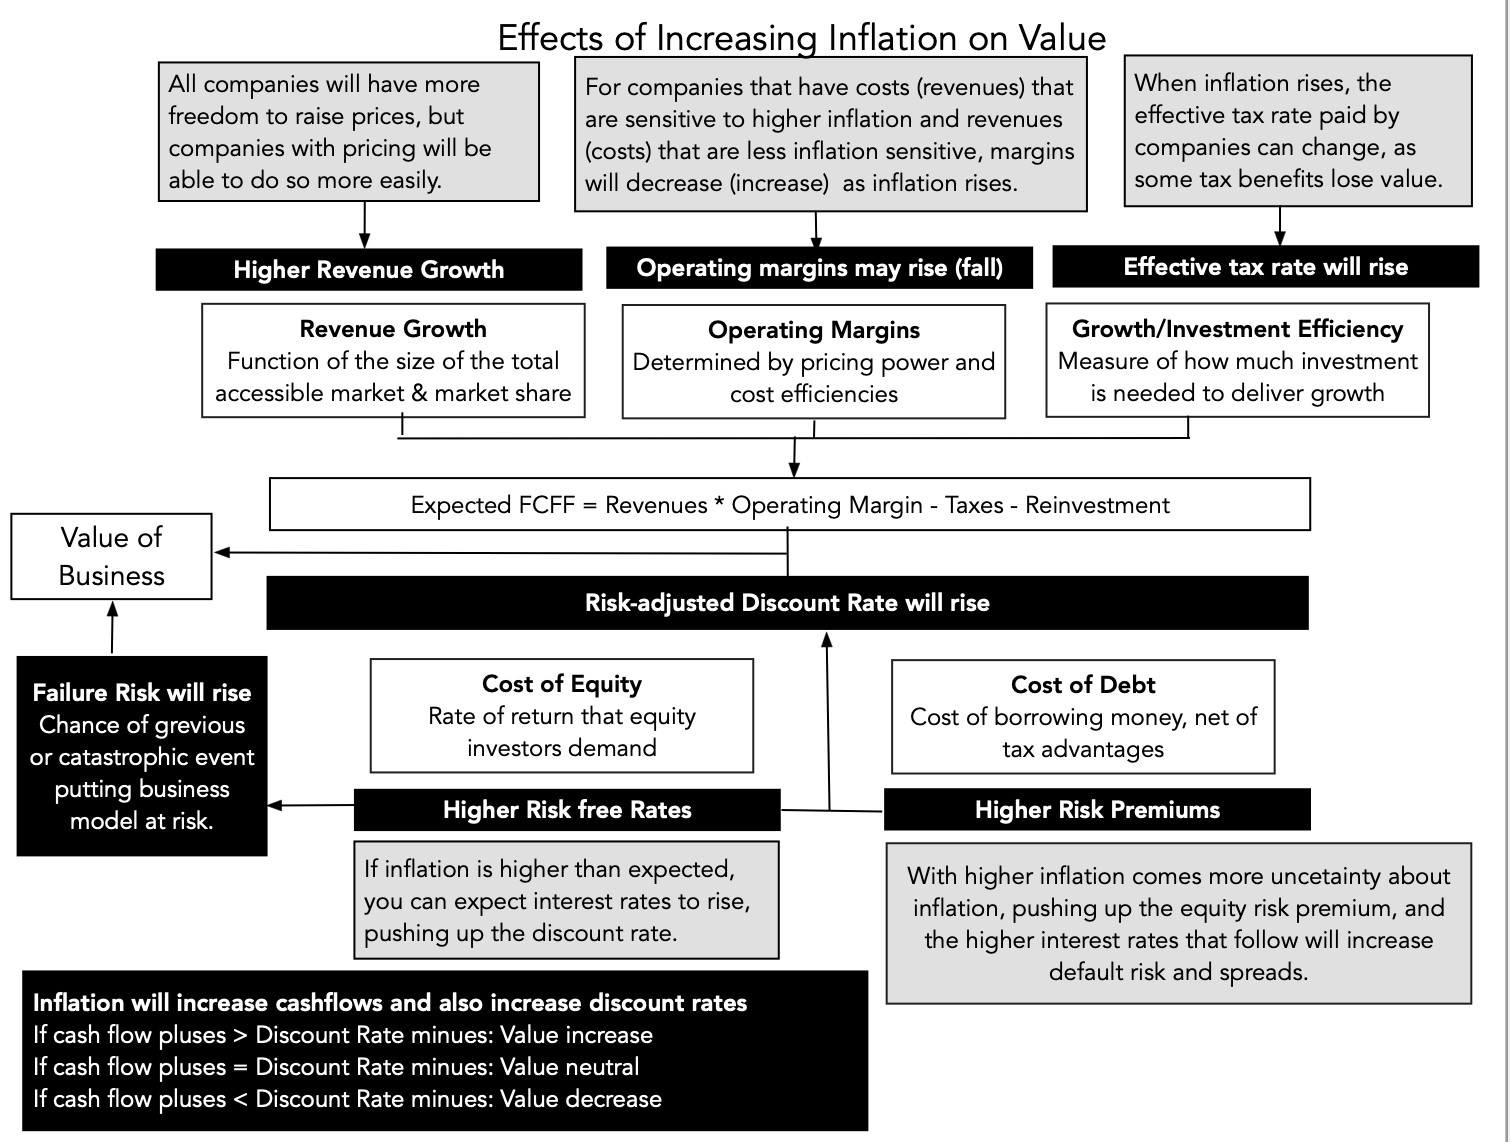
Embedded in this picture are the multiple pathways that inflation, expected and unexpected, can affect the the values of businesses.
Interest Rates: The most direct link between inflation and equity value is through the risk free rate (interest rate) that forms the base for the expected returns that investors demand for investing in a company's equity, and for lending it money. If inflation is higher than expected, you can expect interest rates to rise, pushing up the returns that both equity investors and lenders demand.Risk Premiums and Failure Risk: By itself, inflation has no direct effect on equity risk premiums, but it remains true that higher levels of inflation are associated with more uncertainty about future inflation. Consequently, as inflation increases, equity risk premiums will tend to increase. The effect of higher-than-expected inflation on default spreads is more intuitive and reflects the reality that interest expenses will be higher when inflation rises, and interest rates go up, and those larger interest expenses may create a higher risk of default.Revenue Growth Rates: As inflation rises, all companies will have more freedom to raise prices, but companies with pricing power, coming from stronger competitive positions, will be able to do so more easily than companies without that pricing power, operating in businesses where customers are resistant to price increases. Consequently, when inflation rises, the former will be able to raise prices more than the inflation rate, while price rises will lag inflation for the latter group.Operating Margins: If revenues and costs both rise at the inflation rate, margins should be unaffected by changes in inflation, but it is a rare company where this is true. For companies that have costs that are sensitive to higher inflation and revenues that are less so, margins will decrease as inflation rises. Conversely, for companies where costs are slow to adjust to inflation, but revenues that can quickly margins will increase as inflation rises.Taxes: In much of the world, the tax code is written in nominal terms, and when inflation rises, the effective tax rate paid by companies can change. To see why, consider one aspect of the tax code, where companies are allowed to depreciate their investments in building and equipment over time, but only based upon what was originally invested in those assets. As inflation rises, the tax benefits from this depreciation will decrease, effectively raising the tax rate.The bottom line is that inflation that is higher than expected will have disparate effects across companies, with some benefiting, some unaffected and some losing value. Inflation value proposition 3: In periods when inflation is higher (lower) than expected, individual companies can benefit, be left unaffected or be hurt by inflation, depending on whether the benefits of inflation (higher revenue growth and margins) are greater than, equal to or less than the costs of unexpected inflation (higher risk free rates, higher risk premiums, higher default spreads and higher taxes). While individual companies may benefit from higher inflation, the question of how higher inflation affects equities in the aggregate is an open one. Even if you assume that companies are able, in the aggregate to deliver high enough revenue growth to match the increase in the riskfree rate, and premiums remain unchanged, you still have the drag in value caused by higher risk premiums, failure risk and effective tax rates. The only scenario where higher-than-expected inflation can be good for stocks in the aggregate, is if the increase in inflation is accompanied by extraordinary growth in aggregate earnings that more than offsets the inflation effect. Inflation value proposition 4: Unexpectedly high inflation will generally be a net minus for markets, at least until expectations are reset, as investors struggle to reassess risk premiums and companies try to adjust their product pricing and cost structures to deal with the higher inflation.Inflation and Investments
In theory, and intuitively, higher than expected inflation should be bad for treasury bonds, worse for corporate bonds and good, bad or neutral for individual equities. The acid test, though, is in the numbers, and in this section, I will look at almost a 100 years of history to look at the actual performance of asset classes in response to both expected and unexpected inflation.
Inflation, Stock and Bond Returns
To assess how stocks and bonds have been affected by inflation, I started with a historical data series of returns on stocks (with the S&P 500 as proxy), treasury bonds (with the 10-year constant maturity bond standing in) and corporate bonds (with the Baa 10-year Corporate bond as its representative. For measuring inflation, I used the CPI, unadjusted for seasonal factors, since it is the only inflation series available for the entire time period, and to estimate unexpected inflation, I used a simplistic proxy:
Unexpected Inflation = Inflation in year t - Average inflation in years t-1 to t-10
I would have rather used one of the expected inflation measures that I described in the last section, but neither the Michigan survey nor the treasury rate go back in time for that long. I bring these series all together in the graph below:
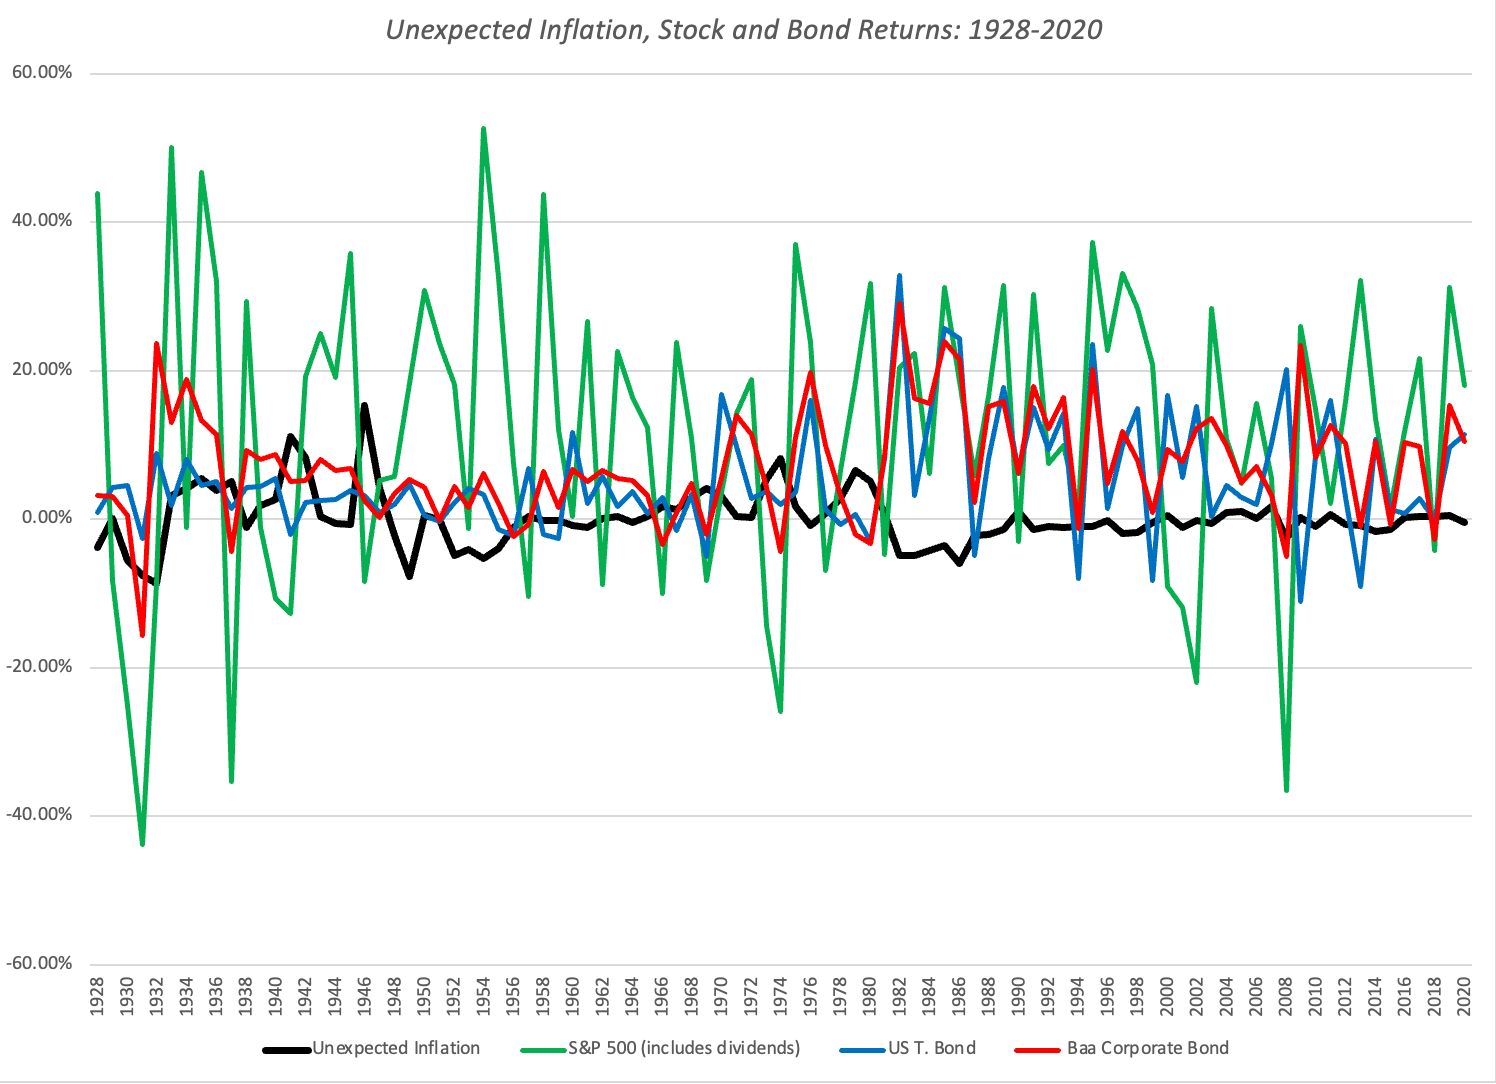 Source DataSince it is almost impossible to detect patterns in this graph, I broke my data down by decade and looked at annual nominal and real returns on stock, treasury bond and corporate bonds, by decade:
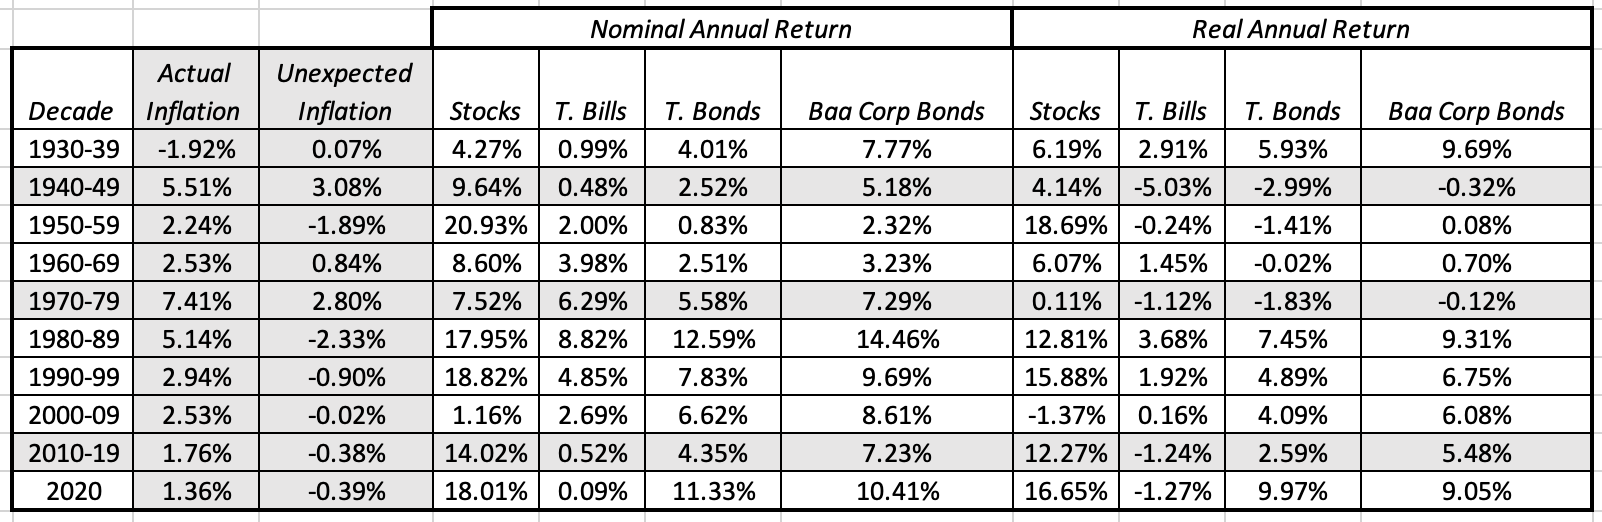 Source DataLooking at annual real returns, the worst decade for stocks in this time period was 2000-2009, with the 2008 banking crisis melting the gains for the entire decade, but the second worst decade for stocks was 1970-79, the period with the highest unexpected inflation. For treasury bonds, the two worst decades were the 1940s and the 1970s, both decades with the highest unexpected inflation, and the best decade was the 1980s. For corporate bonds, the only decade with negative real returns was the 1970s, and you can see the influences of both treasury bonds and stocks on performance.
 Taking a deeper look at stocks, and specifically at two widely reported phenomena of the 20th century, the outperformance of small cap stocks, relative to large cap ones, and the superior returns earned by low price to book stocks, relative to high price to book stocks, through the lens of inflation (and I am in debt to Ken French who maintains these datasets on his online data page):
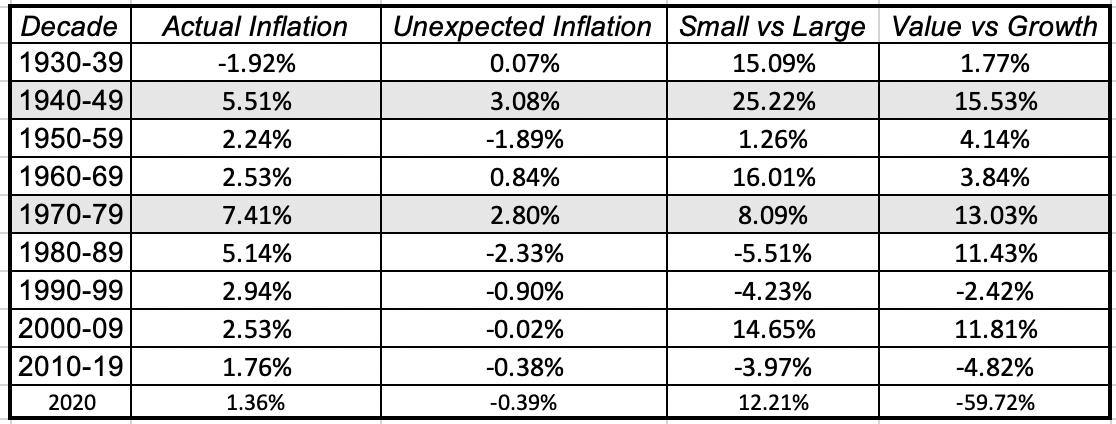 Small is the bottom decile and large is the top decile in market cap, of US stocks
Value is the bottom decline and growth is the top decile in price to book ratios, of US stocks.There is a risk of reading too much into the data in this table, but the three best decades for low price to book stocks were 1940-49, 1970-79 and 1980-89, the three decades when inflation was high, and in two of those decades, inflation was much higher than expected. Conversely, the decades where value underperformed growth were 1990-99 and 2010-19, when inflation was much lower than expected. There is no detectable pattern with the small cap premium that can be related to inflation, in either expected or unexpected forms. Put simply, for those value investors who have been wandering in the investment wilderness for the last decade, the silver lining in a return to higher inflation may be a tilt back towards low PE and PBV stocks.
Inflation, Gold and Real Estate
It is part of investing lore that gold is the ultimate hedge against inflation. Harvey and Erb note that over very long time periods (hundreds of years), gold preserves its purchasing power, effectively growing at the inflation rate. It is also part of investing lore that no asset class holds up better to inflationary swings than real estate. To examine the data behind the lore, I looked at the returns on gold (using gold prices, London fixing) and on real estate (using Robert Shiller's database on home prices) as a function of inflation. Note that gold prices are available only since 1970, with the effective abandonment of the gold standard.
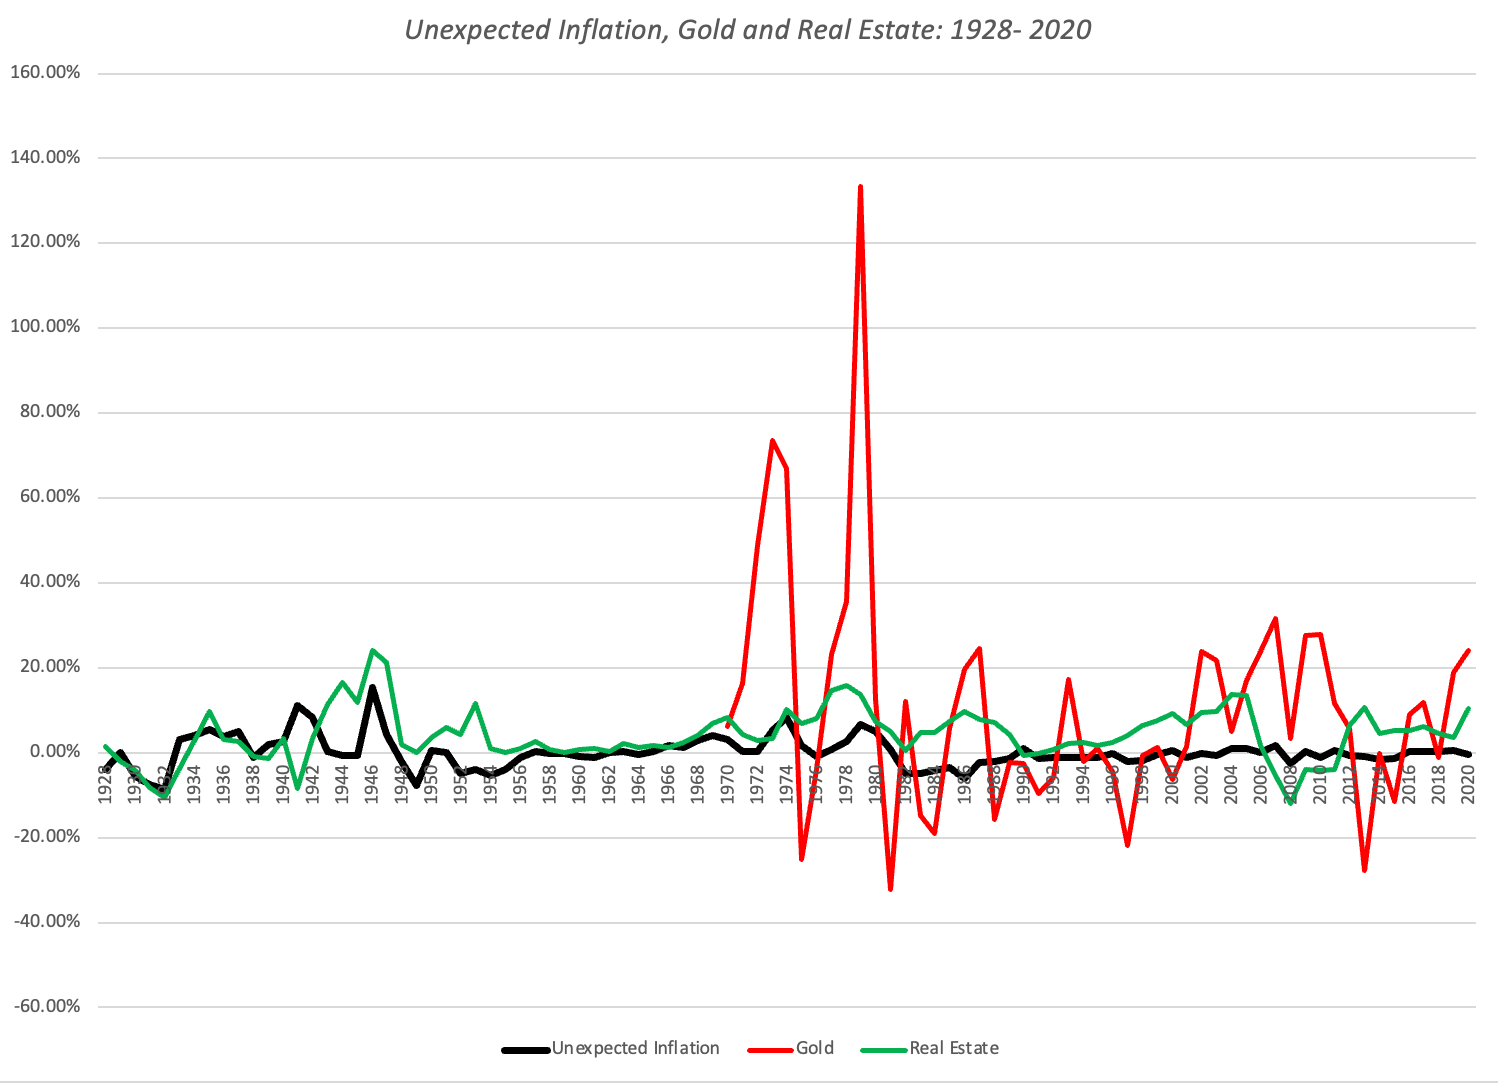 Source Data
While you can see the spike in gold prices in the 1970s and link it to the high inflation of the period, I looked at nominal and real returns on gold and real estate, by decade, just as I did with stocks:
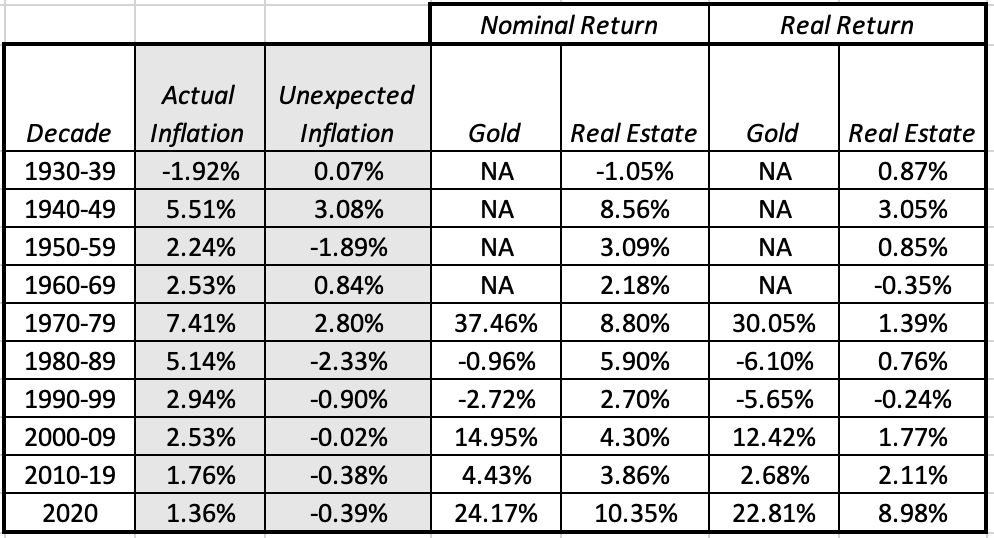 Source DataGold clearly had a winning decade in the 1970s, but it also did well in the 2000-09 time period, when stocks were under siege and in 2020, when it played its role as a crisis asset. Real estate had solid nominal returns in the 1970s and delivered returns that meet and beat inflation, during that decade, but is best decade in both nominal and real terms was 2000-09, albeit with a housing crash at the end of the decade wiping out much of the compounded gains.
 Inflation, Collectibles and Cryptos
For investors fearful of meltdowns in financial assets, there have been relatively few hiding places, but over time, some have sought refuge in fine art and collectibles, arguing that a Picasso is more likely to protect you against inflation than a stock. In the last decade, younger investors have also sought out crypto currencies, arguing that their design, with hard limits on quantity, should make them better stores of value. It is for that reason that there are some who consider Bitcoin to be Millennial Gold, but the jury is still out on whether it will serve that role well.
If the role that gold has played historically have been as a refuge from high inflation and market crisis, the question becomes whether Bitcoin can also play that role. Last year, I did check to see how Bitcoin and Ether behaved during the course of the year, and concluded that at least in 2020, Bitcoin and ether behaved less like collectibles, and more like risky stock.
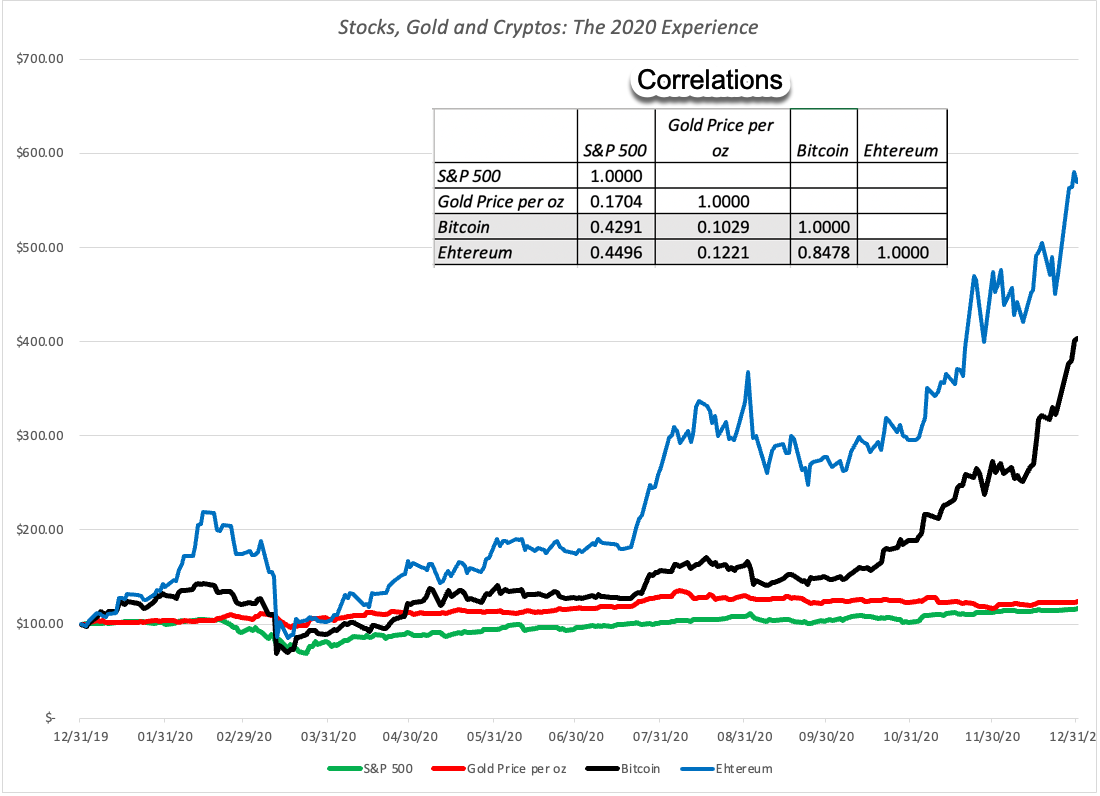 Source Data
Clearly, that is a single period of history, and it is possible that Bitcoin and Ether will behave better in future crises. On the question of how unexpectedly high inflation will affect crypto currencies, the fact that they have been in existence only for a little more than a dozen years, during which period inflation was at historic lows, makes it difficult to draw a conclusion.
Hiding from Inflation?
Having looked at how stocks, bonds, real estate and gold have moved with expected and unexpected inflation in the past, I used the year by year data on these asset classes to estimate the correlation with both expected and unexpected inflation.
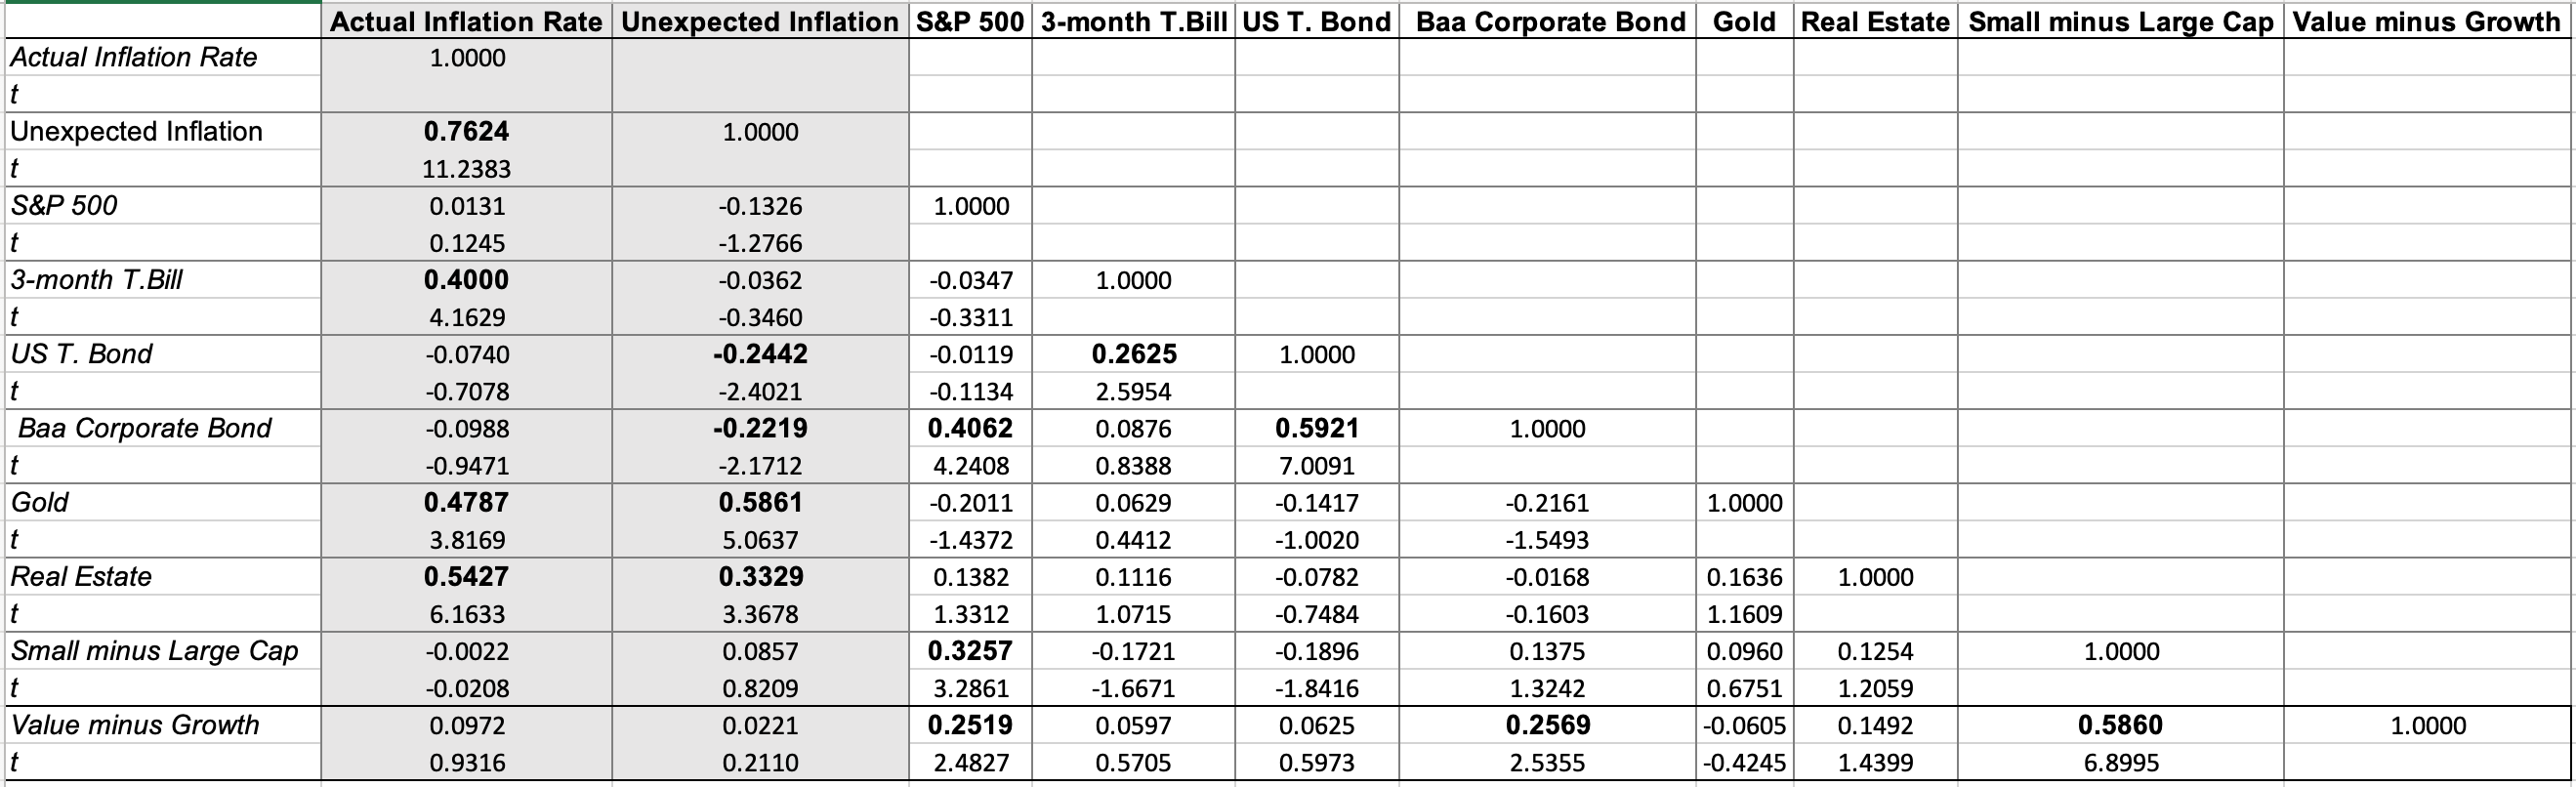 Source Data
This table tells the composite story about inflation and asset returns well. The only two asset classes that have moved with inflation, both in expected and unexpected forms, are gold and real estate, though a fair portion of that co-movement can be explained by the 1970s. While real estate has been a better hedge against expected inflation, gold has done much better at protecting against unexpected inflation. The asset classes that are worst affected by inflation are treasury and corporate bonds, but the damage is from unexpected inflation is much greater than from expected inflation. Stocks and expected inflation are close to uncorrelated, but the correlation of stocks with unexpected inflation is negative, albeit weaker and less statistically significant than that exhibited by bonds. Finally, while the value premium is greater when inflation is higher, the results are not statistically significant, suggesting that other forces are playing a much stronger role in the disappearance of that premium.
Are there some sectors that offer better protection against inflation than others? To examine that question, I looked at broad industry categorizations, and estimated annual returns across the decades, in conjunction with inflation numbers:
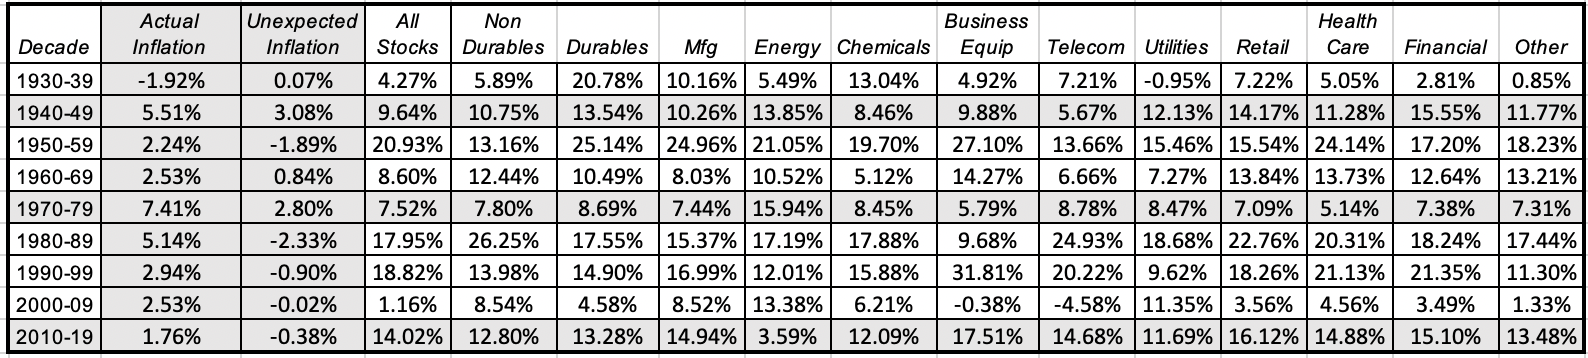 Source Data (Industry annual returns, from Ken French)
The only sector that seems to have a link to inflation is energy, an outperformer not just in the 1970s, as oil prices surged, but also in the 1940s, another high inflation decade, while underperforming between 2010 and 2019, as inflation fell to historic lows. Since inflation is currency-specific, there is another pathway to protection, but it is viable only if inflation is restricted just to the United States. If inflation remains lower in other countries, either because they have more prudent central bankers or because their economies stay weaker, you would expect their currencies to appreciate, relative to the dollar, and their equity and bond markets to behave badly. Given that central bankers around the world seem to have drunk the same Koolaid, I am not sure that I would bet on this possibility.
What now?
This post has stretched for too long, and I will let you draw your own conclusions, but here is a summary of where we stand:
Inflation is back: There is no question that we are seeing higher inflation now than we have seen in a decade, in reported numbers (CPI, PPI and GDP deflators), in expectations (from the treasury markets and surveys) and in commodity markets. Unclear whether it is transitory or permanent: The debate, both among investors and at central banks, is whether this surge in inflation reflects a return from an economic shutdown, which will burn out once things settle down, or a sign of a permanent increase from the abnormally low inflation that we witnessed all of the last decade. While economists and investors continue to look at the tea leaves to try to decipher the answer, I am afraid that only time can answer that question. If as the economy strengthens this summer, inflation continues to beat expectations, I think that the answer will be in front of us.Return to normal: If some or all of the inflation increase is permanent, and we are reverting back to more normal inflation levels (2-3%), there will be an adjustment, perhaps even painful, as interest rates rise and stock prices recalibrate. You can still find stock sectors that are better positioned to deal with higher inflation, with commodity companies and companies with significant pricing power (consumer brand names) holding value better than the rest of the market.With a non-trivial chance of a breakout: If it is permanent, and we see inflation rise to levels not seen since the 1970s and 1980s (>5%), stocks and bonds will have to be repriced significantly. Not only will investors need to move money out of financial into real assets and collectibles, but companies and individuals that have chosen to borrow to capacity, based upon current low rates, will face a default risk reckoning.And the Fed has to be ready: It behooves the Fed to get ahead of the inflation game. Since the probability of inflation rising to dangerous levels is non-trivial, in my view, the Fed should stop its happy talk about inflation being under control and interest rates staying low, no matter what. In fact, central bankers around the world would be well served reverting back to an old rule book of being seen very little and speaking even less, and letting their actions speak for themselves. For those who are quick to dismiss inflation, it is worth remembering that it is insidious and sneaky, benign when it is under control, but a destructive force, when it is not, a genie that should be kept in the bottle.YouTube Video
DataRaw data on historical inflation in the US (CPI, PPI and GDP Deflator)Expected Inflation, by country (IMF)Data on inflation expectations in the US (Univ of Michigan Survey, Treasury Rate based)Data on historical nominal and real returns on asset classes Data on historical returns on industry groups
May 11, 2021
Investor Taxes and Stock Prices: Threading the Needle!
In my last post, I looked at the Biden Administration's proposal to increase corporate taxes, to provide funding for an infrastructure bill, and concluded that while there is room for raising corporate taxes, it would be more efficient and fairer to do so by reducing the tax credits and deductions in the code, than by raising the tax rate. In the weeks since, the administration has come up with its follow-up proposal, this one funded by increases in individual taxes, primarily on the wealthy. While one part of the proposal, reversing the 2017 tax cuts for those in the highest tax brackets from 39.6% to 37%, was anticipated, the other one, almost doubling the capital gains tax rate for those making more than a million dollars in investment income, was a surprise. While supporters of the increase point to the fact that only a very small portion of individuals will be affected by the change, those individuals, through their wealth, own a significance percentage of financial assets, and how they react to the change, assuming it happens, will determine whether their pain will become all of ours. In this post, I will start by looking at investment income and how it is taxed today, compare it to how it was taxed in the past, and finally look at how individual investor taxes play out in stock prices.
The Taxation of Investment Income
In much of the world, income from investments (interest, dividends) is treated differently than earned income (salary, wages), by the tax code, and the reasons for the divergence are both practical and political:
1. Prevent or reduce double taxation: One argument, grounded in fairness, is that it is wrong to subject the same income to multiple tax hits, and it can be argued that dividend and capital gain income is particularly exposed to this critique. The dividends that companies pay comes out of the earnings that they have left over after corporate taxes, and taxing that dividend again, when investors receive it, is clearly double taxation. It is for this reason that some countries, like the UK and Australia, allow investors to claim a tax credit, for corporate taxes paid, on dividend income. On capital gains, the same argument can be made, but it is less direct, since stock prices can go up, even if a company is money-losing and has no taxable income. Others like Estonia and Latvia, levy taxes on corporations on the income that is returned to shareholders as dividends, and individual investors pay no taxes.
2. Encourage savings/ capital formation: In an economy, where private capital is behind the bulk of economic investment and growth, governments are dependent up the health of capital markets (stocks and bonds) for continued growth. To encourage investors to put their savings into stock and bond markets, the tax code is sometimes tilted to make these investments more attractive. Thus, there are countries, where capital gains tax rates are effectively zero, to induce investors to buy and hold financial assets. In Europe, for instance, Belgium, Luxembourg, Slovenia, Slovakia, Switzerland and Turkey don't tax capital gains, and in most European countries, the capital gains tax rate is lower than the tax rate on ordinary income. In an extension of this rationale, there are many countries where capital gains on investments that have been held for longer periods is taxed at a lower rate than investments held for shorter periods.
In the United States, the discussion of what individuals pay as taxes on their investment income is complicated by where that investment income originates. For instance, income on an individual's holdings in a pension fund or a Roth IRA account are tax exempt, at least while they continue to stay in that account, but income from the rest of the individual portfolio are taxed. On top of all of this complexity is estate and inheritance tax law, where when an individual dies, the investments in his or her estate can be marked to market, without any tax consequences, allowing those capital gains to be sheltered from taxes.
A History of Investment Income Taxation in the US
For much of the last century, investment income in the United States has been taxed differently from income earned from salaries or business. The graph provides a general framework for understanding the structure of the US tax code:

Note that there are times when income can span multiple categories, and especially so, if are a private business owner. The business that you own is an investment, but since you work actively at that business, you may generate a salary, real or imputed, earn dividends, if the business has partners, and when sold, the business may generate a capital gain. When the US government started taxing individual income more than a century ago, in 1913, there was one tax rate on all income, earned or investment, but that changed in 1920. In the graph below, I look at the highest marginal tax rates on dividends and capital gains since the advent of US individual taxes:
 Tax rates on dividends and capital gains: US
Starting in 1920, and for much of the rest of the century, dividends were taxed like other earned income, but capital gains tax rates were much lower; it is worth noting that these lower tax rates were only for long term capital gains, i.e., investments held for a year or longer. The divergence between tax rates on ordinary income/dividends and capital gains peaked in the 1950s, at least for those in the highest tax brackets. Note that since the capital gains tax rates have no brackets, those who faced lower taxes on ordinary income saw a much smaller divergence between dividend and capital gain taxes. In 1986, a tax reform act built around the premise that having different tax rates for different types of income created a whole host of unhealthy tax behavior, separated dividends from other earned income, and taxed dividends at the same rate (26%) as long term capital gains, but that promise of rational taxes was very quickly forgotten as tax rates on dividends were raised again in 1992, while capital gains tax rates remained unchanged. In 2003, another tax reform act with lofty objectives brought convergence on the tax rates to 15% for both capital gains and dividends, and while those rates have increased since, the convergence has remained, at least until now.
Taxes and Stock Prices
In my last post, I looked at how corporate taxes affect the company values, but personal taxes, i.e., the taxes paid by investors on the income that they receive from companies also affect value, albeit through more indirect means. In this section, I will trace out that link.
Pre and Post Tax Returns to Investors
When individuals invest in stocks, bond and other assets, they do so with an expected return in mind, but that expected return is in post-personal tax terms, and as my investment income gets taxed at a higher rate, they need to make higher returns, before personal taxes, to break even. To illustrate with a simple example, assume that you are a taxable investor who pays a 25% tax rate and that you are considering investing in a company, where you believe that you need to make 6%, after personal taxes, to break even. You will need to make 8% on a pre-personal tax basis, to break even:
Pre-personal tax return (with 25% tax rate)
= Post-personal tax/ (1- personal tax rate) = 6%/ (1- .25) = 8%
If you were valuing the company, you would use the 8% as your required return, since the earnings and cash flows that you are evaluating are after corporate, but before personal, taxes. If the tax rate were raised to 40%, all else being held equal, your expected pre-personal tax return will have to increase to 10%:
Pre-personal tax return (with 40% tax rate)
= Post-personal tax/ (1- personal tax rate) = 6%/ (1- .40) = 10%
With a 10% required return, the company will be significantly less valuable.
Extending this concept to actually investing in stocks, you are faced with complications. The first is that you pre-personal tax return on stocks is composed of dividends and price appreciation, and as we noted in the earlier section, the tax rates on the two can diverge. Thus, the post personal-tax return on stocks can be written as:
Post-personal tax return on stocks = Dividend yield (1 - tax rate on dividends) + Expected Price Appreciation (1 - tax rate on capital gains)
Thus, if a stock has a 2% dividend yield and an expected price appreciation of 6%, and your tax rates were 20% for dividends and 40% for capital gains, your post-personal tax return would be:
Post-personal tax return = 2% (1-.20) + 6% (1-.40) = 5.20%
As a final complication, you have to consider the fact that tax rates can vary across individuals, there are some investors who do not pay taxes on any investment income (pension funds) and some who pay taxes only on some types of investment income.
Historical Stock Returns: Pre and Post-tax
At the start of every year, I update a dataset, where I look at historical returns on stocks over time, and compare these returns to returns on treasury bonds/bills, corporate bonds and gold. At first sight, stocks have had an impressive run over much of the last century, delivering substantial return premiums over treasury bonds, treasury bills and corporate bonds:
 Historical returns on stocks, bonds and bills: 1928 -2020
These returns, though, are prior to personal taxes, and the tax bite can be substantial. To see the most dire version of the tax effect, assume that you were in the top tax bracket through this entire period, paying the highest marginal tax rate on dividends and capital gains, and that you trade at the end of each year, thus paying capital gains taxes each year. The returns you would have made on a post-personal taxes basis are shown in the graph below:
 Historical pre and post-tax returns on stocks: 1928 -2020
Over this period, the taxes would have cost you more than a third of your annual returns on stocks, but the extent of the damage can be seen when you look at the cumulative effect. An investment of $1000 in stocks at the end of 1927, assuming that dividends and price appreciation are reinvested back each year, would have amounted to $5.93 million by the end of 2020. However, paying the highest marginal tax rate each year on dividends and price appreciation would have reduced the end value of this investment to $278,489, a drop of 95.3% in value. It is no wonder that those most heavily invested in stocks look for ways to reduce their tax hit, starting with steering away from stocks that pay dividends to holding on to stocks for long periods, since capital gains apply only when stocks are sold. It is also not surprising that they are targets for investment vehicles that claim to protect them from taxes.
Forward-looking Expected Returns
If you start with the premise that investors have a post-personal tax return in mind, when they invest, can you back out that expected return? I think so, but to do it, you have to start with a pre-personal tax expected return. With stocks, I compute this pre-personal tax return at the start of every month, using the current level of index and expected cash flows to back out an internal rate of return; this is the basis for the implied equity risk premium. At the end of trading on May 7, with the S&P 500 trading at 4201.62, I compute this expected return to be 5.73%:
 Download spreadsheet
This expected return is prior to personal taxes, and to compute the post-personal tax return, at current tax rates, I have to make assumptions about what percentage of investors in the stock market are tax paying and that number will be different for dividends and capital gains. For dividends, since about 37% of equities are held by tax exempt investors (pension funds) that pay no taxes, I will assume that the remaining 63% pay taxes). With capital gains, in addition to pension funds, foreign investors are not required to pay capital gains taxes (though they face taxes on dividends), resulting in an even smaller percentage of tax paying investors (I estimate 50%, but it is a shifting number). Starting with the 5.73% pre-personal-tax return, and using 23.80% as the tax rates for dividends and capital gains, I back into a post-personal tax return of 5.01% for the aggregate market:

The Biden Capital Gains Tax Plan
The Biden proposal on capital gains is still in nascent form and will morph as it goes through the Congressional meat grinder, but as it stands now, it is built on two building blocks. The first is that tax rates on capital gains will be raised to 39.60% (effectively 43.4%, with the health care add on tax) but only for those who earn more than $ 1 million in investment income (not all income). The second is a change in estate tax law to require that inheritors of investments will be required to pay capital gains taxes, at the time of inheritance, on capital gains on these investments. That is a change from the current law where these capital gains are effectively not taxed. This change will affect a broader swath of individuals. To assess the impact of the first of these proposed tax changes, I had to start with an estimate of the percentage of stocks that are held by those that will be impacted by the law. While the administration is pointing out that only 0.3% of individuals will be affected by the law, these individuals hold a disproportionate share of stocks, because of their wealth. If it is estimated that the top 1% (in terms of wealth) in the United States hold 51.8% of stocks, and it stands to reason that the top 0.3% hold 30% or more of stocks. Using the 30% threshold, I can recompute the returns you would need to make on a pre-personal tax basis to arrive at the same post-personal tax return earned before the tax change:
 With the increase in capital gains tax rates for the wealthy, the pre-personal tax expected return has to rise to 6.05% to get the same post-tax expected return of 5.01%.
 Revaluing the index using the same cash flows as we did before, but with the higher expected return, we can estimate a new value for the index:
 Download spreadsheetIf nothing else changes in the estimation, an increase in the capital gains tax rate for the wealthiest subset of investors will cause value to decline by about 7.09%. This computation ignores what may be the bigger change in the tax code, which is the capital gains assessment on inherited assets. That effect will affect more investors, and thus potentially cause a further reassessment of pre-personal tax returns. In defense of the Biden proposal, the counter argument could be that the funds raised from these taxes will be invested back in the economy, and create higher economic growth, which, in turn, will benefit businesses by delivering higher earnings. Even though the effects of this tax code change on stock prices are likely to be modest, there are aspects of this tax proposal that I do not like. Not only does it pick on a tiny group of individuals as deserving of paying more in taxes, but it seems to be motivated less by the desire to raise revenues, and more by the urge to punish. As always, this is rationalized by arguing that the rich don't pay their fair share of taxes, though the evidence for that proposition is either anecdotal, or based upon a selective reading of the data. The wealthiest among us can afford to pay more in taxes, but insulting them or treating them as a pariah class, while asking them to pay more, will only induce them to find ways to avoid doing so, and who can blame them? If they decide to do so, this is also the group with the most weapons at its disposal for sheltering income from taxes, and I have a feeling that one group that will clearly benefit, if this proposal goes through, are tax accountants and lawyers. If you are not among that tiny targeted group, it is delusional to think that forcing individuals in this group to pay more in taxes will have no effect on you, since this group punches well above its weight. There is a very real danger here that as we take aim at what we think are the idle rich, we risk shooting ourselves in the foot. Finally, if the most effective tax codes are simple and direct, changes like the proposed one, where segments of taxpayers are assessed a higher tax rate on portions of income are exactly what cause them to become complex and inefficient. I have a feeling that both sides of this tax debate will find my analysis wanting, with those in support of the proposal feeling that I am taking too narrow a perspective, by just changing the tax rates, and those opposed arguing that an increase in the tax rates will have negative consequences that stretch well beyond the tax rate effect, driving investors out of stocks into more opaque (from a tax perspective) investments.
The Bottom Line
May intent in this post was less to focus in on the Biden proposal, and more to open a discussion of how personal taxes affect not only valuation, but also corporate finance behavior. That effect is often missed by analysts because it is not explicitly part of the valuation of publicly traded companies, but it implicitly plays a role, and perhaps even a key one.
As capital gains and dividend tax rates are changed, the changes percolate through into expected returns and risk premiums, and through those into value. It is one more reason that blindly using historical risk premiums can lead to static and strange values. Companies, faced with investing, financing and dividend questions, may answer them differently, when personal taxes change. Thus, is it possible that the increase in capital gains taxes could reduce cash returned, especially in the form of buybacks? Absolutely, and especially so at closely held firms. For governments, changing the tax rates on investment income to increase tax revenues is fraught with uncertainties. For instance, if the capital gains tax change goes through, it will almost certainly not begin until 2022, and there will be a significant amount of selling towards the end of 2021, as some wealthy investors lock in the current favorable capital gains tax rate. Going forward, a higher required return on stocks will mean lower market valuations, which reduces capital gains in general, and tax collection from those capital gains, as a consequence. One reason to be wary of government forecasts of large tax collections from increases in capital gains tax rates is that these forecasts are built on the presumption that the market that is the goose that lays this golden egg will continue going up, since rising markets deliver higher capital gains, and the tax rate hike may kill that goose.YouTube
Datasets
Tax rates on dividends and capital gains: USHistorical returns on stocks, bonds and bills: 1928 -2020Historical pre and post-tax returns on stocks: 1928 -2020SpreadsheetsImpact of investor tax rate changes on stock pricesApril 20, 2021
The Corporate Tax Burden: Facts and Fiction
The Biden Administration's $ 2 trillion infrastructure plan, announced with fanfare a few weeks ago, has opened up a debate about not only what comprises infrastructure, but also about how to pay for it. Not surprisingly. it is corporate taxes that are the primary vehicle for delivering the revenues needed for the plan, with an increase in the federal corporate tax rate from 21% to 28% being the central proposal. I will leave the debate on what comprises infrastructure to others, and focus entirely on the corporate tax question in this post. I do this, knowing fully well that tax debates quickly turn toxic, as people have strong priors on whether corporations pay their fair share of taxes, and selectively find inforrmation to back their positions. I will begin by laying out the pathways through which corporate taxes affect company value, and then looking at how the 2017 tax reform act, which lowered the federal tax rate from 35% to 21%, has affected corporate behavior.
Taxes, Earnings and Value
At first sight, this section may seem useless, because the effect of tax rates on value seems blindingly obvious. As the corporate tax rate rises, all else being held constant, companies will pay more of their earnings in taxes, and should be worth less. That facile assessment, though, can falter for the following reasons:
Feedback effect on taxable income: This may seem cynical, but it is nevertheless true that the amount that companies report as taxable income and how much they choose to defer taxes into future years is a function of the corporate tax rate. As tax rates rise, corporations use the discretion built into the tax code to report less taxable income and to defer more taxes to future years. It is for this reason that legislatures around the world over estimate how much additional revenue they will generate, when they raise taxes, and investors over estimate how much corporate earnings will rise when tax rates are decreased. Contemporaneous changes in the tax code: When corporate tax rates are changed, it is a given that there will be other changes in the tax code that may either counter the tax rate change or add to it. For instance, the 2017 US tax reform act, in addition to lowering the corporate tax rate, also changed the way that foreign income to US companies was taxed and put limits on the tax deductibility of debt.Financing Mix: Companies can raise capital either from equity or debt, and the costs of equity and debt can be altered when the tax rate changes. That is because interest on debt is tax deductible, and as the corporate tax rate rises, the after-tax cost of debt falls, making debt more attractive as a financing option for companies, relative to equity.The picture below maps out how tax rates can affect earnings, cash flows and value:
Note that it is the effective tax rate, determined by tax deferrals and other tax management tools, that drives after-tax earnings and cash flows, and the marginal tax rate, i.e., the tax rate on the last dollar of income earned that determines the corporate after-tax borrowing cost. It is this reason that the effect of raising or lowering corporate tax rates on value can get murky, with the following general propositions:Tax Deferral Options: Companies that have more options when it comes to deferring taxes than others can buffer the impact of higher corporate taxes by choosing to defer taxes and report less taxable income. The most significant of those options, in my view, is foreign sales, with companies that generate more of their income overseas acquiring more tax freedom than purely domestic companies. There are other options embedded in the tax code allowing for tax credits and deductions for some investments and expenses, with sectors like real estate being prime beneficiaries.Debt funding: Firms that are heavier users of debt financing will be able to offset some or even all of the impact of a higher corporate tax rate, by increasing their debt funding and using the tax advantages that come with the higher tax rate to lower their costs of capital.Put simply, when corporate tax rates are raised, not all companies will lose equally, and there may even be a few companies that emerge as net winners.
Marginal Tax Rates
Much of the discussion about corporate taxes is centered on the corporate tax rate, enumerated in the corporate tax code. As the proposal to raise the US corporate tax rate from 21% to 28% (or some number in the middle) is discussed, it is worth looking at the history of US corporate tax rates, going back to their inception early in the twentieth century:
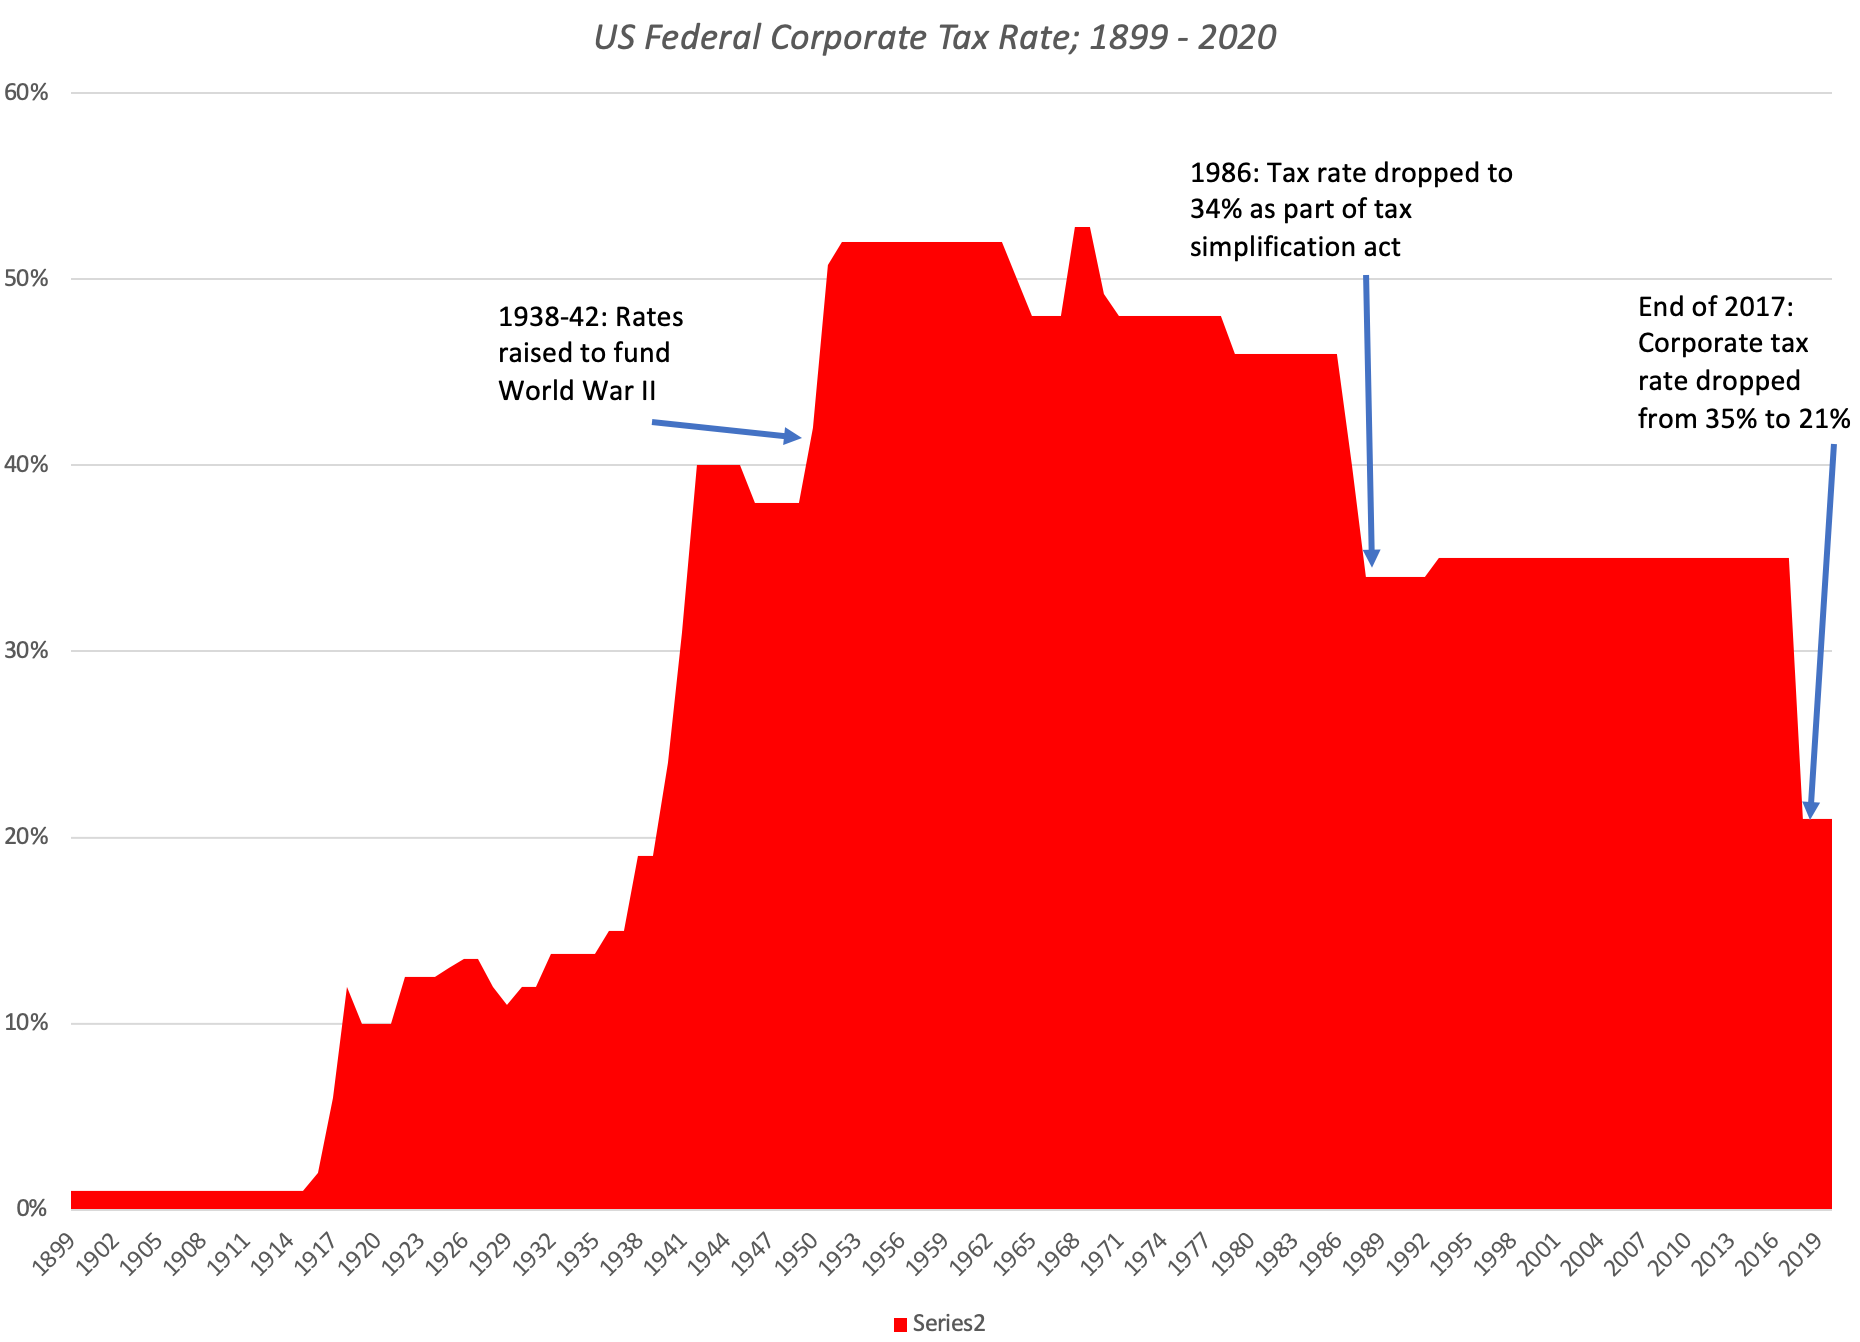 For proponents of raising corporate taxes, this picture is their strongest suit, since corporate tax rates are now lower than they have been since the 1930s. For much of this history, the US also adopted a global tax model, which required US companies to pay the US tax rate not just on income earned in the US, but also in foreign markets, with the caveat that the foreign income would be taxed, when repatriated to the US. In a predictable consequence, US multinationals chose to leave their foreign income outside the US, creating the phenomenon of trapped cash, i.e., income held in foreign locales to avoid taxes, but also trapped because that income could not be used to pay dividends, buy back stock or invest in projects in the United States.
While that system worked well for most of the twentieth century, it started to break down towards the end of that century, as the US became a less dominant player in the global economy, and other countries lowered their corporate tax rates. The first development meant that larger proportions of US corporate income was generated overseas, and the second increased the differential tax rates and thus the repatriation penalty. By 2014, when I wrote this post, the US tax code had become dysfunctional, as the trapped cash cumulated to trillions of dollars and some US companies sought to move their incorporation to other countries. This history is worth emphasizing, because the change in the US corporate tax rate in 2021, from 35% to 21%, accompanied by the abandonment of the global tax model just brought the US closer to the rest of the world in terms of both tax rates and treatment of foreign income. In fact, at the start of 2021, the picture below summarizes corporate tax rates around the world:
 Source: KPMGNote that the marginal tax rate for US companies is close to 25%-27%, with state and local taxes added on, and is roughly equal to the average tax rates in almost every region of the world.
 Effective Tax Rates
Governments set corporate tax rates, but companies use the tax code to full advantage to try to minimize taxes paid and delay the payment of taxes. The effective tax rate measures the actual taxes paid, relative to taxable income, and it is the number that determines how much governments collect as tax revenues.
Measures of Taxes Paid
To measure how much companies pay in taxes, you have to start with the financial statements of the company, recognizing that these are reporting documents, not tax documents. Put simply, what you see as taxable income in the annual report or public financial filing for a company can be very different from the taxable income in the tax filings made by the same company. Since we have no access to the latter, at least for individual companies, there are clues in the reported financials that can nevertheless help us assess how much a company pays in taxes:

Note that effective tax rate is computed based upon the income statement, and is computed by dividing the accrual measure of taxes by the accrual taxable income. While that is the tax rate that most databases report, it may fail to capture the true tax burden for two reasons:
Accrual income: It is worth remembering that accrual income is after accounting expenses, some of which are related to operations (cost of goods sold, marketing), some to financial (interest expenses) and some of which are determined by the tax code (depreciation and amortization, write offs, special charges). A company that is savvy about using tax provisions to lower its accrual income may be able to look like it is paying a high effective tax rate, but is actually paying very little in absolute terms.Cash taxes versus Accrual taxes: The actual taxes paid by to the government (cash taxes) can be higher or lower than the accrual taxes, and the difference should be visible in the cash flow statement in the form of deferred taxes. Past tax behavior: One final factor that can affect a company's tax burden is its past history. A company that has lost considerable amounts in prior years can accumulate net operating losses and reduce taxes paid in the current period. Alternatively, a company that has deferred taxes in prior years will find itself playing catch-up and paying more in taxes in the current year, just as companies that have pre-paid taxes in previous years may be able to pay far less in taxes in the current year.As a result of these three phenomena, you can sometimes see effective tax rates that look implausible or even impossible, ranging from rates in excess of 100% to rates less than zero. You can already see, from this description, that computing effective and cash tax rates for individual companies and then averaging across those tax rates can be problematic for a few reasons. The first is that any grouping of companies, where a fairly large number are money-losing and not paying taxes, will give you an average tax rate that is low, even if companies are paying their fair share. The second is that extreme values on tax rates for some companies can skew averages, and if your grouping includes both small and large companies, looking at the average tax rate across companies will not accurately reflect whether companies collectively are bearing a fair burden. If it sounds like I am spending time in the weeds, it is because I face this challenge every year when I report average effective tax rates by sector for companies around the world on my website. To cater to different needs, I report four different tax measures, each of which can yield different values and come with different caveats:Taxes paid in dollar value (Accrual and Cash): This reflects the aggregate amount paid by all companies in a grouping during the most recent year. Ultimately, this is the number that matters most from a tax collection perspective.Average effective tax rate across all companies: This is the average tax rate across all companies in a grouping, including money losing companies. Not surprisingly, the average will be pushed down as the number of money losing firms increases.Average effective tax rate across money making companies: This deals with the problem of money losing companies, but it is a simple average and it weights very small companies and very large companies equally.Aggregate tax rate: This is the tax rate that best captures how much companies pay in a sector, and is computed by dividing the sum of taxes paid by all companies in a sector by the sum of taxable income. It thus weights bigger companies more than smaller companies.To illustrate, for US pharmaceutical companies, at the start of 2021, and using income from the trailing 12 months (through September 2020), we find that the these companies collectively paid $9.43 billion in accrual taxes and $15.98 billion in cash taxes. This translated into an average tax rate across all companies of 1.88%, an average tax rate of 16.30% across only money making companies, an aggregate tax rate of 18.19% with accrual taxes (and 32.96% based upon cash taxes).US Effective Tax rates
The United States is fertile ground to examine how companies manage taxes for two reasons. The first is that until very recently, US companies faced among the highest marginal tax rates of companies anywhere in the world. The second is that the US tax code also has more credits and deductions, often put in by Congress with the best of intentions, that allow companies more discretion when it comes to computing taxable income and tax deferrals. To measure how much companies pay in taxes, I look at how much US companies have, in the aggregate, paid in taxes between 2016 and 2020, in the table below:

Note that while the corporate tax rate dropped by 14% (from 35% to 21%) from 2017 to 2018, the effective tax rate decreased by 6.8% and the cash tax rate by 2.75%. In a more telling statistic, the dollar value of taxes paid increased between 2017 and 2019 by 1.4% and cash taxes by almost 18%, as companies reported more taxable income. To put corporate tax behavior in larger perspective, I looked at corporate pre-tax income and taxes reported by the Bureau of Economic Analysis, going back to 1929:

While there are differences in year to year numbers, looking at this source rather than corporate filings, the story remains the same. Over time, the effective tax rate for companies has drifted down, with the decline accelerating over the last twenty years. It is also clear that the big disruptions in tax rates have come from economic shocks, with taxes collected and tax rates paid declining economic slowdowns and recessions. While the arguments about the right tax rate for US companies and whether they pay their fair share in taxes are legitimate ones, it has to start with a reality check. The perception that US companies are now paying significantly less in taxes than they were prior to 2017, while it may fit your preconceptions about corporate tax behavior, is not backed up by facts. Of course, you could believe that they should pay more than they have historically, but that discussion has to start with the recognition that lowering the tax rate in 2017 is not the reason, and that reversing it will not be the solution.
International Tax Behavior
There is a widespread belief that US companies pay less in taxes than their global counterparts, and to see if that is true, I look at effective tax rates paid by companies in different countries in the map below:

On this measure, I do think that those who believe that US companies pay less than their "fair" share have a point, since the effective tax rate paid by US companies is lower than the effective tax rates of companies in much of the rest of the world (barring Canada). The differences are smaller when you look at the cash tax rate, but there is evidence here of the drag created by the tax credits and deductions added over multiple tax reform acts to the US tax code. The differences in tax rates across the world also underlie the challenge that Janet Yellen will face in trying to get companies to agree to a global minimum tax rate. The countries with tax rates much lower than the global average benefit because they draw in corporate subsidiaries that hope to benefit from the lower tax rates.
Sector-specific Tax Behavior
It is true that companies in different sectors are affected by the tax code differently, partly because there are tax credits and deductions that are directly specifically at specific sectors. To examine differences in tax rates paid by US companies in each industry grouping, I decided to go back to 2019, rather than 2020 numbers, because the COVID crisis wreaked havoc in some sectors.
 Data for all industries
There are clear differences in taxes paid across sectors, with some of the reasons being obvious (REITs are pass through entities that pay no federal taxes) and some not. For instance, technology companies and pharmaceutical businesses are mostly in the first two columns (with the lowest tax rates) and retail companies pay much higher tax rates. Pharmaceutical and technology companies do share a common characteristic, which is that their primary capital expenditure takes the form of R&D, which has historically been expensed at these companies, rather than capitalized and depreciated. To see if that has explanatory power, when it comes to effective tax rates, I broke down US companies into quintiles, based upon R&D as a percent of sales, again using 2019 data, and computed effective and cash tax rates, by quintile:

Companies that have the highest percent of R&D as a percent of sales not only have the smallest proportion of firms with taxable income, but also pay the lowest effective and cash tax rates. However, these are also younger, money-losing companies, and their tax behavior may just reflect where they are in the corporate life cycle. In fact, when you compare all firms with R&D expenses to those without those expenses, the results are mixed. A larger proportion of firms with R&D expenses report taxable income, and while they pay a lower effective tax rate than non-R&D firms, they pay a highest cash tax rate.
Finally, there seems to be a perception that it is the largest companies that are not paying their fair share in taxes, fed by anecdotal evidence of high profile companies that pay no taxes; in the last few years, those examples have included GE, Amazon and FedEx. To see if this is true, across companies, I broke US companies down my market capitalization into ten deciles and looked at the tax behavior in each grouping.
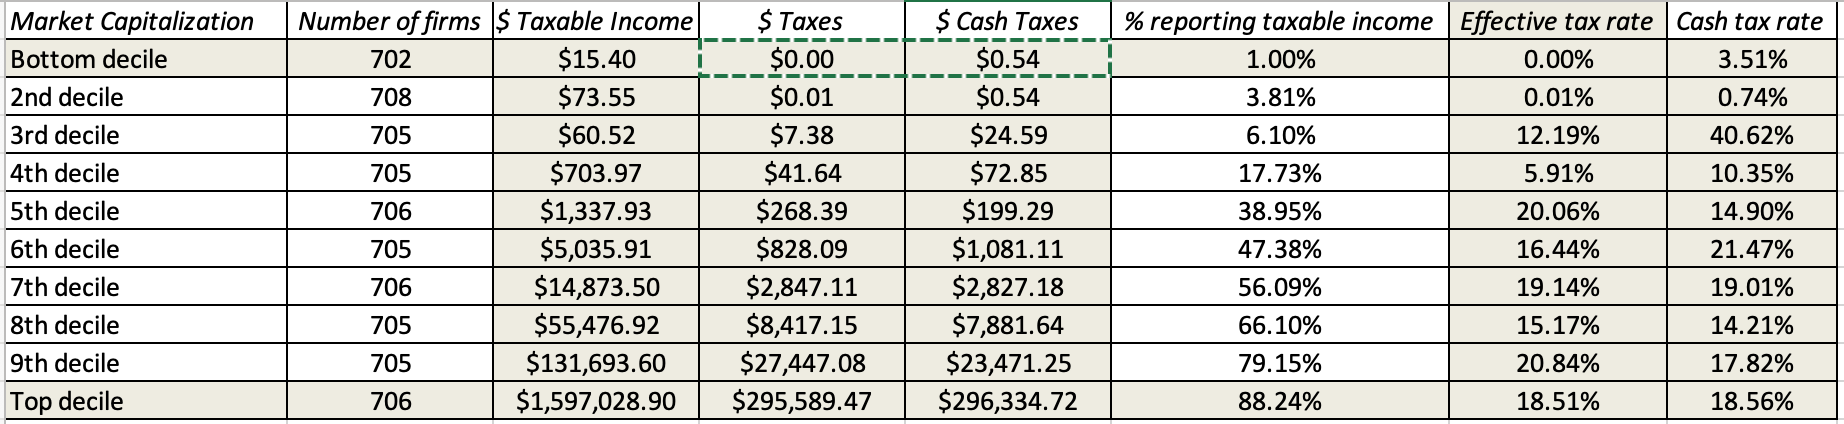 There is little evidence in this table to support the notion that larger companies are more likely to evade taxes than smaller ones. In fact, the percentage of companies with taxable income rises with market capitalization, and the effective tax rates of the top deciles are clearly higher than those of the bottom deciles.
Thoughts on new tax laws
If Congress gets around to passing another tax reform act, I am sure that legislators will gets lots of opinions on what they should be doing, not to mention millions of dollars off lobbying directed at them. I am sure that my thoughts on what good tax legislation should look like matter little, but here they are:
Pinpoint your mission: In keeping with the saying that if you do not know where you going, it does not matter how you get there, the starting point for all tax legislation has to be with the end game. Early on, legislators have to decide whether they consider corporate taxes to primarily a source of revenues to the government or a weapon to punish "bad" corporate behavior and to "reward" good corporate behavior. While I understand the urge to use the tax code to mete out punishment to "bad" companies or to encourage companies to pay a living wage and keep their operations in the United States, the resulting laws may actually result in less tax revenue to the government, with only fleeting benefits.All tax talk is agenda-driven: Undoubtedly, there will be research from the Congressional budget office on the revenue consequences of tax law changes and testimony from economists and tax experts. They will use numbers that back their arguments and look like facts, but in my experience, it is easy to lie with numbers, especially when it comes to taxes. Focus on removing tax deductions/credits, not on increasing tax rates: If the end game is to get companies to pay more in taxes, removing tax deductions and credits will be more effective than increasing the tax rate. In fact, raising the tax rate will not only raise the effective tax rate paid by companies far less than expected, but it will also have disparate effects across companies, with sectors (like retail) that have fewer degrees of freedom, when it comes to changing taxable income or deferring taxes, bearing the brunt of the pain. I know that this is easier said than done, since every tax deduction/credit has a constituency that will plead for its preservation, but one reason why the tax code has become the convoluted mess that it has become, is because we have not frontally dealt with this problem. An added benefit of doing this will be that there will be less work for tax accountants and lawyers and fewer tax-driven investments and decisions.You operate in a global economy: No matter how careful you write the tax laws, multinationals will retain a substantial amount of freedom to move their operations and income around the world. A country that is an outlier when it comes to taxes, as the United States was prior to 2017, will lose out in the competition for new businesses. While I do think that a global corporate minimum tax can reduce this cost somewhat, getting countries to sign on, especially when they realize that they will be "net losers" from being part of it, will be difficult.Provide long-term predictability: Whatever Congress decides to do with the tax code, it should also provide a degree of predictability for an extended period. Changes to the tax law that are temporary or come with sunset provisions create uncertainty for businesses trying to make investment decisions for the long term. In addition, changes in tax law take a while to work their way into corporate behavior. One of the better features of the 2017 tax act was that it had provisions designed to make debt financing less attractive, relative to equity, but we will not get a chance to see if companies become less dependent on debt, if tax rates are hiked and/or the limitations on interest tax deductions are eliminated.Am I hopeful that Congress will keep these in mind, while it writes new tax laws? Not really, but there is no harm in hoping!YouTube Video
DatasetsMarginal tax rate by countryEffective tax rate by countryEffective tax rate, by sector (US, Global)
Aswath Damodaran's Blog

- Aswath Damodaran's profile
- 725 followers

