
Aswath Damodaran's Blog, page 11
March 25, 2021
Interest Rates, Earning Growth and Equity Value: Investment Implications
The first quarter of 2021 has been, for the most part, a good time for equity markets, but there have been surprises. The first has been the steep rise in treasury rates in the last twelve weeks, as investors reassess expected economic growth over the rest of the year and worry about inflation. The second has been a shift within equity markets, a "rotation" in Wall Street terms, as the winners from last year underperformed the losers in the first quarter, raising questions about whether this shift is a long term one or just a short term adjustment. The answers are not academic, since they cut to the heart of how stockholders will do over the rest of the year, and whether value investors will finally be able to mount a comeback.
The Interest Rates Story
To me the biggest story of markets in 2021 has been the rise of interest rates, especially at the long end of the maturity spectrum. To understand the story and put it in context, I will go back more than a decade to the 2008 crisis, and note how in its aftermath, US treasury rates dropped and stayed low for the next decade.

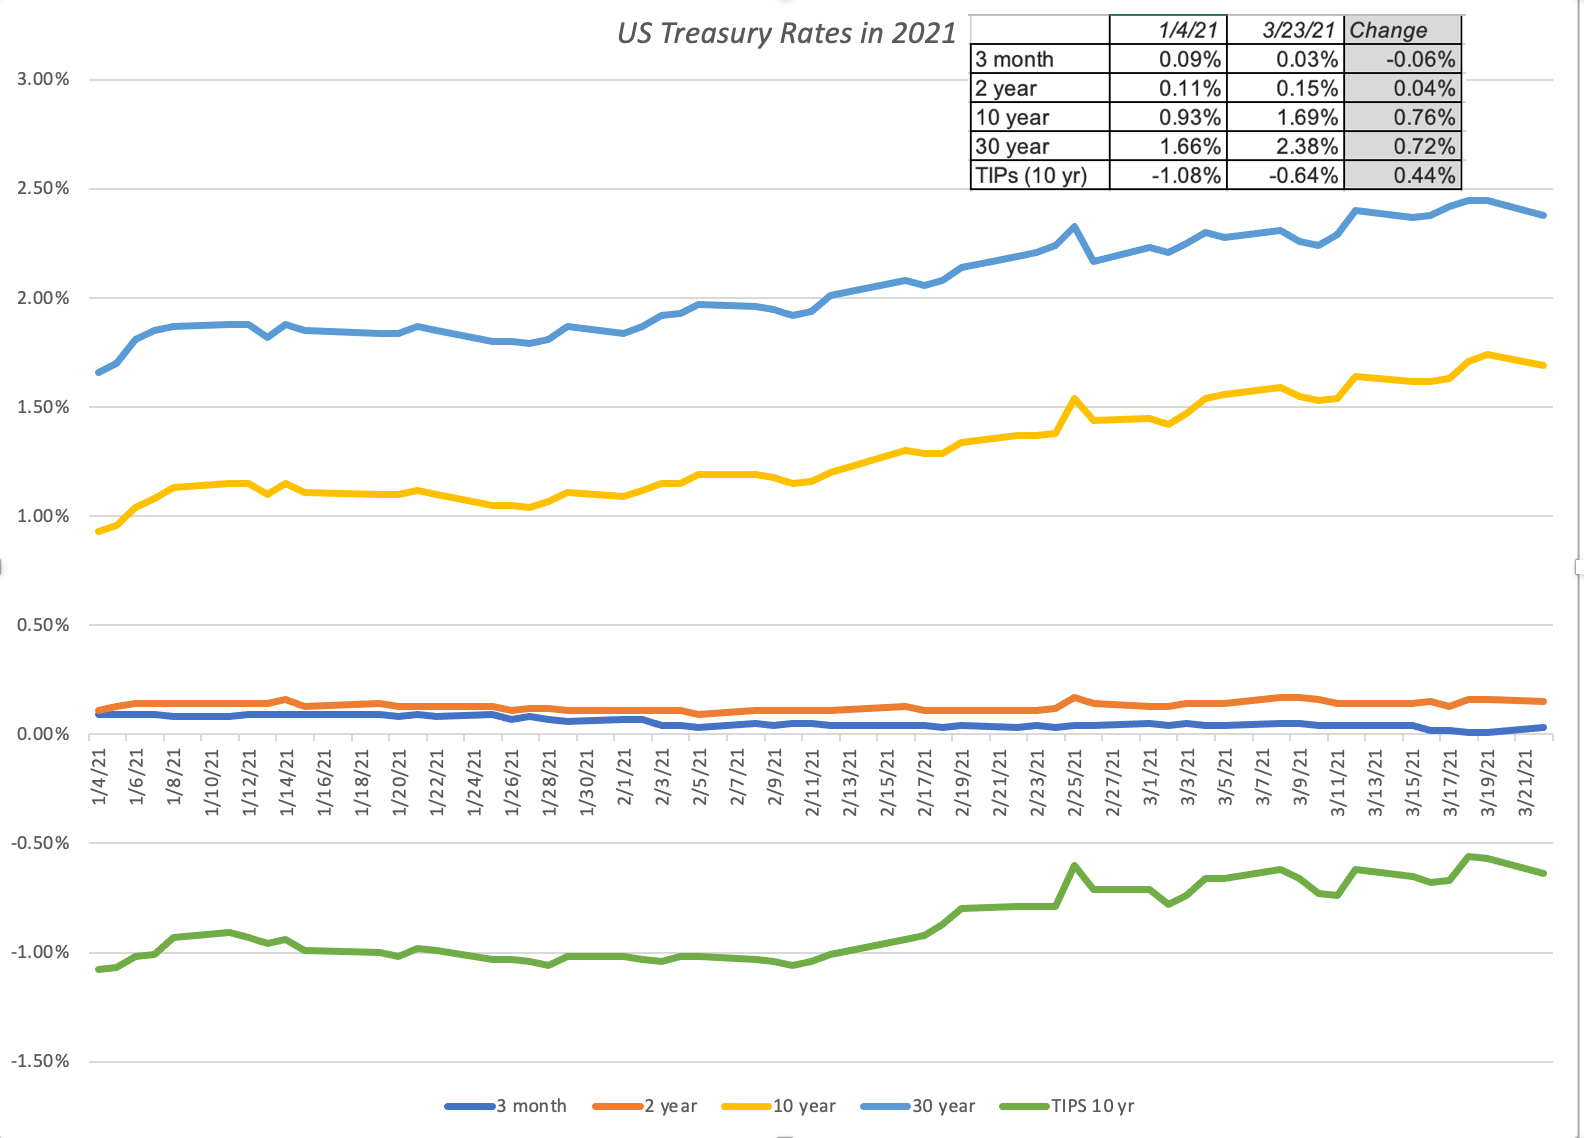
Coming in 2020, the ten-year T.Bond rate at 1.92% was already close to historic lows. The arrival of the COVID in February 2020, and the ensuing market meltdown, causing treasury rates to plummet across the spectrum, with three-month T.bill rates dropping from 1.5% to close to zero, and the ten-year T.Bond rate declining to close to 0.70%. Those rates stayed low through the rest of 2020, even as equity markets recovered and corporate bond spreads fell back to pre-crisis levels. Coming into 2021, the ten-year T.Bond rate was at 0.93%, and I noted the contradiction in investor assessments for the rest of the year, with the consensus gathered around a strong economic comeback (with earnings growth following), but with rates continuing to stay low. In the first quarter of 2021, we continued to see evidence of economic growth, bolstered by a stimulus package of $1.9 trillion, but it does seem like the treasury bond market is starting to wake up to that recognition as well, as rates have risen strongly:
These rising rates have led to some hand wringing about why the Fed is not doing more to keep rates down, mostly from people who seem to have an almost mystical faith in the Fed's capacity to keep rates wherever it wants them to be. I would argue that the Fed has tried everything it can to keep rates from rising, and the very fact that rates have risen, in spite of this effort, is an indication of the limited power it has to set any of the rates that we care about in investing. To those who use the low interest rates of the last decade as proof of the Fed's power, I would counter with a graph that I have used many times before to illustrate the fundamental drivers of interest rates (and the Fed is not on that list):

The reason interest rates have been low for the last decade is because inflation has been low and real growth has been anemic. With its bond buying programs and its "keep rates low" talk, the Fed has had influence, but only at the margin.
As for rates for the rest of the year, you may draw comfort from the Fed's assurances that it will keep rate low, but I don't. Put bluntly, the only rate that the Fed directly sets is the Fed Funds rate, and while it may send signals to the market with its words and actions, it faces two limits.
The first is that the Fed Funds rate is currently close to zero, limiting the Fed's capacity to signal with lower rates. The second and more powerful factor is that the reason that a central bank is able to signal to markets, only if it has credibility, since the signal is more about what the Fed sees, using data that only it might have, about inflation and real growth in the future. Every time a Federal Reserve chair or any of the FOMC members make utterances that undercut that credibility, the Fed risks losing even the limited signaling power it continues to have. I believe that the most effective central bankers speak very little, and when they do, don't say much.In particular, the Fed's own assessments of real growth of 6.5% for 2021 and inflation of 2.2% for the year are at war with its concurrent promise to keep rates low; after all, adding those numbers up yields a intrinsic risk free rate of 8.7%. While I understand that much of the real growth in 2021 is a bounce back from 2020, even using a 2-3% real growth yields risk free rates that are much, much higher than today's numbers.The Stocks Story
As treasury rates have risen in 2021, equity markets have been surprisingly resilient, with stocks up during the first three months. However, as with last year, the gains have been uneven with some groups of stocks doing better than others, with an interesting twist; the winners of last year seem to be lagging this year, and the losers are doing much better. While some of this reversal is to be expected in any market, there are questions about whether it has anything to do with rising rates, as well as whether there may be light at the end of the tunnel for some investor groups who were left out of the market run-up in the last decade. For much of the last year, I tracked the S&P 500 and the NASDAQ, the first standing in for large cap stocks and the broader market, and the latter proxying for technology and growth stocks, with some very large market companies included in the mix. Continuing that practice, I look at the two indices in 2021:
 Both indices are up for the year, but they have diverged in their paths. In January, the NASDAQ continued its 2020 success, and the S&P 500 lagged, losing value. In February and March, the tide shifted, and the S&P 500 outperformed the NASDAQ. Looking at the market capitalization of all stocks listed in the United States, and breaking down the market action in 2021, by sector, here is what I see:
 The two sectors where there is the biggest divergence between post-crisis performance in 2020 and market returns in 2021 are energy, which has gone from one of the worse performing sectors to the very best and technology, which has made a journey in the other direction. Using price to book ratios as a rough proxy for value versus growth, I looked at returns in the post-crisis period in 2020 and in 2021, to derive the following table:

It is much too early to be drawing strong conclusions, but at least so far in 2021, low price to book stocks, which lagged the market in 2020, are doing much better than higher price to book stocks.
Interest Rates and Value
As interest rates have risen, the discussion in markets has turned ito the effects that these rates will have on stock prices. While the facile answer is that higher rates will cause stock prices to fall, I will argue in this section that not only is the answer more nuanced, and depends, in large part, on why rates are rising in the first place.
Value Framework
As with any discussion about value and the variables that affect it, I find it useful to go back to basics. If you accept the proposition that the value of a business is a function of its expected cash flows (with both the benefits and costs of growth embedded in them) and the risk in these cash flows, we are in agreement on what drives value, even if we disagree about the specifics on how to measure risk and incorporate it into value:

This equation looks abstract, but it has all of the components of a business in it, as you can see in this richer version of the equation:
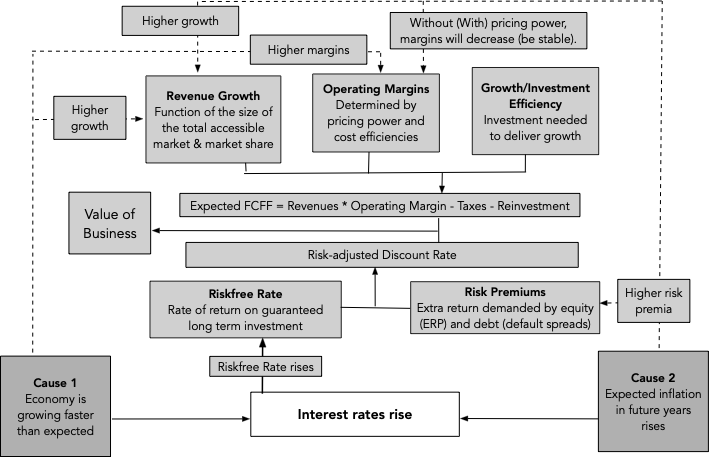
In this richer version, the effect of rising rates can be captured in the components that drive value. The direct effect is obviously through the base rate, i.e. the riskfree rate, on which the discount rate is built, and it is the effect that most analysts latch on to. If you stopped with that effect, rising rates always lead to lower values for equities, since holding all else constant, and raising what you require as a rate of return will translate into lower value today. That misses the indirect effects, and these indirect effects emerge from looking at why rates rose in the first place. Fundamentally, interest rates can rise because investors expectations of inflation go up, or because real economic growth increases, and these macroeconomic fundamentals can affect the other drivers of value: table.tableizer-table { font-size: 12px; border: 1px solid #CCC; font-family: Arial, Helvetica, sans-serif; } .tableizer-table td { padding: 4px; margin: 3px; border: 1px solid #CCC; } .tableizer-table th { background-color: #104E8B; color: #FFF; font-weight: bold; }
Higher real growthHigher inflation Riskfree RateRiskfree rate will rise.Riskfree rate will rise. Risk premiumsNo effect or even a decrease.Risk premia may rise as inflation increases, because higher inflation is almost always more volatile than low inflation. Revenue GrowthIncreases with economic growth, and more so economy-dependent companiesIncreases, as inflation provides a backdraft adding to existing real growth. Operating MarginsIncreases, as increased consumer spending/demand allows for price increasesFor companies with the power to pass through inflation to their customers, stable margins, but for companies without that pricing power, margins decrease. Investment EfficiencyImproves, as the same investment delivers more revenues/profits.No effect, in real terms, but in nominal terms, companies can look more efficient. Value EffectMore likely to be positive. Investors will demand higher rates of return (negative), but higher earnings and cash flows can more than offset effect.More likely to be negative. Investors will demand higher rates of return (negative), and while revenue growth will increase, lower margins will lead to lagging earnings.Put simply, the effect of rising rates on stock prices will depend in large part on the precipitating factors.
If rising rates are primarily driven by expectations of higher real growth, the effect is more likely to be positive, as higher growth and margins offset the effect of investors demanding higher rates of return on their investments. If rising rates are primarily driven by inflation, the effects are far more likely to be negative, since you have more negative side effects, with risk premiums rising and margins coming under pressure, especially for companies without pricing power. To see how changes in interest rates play out in equity markets, I started with a simple, perhaps even simplistic adjustment, where I look at quarterly stock returns and T.Bond rates at the start of each quarter, to examine the linkage. Download data
While the chart itself has too much noise to draw conclusions, the correlations that I have calculated provide more information. The negative correlation between stock returns and rate changes in the prior quarter (-.12 with the treasury bond rate) provide backing for the conventional wisdom that rising rates are more likely to be accompanied by lower stock returns. However, if you break down the reason for rising rates into higher inflation and higher real growth increases, stocks are negatively affected by the former (correlation of -0.078) and positively affected by the latter (correlation of .087). It is also worth noting that none of the correlations are significant enough to represent money making opportunities, since there seems to be much more driving stock returns than just interest rates, inflation and real growth.
I also updated my valuation (from January 2021) of the S&P to reflect current rates and earnings numbers, and played out the effect of changing rates on the intrinsic PE ratio for the index:
 Download spreadsheet
In making these computations, I looked at three scenarios, a neutral scenario, where changes in the T.Bond rate are matched by changes in the expected long term earnings growth rate, a benign scenario, where expected long term earnings growth runs ahead of the change in the T.Bond rate by 0.5%, in the long term, and a malignant scenario, where earnings growth lags changes in the T.Bond rate by 0.5%, in the long term. Note that in the best case scenario, at least with my range of outcomes, where rates drop back to 1.00%, but long term earnings growth runs ahead of riskfree rates by 0.5%, the intrinsic value for the index is 3919, just above current levels. In the worst case scenario, where rates rise to 3% or higher, and growth lags by 0.5%, the index is over valued significantly. Connecting to my earlier discussion of how inflation and real growth play out differently in earnings growth, I would expect a real-growth driven increase in rates to yield values closer to my benign ones, where an inflation-driven increase in rates will be far more damaging for stocks.
Rates and the Corporate Life Cycle
There is a surprisingly complicated relationship between interest rates and stock prices, with higher interest rates sometimes coexisting with higher stock prices and sometimes with lower. As rates rise, though, the effects on value will vary across companies, with some companies being hurt more and others being hurt less, or even helped. To understand why, I will draw on one of my favorite structures, the corporate life cycle, where I argue that most companies go through a process of birth, growth, aging and ultimate decline and death. To see the connection with interest rates, note that there are two dimensions on which companies vary across the life cycle:
Cashflows: Young companies are more likely to have negative than positive cash flows in the early years, as their business models are in flux, economies of scale have not kicked in yet, and substantial reinvestment is needed to deliver the promised growth. As they mature, the cash flows will turn positive, as margins improve and reinvestment needs drop off.
Source of value: Drawing on another construct , the financial balance sheet, the value of a company can be broken down into the value it derives from investments it has already made (assets in place) and the value of investments it is expected to make in the future (growth assets). Young companies derive the bulk of their value from growth assets, whereas more mature firms get their value from assets in place.

Connecting to the earlier discussion on interest rates and value, you can see why increases in interest rates can have divergent effects on companies at different stages in the life cycle. When interest rates rise, the value of future growth decreases, relative to the value of assets in place, for all companies, but the effect is far greater for young companies than mature companies. This will be true even if growth rates match increases in interest rates, but it will get worse if growth does not keep up with rate increases.
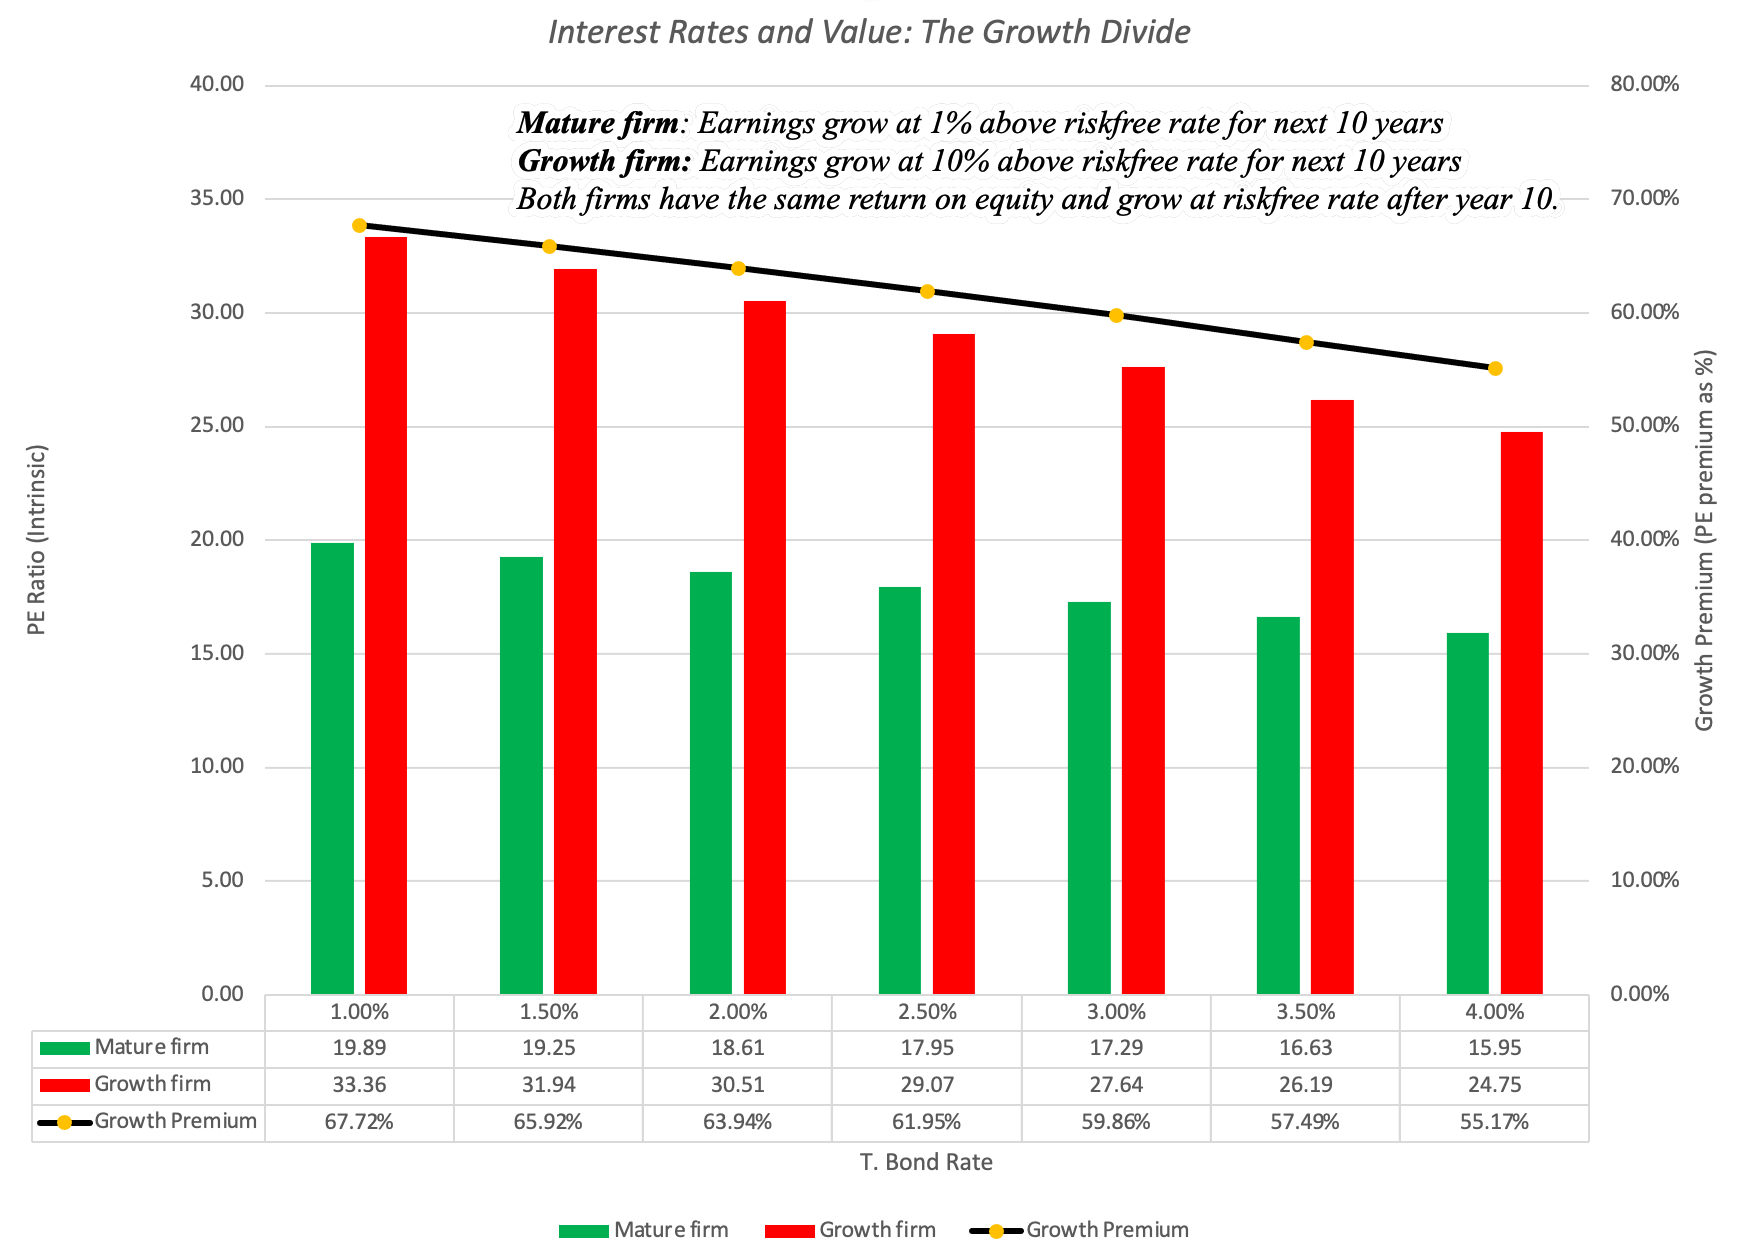
To illustrate this, I will use two firms, similar in asset quality (return on equity = 15%) and risk (cost of equity is 5% above the risk free rate), but different in growth prospects; the mature firm will grow 1% higher than the riskfree rate and the growth firm will grow 10% a year higher than the risk free rate, for the next 10 years. After year 10, both firms will be mature, growing at the risk free rate. As I increase the risk free rate, note that the costs of equity and growth rates will go up for both firms, and that their reinvestment needs will change accordingly. The effects of changing the T.Bond rate in this simplistic example are illustrated below:
 Download spreadsheet
Both companies see a decline in PE ratios, as interest rates rise, but the high growth firm sees a bigger drop. This is captured in the growth premium (computed by comparing the PE ratio for the growth firm to the PE ratio for a mature firm). You can check out the effects of introducing malign and benign growth effects into this example, with the former exacerbating the differential effect and the latter reducing it.
The Rest of 2021
I hope that this discussion of the relationship between interest rates and value provides some insight into both why the equity market has been able to maintain its upward trend in the face of rising rates, as well as explain the divergences across growth and mature companies. The primary story driving interest rates, for much of 2021, has been one of economic resurgence, and it does not surprise me that the positives have outweighed the negatives, so far. At the same time, there is concern that inflation might be lurking under the surface, and on days when these worries surface, the market is much more susceptible to melting down. My guess is that this dance will continue for the foreseeable future, but as more real data comes out on both real growth and inflation, one or the other point of view will get vindication. Unlike some in the market, who believe that the Fed has the power to squelch inflation, if it does come back, I am old enough to remember both how stealthy inflation is, as well as how difficult it is for central banks to reassert dominance over inflation, once it emerges as a threat.
YouTube Video
Data links
Treasury Rates; 1928 to 2020Intrinsic versus Actual T.Bond Rate: 1954-2020Stock Returns, Interest Rates, Inflation and Real Growth: 1960-2020Spreadsheets
S&P 500 valuation spreadsheet- March 23, 2021PE calculator for mature and growth companies


February 10, 2021
Data Update 4 for 2021: The Hurdle Rate Question!
What is a hurdle rate for a business? There are multiple definitions that you will see offered, from it being the cost of raising capital for that business to an opportunity cost, i.e., a return that you can make investing elsewhere, to a required return for investors in that business. In a sense, each of those definitions has an element of truth to it, but used loosely, each of them can also lead you to the wrong destination. In this post, I will start by looking at the role that hurdle rates play in running a business, with the consequences of setting them too high or too low, and then look at the fundamentals that should cause hurdle rates to vary across companies.
What is a hurdle rate?
Every business, small or large, public or private, faces a challenge of how to allocate capital across competing needs (projects, investments and acquisitions), though some businesses have more opportunities or face more severe constraints than others. In making these allocation or investment decisions, businesses have to make judgments on the minimum return that they would accept on an investment, given its risk, and that minimum return is referenced as the hurdle rate. Having said that, though, it is worth noting that this is where the consensus ends, since there are deep divides on how this hurdle rate should be computed, with companies diverging and following three broad paths to get that number:
1. Cost of raising funds (capital): Since the funds that are invested by a business come from equity investors and lenders, one way in which the hurdle rate is computed is by looking at how much it costs the investing company to raise those funds. Without any loss of generality, if we define the rate of return that investors demand for investing in equity as the cost of equity and the rate that lenders charge for lending you money as the cost of debt, the weighted average of these two costs, with the weights representing how much of each source you use, is the cost of capital:

The problem with a corporate cost of capital as a hurdle rate is that it presumes that every project the company takes has the same overall risk profile as the company. That may make sense if you are a retailer, and every investment you make is another mall store, but it clearly does not, if you are a company in multiple businesses (or geographies) and some investments are much riskier than others.
2. Opportunity Cost: The use of a corporate cost of capital as a hurdle rate exposes you to risk shifting, where safe projects subsidize risky projects, and one simple and effective fix is to shift the focus away from how much it costs a company to raise money to the risk of the project or investment under consideration. The notion of opportunity cost makes sense only if it is conditioned on risk, and the opportunity cost of investing in a project should be the rate of return you could earn on an alternative investment of equivalent risk.

If you follow this practice, you are replacing a corporate cost of capital with a project-specific hurdle rate, that reflects the risk of that project. It is more work than having one corporate hurdle rate, but you are replacing a bludgeon with a scalpel, and the more varied your projects, in terms of business and geography, the greater the payoff.
3. Capital Constrained Clearing Rate: The notion that any investment that earns more than what other investments of equivalent risk are delivering is a good one, but it is built on the presumption that businesses have the capital to take all good investments. Many companies face capital constraints, some external (lack of access to capital markets) and some internal (a refusal to issue new equity because of dilution concerns), and consequently cannot follow this rule. Instead, they find a hurdle rate that incorporates their capital constraints, yielding a hurdle rate much higher than the true opportunity cost. To illustrate, assume that you are a company with fifty projects, all of similar risk, and all earning more than the 10% that investments of equivalent risk are making in the market. If you faced no capital constraints, you would take all fifty, but assume that you have limited capital, and that you rank these projects from highest to lowest returns (IRR or accounting return). The logical thing to do is to work down the list, accepting projects with the highest returns first until you run out of capital. If the last project that you end up accepting has a 20% rate of return, you set your hurdle rate as 20%, a number that clears your capital.
By itself, this practice make sense, but inertia is one of the strongest forces in business, and that 20% hurdle rate often become embedded in practice, even as the company grows and capital constraints disappear. The consequences are both predictable and damaging, since projects making less than 20% are being turned away, even as cash builds up in these companies.
While the three approaches look divergent and you may expect them to yield different answers, they are tied together more than you realize, at least in steady state. Specifically, if market prices reflect fair value, the cost of raising funds for a company will reflect the weighted average of the opportunity costs of the investments they make as a company, and a combination of scaling up (reducing capital constraints) and increased competition (reducing returns on investments) will push the capital constrained clearing rate towards the other two measures. If you are willing to be bored, I do have a paper on cost of capital that explains how the different definitions play out, as well as the details of estimating each one.
Hurdle Rate - The Drivers
For the rest of this post, I will adopt the opportunity cost version of hurdle rates, where you are trying to measure how much you should demand on a project or investment, given its risks. In this section, I will point to the three key determinants of whether the hurdle rate on your next project should be 5% or 15%. The first is the business that the investment is in, and the risk profile of that business. The second is geography, with hurdle rates being higher for projects in some parts of the world, than others. The third is currency, with hurdle rates, for any given project, varying across currencies.
A. Business
If you are a company with two business lines, one with predictable revenues and stable profit margins, and the other with cyclical revenues and volatile margins, you would expect to, other things remaining equal, use a lower hurdle rate for the first than the second. That said, there are two tricky components of business risk that you need to navigate:
Firm specific versus Macro risk: When you invest in a company, be it GameStop or Apple, there are two types of risks that you are exposed to, risks that are specific to the company (that GameStop's online sales will be undercut by competition or that Apple's next iPhone launch may not go well) and risks that are macroeconomic and market-wide (that the economy may not come back strongly from the shut down or that inflation will flare up). If you put all your money in one or the other of these companies, you are exposed to all these risks, but if you spread your bets across a dozen or more companies, you will find that company-specific risk gets averaged out. From a hurdle rate perspective, this implies that companies, where the marginal investors (who own a lot of stock and trade that stock) are diversified, should incorporate only macroeconomic or market risk into hurdle rates. For small private firms, where the sole owner is not diversified, the hurdle rate will have to incorporate and be higher.Financial leverage: There are two ways you can raise funding for a company, and since lenders have contractual claims on the cash flows, the cost of debt should be lower than the cost of equity for almost every company, and that difference is increased by the tax laws tilt towards debt (with interest expenses being tax deductible). Unfortunately, there are many who take this reality and jump to the conclusion that adding debt will lower your hurdle rate, an argument that is built on false premises and lazy calculations. In truth, debt can lower the hurdle rate for some companies, but almost entirely because of the tax subsidy feature, not because it is cheaper, but it can just as easily increase the hurdle rate for others, as distress risk outweighs the tax benefits. (More on that issue in a future data update post...)I know that many of you are not fans of modern portfolio theory or betas, but ultimately, there is no way around the requirement that you need to measure how risky a business, relative to other businesses. I am a pragmatist when it comes to betas, viewing them as relative risk measures that work reasonably well for diversified investors, but I have also been open about the fact that I will take an alternate measure of risk that accomplishes the same objective.
To illustrate how costs of capital can vary across businesses, I used a very broad classification of global companies into sectors, and computed the cost of capital at the start of 2021, in US $ terms, for each one:
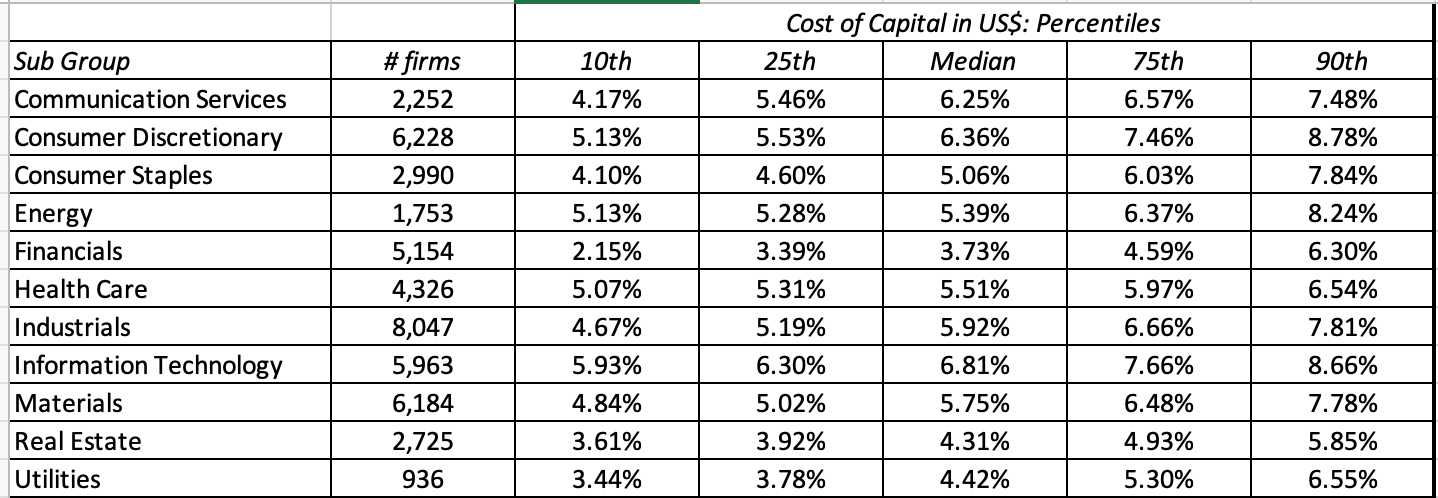
If you prefer a more granular breakdown, I estimate costs of capital by industry (with 95 industry groupings) in US $ and you can find the links here. (US, Europe, Emerging Markets, Japan, Australia/NZ & Canada, Global)
2. Geography
As a business, should you demand a higher US $ hurdle rate for investing in a project in Nigeria than the US $ hurdle rate you would require for an otherwise similar project in Germany? The answer, to me, seems to be obviously yes, though there are still some who argue otherwise, usually with the argument that country risk can be diversified away. The vehicle that I use to convey country risk into hurdle rates is the equity risk premium, the price of risk in equity markets, that I talked about in my earlier post on the topic. In that post, I computed the equity risk premium for the S&P 500 at the start of 2021 to be 4.72%, using a forward-looking, dynamic measure. If you accept that estimate, a company looking at a project in the US or a geographical market similar to the US in terms of country risk, would accept projects that delivered this risk premium to equity investors.
But what if the company is looking at a project in Nigeria or Bangladesh? To answer that question, I estimate equity risk premiums for almost every country in the world, using a very simple (or simplistic) approach. I start with the 4.72%, my estimate of the US ERP, as my base premium for mature equity markets, treating all Aaa rated countries (Germany, Australia, Singapore etc.) as mature markets. For countries not rated Aaa, I use the sovereign rating for the country to estimate a default spread for that country, and scale up that default spread for the higher risk that equities bring in, relative to government bonds.

That additional premium, which I call a country risk premium, when added to the US ERP, gives me an equity risk premium for the country in question.
 Download country ERPs
What does this mean? Going back to the start of this section, a company (say Ford) would require a higher cost of equity for a Nigerian project than for an equivalent German project (using a US $ risk free rate of 1% and a beta of 1.1 for Ford).
Cost of equity in US $ for German project = 1% + 1.1 (4.72%) = 6.19%Cost of equity in US $ for a Nigerian project = 1% + 1.1 (10.05%) = 12.06%The additional 5.87% that Ford is demanding on its Nigerian investment reflects the additional risk that the country brings to the mix.3. Currency
I have studiously avoided dealing with currencies so far, by denominating all of my illustrations in US dollars, but that may strike some of you as avoidance. After all, the currency in Nigeria is the Naira and in Germany is the Euro, and you may wonder how currencies play out in hurdle rates. My answer is that currencies are a scaling variable, and dealing with them is simple if you remember that the primary reason why hurdle rates vary across currencies is because they bring different inflation expectations into the process, with higher-inflation currencies commanding higher hurdle rates. To illustrate, if you assume that inflation in the US $ is 1% and that inflation in the Nigerian Naira is 8%, the hurdle rate that we computed for the Nigerian project in the last section can be calculated as follows:
Cost of equity in Naira for Nigerian project (approximate) = 12.06% + (8% - 1%) = 19.06%Cost of equity in Naira for Nigerian project (precise) = 1.1206 * (1.08/1.01) -1 = 19.83%In effect, the Nigerian Naira hurdle rate will be higher by 7% (7.77%) roughly (precisely) than a US $ hurdle rate, and that difference is entirely attributable to inflation differentials. The instrument that best delivers measures of the expected inflation is the riskfree rate in a currency, which I compute by starting with a government bond rate in that currency and then cleaning up for default risk. At the start of 2021, the riskfree rates in different currencies are shown below:
 Download government-bond based riskfree rates
These risk free rates are derived from government bond rates, and to the extent that some of the government bonds that I looked at are not liquid or widely traded, you may decide to replace those rates with synthetic versions, where you add the differential inflation to the US dollar risk free rate. Also, note that there are quite a few currencies with negative risk free rates, a phenomenon that can be unsettling, but one you can work with, as long as you stay consistent.
Implications
As we reach the end of this discussion, thankfully for all our sakes, let's look at the implications of what the numbers at the end of 2020 are for investors are companies.
Get currency nailed down: We all have our frames of reference, based often upon where we work, and not surprisingly, when we talk with others, we expect them to share the same frames of reference. When it comes to hurdle rates, that can be dangerous, since hurdle rates will vary across currencies, and cross-currency comparisons are useless. Thus, a 6% hurdle rate in Euros may look lower than a 12% hurdle rate in Turkish lira, but after inflation is considered, the latter may be the lower value. Any talk of a global risk free rate is nonsensical, since risk free rates go with currencies, and currencies matter only because they convey inflation. That is why you always have the option of completely removing inflation from your analysis, and do it in real terms.A low hurdle rate world: At the start of 2021, you are looking at hurdle rates that are lower than they have ever been in history, for most currencies. In the US dollar, for instance, a combination of historically low risk free rates and compressed equity risk premiums have brought down costs of capital across the board, and you can see that in the histogram of costs of capital in US $ of US and global companies at the start of 2021: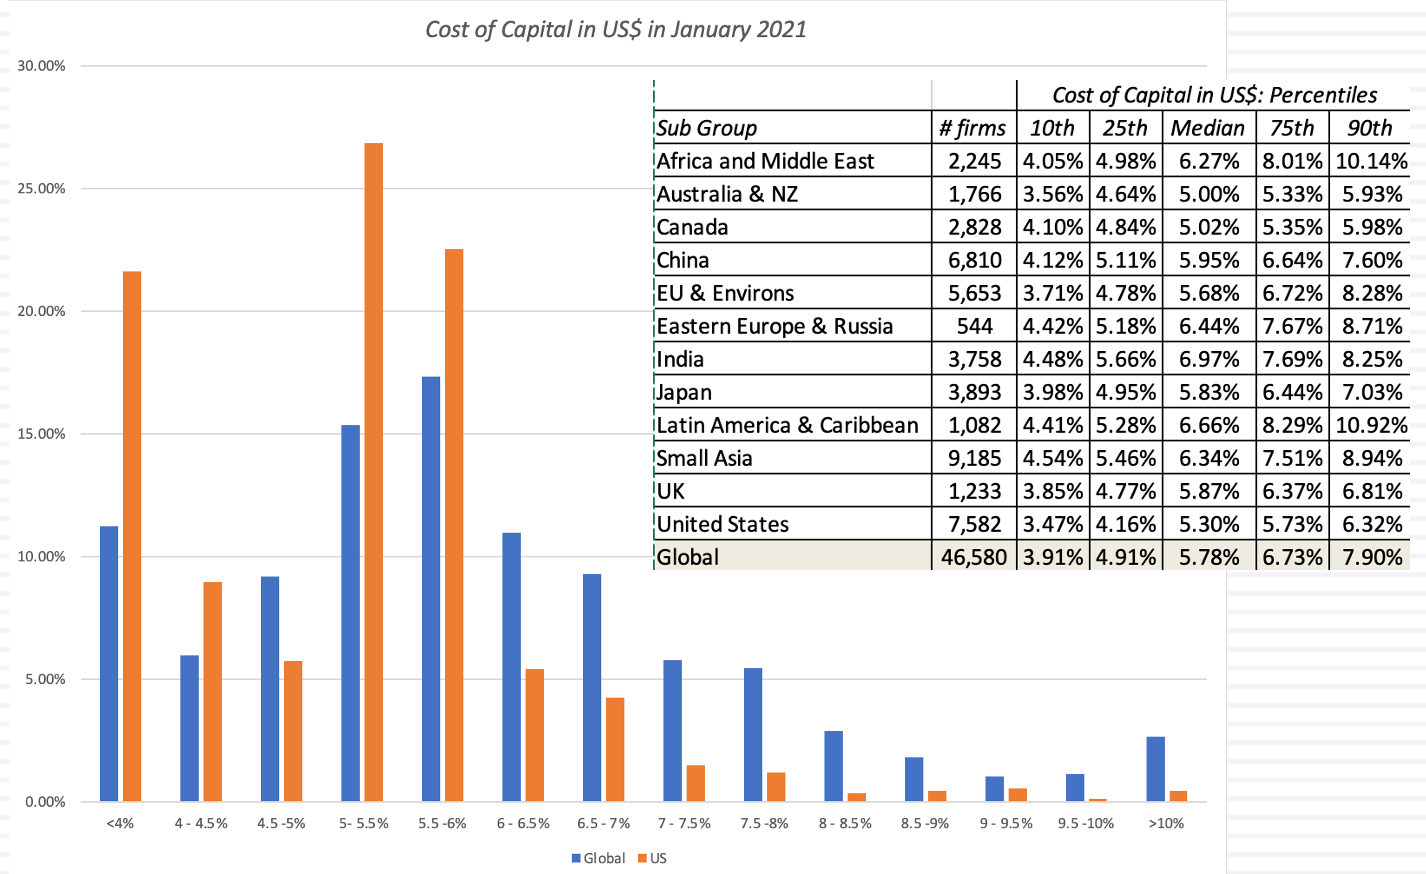
The median cost of capital in US $ for a US company is 5.30%, and for a global company is 5.78%, and those numbers will become even lower if you compute them in Euros, Yen or Francs. I know that if you are an analyst, those numbers look low to you, and the older you are, the lower they will look, telling you something about how your framing of what you define to be normal is a function of what you used to see in practice, when you were learning your craft. That said, unless you want to convert every company valuation into a judgment call on markets, you have to get used to working with these lower discount rates, while adjusting your inputs for growth and cash flows to reflect the conditions that are causing those low discount rates. For companies and investors who live in the past, this is bad news. A company that uses a 15% cost of capital, because that is what it has always used, will have a hard time finding any investments that make the cut, and investors who posit that they will never invest in stocks unless they get double digit returns will find themselves holding almost mostly-cash portfolios. While both may still want to build a buffer to allow for rising interest rates or risk premiums, that buffer is still on top of a really low hurdle rate and getting to 10% or 15% is close to impossible.Don't sweat the small stuff: I spend a lot of my time talking about and doing intrinsic valuations, and for those of you who use discounted cash flow valuations to arrive at intrinsic value, it is true that discount rates are an integral part of a DCF. That said, I believe that we spend way too much time on discount rates, finessing risk measures and risk premiums, and too little time on cash flows. In fact, if you are in a hurry to value a company in US dollars, my suggestion is that you just use a cost of capital based upon the distribution in the graph above (4.16% for a safe company, 5.30% for an average risk company or 5.73% for a risky company) as your discount rate, spend your time estimating revenue growth, margins and reinvestment, and if you do have the time, come back and tweak the discount rate.
I know that some of you have been convinced about the centrality of discount rates by sensitivity analyses that show value changing dramatically as discount rates changes. These results are almost the consequence of changing discount rates, while leaving all else unchanged, an impossible trick to pull off in the real world. Put simply, if you woke up tomorrow in a world where the risk free rate was 4% and the cost of capital was 8% for the median company, do you really believe that the earnings and cash flows you projected in a COVID world will remain magically unchanged? I don't!
YouTube Video
Spreadsheets
Cost of capital, by industry - January 2021 (US, Europe, Emerging Markets, Japan, Australia/NZ & Canada, Global)Equity Risk Premiums, by Country - January 2021 Risk free rates by currency - January 2021February 3, 2021
The Price-Value Feedback Loop: A Look at GME and AMC!
There are three topics that you can write or talk about that are almost guaranteed to draw a audience, stocks (because greed drives us all), sex (no reason needed) and salvation. I am not an expert on the latter two, and I am not sure that I have that much that is original to say about the first. That said, in my niche, which is valuation, many start with the presumption that almost every topic you pick is boring. Obviously, I do not believe that, but there are some topics in valuation that are tough to care about, unless they are connected to real events or current news. One issue that I have always wanted to write about is the potential for a feedback loop between price and value (I can see you already rolling your eyes, and getting ready to move on..), but with the frenzy around GameStop and AMC, you may find it interesting. Specifically, a key question that many investors, traders and interested observers have been asking is whether a company, whose stock price and business is beleaguered, can take advantage of a soaring stock price to not just pull itself out of trouble, but make itself a more valuable firm. In other words, can there be a feedback loop, where increasing stock prices can pull value up, and conversely, could decreasing prices push value down?
Price, Value and the Gap
For the third time in three posts, I am going to fall back on my divide between value and price. Value, as I have argued is a function of cash flows, growth and risk, reflecting the quality of a company's business model. Price is determined by demand and supply, where, in addition to, or perhaps even overwhelming, fundamentals, you have mood, momentum and revenge (at least in the case of GameStop) thrown into the mix. Since the two processes are driven by different forces, there is no guarantee that the two will yield the same number for an investment or a company at a point in time:

Put simply, you can have the price be greater than value (over valued), less than value (under valued) or roughly the same (fairly valued). The last scenario is the one where markets are reasonably efficient, and in that scenario, the two processes do not leak into each other. In terms of specifics, when a stock's value is roughly equal to its price:
Issuing new shares at the market price will have no effect on the value per share or the price per share, dilution bogeyman notwithstanding.Buying back shares at the market price will have no effect on the value per share or price per share of the remaining shares, even though the earnings per share may increase as a result of decreased share count.I know these implications sound unbelievable, especially since we have been told over and over that these actions have consequences for investors, and so much analysis is built around assessments of accretion and dilution, with the former being viewed as an unalloyed good and latter as bad.The Feedback LoopIn the real world, there are very few people who believe in absolute market efficiency, with even the strongest proponents of the idea accepting the fact that price can deviate from value for some or many companies. When this happens, and there is a gap between price and value, there is the potential for a feedback loop, where a company's pricing can affects its value. That loop can be either a virtuous one (where strong pricing for a company can push up its value) or a vicious one (where weak pricing for a company can push down value). There are three levels at which a gap between value and price can feed back into value:Perception: While nothing fundamentally has changed in the company, a rise (fall) in its stock price, makes bondholders/lenders more willing to slacken (tighten) constraints on the firm and increase (decrease) the chances of debt being renegotiated. It also affects the company's capacity to attract or repel new employees, with higher stock prices making a company a more attractive destination (especially with stock-based compensation thrown into the mix) and lower stock prices having the opposite effect.Implicit effects: When a company's stock price goes up or down, there can be tangible changes to the company's fundamentals. If a company has a significant amount of debt that is weighing it down, creating distress risk, and some of it is convertible, a surge in the stock price can result in debt being converted to equity on favorable terms (fewer shares being issued in return) and reduce default risk. Conversely, if the stock price drops, the conversion option in convertible debt will melt away, making it almost all debt, and pushing up debt as a percent of value. A surge or drop in stock prices can also affect a company's capacity to retain existing employees, especially when those employees have received large portions of their compensation in equity (options or restricted stock) in prior years. If stock prices rise (fall), both options and restricted stock will gain (lose) in value, and these employees are more (less) likely to stay on to collect on the proceeds. Explicit effects: If a company's stock price rises well above value, companies will be drawn to issue new shares at that price. While I will point out some of the limits of this strategy below, the logic is simple. Issuing shares at the higher price will bring in cash into the company and it will augment overall value per share, even though that augmentation is coming purely from the increase in cash. Companies can use the cash proceeds to pay down debt (reducing the distress likelihood) or even to change their business models, investing in new models or acquiring them. If a company's stock price falls below value, a different set of incentives kick in. If that company buys back shares at that stock price, the value per share of the remaining shares will increase. To do this, though, the company will need cash, which may require divestitures and shrinking the business model, not a bad outcome if the business has become a bad one.I have summarized all of these effects in the table below:

These effects will play out in different inputs into valuation, with the reduction in distress risk showing up in lower costs for debt and failure probabilities, the capacity to hire new and keep existing employees in higher operating margin, the issuance or buyback of shares in cash balances and changes in the parameters of the business model (growth, profitability). Looking at the explicit effect of being able to issue shares in the over valued company or buy back shares in the under valued one, there are limits that constrain their use:Regulations and legal restrictions: A share issuance by a company that is already public is a secondary offering, and while it is less involved than a primary offering (IPO), there are still regulatory requirements that take time and require SEC approval. Specifically, a company planning a secondary offering has to file a prospectus (S-3), listing out risks that the company faces, how many shares it plans to issue and what it plans to use the proceeds for. That process is not as time consuming or as arduous as it used to be, but it is not instantaneous; put simply, a company that sees its stock price go up 10-fold in a day won't be able to issue shares the next day.Demand, supply and momentum: If the price is set by demand and supply, increasing the supply of shares will cause price to drop, but the effect is much more insidious. To the extent that the demand for an over valued stock is driven by mood and momentum, the very act of issuing shares can alter momentum, magnifying the downward pressure on stock prices. Put simply, a company that sees it stock price quadruple that then rushes a stock issuance to the market may find that the act of issuing the shares, unless pre-planned, May itself cause the price rise to unravel.Value transfer, not value creation: Even if you get past the regulatory and demand/supply obstacles, and are able to issue the shares at the high price, it is important that you not operate under the delusion that you have created value in that stock issuance. The increase in value per share that you get comes from a value transfer, from the shareholders who buy the newly issued shares at too high a price to the existing shareholders in the company.Cash and trust: If you can live with the value transfer, there is one final hurdle. The new stock issuance will leave the company with a substantial cash balance, and if the company's business model is broken, there is a very real danger that managers, rather than follow finding productive ways to fix the model, will waste the cash trying to reinvent themselves.With buybacks, the benefits of buying shares back at below value are much touted, and Warren Buffett made this precept an explicit part of the Berkshire Hathaway buyback program, but buybacks face their own constraints. A large buyback may require a tender offer, with all of the costs and restrictions that come with them, the act of buying back stock may push the price up and beyond value. The value transfer in buybacks, if they occur at below fair value, also benefit existing shareholders, but the losers will be those shareholders who sold their shares back. Finally, a buyback funded with cash that a company could have used on productive investment opportunities is lost value for the company.
Reality Check
With that long lead in, we can address the question that many of those most upbeat about GameStop and AMC were asking last week. Can the largely successful effort, at least so far, in pushing up stock prices actually make GameStop or AMC a more valuable company? The answer is nuanced and it depends on the company:Perception: For the moment, the rise in the stock price has bought breathing room in both companies, as lenders back off, but that effect is likely to be transient. Perception alone cannot drive up value.Implicit effects: On this dimension, AMC has already derived tangible benefits, as $600 million in convertible debt will become equity, making the company far less distressed. For those Redditors primed for revenge against Wall Street, it is worth noting that the biggest beneficiary in this conversion is Silver Lake, a hedge fund that invested in these bonds in the dark days for the company. GameStop's debt is more conventional borrowing, and while bond prices have gone up, the benefits don't accrue as directly to the company.Explicit effects: On this dimension again, AMC is better positioned, having already filed a prospectus for a secondary offering on December 11, well ahead of the stock run-up. In that offering, AMC filed for approval for issuance of up to 178 million additional shares, from time to time, primarily to pay down debt. If the stock price stays elevated, and that is a big if, AMC will be able to issue shares at a price > value and increase its value per share. It is unclear whether GameStop has the time to even try to do this, especially if the stock price rise dissipates in days or weeks, rather than months.To incorporate the feedback loop, I had modified my base case GameStop valuation (not the best case that you saw in my last post), and allowed for two additional inputs: new shares issued and an issuance price. Note that the value per share that I get with no additional shares issued is $28.17, and you can see how that value per share changes, for different combinations of issuance share numbers and issuance share prices:

Note that if the issuance occurs at my estimate of intrinsic value of $28.17, the share issuance has no effect on value per share, since the increase in share count offsets the increased cash balance exactly. Even in the more upbeat scenarios, where the company is able to issue new shares at a price above this value, let's be clear that the game that is playing out is value transfer. To see this, take the most extreme scenario, where GameStop is able to issue 50 million new shares (increasing their share count from 65.1 million to 115.1 million) at a stock price of $200, viable perhaps on Friday (when the stock traded about $300) but not today, the value effect and transfer can be seen below:
The value transfer can be intuitively explained. If new shareholders pay well above value, that increment accrues to existing shareholders. Since the new shareholders are buying the shares voluntarily, you may be at peace with this transfer, but if these new shareholders are small individual investors drawn in by the frenzy, the entire notion of this price run-up being a blow for fairness and justice is undercut. Investing Endgames!The anger and sense of unfairness that animated many of those who were on the buying end of GameStop and AMC last week has roots in real greviances, especially among those who came of age in the midst or after the 2008 crisis. I understand that, but investing with the intent of hurting another group, no matter how merited you think that punishment is, has two problems. The first is that markets are fluid, with the winners and losers from an investing episode representing a quickly shifting coalition, The people who are helped and hurt are not always the people that you set out to help or hurt. The second is that if you truly want to punish a group that you think is deserving of punishment, you have to find a way to do damage to their investment models. Hurting some hedge funds, say the short sellers in GameStop, while helping others, like Silver Lake, will only cause investors in these funds to move their money from losing funds to winning funds. Thus, the best revenge you can have on funds is to see investors collectively pull their money out of funds, and that will happen if they under perform as a group.
YouTube Video
SpreadsheetValuation of GameStop (with Feedback loop for stock issues)Blog Posts on GameStopThe Storming of the Bastille: The Redditor Crowd traders the Hedge Funds!
January 29, 2021
The Storming of the Bastille: The Reddit Crowd targets the Hedge Funds!
I generally try to stay out of fights, especially when they become mud-wrestling contests, but the battle between the hedge funds and Reddit investors just too juicy to ignore. As you undoubtedly know, the last few days have been filled with news stories of how small investors, brought together on online forums, have not only pushed up the stock prices of the stocks that they have targeted (GameStop, AMC, BB etc.), but in the process, driven some of the hedge funds that have sold short on these companies to edge of oblivion. The story resonates because it has all of the elements of a David versus Goliath battle, and given the low esteem that many hold Wall Street in, it has led to sideline cheerleading. Of course, as with everything in life, this story has also acquired political undertones, as populists on all sides, have found a new cause. I don't have an axe to grind in this fight, since I don't own GameStop or care much about hedge funds, but I am interested in how this episode will affect overall markets and whether I need to change the ways in which I invest and trade.
Short Sales and Squeezes
I know that you want to get to the GameStop story quickly, but at the risk of boring or perhaps even insulting you, I want to lay the groundwork by talking about the mechanics of a short sale as well as how short sellers can sometimes get squeezed. When most of look at investing, we think of stocks that we believe (based upon research, instinct or innuendo) will go up in value and buying those stocks; in investing parlance, if you do this, you have a "long" position. For those of you tempted to put all of Wall Street into one basket, it is worth noting that the biggest segment of professional money management still remains the mutual fund business, and mutual funds are almost all restricted to long only positions. But what if you think a stock is too highly priced and is likely to go down? If you already own the stock, you can sell it, but if you don't have a position in the stock and want to monetize your pessimistic point of view, you can borrow shares in the stock and sell them, with an obligation to return the shares at a specified point in time in the future. This is a “short” sale, and if you are right and the stock price drops, you can buy the shares at the now "discounted" price, return them to the original owner and keep the difference as your profit.
Short sellers have never been popular in markets, and that dislike is widely spread, not just among small investors, but also among corporate CEOs, and many institutional investors. In fact, this dislike shows up not only in restrictions on short selling in some markets, but outright bans in others, especially during periods of turmoil. I don't believe that there is anything inherently immoral about being a pessimist on markets, and that short selling serves a purpose in well-functioning markets, as a counter balance to relentless and sometimes baseless optimism. In fact, mathematically, all that you do in a short sale, relative to a conventional investment, is reverse the sequence of your actions, selling first and buying back later.
It is true that short sellers face a problem that their long counterparts generally do not, and that is they have far less control over their time horizons. While you may be able to sell short on a very liquid, widely traded stock for a longer period, on most stocks, your short sale comes with a clock that is ticking from the moment you initiate your short sale. Consequently, short sellers often try to speed the process along, going public with their reasons for why the stock is destined to fall, and they sometimes step over the line, orchestrating concerted attempts to create panic selling. While short sellers wait for the correction, they face multiple threats, some coming from shifts in fundamentals (the company reporting better earnings than expected or getting a cash infusion) and some from investors with a contrary view on the stock, buying the stock and pushing the stock price up. Since short sellers have potentially unlimited losses, these stock price increases may force them to buy back shares in the market to cover their short position, in the process pushing prices up even more. In a short squeeze, this cycle speeds up to the point that short sellers have no choice but to exit the position.
Short squeezes have a long history on Wall Street. In 1862, Cornelius Vanderbilt squeezed out short sellers in Harlem Railroad, and used his power to gain full control of the New York railroad business. During the 20th century, short sales ebbed and flowed over the decades, but lest you fall into the trap of believing that this is a purely US phenomenon, the short sale with the largest dollar consequences was the one on Volkswagen in 2008, when Porsche bought enough shares in Volkswagen to squeeze short sellers in the stock, and briefly made Volkswagen the highest market cap company in the world. Until this decade, though, most short squeezes were initiated and carried through by large investors on the other side of short sellers, with enough resources to force capitulation. In the last ten years, the game has changed, for a number of reasons that I will talk about later in this post, but the company where this changed dynamic has played out most effectively has been Tesla. In the last decade, Tesla has been at the center of a tussle between two polarized groups, one that believes that the stock is a scam and worth nothing, and the other that is convinced that this is the next multi-trillion dollar company. Those divergent viewpoints have led to the former to sell short on the stock, making Tesla one of the most widely shorted stocks of all time, and the latter buying on dips. There have been at least three and perhaps as many as five short squeezes on Tesla, with the most recent one occurring at the start of 2020. With Tesla, individual investors who adore the company have been at the front lines in squeezing short sellers, but they have had help from institutional investors who are also either true believers in the company, or are too greedy not to jump on the bandwagon.
The Story (so far)
This story is still evolving, but the best way to see it is to pick one company, GameStop, and see how it became the center of a feeding frenzy. Note that much of what I say about GameStop could be said about AMC and BB, two other companies targeted in the most recent frenzy.
A Brief History
GameStop is a familiar presence in many malls in the United States, selling computer gaming equipment and games, and it built a business model around the growth of the gaming business. That business model ran into a wall a few years ago, as online retailing and gaming pulled its mostly young customers away, causing growth to stagnate and margins to drop, as you can see in this graph of the company’s operating history:
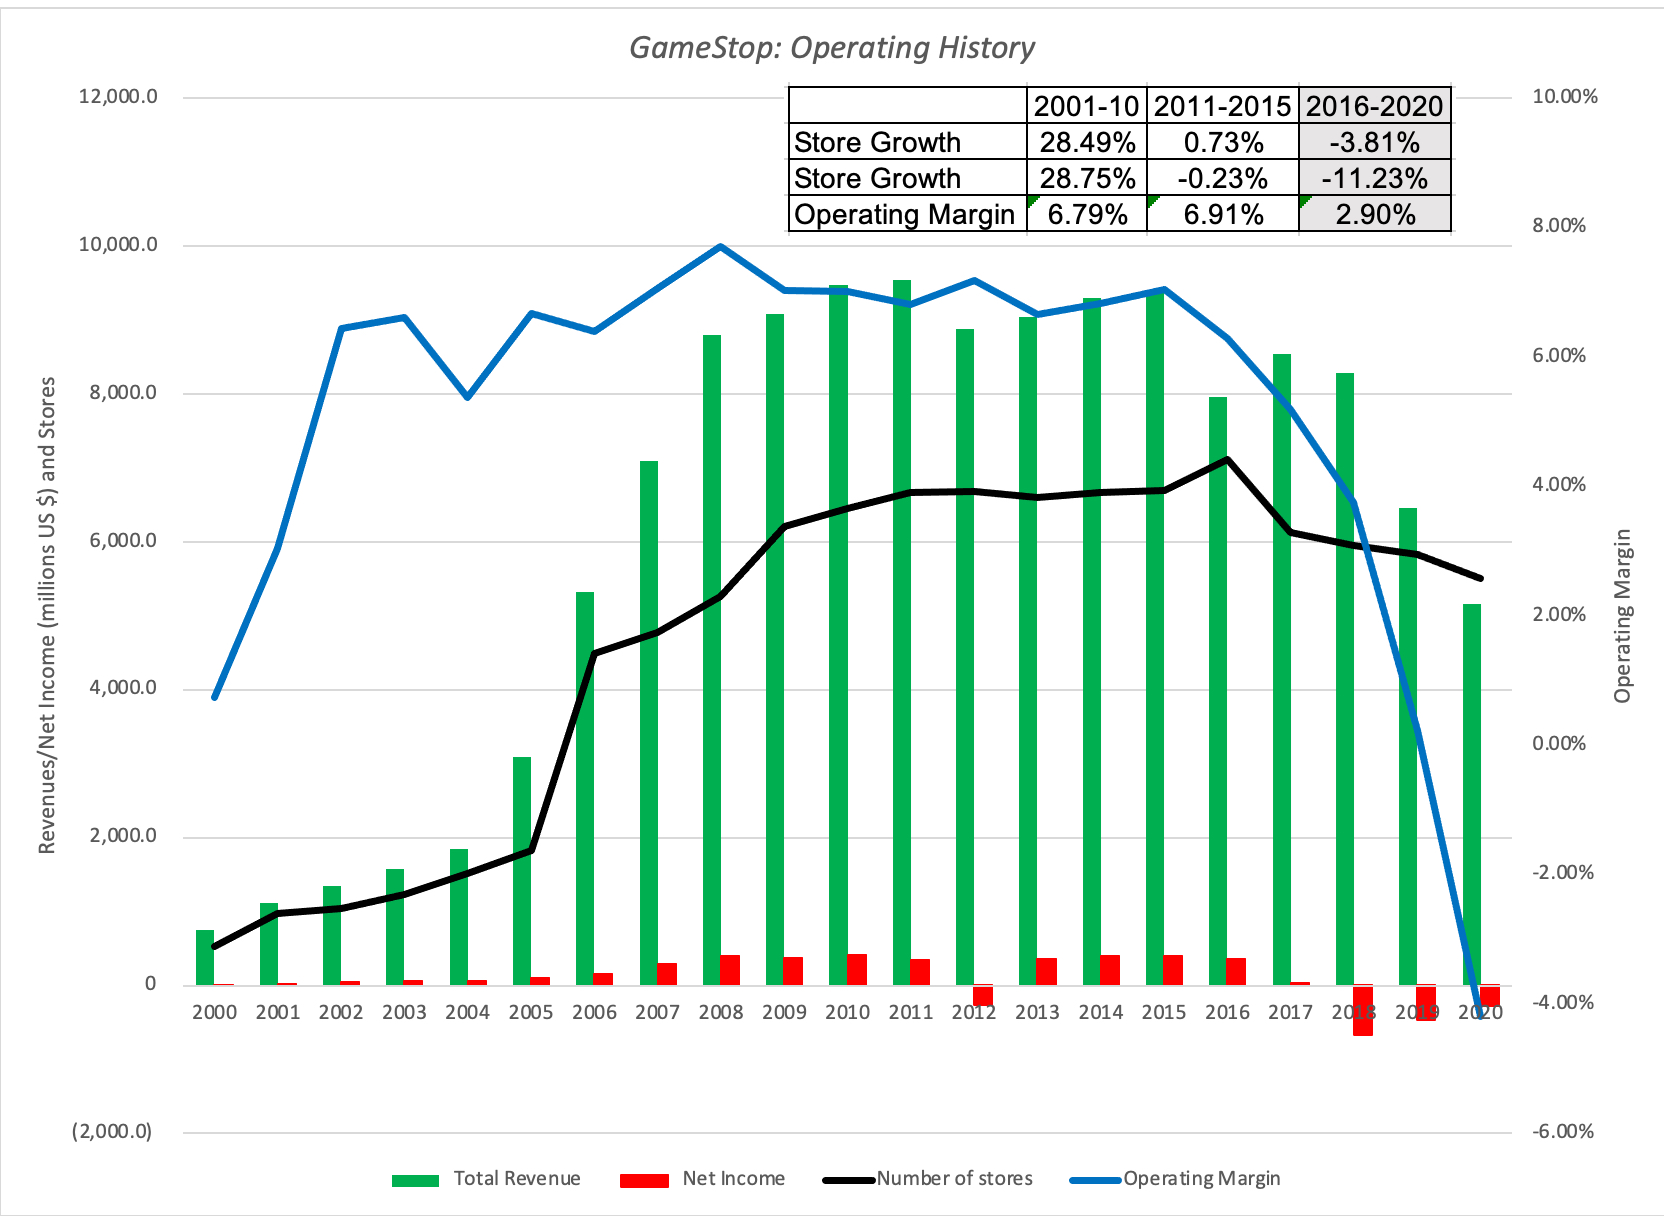
Leading into 2020, the company was already facing headwinds, with declining store count and revenues, and lower operating margins; the company reported net losses in 2018 and 2019.
The COVID Effect
In 2020, the company, like most other brick and mortar companies, faced an existential crisis. As the shutdown put their stores out of business, the debt and lease payments that are par for the course for any brick-and-mortar retailer threatened to push them into financial distress. The stock prices for the company reflected those fears, as you can see in this graph (showing prices from 2015 through the start of 2021):

Looking at the graph, you can see that if GameStop is a train wreck, it is one in slow motion, as stock prices have slid every year since 2015, with the added pain of rumored bankruptcy in 2019 and 2020.
A Ripe Target and the Push Back
While mutual funds are often constrained to be hold only long positions, hedge funds have the capacity to play both sides of the game, though some are more active on the short side than others. While short sellers target over priced firms, adding distress to the mix sweetens the pot, since drops in stock prices can put them into death spirals. The possibility of distress at GameStop loomed large enough that hedge funds entered the fray, as can be seen in the rising percentage of shares held by short sellers in 2020:

Note that short seller interest in GameStop first picked up in 2019, and then steadily built up in 2020. Even prior to the Reddit buy in, there were clearly buyers who felt strongly enough to to push back against the short sellers, since stock prices posted a healthy increase in the last few months of 2019. To show you how quickly this game has shifted, Andrew Left, one of the short sellers, put out a thesis on January 21, where he argued that GameStop was in terminal decline, and going to zero. While his intent may have been to counter what many believed was a short squeeze on the stock in the prior two days, it backfired by drawing attention to the squeeze and drawing in more buyers. That effect can be seen in the stock price movements and trading volume in the last few days:

This surge in stock prices was catastrophic for short sellers, many of whom closed out (or tried to close out) their short positions, in the process pushing up prices even more. Melvin Capital and Citron, two of the highest profile names on the short selling list, both claimed to have fully exited their positions in the last few days, albeit with huge losses. On January 27 and 28, regulators and trading platforms acted to curb trading on GameStop, ostensibly to bring stability back to markets, but traders were convinced that the establishment was changing the rules of the game to keep them from winning. GameStop, which had traded briefly at over $500/share was trading at about $240 at the time this post was written.
A Value Play?
When you have a pure trading play, as GameStop has become over the last few weeks, value does not even come into play, but there are investors, who pre-date the Redditors, who took counter positions against the short sellers, because they believed that the value of the company was higher. At the risk of ridicule, I will value the company, assuming the most upbeat story that I can think of, at least at the moment:
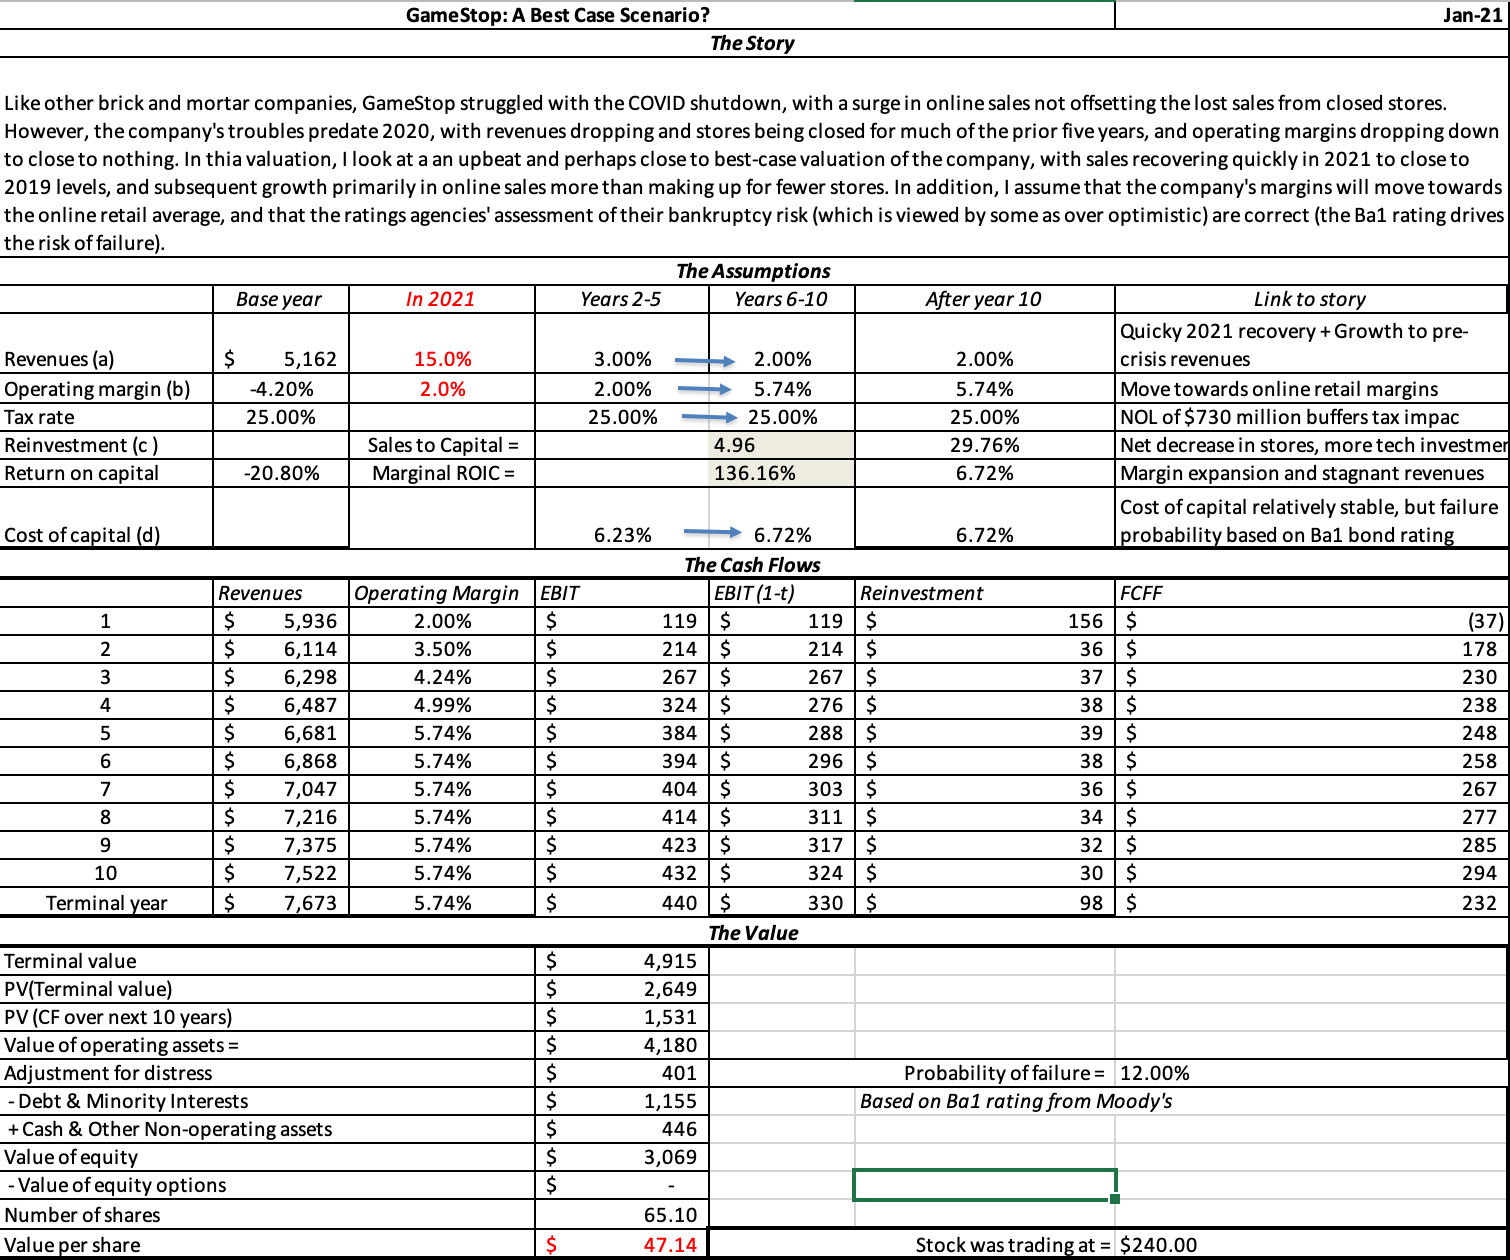
Note that this valuation is an optimistic one, assuming that probability of failure remains low, and that GameStop makes it way back to find a market in a post-COVID world, while also improving its margins to online retail levels. If you believe this valuation, you would have been a strong buyer of GameStop for much of last year, since it traded well below my $47 estimate. After the spectacular price run up in the last two weeks, though, there is no valuation justification left. To see why, take a look at how much the value per share changes as you change your assumptions about revenues and operating margins, the two key drivers of value.

Even if GameStop is able to more than double its revenues over the next decade, which would require growth in revenues of 15% a year for the next five years, and improve its margins to 12.5%, a supreme reach for a company that has never earned double digit margins over its lifetime, the value per share is about half the current stock price. Put simply, there is no plausible story that can be told about GameStop that could justify paying a $100 price, let alone $300 or $500.
The Backstory
To put the GameStop trading frenzy in perspective, let's start with the recognition that markets are not magical mechanisms, but represent aggregations of human beings making investment judgments, some buying and some selling, for a variety of reasons, ranging from the absurd to the profound. It should therefore not come as a surprise that the forces playing out in other aspects of human behavior find their way into markets. In particular, there are three broad trends from the last decade at play here:
A loss of faith in experts (economic, scientific, financial, government): During the 20th century, advances in education, and increasing specialization created expert classes in almost every aspect of human activity, from science to government to finance/economics. For the most part, we assumed that their superior knowledge and experience equipped them to take the right actions, and with our limited access to information, we often were kept in the dark, when they were wrong. That pact has been shattered by a combination of arrogance on the part of experts and catastrophic policy failures, with the 2008 banking crisis acting as a wake up call. In the years since, we have seen this loss of faith play out in economics, politics and even health, with expert opinion being cast aside, ignored or ridiculed. An unquestioning worship of crowd wisdom, combined with an empowering of crowds: In conjunction, we have also seen the rise of big data and the elevation of "crowd" judgments over expert opinions, and it shows up in our life choices. We pick the restaurants we eat at, based on Yelp reviews, the movies we watch on Rotten Tomatoes and the items we buy on customer reviews. Social media has made it easier to get crowd input (online), and precipitate crowd actions.A conversion of disagreements in every arena into the personal and the political: While we can continue to debate the reasons, it remains inarguable that public discourse has coarsened, with the almost every debate, no matter in what realm, becoming personal and political. I can attest to that from just my personal experiences, especially when I post on what I call "third rail" topics, specifically Tesla and Bitcoin, in the last few years. As I look at the GameStop episode play out, I see all three of these at play. One reason that the Redditors targeted GameStop is because they viewed hedge funds as part of the "expert" class, and consequently incapable of getting things right. They have used social media platforms to gather and reinforce each others' views, right or wrong, and then act in concert quickly and with extraordinary efficiency, to move stock prices. Finally, even a casual perusal of the comments on the Reddit thread exposes how much of this is personal, with far more comments about how this would teach hedge funds and Wall Street a lesson than there were about GameStop the company.The End GameI am a realist and if you are one of those who bought GameStop or AMC in recent days, I know that there is only a small chance that you will be reading this post, since I am probably too old (my four children remind me of that every day), too establishment (I have been teaching investing and valuation for 40 years) and too expert to be worth listening to. I accept that, though if you are familiar with my history, you should know that I have been harsh on how investing gets practiced in hedge funds, investment banks and even Omaha. The difference, I think, between our views is that many of you seem to believe that hedge funds (and other Wall Streeters) have been winning the investment sweepstakes, at your expense, and I believe that they are much too incompetent to do so. In my view, many hedge funds are run by people who bring little to the investment table, other than bluster, and charge their investors obscene amounts as fees, while delivering sub-standard results, and it is the fees that make hedge fund managers rich, not their performance. It is for that reason that I have spent my lifetime trying to disrupt the banking and money management business by giving away the data and the tools you need to do both for free, as well as pretty much everything I know (which is admittedly only a small subset) about investing in my classes. My sympathies lie with you, but I wonder what your end game is, and rather than pre-judge you, I will offer you the four choices: GameStop is a good investment: That may be a viable path, if you bought GameStop at $40 or $50, but not if you paid $200 or $300 a share. At those prices, I don’t see how you get value for your money, but that may reflect a failure of my imagination, and I encourage you to download my spreadsheet and make your own judgments.GameStop remains a good trade: You may believe that given your numbers (as individual investors), you can sell the stock to someone else at a higher price, but to whom? You may get lucky and be able to exit before everyone else tries to, but the risk that you will be caught in a stampede is high, as everyone tries to rush the exit doors at the same time. In fact, the constant repetition of the mantra that you need to hold to meet a bigger cause (teach Wall Street a lesson) should give you pause, since it is buying time for others (who may be the ones lecturing you) to exit the stock. I hope that I am wrong, but I think that the most likely end game here is that AMC, GameStop and Blackberry will give back all of the gains that they have had from your intervention and return to pre-action prices sooner rather than later.Teach hedge funds and Wall Street a lesson: I won't patronize you by telling you either that I understand your anger or that you should not be angry. That said, driving a few hedge funds out of business will do little to change the overall business, since other funds will fill the void. If this is your primary reason, though, just remember that the money you are investing in GameStop is more donation to a cause, than an investment. If you are investing tuition money, mortgage savings or your pension fund in GameStop and AMC, you are impoverishing yourself, trying to deliver a message that may or may not register. The biggest threat to hedge funds does not come from Reddit investor groups or regulators, but from a combination of obscene fee structures and mediocre performance. Play savior: It is possible that your end game was selfless, and that you were trying to save AMC and GameStop as companies, but if that was the case, how has any of what’s happened in the last two weeks help these companies? Their stock prices may have soared, but their financial positions are just as precarious as they were two weeks ago. If your response is that they can try to issue shares at the higher prices, I think of the odds of being able to do this successfully are low for two reasons. The first is that planning a new share issuance takes time, requiring SEC filings and approval. The second is that the very act of trying to issue new shares at the higher price may deflate that price. In a perverse way, you might have made it more difficult for GameStop and AMC to find a pathway to survive as parts of larger companies, by pushing up stock prices, and making them more expensive as targets.If you are in this game, at least be clear with yourself on what your end game is and protect yourself, because no one else will. The crowds that stormed the Bastille for the French Revolution burned the prison and killed the governor, but once done, they turned on each other. Watch your enemies (and I know that you include regulators and trading platforms in here), but watch your friends even more closely!
Market LessonsIf you are not a hedge fund that sold short on the targeted stocks, or a trader who bought in on other side, are there any consequences for you, from this episode? I do think that we sometimes read too much into market events and episodes, but this short period has some lessons.Flattening of the Investment World: Borrowing a term from Tom Friedman, I believe that the investment world has flattened over the last few decades, as access to data and powerful tools widens, and trading eases. It should come as no surprise then that portfolio managers and market gurus are discovering that they no longer are the arbiters of whether markets are cheap or expensive, and that their path of least resistance might come from following what individual investors do, rather than lead them. In a prior post, I pointed to this as one reason why risk capital stayed in the game in 2020, confounding many long-term market watchers, who expected it to flee. Emptiness of Investment Expertise: Professional money management has always sold its wares (mutual funds, hedge funds, investment advice) as the products of deep thinking and serious analysis, and as long as the processes stayed opaque and information was scanty, they were able to preserve the delusion. In the last few decades, as we have stripped away the layers, we have discovered how little there is under the surface. The hand wringing on the part of money managers about the momentum trading and absence of attention to fundamentals on the part of Redditors strikes me as hypocritical, since many of these money managers are themselves momentum players, whose idea of fundamentals is looking at trailing earnings. My prediction is that this episode and others like it will accelerate the shift from active to passive investing, especially on the part of investors who are paying hefty fees, and receiving little in return.Value ≠ Price: I won’t bore you again with my distinction between value and price, but it stands me in good stead during periods like this one. During the last week, I have been asked many times how I plan to change the way I value companies, as a result of the GameStop story, and my answer is that I don’t. That is not because I am stuck in my ways, but because almost everything that is being talked about (the rising power of the individual investors, the ease of trading on apps like Robinhood, the power of social media investing forums to create crowds) are factors that drive price, not value. It does mean that increasing access to data and easing trading may have the perverse effect of causing price to vary more, relative to value, and for longer periods. My advice, if you are an investor who believes in fundamentals, is that you accept this as the new reality and not drive yourself in a frenzy because you cannot explain what other people are paying for Tesla, Airbnb or Zoom.In the next few weeks, I predict that we will hear talk of regulatory changes intended to protect investors from their own excesses. If the regulators have their way, it will get more difficult to trade options and borrow money to buy shares, and I have mixed feelings about the efficacy of these restrictions. I understand the motivation for this talk, but I think that the best lessons that you learn about risk come from taking too much or the wrong risks, and then suffering the consequences.
YouTube Video
SpreadsheetValuation of GameStop (January 28, 2021)
January 27, 2021
Data Update 3 for 2021: Currencies, Commodities, Collectibles and Cryptos
In my last post, I described the wild ride that the price of risk took in 2020, with equity risk premiums and default spreads initially sky rocketing, as the virus led to global economic shutdowns, and then just as abruptly dropping back to pre-crisis levels over the course of the year. As stock and bond markets went through these gyrations, it should come as no surprise that the same forces were playing out in other markets as well. In this post, I will take a look at these other markets, starting with a way of dividing investments into assets, commodities, currencies and collectibles that I find useful in thinking about what I can (and cannot) do in those markets, and then reviewing how these markets performed during 2020. As I do this, there is no way that I can evade discussing Bitcoin and other crypto assets, which continued to draw disproportionate (relative to their actual standing in markets) attention during the year, and talking about what 2020 taught us about them.
Investments: Classifications and Consequences
In a 2017 post, focused on bitcoin, I argued that all investments can be categorized into one of four groups, assets, commodities, currencies and collectibles, and the differences across these group are central to understanding why pricing is different from value, and what sets investing apart from trading.
The Divide: Assets, Commodities, Currencies and Collectibles
If you define an investment as anything that you can buy and hold, with the intent of making money, every investment has to fall into at least one of these groupings:
Assets: An asset has expected cash flows that can either be contractually set (as they are with loans or bonds), residual (as is the case with an equity investment in a business or shares in a publicly traded company) or even conditional on an event occurring (options and warrants). Commodities: A commodity derives its value from being an input into a process to produce a item (product or service) that consumers need or want. Thus, agricultural products like wheat and soybeans are commodities, as are industrial commodities like iron ore and copper, and energy-linked commodities like oil and natural gas. Currencies: A currency serves three functions. It is a measure of value (used to tell you how much a product or service costs), a medium of exchange (facilitating the buying and selling of products and services) and a store of value (allowing people to save to meet future needs). While we tend to think of fiat currencies like this Euro, the US dollar or the Indian rupee, the use of currency pre-dates governments, and human beings have used everything from seashells to rocks as currency.Collectibles: A collectible's pricing comes from the perception that it has value, driven by tastes (artwork) and/or scarcity (rare items). There are a range of items that fall into this grouping from fine art to sports memorabilia to precious metals.While most investments fall into one of these buckets, there are some that can span two or more, and you have to decide which one dominates. Take gold, for instance, whose ductility and malleability makes it a prized commodity to jewelers and electronics makers, but whose scarcity and indestructibility (almost) make it even more attractive as a currency or a collectible, With bitcoin, even its most ardent promoters seem to be divided on whether the end game is to create a currency or a collectible, a debate that we will revisit at the end of this post.Price versus ValueThe classification of investments is key to understanding a second divide, one that I have repeatedly returned to in my posts, between value and price.

If the value of an investment is a function of its cashflows and the risk in those cash flows, it follows that only assets can be valued. Though commodities can sometimes be roughly valued with macro estimates of demand and supply, they are far more likely to be priced. Currencies and collectible can only be priced, and the determinants of their pricing will vary:Commodity Pricing: With commodities, the pricing will be determined by two factors. The first is the demand for and supply of the commodity, given its usage, with shocks to either causing price to change. Thus, it should come as no surprise that the oil embargo in the 1970s caused oil prices to surge and freezing weather in Florida resulted in higher prices for orange juice. The second is storability, with storage costs ranging from minimal with some commodities to prohibitive for others. In general, storable commodities provide buyers with the option of buying when prices are low, and storing the commodity, and for that reason, futures prices of storable commodities are tied to spot prices and storage costs.Currency Pricing: Currencies are priced against each other, with the prices taking the form of "exchange rates". In the long term, that pricing will be a function of how good a currency is as a medium of exchange and a store of value, with better performing currencies gaining at the expense of worse performing ones. On the first dimension (medium of exchange) currencies that are freely exchangeable (or even usable) anywhere in the world (like the US dollar, the Euro and the Yen) will be priced higher than currencies that do not have that reach (like the Indian rupee or the Peruvian Sul). On the second (store of value), it is inflation that separates good from bad currencies, with currencies with low inflation (like the Swiss franc) gaining at the expense of currencies with higher inflation (like the Zambian kwacha). Collectible Pricing: Most collectibles are pure plays on demand and supply, with no fundamentals driving the price, other than scarcity and desirability, real or perceived. Paintings by Picasso, Monet or Van Gogh are bought and sold for millions, because there are collectors and art lovers who see them as special works of art, and their supply is limited. Adding to the allure (and pricing) of collectibles is their longevity, reflected in their continuous hold on investor consciousness. It should come as no surprise that gold's, because it brings together all three characteristics; it's scarcity comes from nature, its desirability comes from in many forms and it has been used and valued for thousands of years.I capture these differences in the table below:
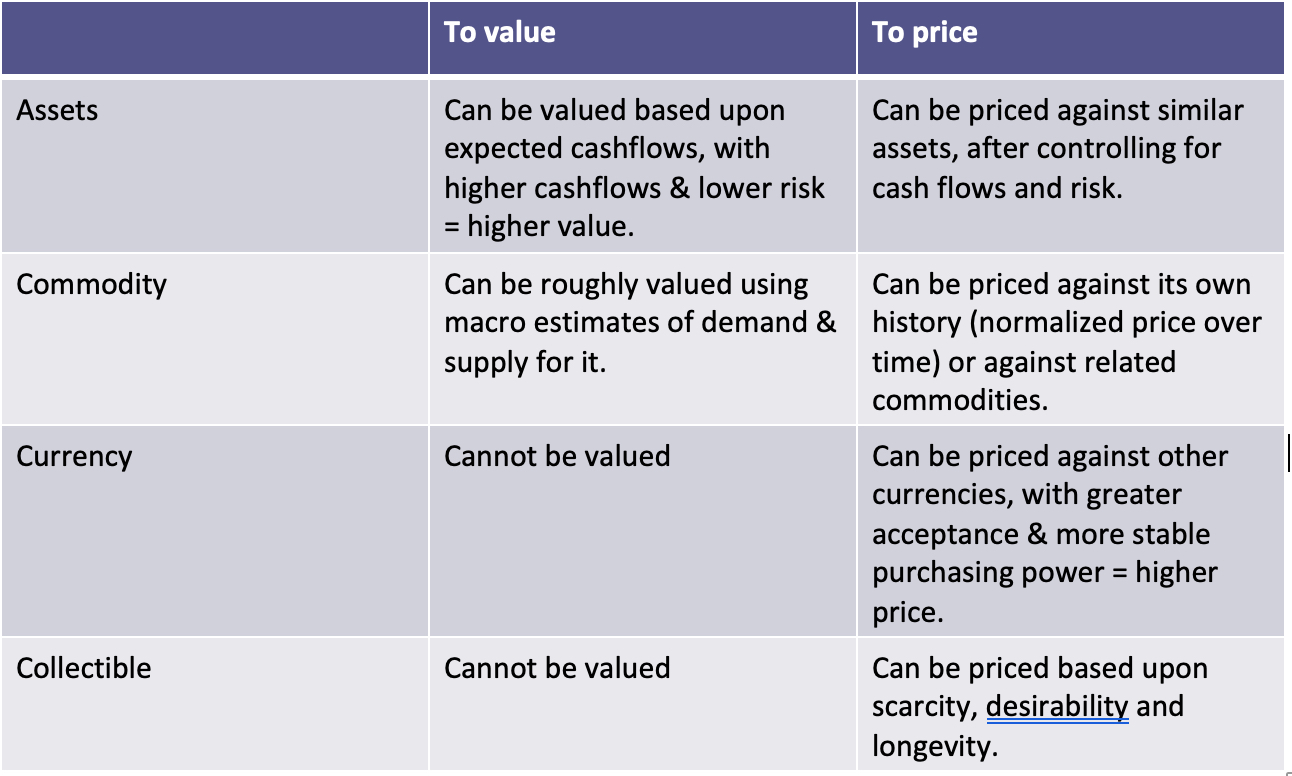 In short, assets can be both priced and value, commodities can be roughly valued but are mostly priced and currencies and collectibles can only be priced.
Investing versus TradingThe essence of investing is assessing value, and buying assets that trade at prices below that value, and selling assets that trade at more. Trading is far simpler and less pretentious, where successful trading requires one thing and one thing only, buying at a low price and selling at a higher one. If you agree with those definitions, it then follows that you can invest only in assets (stocks, bonds, businesses, rental properties) and that you can only trade commodities, currencies and collectibles. Drawing on a table that I have used in prior posts (and I apologize for reusing it), here is my contrast between investing and trading:
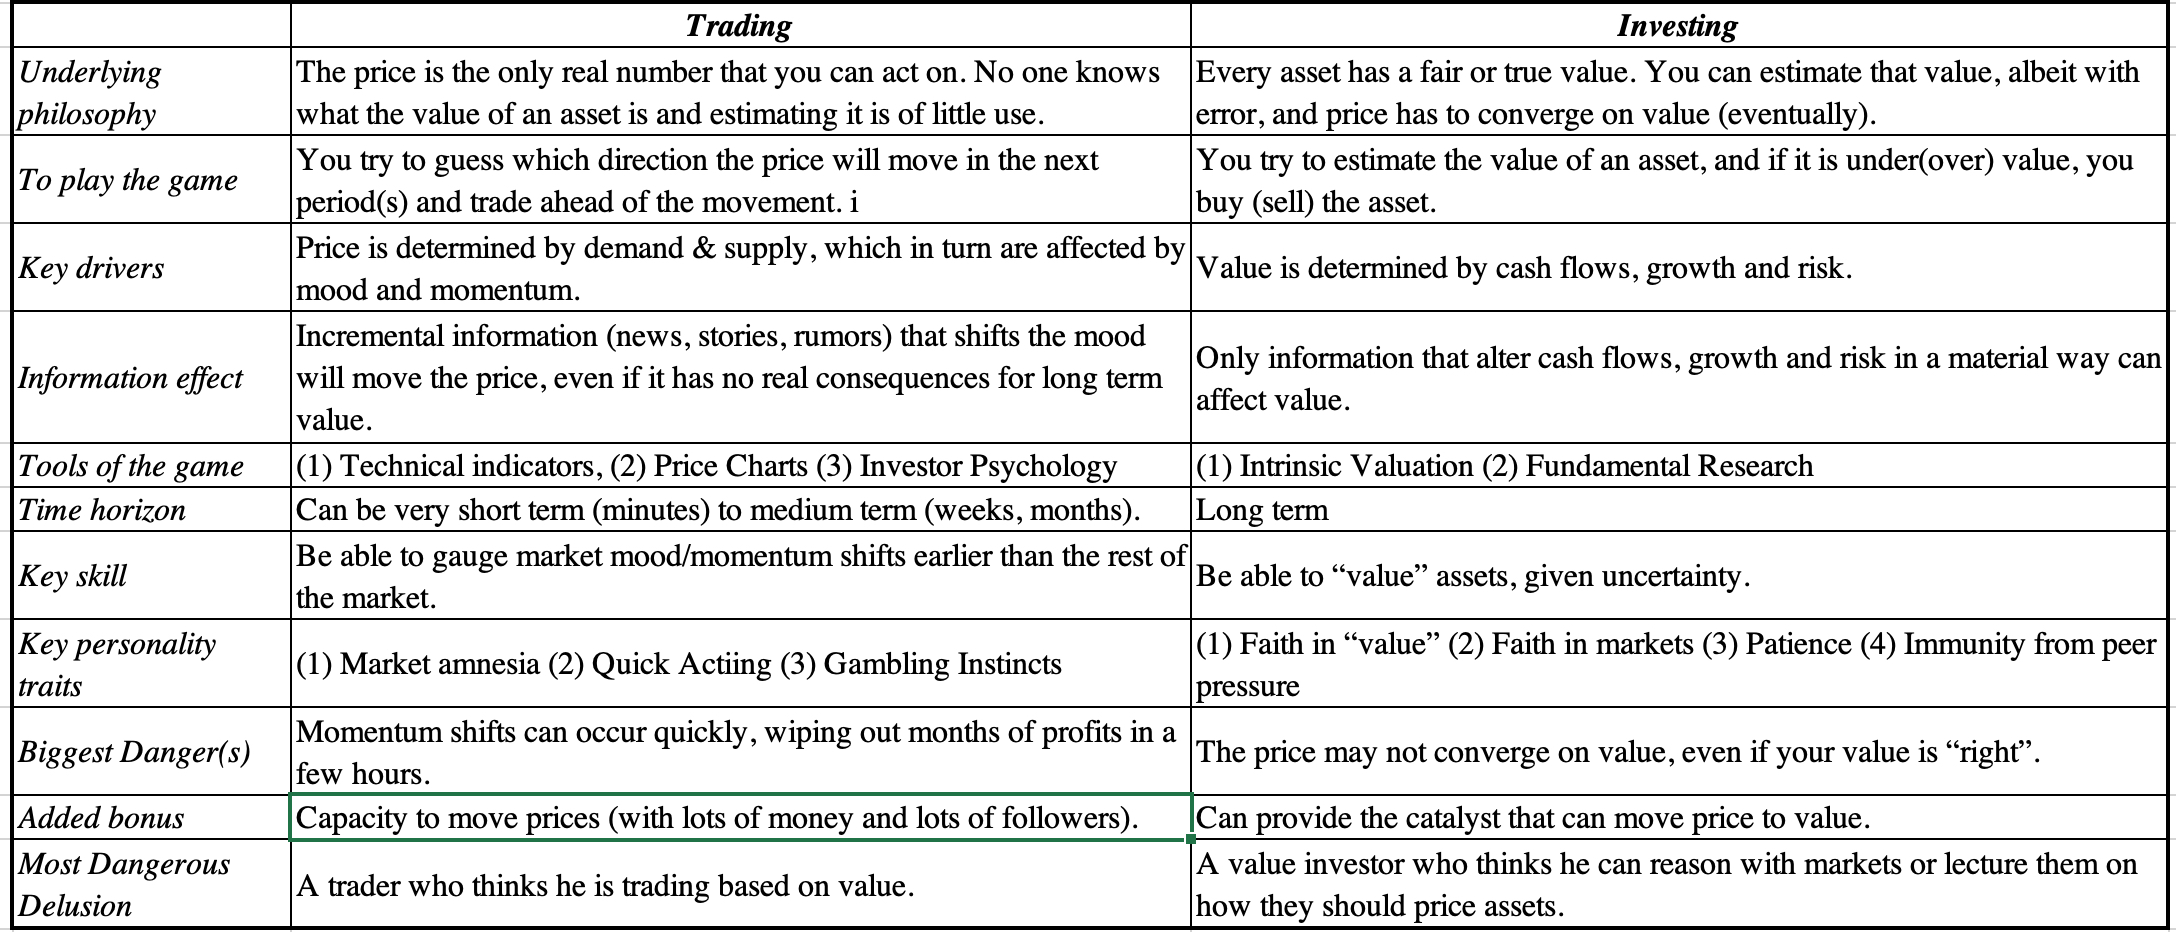
Note that I am not passing judgment on either, since your end game is to make money, whether you are an investor or a trader, and the fact that you made money following the precepts of value investing and did fundamental analysis does not make you better or more worthy than your neighbor who made the same amount of money, buying and selling based upon price and volume indicators.
Commodities
With that lengthly lead in, let's look at what 2020 brought as surprises to the commodity market. As the virus caused a global economic shut down, there were severe disruptions to the demand for some commodities, as usage decreased, and to the supply of others, as production facilities and supply chains broke down. During the course of 2020, I kept track continuously of two commodities, copper and oil, both economically sensitive, and widely traded.
 Federal Reserve Database (FRED)
Note that the ups and downs of oil and copper not only follow the same time pattern, but closely resemble what stocks were doing over the same periods, but the changes are more exaggerated (up and down) with oil than with copper. Both oil and copper dropped during the peak crisis weeks (February 14 through March 23, 2020), but while copper not only recouped its losses and was up almost 26% over the course of the year, oil remains more than 20% below the start-of-the-year numbers. Note also the odd phenomenon on April 20, where West Texas crude prices dropped below zero, as traders panicked about running out of storage space for oil in the US.
Expanding more broadly and looking at a basket of commodities, we can trace out the same effects. In the graph below, I look at three commodity indices, the S&P World Commodity Index (WCI), which is a production-weighted index of commodity futures, the S&P GSCI Index, an investable version that includes the most liquid commodity futures, and the S&P GSCI Agricultural Index, a weighted average of agricultural commodity futures.
 S&P Index Data
The broad commodity indices (WCI and GSCI) saw significant drops between February 14 and March 23, and recoveries in the months after, mirroring the oil and copper price movements. Agricultural commodity futures were far less affected by the crisis, with only a small drop during the crisis weeks, and delivered the best overall performance for the year.
Currencies
In a year during which financial markets had wild swings, and commodity prices followed, it should come as no surprise that currency markets also went through turbulence. In the graph below, I look at the movements of a select set of currencies over 2020, all scaled to the US dollar to allow for comparability:
 Federal Reserve Data (FRED)
The dollar strengthened against all of the currencies between February 14 and March 23, but over the course of the year, it depreciated against the Euro, Yen and the Yuan, was mostly flat against the British pound and Indian rupee and gained significantly against the Brazilian Real. Looking at the US dollar’s movements more broadly, you can see the effects of 2020 by looking at the Us movement relative to developed market and emerging market currencies in the graph below:
 Federal Reserve Data (FRED)
In the crisis weeks (2/14 to 3/23), the US dollar gained against other currencies, but more so against emerging market currencies than developed markets ones. In the months afterwards, it gave back those gains to end the year flat against emerging market currencies and down about 5.5% against developed market currencies.
Collectibles
During crises, collectibles often see increased demand, as fear about the future and a loss of faith in institutions (central banks, governments) leads people to see refuge in investments that they believe will outlast the crisis. Given the history of gold and silver as crisis assets, I start by looking at gold and silver prices in 2020;
 Federal Reserve Data (FRED)
Both gold and silver had strong years, with gold up 24.17% and silver up 46.77% during the year, but gold played the role of crisis asset better, with its price dropping only 5.19% in the crisis weeks from February 14 to March 23, beating out almost every other asset class in performance during the period. Silver dropped by 29.34% during that same period, but while its subsequent rise more than made up for that drop, on the narrow measure of crisis asset, it did not perform as well as gold.
The year (2020) had mixed effects on other collectible markets. Fine art, for itself, built around in-person auctions of expensive art works saw sales plummet in the early months of 2020, as shutdowns kicked in, but saw a surge of online auctions towards the end of the year. Notwithstanding this development, overall sales of art dropped in 2020, and transactions decreased, especially in the highest-priced segments.
Cryptos
It would be impossible to complete this post without talking about bitcoin, which as it has for much of the decade, continued to dominate discussions of markets and investments. Looking at this graph of bitcoin since its inception, you can see its meteoric rise:

There are clearly many who have been enriched during this rise, and quite a few who have lost their shirts, but any discussion of bitcoin evokes more passion than reason. There are some who believe so intensely in bitcoin that any critique or viewpoint that is contrary to theirs evokes an almost hysterical overreaction. On the other hand, there are others who view bitcoin as speculation run amok, with the end game destined to be painful. At the risk of provoking both sides, I want to start with a fundamental question of whether bitcoin is an asset, a commodity, a currency or a collectible. Even among its strongest supporters, there seems to be no consensus, with the biggest split being between those who argue that it will become a dominant currency, replacing fiat currencies in some markets, and supplementing them in others, and those who claim that it is a gold-like collectible, deriving its pricing from crises and loss of faith in fiat currencies. You could argue that this divide has existed from its creation in 2008, both in terminology (you mine for bitcoin, just as you do for gold) and in its design (an absolute limit on its numbers, creating scarcity). There are even some who believe that the block chain technology that is at the heart of bitcoin can make it a commodity, with the price rising, as block chains find their place in different parts of the economy. Here is my personal take:
Bitcoin is not an asset. I know that you can create securities denominated in bitcoin that have contractual or residual cash flows, but if you do so, it is not bitcoin that is the asset, but the underlying contractual claim. Put simply, when you buy a dollar or euro denominated bond, it is the bond that is the asset, not the currency of denomination.Bitcoin is not a commodity. It is true that block chains are finding their way into different segments of the economy and that the demand for block chains may grow exponentially, but bitcoin does not have a proprietary claim to block chain technology. In fact, you can utilize block chains with fiat currencies or other crypto currencies, and many do. There are some cryptos, like ethereum, that are designed to work much better with block chains, and with those crypto currencies, there is a commodity argument that can be made.Bitcoin is a currency, but it is not a very good one (at least at the moment): Every year, since its inception, we have been told that Bitcoin is on the verge of a breakthrough, where sellers of products and services will accept it as payment for goods and services, but twelve years after its creation, its acceptance remains narrow and limited. There are simple reasons why it has not acquired wider acceptance. First, if the essence of a currency is that you want transactions to occur quickly and at low cost, bitcoin is inefficient, with transactions times and costs remaining high. Second, the wild volatility that makes it such a desirable target for speculative trading makes both buyers and sellers more reluctant to use it in transactions, the former because they are afraid that they will miss out on a price run up and the latter because they may be accepting it, just before a price drop. Third, a currency with an absolute limit in numbers is one that is destined for deflation in steady state, in economies with real growth. I know that stories about the Silk Road have enshrined the mythology of bitcoin being the currency of choice for illegal activities, but a currency designed purely for evasion (of crime and taxes) is destined to be a niche currency that will be under assault from governments and law enforcement.Bitcoin is a collectible, but with a question mark on longevity: I have described Bitcoin as millennial gold, and you could argue that, at least for some young people, holding bitcoin resonates more than holding gold. They may be right in their choice, but there are two issues that they need to confront. The first is that while bitcoin’s allure is that it has limits on quantity, that assumes that it has no substitutes. If other cryptos can operate as substitutes, even imperfect ones, there is no limit on quantity, since you can keep creating new variants. The second is whether the desirability of bitcoin will endure, since much of that desirability right now is built on its past price performance. In other words, if traders move on from bitcoin to some other speculative investment, and bitcoin prices stagnate or drop, will traders continue to hold it? In Bitcoin's favor, it has been able to make it through prior downturns, and not only survive but come back stronger, but the question still remains.Looking at how Bitcoin did in 2020 can give us insight into its future. In the graph below, I look at Bitcoin and Ethereum prices through the year: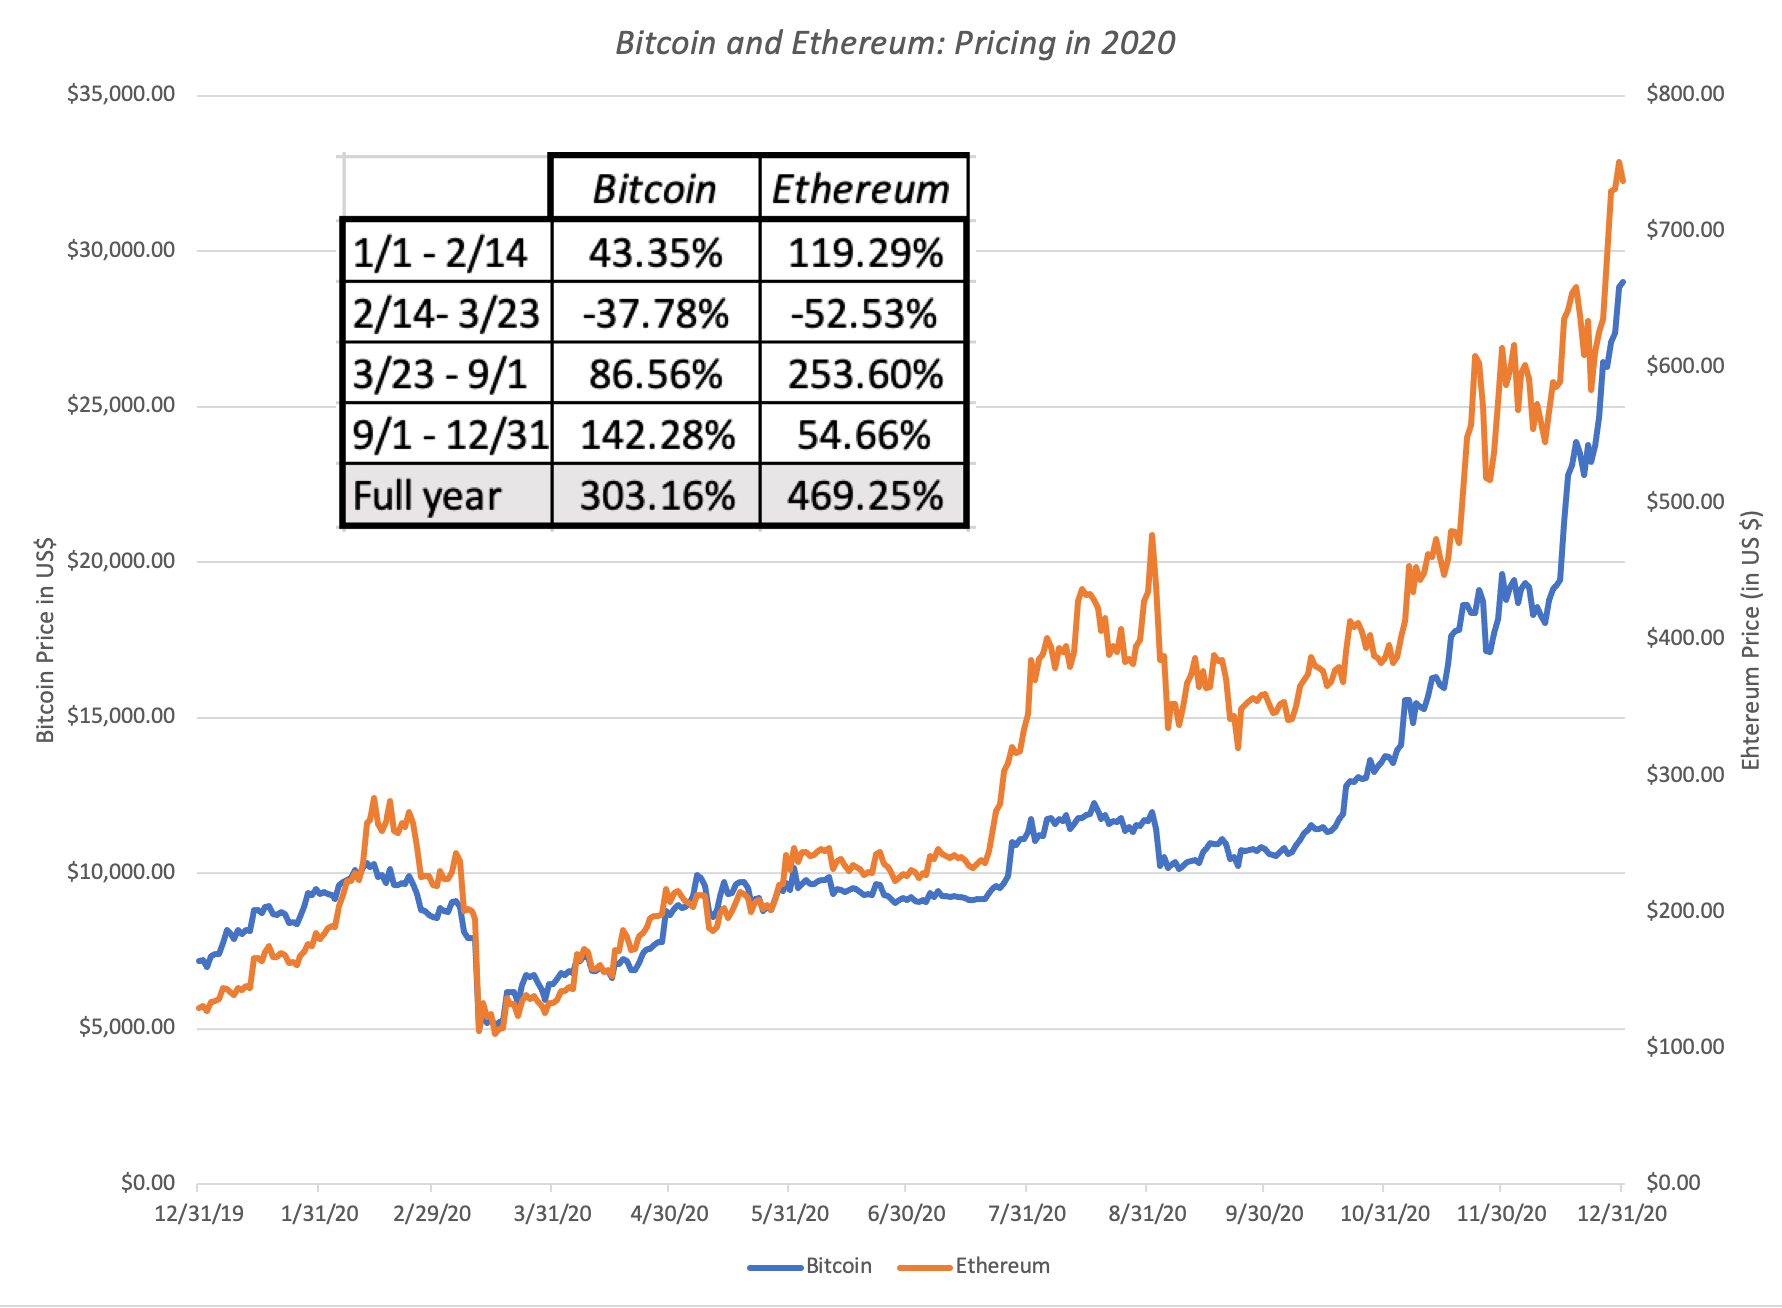 Yahoo! FinanceBoth Bitcoin and Ethereum delivered spellbinding returns in 2020, with Bitcoin up more than 300% and Ethereum up 469%. It may seem odd to take issue with either investment after a year like this one, but there are two components to the year's performance that should give pause to proponents. The first is that during the crisis weeks (2/14 - 3/23) and the months afterwards (3/23 - 9/1), Bitcoin and Ethereum both behaved more like very risky stocks than crisis assets, undercutting the argument that investors will gravitate to them during crises. The second is that there were no significant developments that I know off, during the last few months of 2020, that advanced the cause of Bitcoin as a currency or Ethereum as a commodity, which leaves us with momentum as the dominant variable explaining the price run up.
 Does that mean that we are headed for a correction in one or both of these cryptos? Not necessarily, since momentum is a dominant force, and while momentum can and will break, the catalysts for that to happen are not obvious in either Bitcoin or Ethereum, precisely because they are unformed. Since the end game (currency or collectible) is still being hashed out, there are no markers against which progress is being measured, and thus, no disappointments or surprises that will lead to a reassessment. Put simply, if you don't know where Bitcoin is going, how would you know if it is getting there? Let me suggest that this confusion serves the interests of bitcoin traders, keeping its prices volatile, but it comes at the expense of bitcoin’s long term potential as a currency or collectible, which require more stability.
The Investment Lessons
Every investing class starts with a discourse on diversification, an age-old lesson of not putting your eggs in one basket, and spreading your bets. In the last few decades, a combination of modern portfolio theory and data access has quantified this search for stability into a search for uncorrelated investments. When I was learning investments, admittedly a lifetime ago, I was told to expand my stock holdings to foreign markets and real estate, because their movements were driven by different forces than my domestic stockholdings. That was sensible advice, but as we (collectively as investors) piled into foreign stock funds and securitized real estate, we created an unwanted, but predictable consequence. The correlations across markets rose, reducing the benefits of diversification, and particularly so, during periods of crisis. The co-movement of markets during the 2008 crisis has been well chronicled, and I was curious about how 2020 played out across markets, and to capture the co-movement, I computed correlations using daily returns in 2020, across markets:
 Download correlations, with raw data to back them up
If you are rusty on statistics, this table can look intimidating, but it is a fairly easy one to read. To see the story behind the numbers, remember that a correlation of one reflects perfect co-movement, plus one, if in the same direction, and minus one, if in opposite directions, and a number close to zero indicates that there is no co-movement. Here is what I see:Equities moved together across markets, with correlations of 0.89 between US large cap and small cap, 0.70 between US large cap and European equities and 0.60 between US large cap and emerging market equities. Put simply, having a globally diversified stock portfolio would have helped you only marginally on the diversification front, during 2020.The US dollar moved inversely with equities, gaining strength when stocks were weak and losing strength when they were strong, and the movements were greater against emerging economy currencies ((-0.54) than against developed economy currencies (-0.17). That may have offset some or much of the diversification benefits of holding emerging market stocks.Treasury bond prices moved inversely with stock prices, at least during 2020. That can be seen in the negative correlations between the S&P 500 and 3-month T.Bills (-.06) and 10-year T.Bonds (-0.48). In other words, on days in 2020, when interest rates rose (fell) strongly, causing T.Bond prices to drop (rise), stock prices were more likely to go up (down). (I computed daily returns on treasury bonds, including the price change effect of interest rates changing.)With corporate bonds, the relationship with stock prices was positive, with lower-grade and high yield bonds moving much more with stocks (S&P 500 correlation with CCC & lower rated bonds was 0.60), than higher grade bonds (S&P 500 correlation with CCC & lower rated bonds was 0.47). In 2020, at least, commodity prices moved with stock prices, with the correlations being strongly positive not just for oil and copper, but with the broader commodity index.The S&P real estate index moved strongly with stocks, but a caveat is in order, since this index measures securitized real estate. Most of real estate is still held in private hands, and the prices on real estate can deviate from securitized real estate prices. The Case-Shiller index measures actual transactions, but it is not updated daily, and thus does not lend itself to this table.Gold and silver provided partial hedges against financial assets (stocks and bonds), but the correlation was not negative, as it was in the 1970s. During 2020, gold and silver both posted positive correlations with the S&P 500, 0.17 for the former and 0.24 for the latter.Cryptos moved more with stocks than gold, with bitcoin exhibiting a correlation of 0.43 with the S&P 500 and ethereum correlated 0.45 against the same index. Interesting the correlation between cryptos and gold is low; the correlation is 0.10 between bitcoin and gold and 0.12 between ethereum and gold.I know that this is all from one year, and that these correlations are unstable, but it is crisis years like 2008 and 2020 that we should be looking at, to make judgments about the relationship between investments and risk. The bottom line is that diversification today is a lot more difficult than it was a few decades ago, and staying with the old playbook of hold more foreign stocks and some real estate will no longer do the trick.
YouTube Video
Spreadsheets
Daily data for commodities, currencies, collectibles and cryptos - 2020Data Updates for 2021
Data Update 1 for 2021: A (Data) Look Back at a Most Forgettable Year!Data Update 2 for 2021: The Price of Risk!Data Update 3 for 2021: Currencies, Commodities, Collectibles and Crypto
In my last post, I described the wild ride that the price of risk took in 2020, with equity risk premiums and default spreads initially sky rocketing, as the virus led to global economic shutdowns, and then just as abruptly dropping back to pre-crisis levels over the course of the year. As stock and bond markets went through these gyrations, it should come as no surprise that the same forces were playing out in other markets as well. In this post, I will take a look at these other markets, starting with a way of dividing investments into assets, commodities, currencies and collectibles that I find useful in thinking about what I can (and cannot) do in those markets, and then reviewing how these markets performed during 2020. As I do this, there is no way that I can evade discussing Bitcoin and other crypto assets, which continued to draw disproportionate (relative to their actual standing in markets) attention during the year, and talking about what 2020 taught us about them.
Investments: Classifications and Consequences
In a 2017 post, focused on bitcoin, I argued that all investments can be categorized into one of four groups, assets, commodities, currencies and collectibles, and the differences across these group are central to understanding why pricing is different from value, and what sets investing apart from trading.
The Divide: Assets, Commodities, Currencies and Collectibles
If you define an investment as anything that you can buy and hold, with the intent of making money, every investment has to fall into at least one of these groupings:
Assets: An asset has expected cash flows that can either be contractually set (as they are with loans or bonds), residual (as is the case with an equity investment in a business or shares in a publicly traded company) or even conditional on an event occurring (options and warrants). Commodities: A commodity derives its value from being an input into a process to produce a item (product or service) that consumers need or want. Thus, agricultural products like wheat and soybeans are commodities, as are industrial commodities like iron ore and copper, and energy-linked commodities like oil and natural gas. Currencies: A currency serves three functions. It is a measure of value (used to tell you how much a product or service costs), a medium of exchange (facilitating the buying and selling of products and services) and a store of value (allowing people to save to meet future needs). While we tend to think of fiat currencies like this Euro, the US dollar or the Indian rupee, the use of currency pre-dates governments, and human beings have used everything from seashells to rocks as currency.Collectibles: A collectible's pricing comes from the perception that it has value, driven by tastes (artwork) and/or scarcity (rare items). There are a range of items that fall into this grouping from fine art to sports memorabilia to precious metals.While most investments fall into one of these buckets, there are some that can span two or more, and you have to decide which one dominates. Take gold, for instance, whose ductility and malleability makes it a prized commodity to jewelers and electronics makers, but whose scarcity and indestructibility (almost) make it even more attractive as a currency or a collectible, With bitcoin, even its most ardent promoters seem to be divided on whether the end game is to create a currency or a collectible, a debate that we will revisit at the end of this post.Price versus ValueThe classification of investments is key to understanding a second divide, one that I have repeatedly returned to in my posts, between value and price.
If the value of an investment is a function of its cashflows and the risk in those cash flows, it follows that only assets can be valued. Though commodities can sometimes be roughly valued with macro estimates of demand and supply, they are far more likely to be priced. Currencies and collectible can only be priced, and the determinants of their pricing will vary:Commodity Pricing: With commodities, the pricing will be determined by two factors. The first is the demand for and supply of the commodity, given its usage, with shocks to either causing price to change. Thus, it should come as no surprise that the oil embargo in the 1970s caused oil prices to surge and freezing weather in Florida resulted in higher prices for orange juice. The second is storability, with storage costs ranging from minimal with some commodities to prohibitive for others. In general, storable commodities provide buyers with the option of buying when prices are low, and storing the commodity, and for that reason, futures prices of storable commodities are tied to spot prices and storage costs.Currency Pricing: Currencies are priced against each other, with the prices taking the form of "exchange rates". In the long term, that pricing will be a function of how good a currency is as a medium of exchange and a store of value, with better performing currencies gaining at the expense of worse performing ones. On the first dimension (medium of exchange) currencies that are freely exchangeable (or even usable) anywhere in the world (like the US dollar, the Euro and the Yen) will be priced higher than currencies that do not have that reach (like the Indian rupee or the Peruvian Sul). On the second (store of value), it is inflation that separates good from bad currencies, with currencies with low inflation (like the Swiss franc) gaining at the expense of currencies with higher inflation (like the Zambian kwacha). Collectible Pricing: Most collectibles are pure plays on demand and supply, with no fundamentals driving the price, other than scarcity and desirability, real or perceived. Paintings by Picasso, Monet or Van Gogh are bought and sold for millions, because there are collectors and art lovers who see them as special works of art, and their supply is limited. Adding to the allure (and pricing) of collectibles is their longevity, reflected in their continuous hold on investor consciousness. It should come as no surprise that gold's, because it brings together all three characteristics; it's scarcity comes from nature, its desirability comes from in many forms and it has been used and valued for thousands of years.I capture these differences in the table below:
In short, assets can be both priced and value, commodities can be roughly valued but are mostly priced and currencies and collectibles can only be priced.Investing versus TradingThe essence of investing is assessing value, and buying assets that trade at prices below that value, and selling assets that trade at more. Trading is far simpler and less pretentious, where successful trading requires one thing and one thing only, buying at a low price and selling at a higher one. If you agree with those definitions, it then follows that you can invest only in assets (stocks, bonds, businesses, rental properties) and that you can only trade commodities, currencies and collectibles. Drawing on a table that I have used in prior posts (and I apologize for reusing it), here is my contrast between investing and trading:
Note that I am not passing judgment on either, since your end game is to make money, whether you are an investor or a trader, and the fact that you made money following the precepts of value investing and did fundamental analysis does not make you better or more worthy than your neighbor who made the same amount of money, buying and selling based upon price and volume indicators.
Commodities
With that lengthly lead in, let's look at what 2020 brought as surprises to the commodity market. As the virus caused a global economic shut down, there were severe disruptions to the demand for some commodities, as usage decreased, and to the supply of others, as production facilities and supply chains broke down. During the course of 2020, I kept track continuously of two commodities, copper and oil, both economically sensitive, and widely traded.
Federal Reserve Database (FRED)Note that the ups and downs of oil and copper not only follow the same time pattern, but closely resemble what stocks were doing over the same periods, but the changes are more exaggerated (up and down) with oil than with copper. Both oil and copper dropped during the peak crisis weeks (February 14 through March 23, 2020), but while copper not only recouped its losses and was up almost 26% over the course of the year, oil remains more than 20% below the start-of-the-year numbers. Note also the odd phenomenon on April 20, where West Texas crude prices dropped below zero, as traders panicked about running out of storage space for oil in the US.
Expanding more broadly and looking at a basket of commodities, we can trace out the same effects. In the graph below, I look at three commodity indices, the S&P World Commodity Index (WCI), which is a production-weighted index of commodity futures, the S&P GSCI Index, an investable version that includes the most liquid commodity futures, and the S&P GSCI Agricultural Index, a weighted average of agricultural commodity futures.
S&P Index DataThe broad commodity indices (WCI and GSCI) saw significant drops between February 14 and March 23, and recoveries in the months after, mirroring the oil and copper price movements. Agricultural commodity futures were far less affected by the crisis, with only a small drop during the crisis weeks, and delivered the best overall performance for the year.
Currencies
In a year during which financial markets had wild swings, and commodity prices followed, it should come as no surprise that currency markets also went through turbulence. In the graph below, I look at the movements of a select set of currencies over 2020, all scaled to the US dollar to allow for comparability:
Federal Reserve Data (FRED)The dollar strengthened against all of the currencies between February 14 and March 23, but over the course of the year, it depreciated against the Euro, Yen and the Yuan, was mostly flat against the British pound and Indian rupee and gained significantly against the Brazilian Real. Looking at the US dollar’s movements more broadly, you can see the effects of 2020 by looking at the Us movement relative to developed market and emerging market currencies in the graph below:
Federal Reserve Data (FRED)In the crisis weeks (2/14 to 3/23), the US dollar gained against other currencies, but more so against emerging market currencies than developed markets ones. In the months afterwards, it gave back those gains to end the year flat against emerging market currencies and down about 5.5% against developed market currencies.
Collectibles
During crises, collectibles often see increased demand, as fear about the future and a loss of faith in institutions (central banks, governments) leads people to see refuge in investments that they believe will outlast the crisis. Given the history of gold and silver as crisis assets, I start by looking at gold and silver prices in 2020;
Federal Reserve Data (FRED)Both gold and silver had strong years, with gold up 24.17% and silver up 46.77% during the year, but gold played the role of crisis asset better, with its price dropping only 5.19% in the crisis weeks from February 14 to March 23, beating out almost every other asset class in performance during the period. Silver dropped by 29.34% during that same period, but while its subsequent rise more than made up for that drop, on the narrow measure of crisis asset, it did not perform as well as gold.
The year (2020) had mixed effects on other collectible markets. Fine art, for itself, built around in-person auctions of expensive art works saw sales plummet in the early months of 2020, as shutdowns kicked in, but saw a surge of online auctions towards the end of the year. Notwithstanding this development, overall sales of art dropped in 2020, and transactions decreased, especially in the highest-priced segments.
Cryptos
It would be impossible to complete this post without talking about bitcoin, which as it has for much of the decade, continued to dominate discussions of markets and investments. Looking at this graph of bitcoin since its inception, you can see its meteoric rise:
There are clearly many who have been enriched during this rise, and quite a few who have lost their shirts, but any discussion of bitcoin evokes more passion than reason. There are some who believe so intensely in bitcoin that any critique or viewpoint that is contrary to theirs evokes an almost hysterical overreaction. On the other hand, there are others who view bitcoin as speculation run amok, with the end game destined to be painful. At the risk of provoking both sides, I want to start with a fundamental question of whether bitcoin is an asset, a commodity, a currency or a collectible. Even among its strongest supporters, there seems to be no consensus, with the biggest split being between those who argue that it will become a dominant currency, replacing fiat currencies in some markets, and supplementing them in others, and those who claim that it is a gold-like collectible, deriving its pricing from crises and loss of faith in fiat currencies. You could argue that this divide has existed from its creation in 2008, both in terminology (you mine for bitcoin, just as you do for gold) and in its design (an absolute limit on its numbers, creating scarcity). There are even some who believe that the block chain technology that is at the heart of bitcoin can make it a commodity, with the price rising, as block chains find their place in different parts of the economy. Here is my personal take:
Bitcoin is not an asset. I know that you can create securities denominated in bitcoin that have contractual or residual cash flows, but if you do so, it is not bitcoin that is the asset, but the underlying contractual claim. Put simply, when you buy a dollar or euro denominated bond, it is the bond that is the asset, not the currency of denomination.Bitcoin is not a commodity. It is true that block chains are finding their way into different segments of the economy and that the demand for block chains may grow exponentially, but bitcoin does not have a proprietary claim to block chain technology. In fact, you can utilize block chains with fiat currencies or other crypto currencies, and many do. There are some cryptos, like ethereum, that are designed to work much better with block chains, and with those crypto currencies, there is a commodity argument that can be made.Bitcoin is a currency, but it is not a very good one (at least at the moment): Every year, since its inception, we have been told that Bitcoin is on the verge of a breakthrough, where sellers of products and services will accept it as payment for goods and services, but twelve years after its creation, its acceptance remains narrow and limited. There are simple reasons why it has not acquired wider acceptance. First, if the essence of a currency is that you want transactions to occur quickly and at low cost, bitcoin is inefficient, with transactions times and costs remaining high. Second, the wild volatility that makes it such a desirable target for speculative trading makes both buyers and sellers more reluctant to use it in transactions, the former because they are afraid that they will miss out on a price run up and the latter because they may be accepting it, just before a price drop. Third, a currency with an absolute limit in numbers is one that is destined for deflation in steady state, in economies with real growth. I know that stories about the Silk Road have enshrined the mythology of bitcoin being the currency of choice for illegal activities, but a currency designed purely for evasion (of crime and taxes) is destined to be a niche currency that will be under assault from governments and law enforcement.Bitcoin is a collectible, but with a question mark on longevity: I have described Bitcoin as millennial gold, and you could argue that, at least for some young people, holding bitcoin resonates more than holding gold. They may be right in their choice, but there are two issues that they need to confront. The first is that while bitcoin’s allure is that it has limits on quantity, that assumes that it has no substitutes. If other cryptos can operate as substitutes, even imperfect ones, there is no limit on quantity, since you can keep creating new variants. The second is whether the desirability of bitcoin will endure, since much of that desirability right now is built on its past price performance. In other words, if traders move on from bitcoin to some other speculative investment, and bitcoin prices stagnate or drop, will traders continue to hold it? In Bitcoin's favor, it has been able to make it through prior downturns, and not only survive but come back stronger, but the question still remains.Looking at how Bitcoin did in 2020 can give us insight into its future. In the graph below, I look at Bitcoin and Ethereum prices through the year:
Yahoo! FinanceBoth Bitcoin and Ethereum delivered spellbinding returns in 2020, with Bitcoin up more than 300% and Ethereum up 469%. It may seem odd to take issue with either investment after a year like this one, but there are two components to the year's performance that should give pause to proponents. The first is that during the crisis weeks (2/14 - 3/23) and the months afterwards (3/23 - 9/1), Bitcoin and Ethereum both behaved more like very risky stocks than crisis assets, undercutting the argument that investors will gravitate to them during crises. The second is that there were no significant developments that I know off, during the last few months of 2020, that advanced the cause of Bitcoin as a currency or Ethereum as a commodity, which leaves us with momentum as the dominant variable explaining the price run up. Does that mean that we are headed for a correction in one or both of these cryptos? Not necessarily, since momentum is a dominant force, and while momentum can and will break, the catalysts for that to happen are not obvious in either Bitcoin or Ethereum, precisely because they are unformed. Since the end game (currency or collectible) is still being hashed out, there are no markers against which progress is being measured, and thus, no disappointments or surprises that will lead to a reassessment. Put simply, if you don't know where Bitcoin is going, how would you know if it is getting there? Let me suggest that this confusion serves the interests of bitcoin traders, keeping its prices volatile, but it comes at the expense of bitcoin’s long term potential as a currency or collectible, which require more stability.
The Investment Lessons
Every investing class starts with a discourse on diversification, an age-old lesson of not putting your eggs in one basket, and spreading your bets. In the last few decades, a combination of modern portfolio theory and data access has quantified this search for stability into a search for uncorrelated investments. When I was learning investments, admittedly a lifetime ago, I was told to expand my stock holdings to foreign markets and real estate, because their movements were driven by different forces than my domestic stockholdings. That was sensible advice, but as we (collectively as investors) piled into foreign stock funds and securitized real estate, we created an unwanted, but predictable consequence. The correlations across markets rose, reducing the benefits of diversification, and particularly so, during periods of crisis. The co-movement of markets during the 2008 crisis has been well chronicled, and I was curious about how 2020 played out across markets, and to capture the co-movement, I computed correlations using daily returns in 2020, across markets:
Download correlations, with raw data to back them upIf you are rusty on statistics, this table can look intimidating, but it is a fairly easy one to read. To see the story behind the numbers, remember that a correlation of one reflects perfect co-movement, plus one, if in the same direction, and minus one, if in opposite directions, and a number close to zero indicates that there is no co-movement. Here is what I see:Equities moved together across markets, with correlations of 0.89 between US large cap and small cap, 0.70 between US large cap and European equities and 0.60 between US large cap and emerging market equities. Put simply, having a globally diversified stock portfolio would have helped you only marginally on the diversification front, during 2020.The US dollar moved inversely with equities, gaining strength when stocks were weak and losing strength when they were strong, and the movements were greater against emerging economy currencies ((-0.54) than against developed economy currencies (-0.17). That may have offset some or much of the diversification benefits of holding emerging market stocks.Treasury bond prices moved inversely with stock prices, at least during 2020. That can be seen in the negative correlations between the S&P 500 and 3-month T.Bills (-.06) and 10-year T.Bonds (-0.48). In other words, on days in 2020, when interest rates rose (fell) strongly, causing T.Bond prices to drop (rise), stock prices were more likely to go up (down). (I computed daily returns on treasury bonds, including the price change effect of interest rates changing.)With corporate bonds, the relationship with stock prices was positive, with lower-grade and high yield bonds moving much more with stocks (S&P 500 correlation with CCC & lower rated bonds was 0.60), than higher grade bonds (S&P 500 correlation with CCC & lower rated bonds was 0.47). In 2020, at least, commodity prices moved with stock prices, with the correlations being strongly positive not just for oil and copper, but with the broader commodity index.The S&P real estate index moved strongly with stocks, but a caveat is in order, since this index measures securitized real estate. Most of real estate is still held in private hands, and the prices on real estate can deviate from securitized real estate prices. The Case-Shiller index measures actual transactions, but it is not updated daily, and thus does not lend itself to this table.Gold and silver provided partial hedges against financial assets (stocks and bonds), but the correlation was not negative, as it was in the 1970s. During 2020, gold and silver both posted positive correlations with the S&P 500, 0.17 for the former and 0.24 for the latter.Cryptos moved more with stocks than gold, with bitcoin exhibiting a correlation of 0.43 with the S&P 500 and ethereum correlated 0.45 against the same index. Interesting the correlation between cryptos and gold is low; the correlation is 0.10 between bitcoin and gold and 0.12 between ethereum and gold.I know that this is all from one year, and that these correlations are unstable, but it is crisis years like 2008 and 2020 that we should be looking at, to make judgments about the relationship between investments and risk. The bottom line is that diversification today is a lot more difficult than it was a few decades ago, and staying with the old playbook of hold more foreign stocks and some real estate will no longer do the trick.
YouTube Video
Spreadsheets
Daily data for commodities, currencies, collectibles and cryptos - 2020Data Updates for 2021
Data Update 1 for 2021: A (Data) Look Back at a Most Forgettable Year!Data Update 2 for 2021: The Price of Risk!January 20, 2021
Data Update 2 for 2021: The Price of Risk!
Investors are constantly in search of a single metric that will tell them whether a market is under or over valued, and consequently whether they should buying or selling holdings in that market. With equities, the metric that has been in use the longest is the PE ratio, modified in recent years to the CAPE, where earnings are normalized (by averaging over time) and sometimes adjusted for inflation. That metric, though, has been signaling that stocks are over valued for most of the last decade, a ten-year period when stocks delivered blockbuster returns. The failures of the signal have been variously attributed to low interest rates, accounting mis-measurement of earnings (especially at tech companies), and by some, to animal spirits. In this post, I offer an alternative, albeit a more complicated, metric that I believe offers not only a more comprehensive measure of pricing, but also operates as a barometer of the ups and downs in the market.
The Price of Risk
The price of risk is what investors demand as a premium, an extra return over and above what they can make on a guaranteed investment (risk free), to invest in a risky asset. Note that this price is set by demand and supply and will reflect everything that investors collectively believe, hope for, and fear.
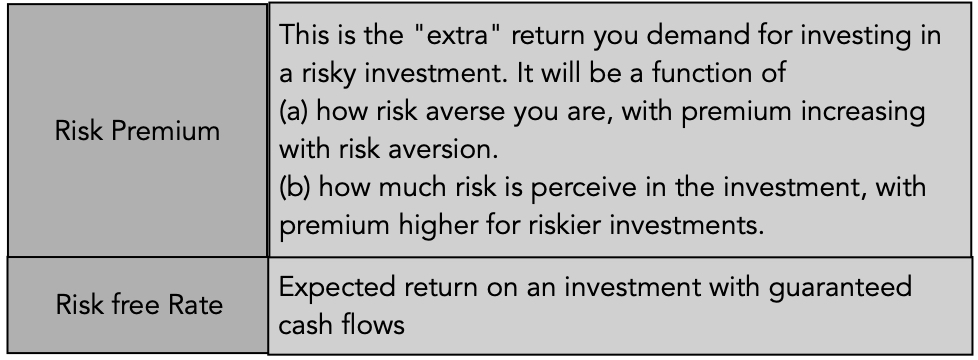
Does the price of risk have to be positive? The answer depends on whether human beings are risk averse or not. If they are, the price of risk will be reflected in a positive premium, and the level of the premium will increase, as investors become more risk averse. If, on the other hand, investors are risk neutral, the price of risk will be zero, and investors will buy risky business, stocks and other investments, and settle for the risk free rate as the expected return.
Note that nothing that I have said so far is premised on modern portfolio theory, or any academic view of risk premiums. It is true that economists have researched risk aversion for centuries and concluded that investors are collectively risk averse, and that the level of risk aversion varies across age groups, income levels and time. Some have developed models that try to measure what a fair risk premium should be, but to arrive at their conclusions, they have make assumptions about investor utility functions that are often unobservable and untestable. I have no desire to make this a lengthy treatise about the "right" risk premium, but will instead start with two assertions:
Risk premiums can be estimated: You can back out the risk premiums that investors are demanding from the prices that they pay for risky assets. Put simply, if you can observe the price that an investor pays for a risky asset, and are willing to estimate the expected cash flows on that asset, you can estimate the expected return on that asset and net out the risk free asset to arrive at a risk premium. It is true that you can make mistakes on your expected cash flows, but your output should reflect an estimate, albeit a noisy one, of what investors are demanding as a premium.Risk premiums can and will change over time: Risk premiums are driven by risk aversion, and risk aversion itself can change over time. In fact, greed and fear, two big drivers of market prices, also affect risk aversion, with investors becoming more risk averse and charging higher premiums, when the fear factor becomes dominant. When risk premiums change, prices will move: As risk premiums change, the prices that investors are willing to pay for risky assets will also change, with the two moving in opposite directions. Intuitively, if you want to earn a higher risk premium on an investment, holding cash flows fixed, you will pay less for that investment today.The Price of Risk: Bond MarketAll bonds, including those with guaranteed coupons, are risky, if you define risk as prices being volatile, since as interest rates changes, bond prices will change as well. Most bonds, though, are exposed to a second risk, which is that the bond issuer can default on coupon payments, making returns and prices even more uncertain. This is why corporate bonds are riskier than sovereign bonds, and sovereign bonds issued by shakier governments are riskier than sovereign bonds issued by governments that are unlikely to default.
Bond Default Spread
If you accept the proposition that a bond with default risk is riskier than an otherwise equivalent bond (same coupon and maturity) issued by a default-free entity, the price of risk in the bond market can be measured by looking at the differences in yields between the two bonds. Thus, if a 10-year corporate bond has a yield of 3.00% and a 10-year government bond, in the same currency and with no default risk, has a yield of 1.00%, the difference is termed the default spread and becomes a measure of the price of risk in the bond market.
At the risk of belaboring the details, it is not the yield that we should be comparing, but the yield to maturity, which is the internal rate of return on the bond, given how it is priced:

To compute the default spread over a 10-year period for a specific corporate bond (or loan), you would compute the yields to maturity on the ten-year corporate and treasury bonds and take the difference. Note that even this comparison is an approximation, but it yields a close enough value to work, and that it yields a default spread for a specific maturity. You could compute default spreads for other maturities, and compute the price of risk over 1-year, 2-year, 3-year periods and so on.
Corporate Default Spreads: Current and Look Back at 2020
Corporate bonds are traded, and as a consequence, and you can use traded prices to estimate default spreads in the market. In the chart below, I compare default spreads at the start of 2021 with the default spreads at the start of 2020:
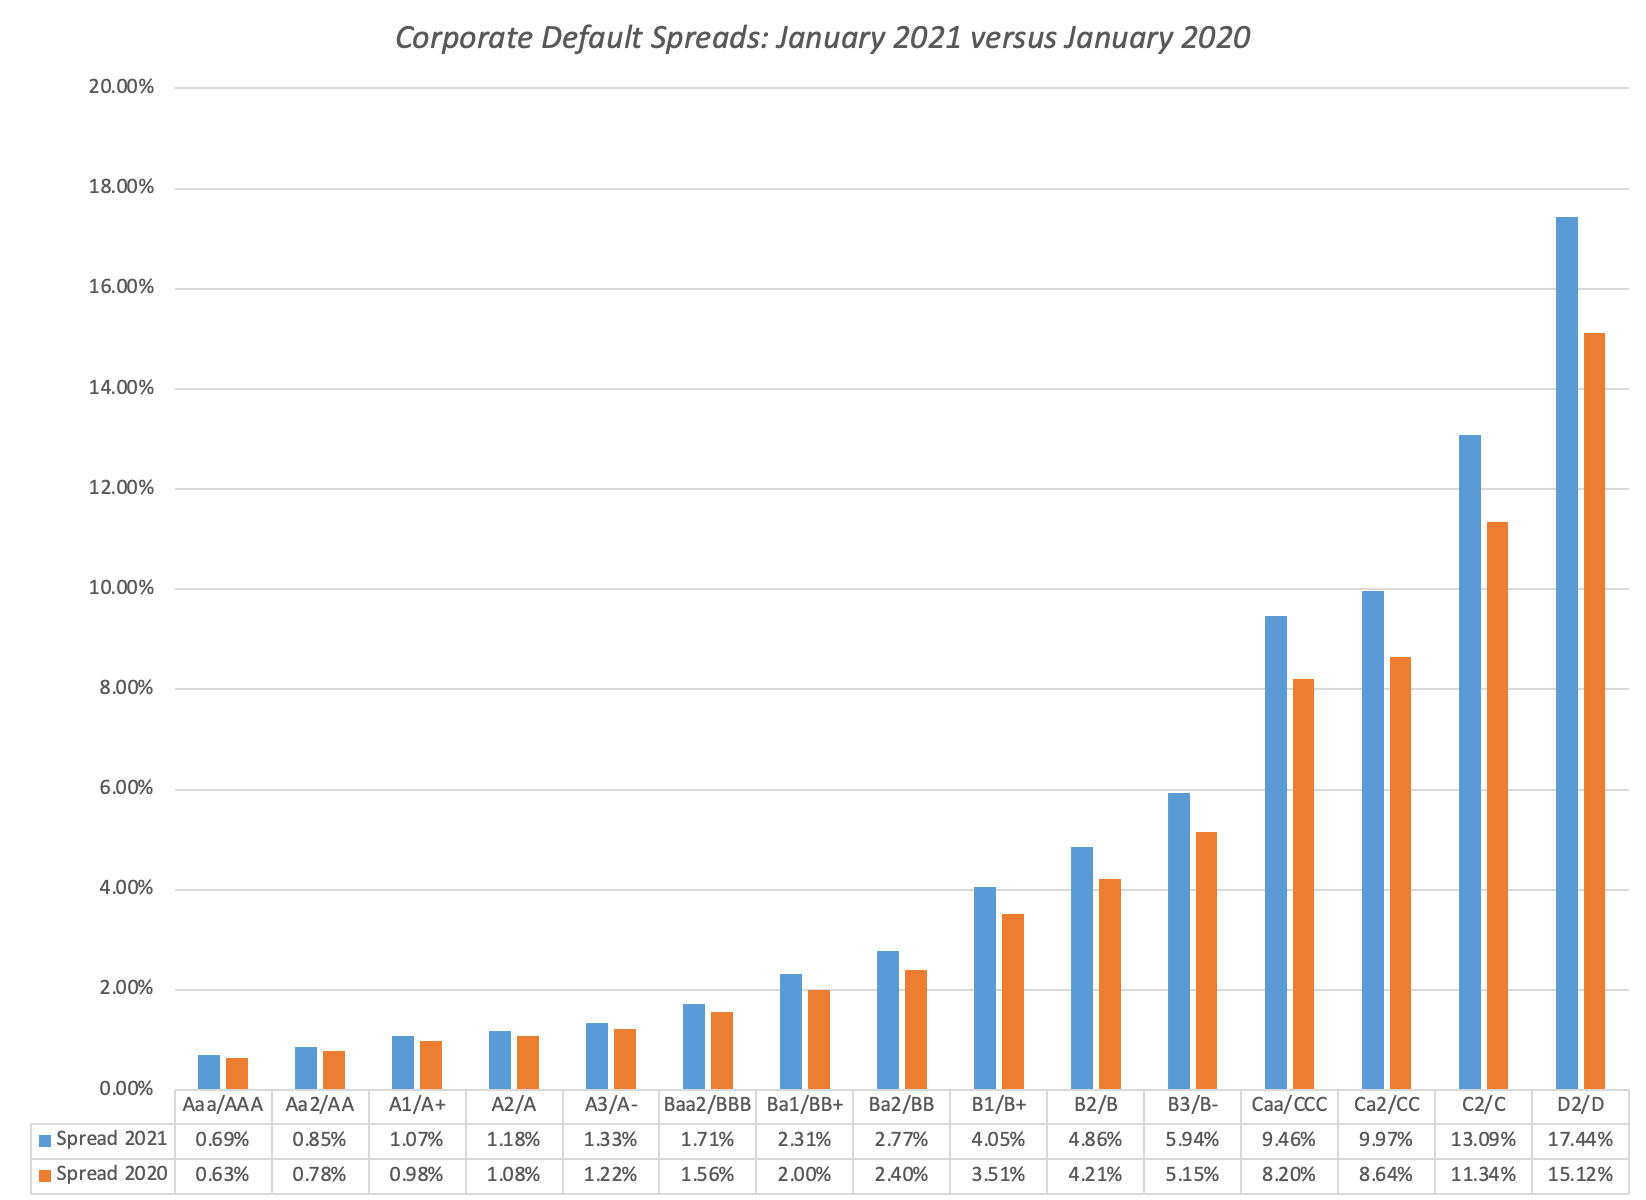 Source: BofA ML Spreads on Federal Reserve (FRED)
At first sight, it looks like an uneventful year, with spreads in 2021 mildly higher than spreads in 2020, but that comparison is deceptive, since default spreads went on a roller-coaster ride during 2020:
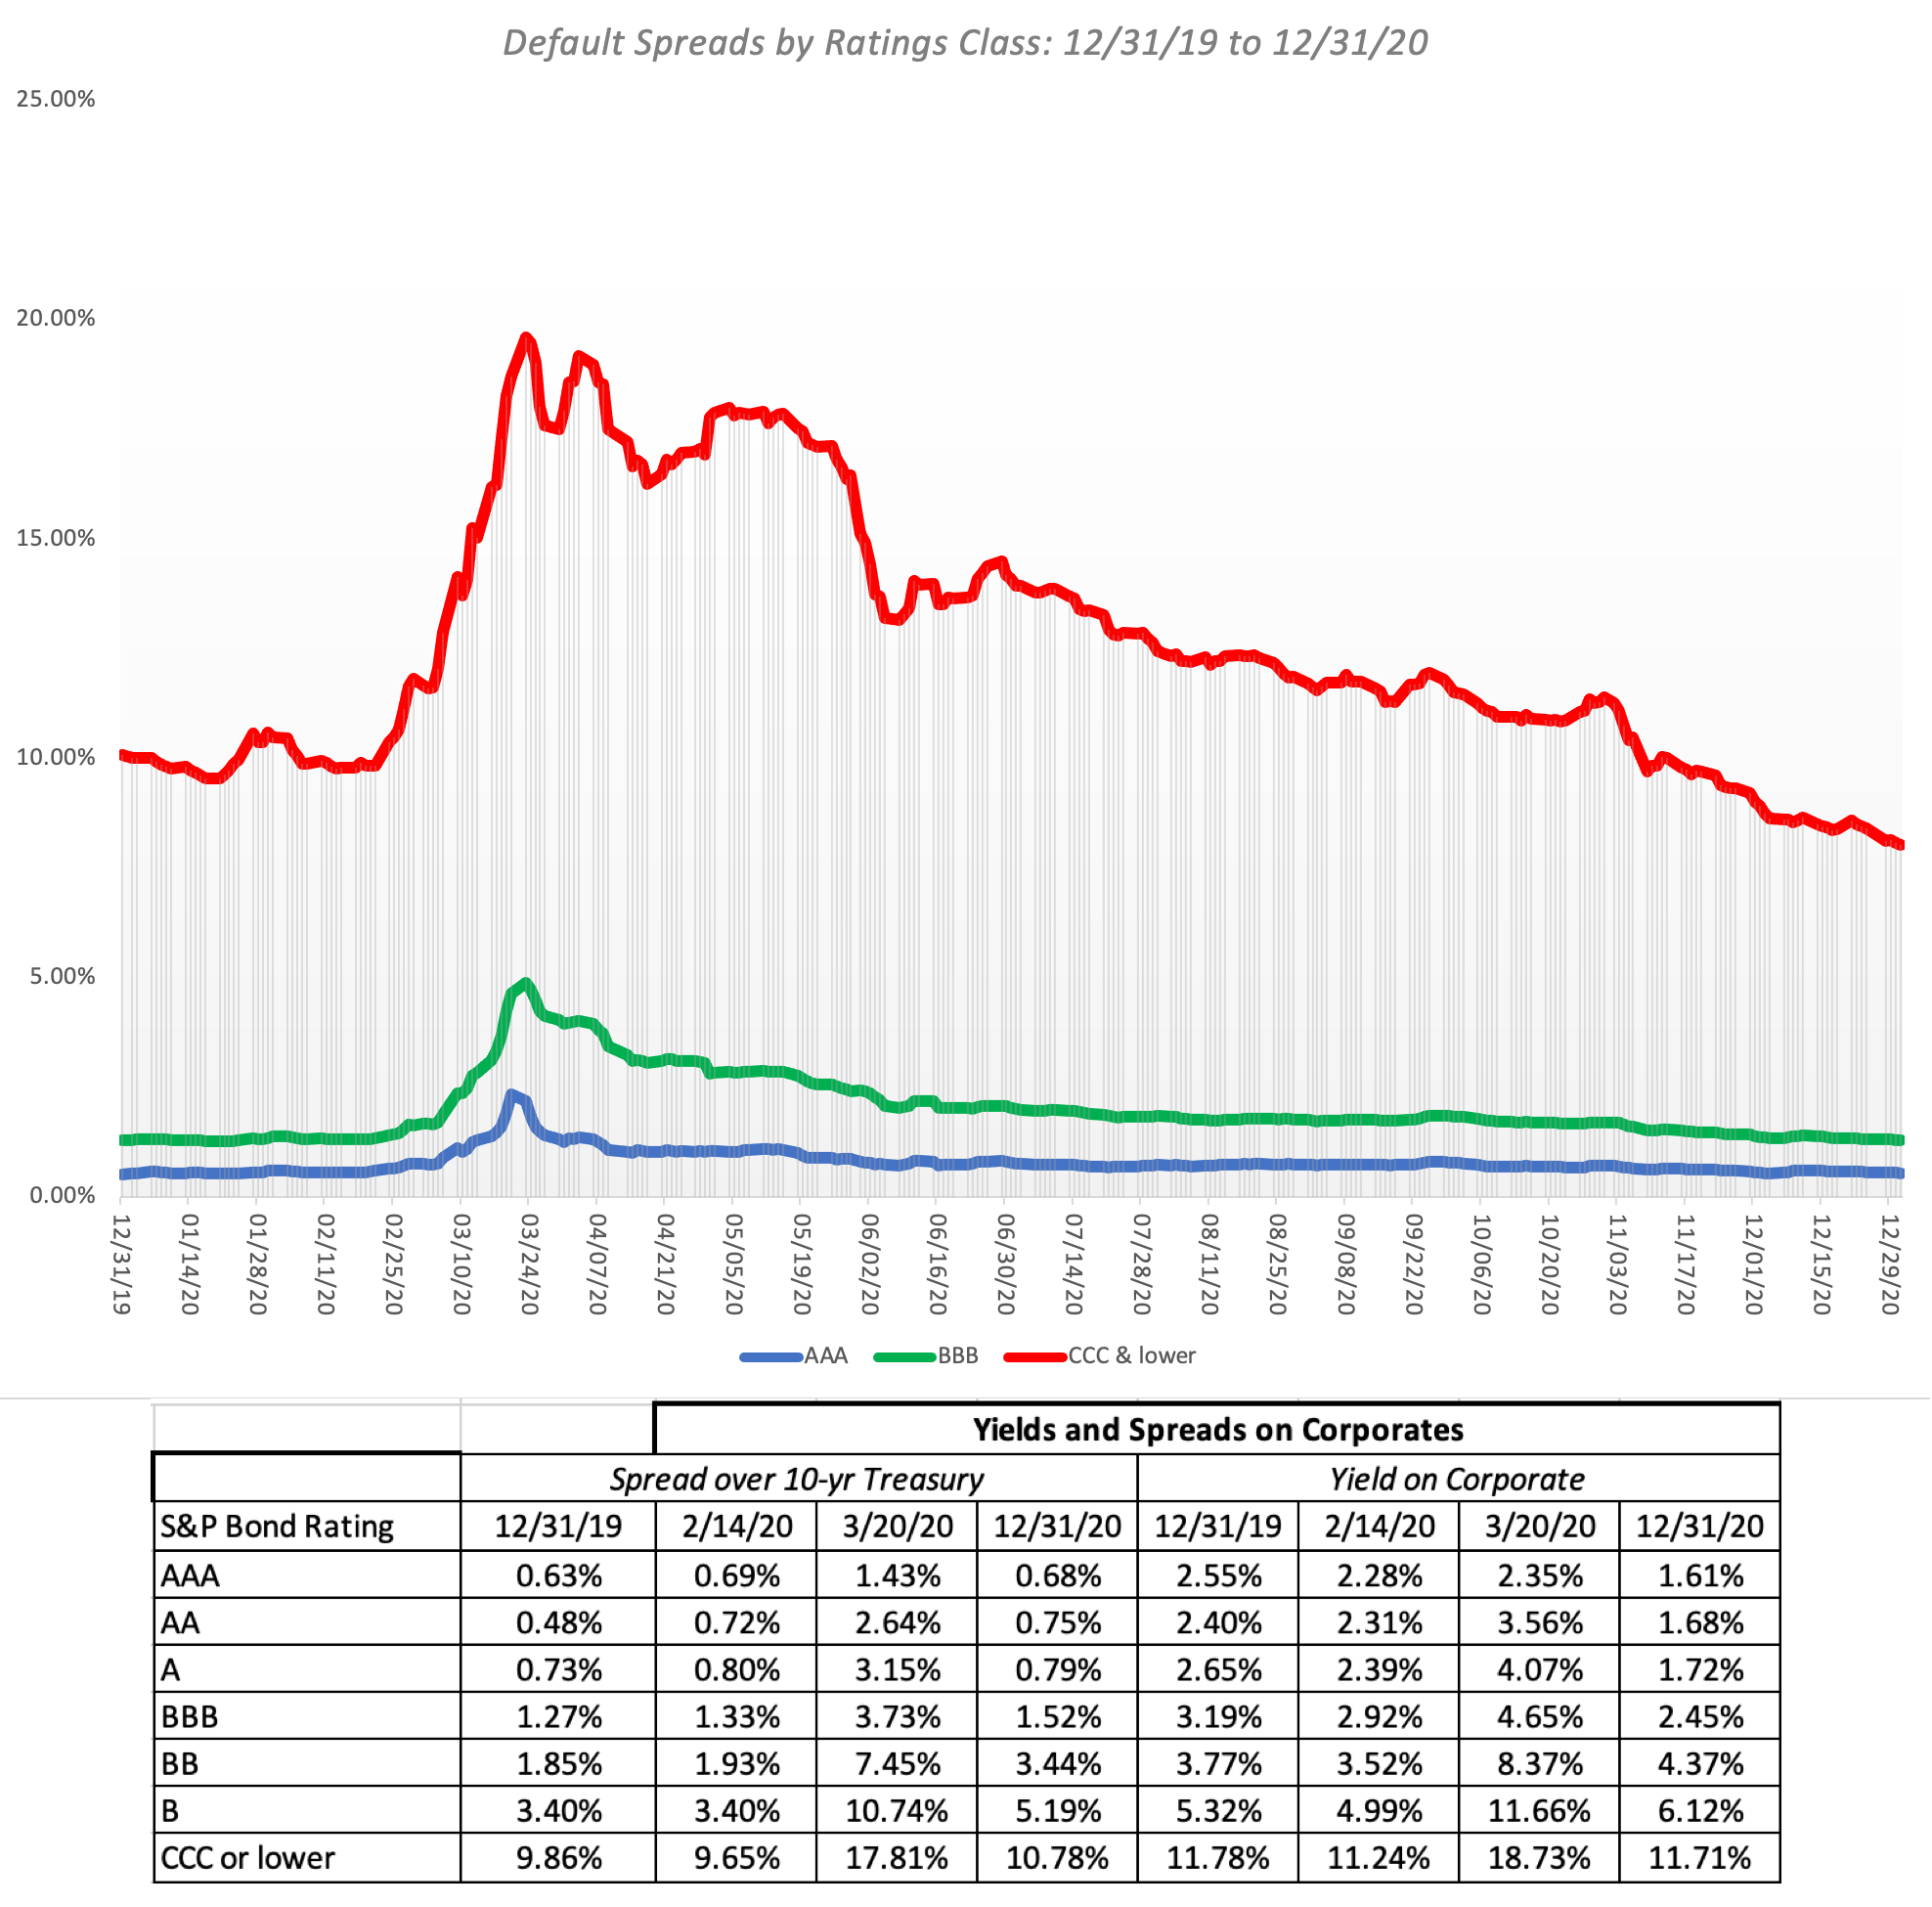 Source: BofA ML Spreads on Federal Reserve (FRED)While spreads started 2020 in serene fashion, the COVID-driven market crisis caused them to widen dramatically between February 14 and March 20, with the spreads almost tripling for lower rated bonds. Given the worries about default and a full-fledged market meltdown, that was not surprising, but what is surprising is how quickly the fear factor faded and spreads returned almost to pre-crisis levels.
Measuring against the past
Are default spreads today too low? There are two ways to answer that question. One is to look at their movement over time, and compare current spreads to historic norms.
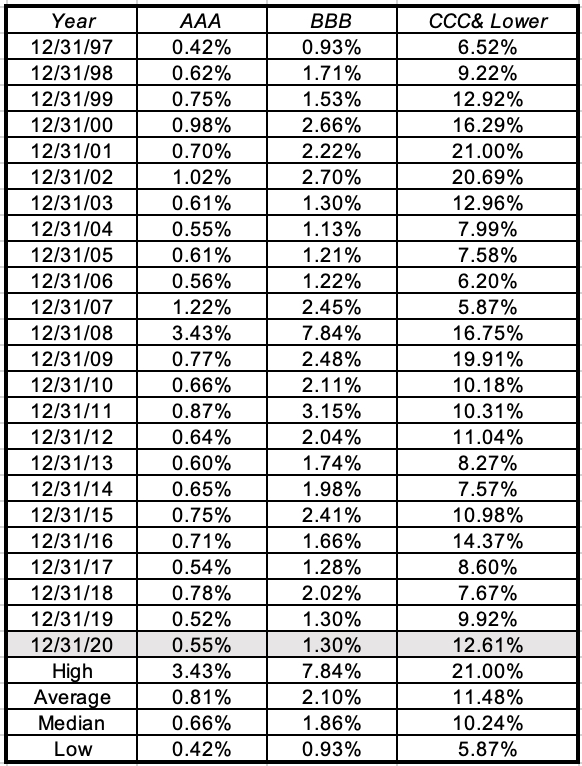 Source: BofA ML Spreads on Federal Reserve (FRED)
The default spreads at the end of 2020 are at the low end of the historical spectrum, and the contrast with the 2008 crisis is stark, since default spread surged in the last quarter of 2008 and did not come back down to pre-crisis levels until almost two years later. The other is to look at corporate defaults over time to see if markets are building in enough of a buffer against future defaults.
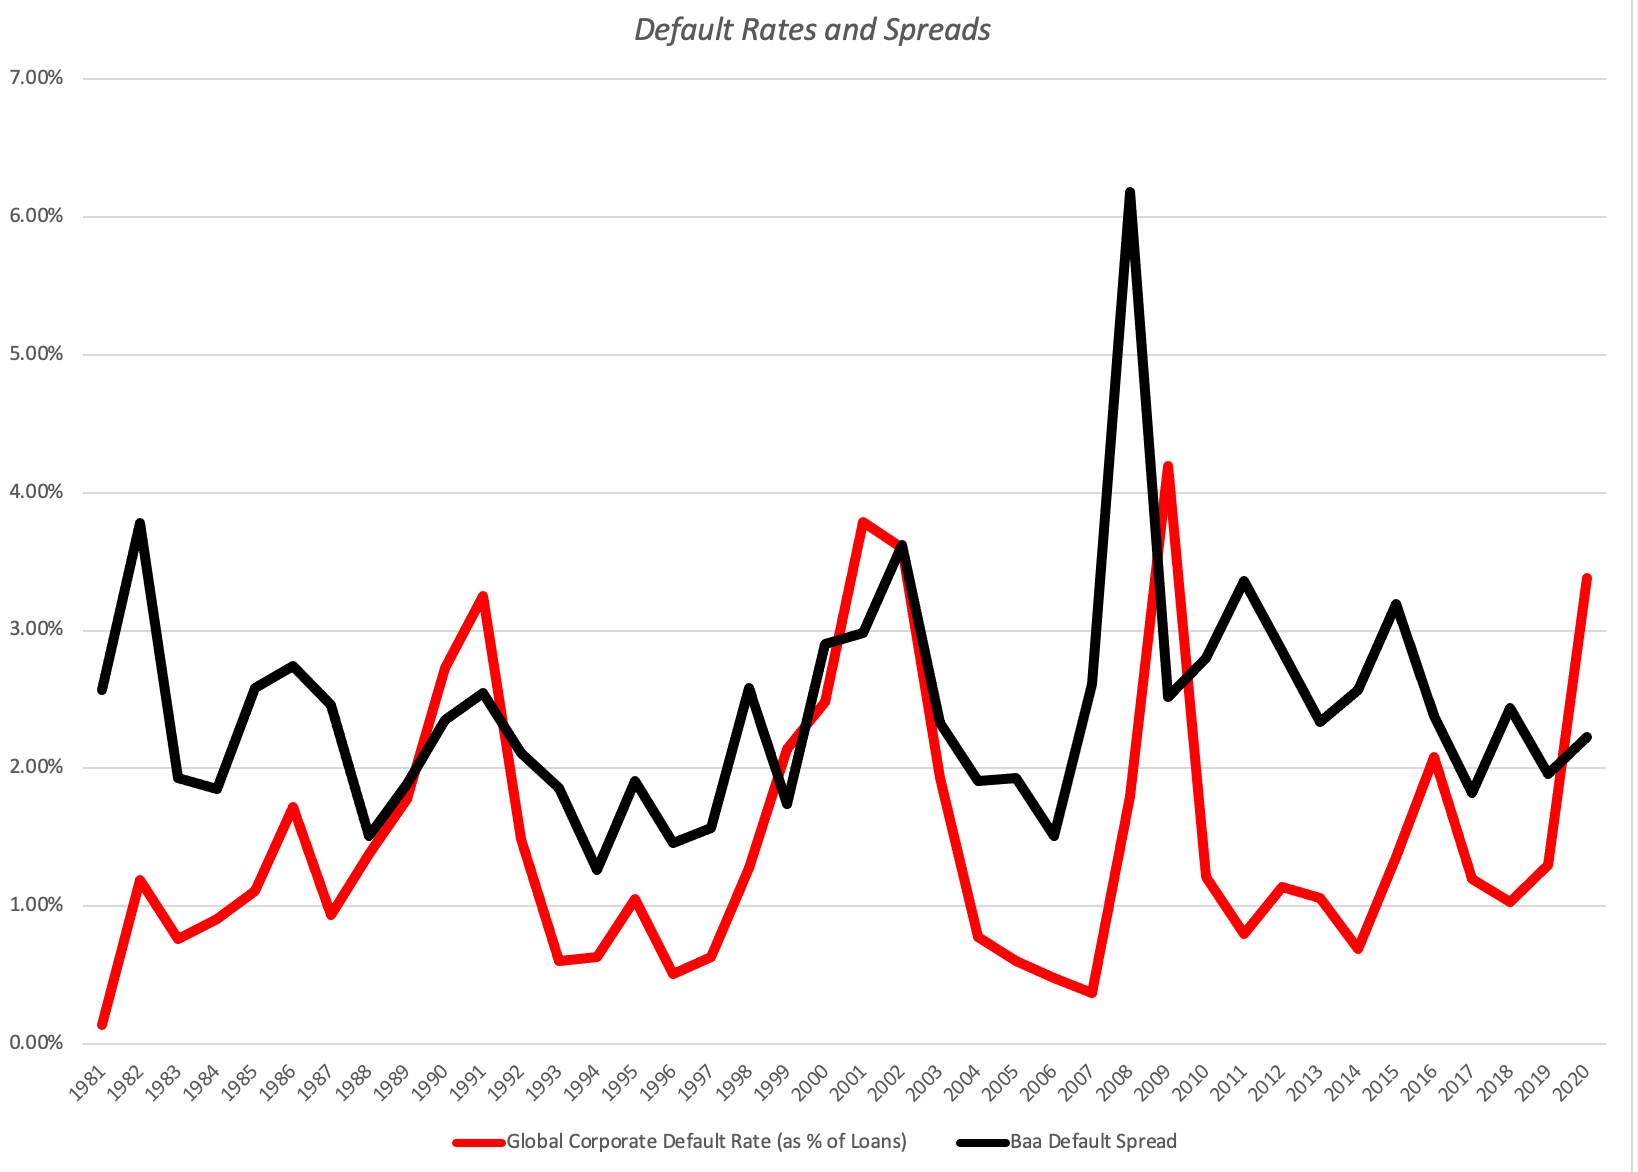 Sources: S&P and Moody's
Default rates increased in 2020, with spillover effects expected into 2021, but the corporate bond default spreads do not seem to reflect this. One explanation is that the bond market beliefs that the worst of the crisis is over and that default rates will return quickly to pre-COVID levels. The other is the corporate bond market is under estimating both the risk and the consequences of default.
The Price of Risk: Equities
Equities are riskier than bonds (or at least most bonds), and it stands to reason that there is a price of risk bearing in the equity markets. While that price has a name, i.e., the equity risk premium, it is more difficult to observe and estimate than the default spread in bond markets. In this section, I will present both the standard approach to estimating the equity risk premium and my preferred way of doing so, with a rationale for why.
Estimation Approaches
Why is it so difficult to estimate an equity risk premium? The simple reason is that unlike a bond, which comes with specified coupons, the cash flows that you receive when you buy stocks are neither pre-specified nor guaranteed. It is true that some companies pay dividends, and that these dividends are sticky, but it is also true that companies are under no contractual obligation to continue paying those same dividends. This difficulty in observing the equity risk premium leads many to look backwards, when asked to estimate the equity risk premium. Put simply they look at a long time period in the past (50 years or even 100 years) and look at the premium that stocks earned over a risk free investment (treasury bills or bonds); that historical risk premium then gets used as a measure of the current equity risk premium. On my website, I update this historical risk premium every year, and the graph below reflects my January 2021 findings:
 Download spreadsheet with raw data
Looking over a 92-year time period (1928-2020), for instance, stocks earned an geometric average return of 9.79%, giving them a premium of 4.84% over the 4.95% that you would have earned, investing in treasury bonds. If you buy into this measure of equity risk premiums, consider its limitations. First, it is backward looking and built on the presumption that the future will look like the past. Second, even if you trust mean reversion, note that the estimated premium is not a fact but an estimate, with a wide range around it. Specifically, the estimate of 4.84% for the equity risk premium from 1928 to 2020 comes with a standard error of 2.1%; the true ERP, with this error, could fall anywhere from 0.64% to 9.04%. Third, this premium is static and does not reflect market crises and investor fears; thus, the historical risk premium on February 14, 2020 would have very similar to the historical risk premium on March 20, 2020.
The alternative approach to estimating equity risk premiums is revolutionary and it borrows from the yield to maturity approach that we used to estimate bond default spreads. Consider replacing the bond price with the level of stock prices today (say, with the S&P 500 index) and coupons with expected cash flows on stocks (from dividends and buybacks), and solve for an internal rate of return:
 Implied Equity Risk Premium: In General
The internal rate of return is the expected return on stocks, and netting out the risk free rate today will yield an implied equity risk premium. In the picture below, I use this process to estimate an equity risk premium of 4.72% for the S&P 500 on January 1, 2021:
 Download spreadsheet to compute ERP
It is true that my estimates of earnings and cash flows in the future are driving my premium, and that the premium will be lower (higher) if I have under (over) estimated those numbers. This approach to estimating equity risk premiums is forward-looking and dynamic, changing as the market price changes. In the graph below, I report implied equity risk premiums that I computed, by day, during 2020, in an effort to gauge how the crisis was playing out and keep my sanity.
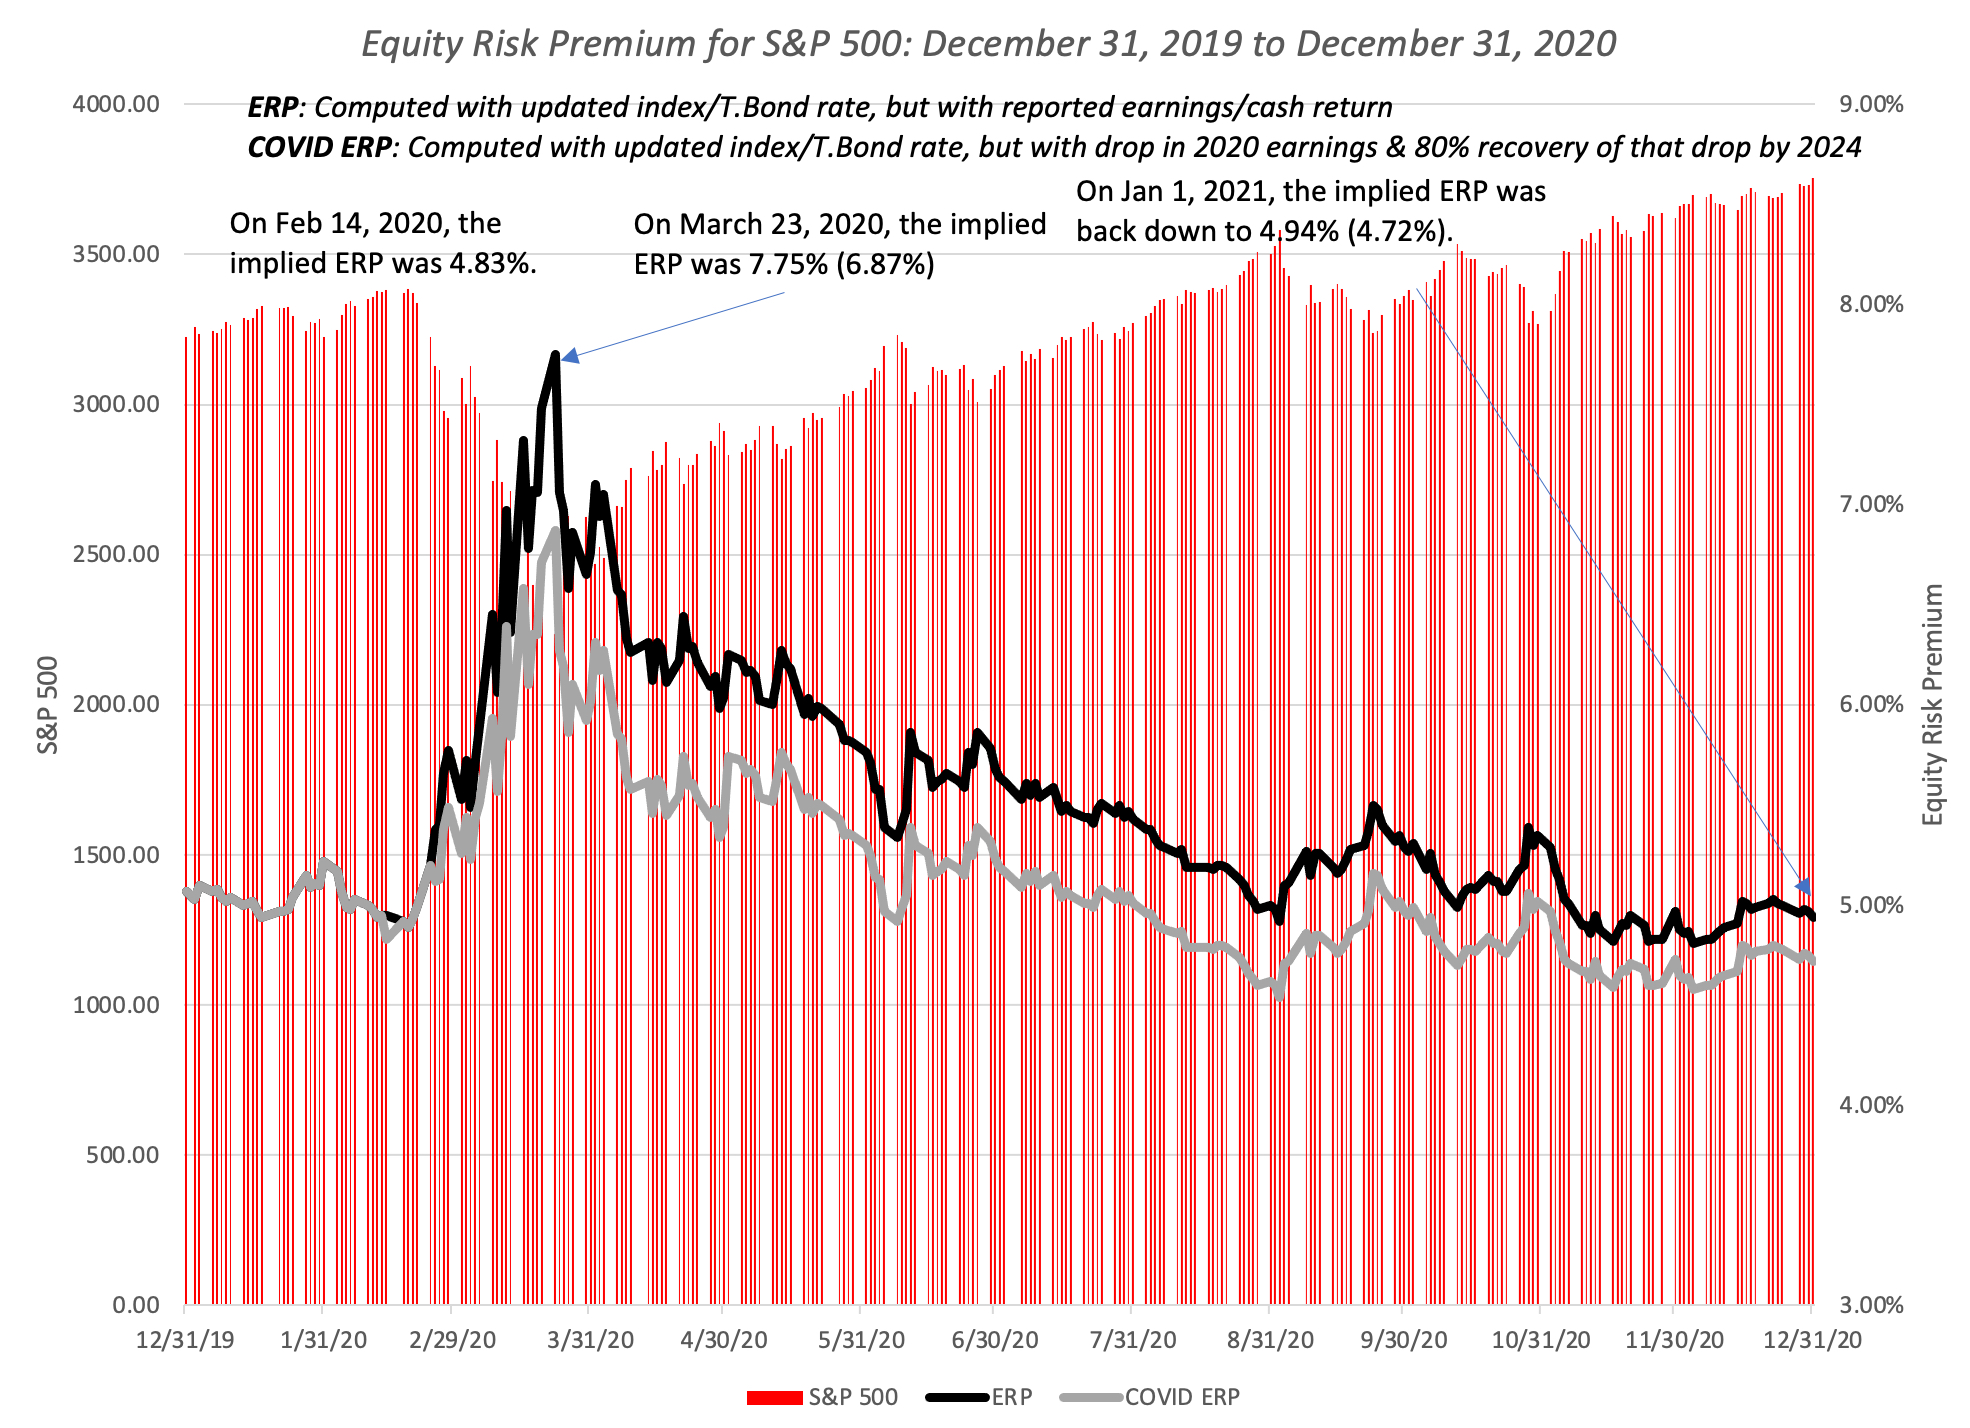 Download spreadsheet with data
As with the bond default spread, the implied equity risk premium was extraordinarily volatile in 2020, peaking at 7.75% on March 20, before falling back to pre-crisis levels by the end of the year.
Market Gauge?
As we are engulfed by talk of market bubbles and corrections, it is worth nothing that any question about the overall market can really be reframed as a question about the implied equity risk premium. If you believe that the current implied equity risk premium is too low, you are in effect also saying that stocks are overvalued, just as a judgment that the equity risk premium is too high is equivalent to arguing that stocks are undervalued. So, at 4.72%, is the equity risk premium too low and is the market in a bubble? One way to pass judgment is to compare the current premium to implied equity risk premiums in the past:
 Download spreadsheet with historical ERP
On this comparison, stocks don't look significantly over valued, since the current premium is higher than the long term average (4.21%), though if you compare it to the equity risk premium in the last decade (5.53%), it looks low, and that stocks are over valued by about 15%. There is a caveat, though, which is that this risk premium is being earned on a risk free rate that is historically low. Consider this alternative graph, where I look at the expected return on stocks (risk free rate plus implied equity risk premium) over the same time period:

For much of this century, the expected return on stocks has hovered around 8%, but the expected return at the start of 2021 is only 5.65%, well below the expected returns in prior periods.
A Market Assessment
I know that you are probably incredibly confused, and I am afraid that I cannot clear up all of that confusion, but this framework lends itself to valuing the entire market. To do this, you have to be willing to make estimates of:
Earnings on the index: You cannot value a market based upon last year's earnings (though many do so). Investing is about the future, and uncomfortable as it may make you feel, you have to make estimates for the future. With an index like the S&P 500, you can outsource these estimates at least for the near years, by looking at consensus forecasts from analysts tracking the index.Cash returned, relative to earnings: Since it is cash returned to stockholders that drives value, you also have to make judgments on what percent of earnings will be returned to stockholders, either in dividends or buybacks. To this, you can look to history, but recognize that it is also a function of the confidence that companies have about the future, with more confidence leading to higher cash being returned.Risk free rates over time: While it is generally not a good idea to play interest rate forecaster, we are in unusual times, with rates close to all time lows. In addition, your views on future growth in the economy are intertwined with what will happen to risk free rates, with stronger economic growth putting more upward pressure on rates.An acceptable ERP: As I noted in the last section, equity risk premiums have been volatile over time, and particularly so in years in 2020. The equity risk premium, added to the risk free rate, will determine what you need stock returns to be, to break even on a risk-adjusted basis.It is only fair that I go first. In the picture below, I make my best judgments on each of these dimensions, using consensus estimates of earnings in 2021 and 2022 to get started, but then slowing growth in earnings to match the growth rate in the economy, which I approximate with the risk free rate. On the risk free rate, I assume that rates will rise over time to 2%, and that 5% is a fair ERP, given history. My valuation is below:
 Download spreadsheet to value S&P 500
Based upon my inputs, the S&P 500 is over valued by about 12%, certainly not bubble territory, but still richly priced. You may (and should) disagree with my assumptions, and I welcome you to download the spreadsheet and change the inputs. Ultimately though, the judgment you make on the market will be a joint effect of your views on the economy and interest rates in the next few years. The table below summarizes the interplay between economic growth and interest rate assumptions, and the effects on the index value:
 Use S&P 500 valuation spreadsheet to assess value effects
As you can see, there are far more bad possible outcomes than good ones, and the only scenario where stocks have significant room to rise is the Goldilocks market, where rates stay low (at close to 1%), while the economy comes back strongly. I know that the possibility of additional economic stimulus may improve the odds for the economy, but can they do so without affecting rates? To buy into that scenario, you have to belief that the Fed has the power to keep rates low, no matter what happens to the economy, and I don't share that faith.
As many of you who have read my blog posts know, I am a reluctant market timer, but ultimately we all time markets, implicitly or explicitly, the former wooing up in how much of your portfolio is in cash and the latter in more overt acts of either protection or bets on market directions. Going into 2021, I have far more cash in my portfolio than I usually do, and for the first time in a long, long time, I have bought partial protection against a market drop, using derivatives. It is insurance, and like all insurance, my best case scenario is that I never need to use it, but it reflects my wariness about what comes next. I am not and don't want to be in the business of doling out investment advice, and I think that the healthiest pathway for you is to make your own judgments on interest rates, earnings growth and acceptable risk premiums, and follow that with consistent actions.
YouTube Video
Spreadsheets
Implied ERP for the S&P 500: January 1, 2021Spreadsheet to value the S&P 500 on January 1, 2021Data Updates for 2021
Data Update 1 for 2021: A (Data) Look Back at a Most Forgettable Year!Data Update 2 for 2021: The Price of Risk!January 12, 2021
Marking Time: A new year, a fresh semester and its class time!
As we approach the turn of the calendar year, I have my own set of rituals that prepare me for the new year. Last week, was my data week, where I download and analyze data on all publicly traded companies, listed anywhere in the world, and I will post extensively on what the numbers look like after a most tumultuous year. I also start thinking about my passion, which is teaching, the spring semester to come, and the classes that I will be teaching, repeating a process that I have gone through every year since 1984, my first year as a teacher. And as always, I invite you come along for the ride.
What I teach...
For a class to resonate and be remembered, it has to be more than a collection of topics, and with each of my classes there is a core narrative that animates and connects the class sessions. If you were to ask me what that narrative was for each of my classes, here is how I would respond.
Corporate Finance: Corporate finance is the development of the first financial principles that govern how to run a business. It is that mission that makes corporate finance the ultimate big picture class, one that everyone (entrepreneurs, investors, analysts, business observers) should take. If it looks like I am over reaching, I start my corporate finance class with the simple proposition that any decision that involves money is a corporate finance decision, and by that definition everything that businesses do falls under its umbrella. To make this operational, I build my class around my big picture of corporate finance:
I tie every session and every topic within each session to this big picture, and while I am willing to and often do abandon models and theories, I am loath to compromise on first principles. Thus, you and I can disagree about whether beta is a good measure of risk, but not on the principle that no matter what definition of risk you ultimately choose, riskier investments need higher hurdles than safer investments. I end the class with a corporate finance version of valuation, where I tie inputs into value (cash flows, growth and risk) to investment, financing and dividend decisions. Valuation: It is unfortunate, but for most people, the vision that comes to mind when I say that I teach valuation is excel spreadsheets and high profile company names. Don't get me wrong! I find Excel to be a solid tool in my arsenal, but I am not only old enough to have valued companies with a ledger sheet and calculator but also wary of letting a tool drive my valuations. If you do take this class, you should recognize that I will almost never open and work with an excel spreadsheet in class (though I do have supplemental YouTube videos on using them in analysis) and my interest is in valuing just about anything, not just large public companies.

In fact, there are three key themes that I emphasize through this class. Price versus Value: The first is that we need to draw a contrast between valuing an investment and pricing it; the former is driven by fundamentals (cash flows, growth and risk) and the latter by demand and supply (with mood, momentum and liquidity often dominating fundamentals). While intrinsic valuation models try to assess value, pricing is built upon what others are willing to pay for similar investments; in the context of stocks, using a PE ratio and a peer group to attach a number to company is a pricing, not a valuation. Value = Story + Numbers: The second is that a good valuation is a bridge between stories and numbers, where every number that you use in a valuation, whether it be expected growth, margin or discount rate, has to be built around a story about the company, and every story you tell about a company (its amazing management, its superior platform or loyal employees) has to show up in a number. I will confess that, as a natural number cruncher, it too me a while to learn this lesson, and I try to pass on how I moved up (and continue to try to do better) the learning curve.Face up to uncertainty, rather than avoid or deny it: Uncertainty is a feature of investing/ business, not a bug. One of my biggest issues with old-time value investing is that it viewed and continues to view uncertainty as something to be avoided as much as possible, and takes the view that you cannot value investments, where there is too much uncertainty. That view has led value investors to focus on mostly mature companies and kept them out of the game of investing in young and growing businesses. I take the point of view that uncertainty should not stop you from valuing companies, that your value estimates will have more error in them, but since the market also faces the same uncertainty, your best bargains may be in the midst of uncertainty. It is for that reason that I spend large portions of this class valuing difficult-to-value companies, in what I call the dark side of valuation.Investment Philosophies: If my classes were children, this class would be my neglected one, since I have never taught it in person at NYU, but it is a class that was born out of an observation. There are only a few investors who have consistently beaten the market over time, and many of them are legendary, but people within this small group are extraordinarily diverse in terms of how they think about markets and investing. That tells me three things. The first and obvious one is that there are no easy ways to beat the market, and anyone who claims to have found one is either lying or heading for a letdown. The second is that the notion that there is only one pathway to investment nirvana is hubris, and that there must be different philosophies that can be successful. The third is that since many of these successful investors have been widely followed, just copying what they do must not work, or we would observe far more imitation Buffets and Simons, who are successful. In this class, I try (and that is all I can do) to provide a full menu of investment philosophies, starting with technical analysis/charting, moving on to value and growth investing (in both public and private forms), and then on trading on public or private information. I close by looking at bookends of the philosophies by looking at arbitrage, where investors chase (and sometimes catch) the dream of guaranteed profits and indexing, where investors come to an acceptance that stock picking does not work.

With each philosophy, I look at strategies that emerge, the historical backing for whether these strategies work and end by looking at the make up that you would need as an investor to be able to succeed with that philosophy. By the end of the class, my objective is not to sell you on the best philosophy but to provide you with a framework where you can find the philosophy that best fits you.I also offer online classes in basic finance (present value, risk models and measures) and accounting (or at least my version of it) as background to my main classes. If you are at all interested in taking any of these classes, and are wondering about sequence, I modified the flow chart that I used in my September 2020 post to lead you through your choices:
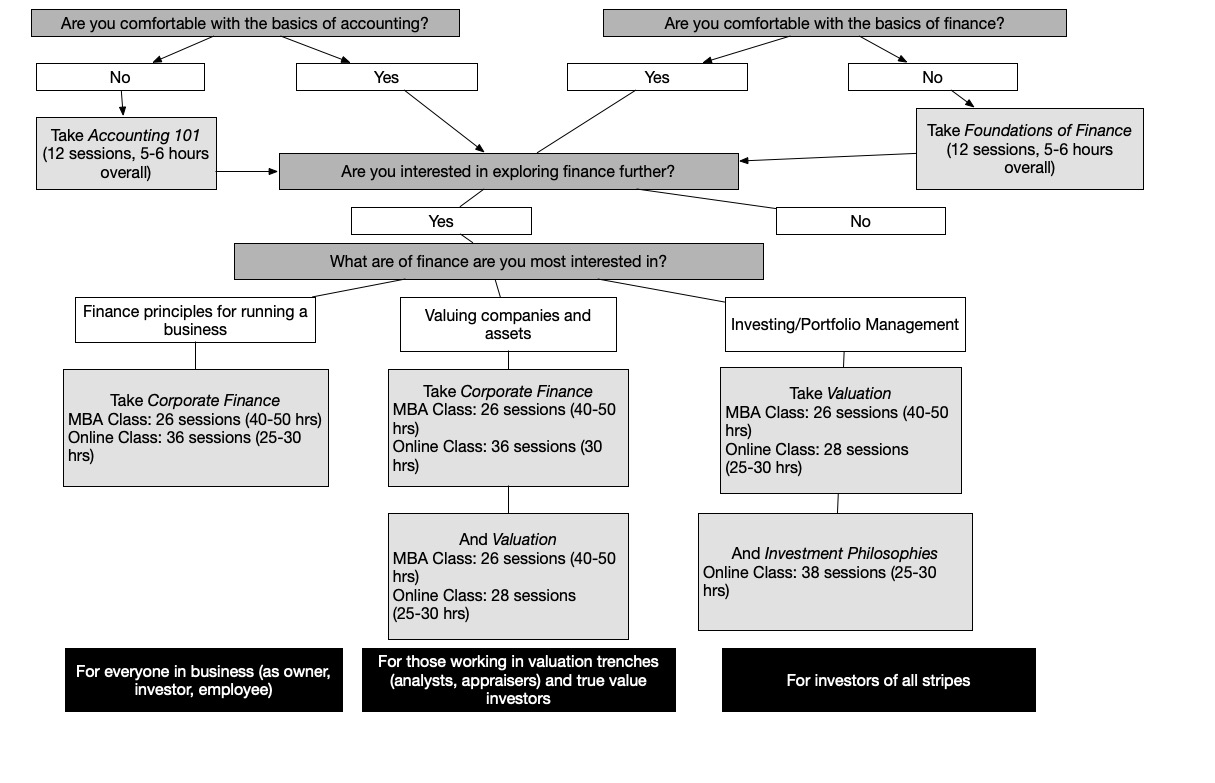 Please recognize that this is just a very rough flow chart, and that you may find pathways through it that meet your needs better.
The Delivery ChoicesIf you decide to take a class or two, there are three platforms that you can pick from, and which one is best for you will depend both on your preferences and objectives:
Corporate Finance: Mondays & Wednesdays, 12.30 pm - 1.50 pm (New York time)Valuation (MBA): Mondays & Wednesdays, 2.00 pm - 3.20 pm (New York time)Valuation (Undergraduate): Mondays & Wednesdays, 3.30 pm - 4.45 pm (New York time)
1. Stern NYU classes: The first, and the one with the deepest roots, are the classes that I teach at the Stern School of Business at NYU to both MBAs and undergraduates. I normally teach these classes, in person, every spring, starting late January/early February and ending early in May. This spring, I will be teaching three classes, a corporate finance class for MBAs and two identical valuation classes, one to MBAs and one to undergraduates, but with the virus still raging out of control, I will be teaching the classes on Zoom. The class times for the coming semester are below:
All three classes start on February 1, 2021 and end on May 10, 2021. To sit on the live classes, you have to be a Stern student enrolled in the class, but I plan to record the classes and you can watch those recordings either on my website or on YouTube (where each class will have its own playlist), and access supplementary material (slides, post-class tests). 2. My (free) online classes: The biggest challenge with following the NYU classes online is that they are not designed as online classes. The lectures are 75-80 minutes long, an eternity for an online experience, where time is measured in seconds, not minutes. I have created 12-15 minute versions of each session, preserving almost 80% of the content in the longer classes, and these online classes are also available on my website or on YouTube. If you do decide to take these classes, there are no hoops to jump through and no cost involved, but there is no credit for classes taken or certification. 3. NYU certificate classes: If it is important to you that you get more structure, more touch and certification, there is a third option. NYU Stern has certificate versions of the online classes on their website. While the content of the free online and certificate classes are almost identical, you get more polished versions of the recorded sessions, once-every-two-weeks live zoom sessions where you can ask me questions and certificate at the end of the class, if you pass the exams/quizzes and complete the project requirements. The cost, though, is definitely not zero, and if you get sticker shock when you check what NYU charges, please remember that I have no control over or negotiation with you on this price.The links to all of these classes are at the end of this post.
COVID Lessons
When I start my teaching in early February, it will be my 58th semester teaching valuation and my 36th teaching corporate finance. Have I changed the way that I teach these classes over the last 36 years? Of course, but with two caveats. The first is the first principles or big pictures that you see for the classes are almost identical to those that I taught my very first semester, which should not surprise you, since that is what makes them first principles. The second is that the changes in content in most semesters has been incremental, building largely on the material from the previous one, with more timely data and a few augmentations. That said, since I believe that you should be able to value companies in the real world , each crisis that I have lived and taught through has left its imprint on classes, sometimes altering ways in which I approach estimating and sometimes altering the way I think about fundamentals. The dot com boom of the 1990s forced me to expand my valuation tools and models to cover younger companies, often with lots of potential and very little historical data. I am open about the fact that I learned to value young company through my struggles in valuing Amazon in 1998 and 1999. The dot com bust crystallized my views on the contrast between valuing and pricing an asset, and how behavioral finance can explain why the two diverge and what causes eventual convergence. The 2008 market crisis taught me that globalization had grayed the once bright lines between developed and emerged markets and the capacity for failures at some companies to spill over into other companies and sometimes the entire market. The last decade, with it influx of user based companies and technology platforms forced me to think seriously about how to value a user, subscriber or rider and extrapolate from there to company value. During 2020, as I watched companies and investors struggle with the after shocks of the economic shut down created by COVID, I wrote a series of fourteen posts (linked below) on what I was learning, unlearning and relearning about corporate finance and valuation. Unlike some market watchers, who have been quick to label the market as crazy, speculative or a bubble, I believe that the movements in market value across companies, regions and sectors have implications for how businesses should be run as well how investors price these companies: table.tableizer-table { font-size: 12px; border: 1px solid #CCC; font-family: Arial, Helvetica, sans-serif; } .tableizer-table td { padding: 4px; margin: 3px; border: 1px solid #CCC; } .tableizer-table th { background-color: #104E8B; color: #FFF; font-weight: bold; }
COVID lessonBasisCorporate FinanceValuationInvestment Philosophies The price of risk is dynamic and volatileBoth equity risk premiums & default spreads went on a wild ride in 2020Companies need hurdles rates (costs of equity & capital that change to reflect market levels.Discount rates in intrinsic valaution have to change to reflect current market conditions, and can be expected to change over time.Investors need to reassess their expected returns to reflect risk free rates & current ERP & default spreads. Flexibility is an asset (and has value)Young firms with low capital intensity and more variable cost structures did much better during the crisis than their more capital intensive, high fixed cost counterparts.When investing, companies have to explicitly incorporate flexiblity into decision making, sometimes taking lower NPV, more flexible projects over high NPV, less flexible investments.Value has to incorporate the value of flexibility, explicitly through the use option pricing models or implicitly, when comparing pricing multiples across companies.Investment strategies that create concentrations in manufacturing and captial intensive companies need to be balanced with firms that have more flexible cost structures. Debt can handcuff even large, established companies & put them at risk.In the early days of the crisis, established firms like Boeing found themselves in the crosshairs, partly because of their heavy debt loads.The assessment of how much to borrow has to factor in distress costs much more explicitly, and more value should be attached to keeping a safety buffer.Since it is very difficult, if not impossible, to incorporate failure risk in a DCF, more effort should be put into estimating the probability of failure and its consequences.Strategies that concentrate investments in companies with high failure risk (start ups and indebted firms) have to compensate by holding more cash or buying protection against market shocks.In my valuation class, I will bring in some of the valuations that I did, both of the market (S&P 500) and individual companies during the crisis to illustrate how story telling was key to getting past the near-term uncertainty created by the shut down. In my investment philosophies class, I plan to talk about how the crisis shook my faith and what I had to do to find serenity.YouTube Video
Class Links
Corporate Finance MBA class (Spring 2021): On my website and YouTube PlaylistValuation MBA class (Spring 2021): On my website and YouTube PlaylistValuation Undergraduate class (Spring 2021): On my website and YouTube PlaylistFoundations of Finance Online class (Free): On my website and YouTube PlaylistAccounting Online class (Free): On my website and YouTube PlaylistCorporate Finance Online class (Free): On my website and YouTube PlaylistValuation Online (Free): : On my website and YouTube PlaylistInvestment Philosophies Online class (Free): : On my website and YouTube PlaylistNYU Corporate Finance Certificate class (Definitely not free & offered only in fall 2021)NYU Valuation Certificate class (Definitely not free)NYU Investment Philosophies Certificate class (Definitely not free)Viral Market Update PostsA Viral Market Meltdown: Fear or Fundamentals?A Viral Market Meltdown II: Pricing or Valuing? Investing or Trading?A Viral Market Meltdown III: Clues in the Market DebrisA Viral Market Meltdown IV: Investing for a post-virus EconomyA Viral Market Meltdown V: Back to BasicsA Viral Market Meltdown VI: The Price of RiskA Viral Market Update VII: Market MultiplesA Viral Market Update VIII: Value vs Growth, Active vs Passive, Small Cap vs Large!A Viral Market Update IX: A Do-it-Yourself S&P 500 ValuationA Viral Market Update X: A Corporate Life Cycle PerspectiveA Viral Market Update XI: The Flexibility PremiumA Viral Market Update XII: The Resilience of Private Risk CapitalA Viral Market Update XIII: The Strong (FANGAM) get Stronger!A Viral Market Update XIV: It's a wrap, premature or not!January 9, 2021
Data Update 1 for 2021: A (Data) Look Back at a Most Forgettable Year (2020)!
I spent the first week of 2021 in the same way that I have spent the first week of every year since 1995, collecting data on publicly traded companies and analyzing how they navigated the cross currents of the prior year, both in operating and market value terms. I knew that this year would be more challenging than most other years, for two reasons. The first was that the shut down of the global economy, initiated by the spreading of COVID early last year, had significant effects on the operations of companies in different sectors, and across the world. The second was that, starting mid-year in 2020, equity markets and the real economy moved in different directions, with the former rising on the expectations a post-virus future, and the latter languishing, as most of the world continued to operate with significant constraints. In this post, I will start with a rationalization of why I do this data analysis every year, follow up with a description (geographic and sector) of the overall universe of companies that are in my analysis, list out the variables that I estimate and report, and conclude with a short caveat about 2020 data.
Data: A Pragmatist View
We live in the age of data worship, where investors, analysts and businesses all seem to have bought into the idea that big data has answers for every question and that collecting the data (or paying for it) will create positive payoffs. I am a skeptic and I have noted that to make money on big data, two conditions have to be met:
If everyone has it, no one does: I believe that if everyone has a resource or easy access to that resource, it is difficult to make money off that resource. Applying that concept to data, the most valuable data is unique and exclusively available to its owner, and the further away you get from exclusivity, the less valuable data becomes. Data is not dollars: Data is valuable only if it can be converted into a product or service, or improvements thereof, allowing a company to capture higher earnings and cash flows from those actions. Data that is interesting but that cannot be easily monetized through products or services is not as valuable.All of the data that I use in my data analysis is in the public domain, and while I am lucky enough to have access to large (and expensive) databases like Bloomberg and S&P, there are tens of thousands of investors who have similar access. Put simply, I possess no exclusivity here, and staying consistent with my thesis, I don't expect to expect to make money by investing based upon this data. So, why bother? I believe that there are four purposes that are served:Gain perspective: One of the challenges of being a business or an investor is developing and maintaining perspective, i.e., a big picture view of what comprises normal, high or low. Consider, for instance, an investor who picks stocks based upon price to book ratios, who finds a stock trading at a price to book ratio of 1.5. To make a judgment on whether that stock is cheap or expensive, she would need to know what the distribution of price to book ratios is for companies in the sector that the company operates in, and perhaps in the market in which it is traded. Clear tunnel vision: Investors are creatures of habit, staying in their preferred markets, and often within those markets, in their favored sectors. Equity research analysts are even more focused on handfuls of companies in their assigned industries. So what? By focusing so much attention on a small subset of companies, you risk developing tunnel vision, especially when doing peer group comparisons. Thus, an analyst who follows young technology companies may decide that paying ten times revenues for a company is a bargain, if all of the companies that he tracks trade at multiples greater than ten times revenues. Nothing is lost, and a great deal is gained, by stepping back from your corner of the market and looking at how stocks are priced across industries and markets.Expose BS: I know that everyone is entitled to their opinions, but they are not entitled to their facts. I am tired of market experts and analysts who make assertions, often based upon anecdotal evidence and plainly untrue, to advance a thesis or agenda. Are US companies more levered than they were a decade ago? Do US companies pay less in taxes than companies in other parts of the world? Are companies that buy back stocks more financially fragile than companies that do not? These are questions that beg to be addressed with data, not emotions or opinions. (I know.. I know... You would like those answers now, but stay tuned to the rest of my data updates and the data will speak for itself.)Challenge rules of thumb and conventional wisdom: Investing has always had rules of thumb on how and when to invest, ranging from using historical PE or CAPE ratios to decide if markets are over valued, to simplistic rules (eg. buy stocks that trade at less than book value or trade at PEG ratios less than one) for individual stocks. It is very likely that these rules of thumb were developed from data and observation, but at a different point in time. As markets and companies have moved on, many of them no longer work, but investors continue to use them. To illustrate, consider a practice in valuation, where analysts are trained to add a small cap premium to discount rates for smaller companies, on the intuition that they are riskier than larger companies. The small cap premium was uncovered in the the early 1980s, when researchers found that small cap stocks in the US earned significantly higher returns than large cap stocks, based upon data from 1926 to 1980. In the decades since, the small cap premium has disappeared in returns, but inertia and laziness have kept the practice of adding small cap premium alive.In closing, I also want to dispense with the notion that data is objective and that numbers-focused people have no bias. If you have a bias or a preconception, it is amazing how quickly you can bend the data to reflect that bias or preconception. As an exercise, take a look at my updated industry averages for taxes paid by US companies in 2021. From past experience, I predict that numbers in this table will be quoted by journalists, economists and even politicians, with very different agendas, but the tax rate measure (since I report several different measures) that they quote will reflect their biases. Put simply, if you find my data quoted elsewhere, I would suggest that you visit the source and make your own judgments.The SampleThe focus in markets is often on subsets of firms, usually with good reason. In general, larger firms (especially in market value terms) get more attention that smaller ones, because their movements in their value are more consequential for more investors Also, publicly traded firms generally garner more attention than privately owned businesses, partly because they are larger, but also because there are is more information disclosed and investment opportunity with the former. Finally, fair or not, companies in developed and more liquid markets are in the spotlight more than their counterparts in emerging markets. That said, focusing on just large or developed market companies can create biased samples and skew assessments about market and operating performance. It is to avoid this that I started by looking at all publicly traded companies that were traded on January 1, 2021, and arrived at a sample of 46,579 firms, spread across 136 countries.
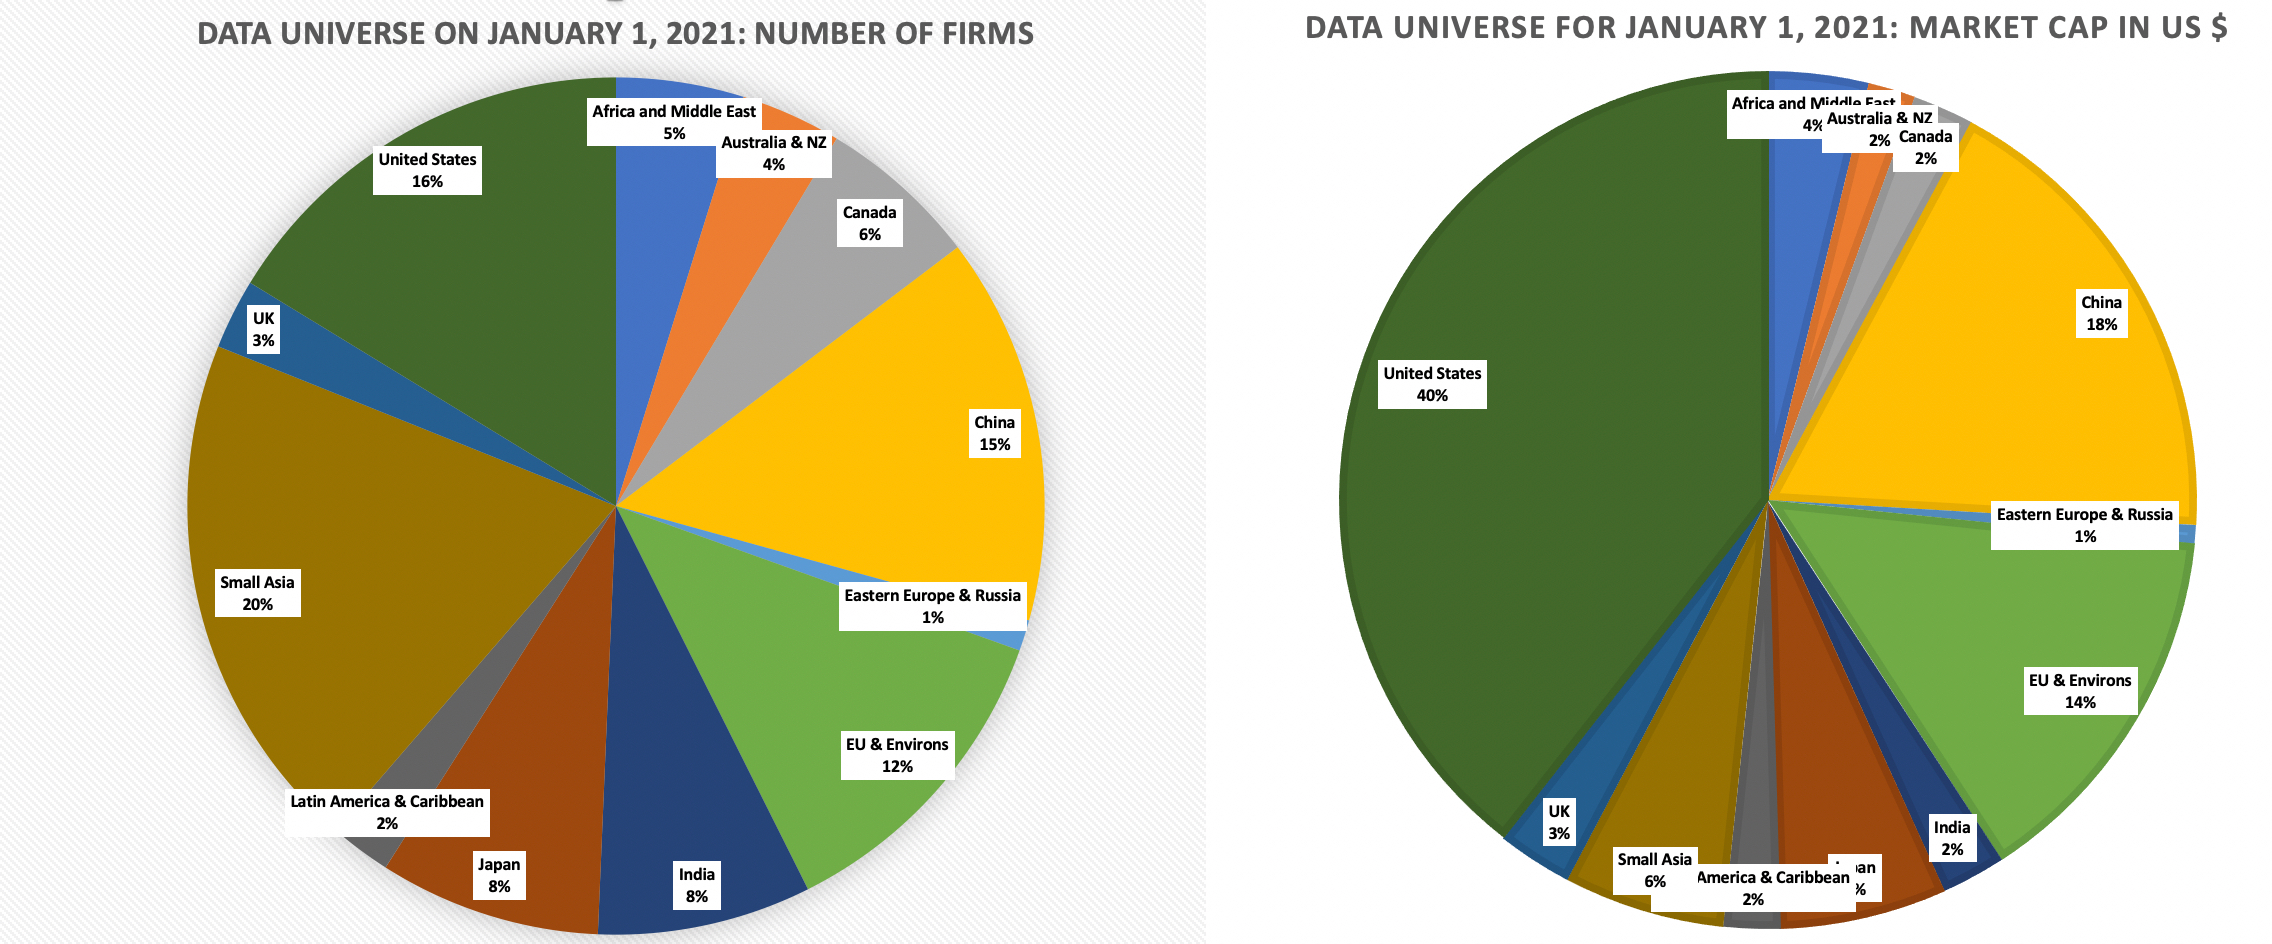 While the universe of companies is diverse, with approximately half of all firms from emerging markets, it is more concentrated in market capitalization, with the US accounting for 40% of global market capitalization at the start of the year. Using the S&P categorization of global companies into sectors, the data universe looks as follows:
 It should come as no surprise, especially given their performance over the last year, that the technology sector is the largest in terms of market capitalization. While some of the companies in this data trace their existence back decades, there is a healthy proportion of younger companies, many in emerging markets and new industries.

Finally, it is worth noting that, notwithstanding the travails of last year, the number of firms in the data universe increased from 44,394 firms at the start of 2020 to 46,579 firms, a 4.9% increase over the year, as new listings outnumbered companies that defaulted during the course of the year.
If there is a hole in my sample, it is the absence of privately owned businesses. One reason is that these businesses are not only not required to publicly disclose their financial details in most parts of the world, but often follow more malleable accounting standards, making the data less reliable and comparable. The other is that even in those parts of the world, where private company information is available, the data is limited and market price data is missing (since the companies are not traded). That said, it does mean that any broad conclusions (about profitability and revenues) that emerge from my data apply to public companies, and it may be dangerous to extrapolate to private businesses, especially in a year like 2020 where private businesses could have been affected more adversely by COVID shutdowns than public companies.
The DataAs more data has become publicly available, and access to the data becomes easier, the challenge that we face in investing and valuation is that we often have too much data, and information overload is a clear and present danger. In this section, I will list the data that I estimate and report, as well as explain how I consolidate company-level data into more usable group statistics.
General DetailsWhile there are advantages to looking across all firms, small and large, listed anywhere in the world, there are challenges that come from casting such a wide net. I have tried my best to keep them from overwhelming the analysis, and in the interests of openness, here are some of the details:Currency: One of the challenges of dealing with a global sample is that you are working with accounting and market numbers quoted in multiple currencies, and since you cannot aggregate or average across them, I will employ two techniques. First, all value numbers (like market capitalization, debt or revenues) that I aggregate or average will be converted into US dollars to ensure currency consistency. Second, most of the numbers that I report will be ratios, where the currencies are no longer an issue; a PE ratio for a Turkish company, with market cap and earnings denominated in Turkish Lira, can be compared to the PE ratio for a US company, with market cap and earnings denominated in US $. It is true that the Turkish company will face more risk because of its location, but that is an issue separate from currency.Missing Data: Information disclosure requirements vary across the world, and there are some data items that are available for some companies or some markets, and not for others. Rather than remove all firms with missing data, which will eliminate a large portion of my sample, I keep the firms in the sample and report only the variable/metric that is affected by the missing item as "NA". For instance, I have always computed the present value of lease commitments in future years and treated that value as debt, a practice that IFRS and GAAP have adopted in 2019, but that computation requires explicit disclosures of lease commitments in future years. That is standard practice in the United States, but not in many emerging markets, but rather than not do the computation for all companies or remove all companies with missing lease commitments, I compute lease debt for those companies that report commitments and report it as zero for those companies that do not, an imperfect solution but the least imperfect of the many choices.Accounting Differences: In addition to disclosure differences, there are also accounting differences in revenue recognition, expensing rules, depreciation methods and other details across markets. I work with the publicly available data, recognizing that net income for a Japanese company may be measured differently than earnings for an Indian company, and accept that this may skew the results. However, it is worth noting that accounting rules around the world have converged over the last four decades, and they share a lot more in common than they have as differences.Source Reliability and Errors: I obtain my raw data from S&P, Bloomberg and others, and I am grateful that I can do that, because I could never hand collect and input data on 40,000+ companies. They, in turn, obtain the data from computerized databases in different markets that collect public filings, and at every stage in this process, there is the possibility of errors. I do run some simple error checks to eliminate obvious mistakes, but I am sure that there are others that I miss. My defense is that, unless the mistake is on a very large scale, the impact it has on my group statistics is small, simply because of my sample size. In addition, there is also the possibility of accounting fraud in some companies, and there is little or nothing that can be done about them.I am not trying to pass the buck or evade responsibility for any mistakes that persist but if you do find odd looking values for some variables that I report, especially for small samples, take them with a grain of salt.
Macro DataI do not report much macroeconomic data for two reasons. The first is that I do not have a macro focus, and my interests in macro variables occur only in the context of corporate finance or valuation issues. The second is that there are great (and free) sources for macro economic data, ranging from the Federal Reserve (FRED) to the World Bank and I don’t see the point of replicating something that they already do well. The macro variables that I track on my site relate to the price of risk, a key input into valuation, in both equity and debt markets:US Equity Risk Premiums: The equity risk premium is the price of risk in equity markets. In my view, it is the most comprehensive measure (much more so than PE ratios or other pricing multiples) of how stocks are being priced, with a higher (lower) equity risk premium correlating with lower (higher) stock prices. The conventional approach to measuring this premium is looking at past returns on stocks and treasuries (or something close to riskfree) and measuring the difference in historical returns and I report the updated levels (through 2020) for historical premiums for stocks over treasuries in this dataset. I have argued that this approach is both backward looking and static, and have computed and reported forward-looking and dynamic equity risk premiums, based upon current stock price levels and expected future cash flows; you can find both the current level and past values in this dataset. Country Risk Premiums: In a world where both investing and business is globalized, we need equity risk premiums for markets around the world, not only to value companies listed in those markets, but also to value companies that have operations in those countries. I will not delve into the details here, but I use the same approach that I have used for the last 30 years to estimate the additional risk premiums that I would charge for investing in other markets to get equity risk premiums for almost every country in the world in this dataset. Bond Default Spreads: The bond default spread is the price of risk in corporate bond (lending) markets, and as with the equity risk premium, higher (lower) spreads go with lower (higher) corporate bond prices. In the same dataset where I compute historical equity risk premiums, I report historical returns on corporate bonds in two ratings classes (Moody’s Aaa and Baa ratings). I also report estimates of the default spreads based upon current yields on bonds in different ratings classes and the current riskfree rate.I am not an interest rate prognosticator, but since today’s low rate environment seems to have made everyone a forecaster of interest rates, I do compute an intrinsic version of the US treasury rate and compare it to current levels in this dataset.
Micro DataThe focus of my data collection is understanding how companies are operating and how investors are pricing them. That said, you will not find individual company data on my site for two reasons. The first is that I bear a responsibility (ethical and legal) to my raw data providers to not undercut their businesses by giving away that data for free. The second is that you don’t need my site or any public site to get data on an individual company; if you want to get data on a company, there is no better way to do it than go to the source, which is the company’s annual or quarterly filings. To understand and use the data, here are some specifics that you may (or may not) find useful:Industry: Data can be consolidated by geography, industry or company size, and I use all three, to some extent or the other. My primary consolidation is by industry and I break down my sample of 46,579 firms into 94 industry groupings. To make this classification, I start with the industry classifications that are in my raw data, but create my own industry groups, again to prevent stepping on the toes of my data providers. I know that this description is opaque, but the best way to understand my industry groups is to go , where I report the companies that I include in each industry. Geography: There is one dataset where I look at companies broken down by country, and I report a number of different statistics for 136 countries. I would caution you to take this data with a grain of salt, since there are only a handful of listings in some country. I do report much more data for a broader geographical classification, where I classify firms into six broad geographical groupings: Note that while emerging markets is a very large and diverse group, I do report statistics for India and China, two of the bigger components, separately.Averaging: I hope it does not sound patronizing, but I want to explain how I compute group values (averages), because it is not as obvious as it sounds. To illustrate why, consider the challenge of computing the PE ratio for companies in the software industry. You could compute the PE ratio for each company in the group and take a simple average, but that approach has two problems. First, it weights small firms as much as large firms, and outliers can cause the average to take on outlandish values. Second, it eliminates firms that have negative earnings (and thus have no PE ratios) from the sample, potentially creating biased samples. Using a weighted average PE ratio can counter the first problem and using a median can reduce the outlier effect, but neither approach can deal with the second problem (of sample bias). For most of my industry averaging, I use an aggregation approach, where I compute ratios using aggregated values; to compute the PE ratio for chemical companies, I add up the market capitalizations of all chemical companies and divide that number by the aggregate net income of all chemical companies (including money losers). This ensures that (a) all companies are counted, (b) the computed number is weighted since larger companies contribute more to the aggregate and (c) the risk of outliers is reduced, since it is less likely to occur in a large sample than for an individual firm.Current data: The focus of this data update is to report on how companies did in 2020, rather than to provide historical time series. Since I am updating the data in early January 2021, and the complete numbers for 2020 will not be available until March or April at the earliest, I will be using the trailing twelve month numbers for operating variables (like revenues and operating income) to compute ratios. For accounting numbers, that will effectively be the twelve months through September 30, 2020, that will be captured in the data. This practice of focusing on current data can cause the computed numbers to be volatile, but I do have the archived data going back in time (more than 20 years in the US, less for other parts of the world) at this link.VariablesI confess that I have a primary constituency when I think of the variables that I would like to estimate, and that (selfishly) is me. Since my interests lie in corporate finance and valuation, the statistics that I compute are numbers that I will find useful when doing a corporate financial analysis or valuation of a company. Since I compute and report on dozens of variables, the best way of summarizing what you will find on my website in the following picture:

With each variable, I report the industry averages by geography. With cost of capital, for instance, I report the cost of capital by industry for the US at this link, and datasets that can be downloaded by geography: Europe, Emerging Markets (China and India), Australia, NZ & Canada, Japan & Global).
COVID EffectsI would normally not belabor the fact that my data is focused on the most recent year, but 2020 was an unusual year. Starting in February and extending for most of the rest of the year, the economic shutdown created turmoil in both financial markets an the real economy. While markets, for the most part, have recovered strongly, large segments of the real economy have not. Consequently, there are a couple of considerations if you use this year’s numbers:
COVID effects: To capture how COVID has played out in different sectors and geographies, I computed the changes in aggregate market capitalization during 2020 broken down by sub periods (1/1/20 - 2/14, 2/14- 3/20, 3/20 - 9/1 and 9/1 - 12/31/20), reflecting the ups and downs in the overall market. I also looked at the change in revenues and operating income over the last twelve months (October 2019 - September 2020) compared to revenues in the year prior (October 2018 - September 2019). Since the worst effects of the crises were in the second and third quarters of 2020, this comparison should provide insight into how much damage was wrought by the viral shutdown. Just as a preview of how consequential the year was for stock prices, take a look at the median percentage change in market capitalization in the table below:

I will come write more extensively about the COVID effects in a future post, but you can see the data for US companies, broken down by industry, by clicking here, ands you can also download the data for other geographies here: Europe, Emerging Markets (China and India), Australia, NZ & Canada, Japan & Global.Operating metrics: My computations for operating margins and accounting returns (returns on equity and capital) reflect the COVID effect on earnings in 2020, and not surprisingly, you will see that their values are much lower for the most damaged sectors (restaurants, airlines) than in prior years. If you are comparing across companies in these sectors, that may not be an issue, but if you are valuing companies and want to find a target value for margins or accounting returns, you will be better served using my archived values for these variables from 2019.Pricing metrics: I compute and report a range of pricing multiples from PE ratios to Enterprise Value (EV) to sales ratios, but as with the operating metrics, COVID has left its imprint on the numbers this year. As market capitalizations have quickly retraced their losses, but operating variables have not, the multiples reflect that disconnect. They are either not meaningful in some sectors, which are reporting aggregated losses, or at elevated levels in others (where the collective earnings are down significantly, but market values are not). Again, while this should not be an issue with cross company comparisons, there are two cautionary notes. The first is that investors who come in with strong preconceptions of what comprises cheap or expensive in pricing ratio terms or historic norms will find that everything looks exorbitantly priced. The other is that you will lose large segments of your peer groups if you stick with multiples like PE ratios for comparisons, since so many companies will be money losing.Access and Use of DataI know that the numbers (in terms of companies and variables) makes this data update sound like daunting work, but I will make a confession. I enjoy the process, even including the messy details, and it prepares me for the year to come. In fact, the time that this aggregated data saves me through the year, when I value and analyze companies, represents a huge multiple of the time I spend putting it together. Put simply, if you are tempted to anoint me for sainthood for sharing my data, you are overreaching because I would do it anyway, and sharing it costs nothing, while potentially benefiting you. If you decide to use the data, here are some things that I hope you will consider:Data access: The data is accessible on my website, if you click on data. The data for 2020 is available under current data, and data from previous years under archived data. If you do click on current data, you will see the data classified into groupings based upon how I see the world (corporate governance, risk, investment returns, debt, dividends and pricing). You can see the data online for US companies by clicking on the links next to the data item, but I would strongly recommend that you download the excel spreadsheets that contain the data instead. Not only will this let you access data for other geographical regions, but each excel spreadsheet includes descriptions of the variables reported in that dataset and many include short YouTube videos explaining the data.Data Use: I know that those who download my data use it in many different contexts. If you use it at their jobs as corporate finance or equity analysts, I am glad to take some of that burden off you, and I hope that you find more enjoyable uses for the time you save. If you use my data to buttress an argument or debunk someone else’s, I wish you the best, as long as you don’t make it personal. If you use is it to back your case in legal settings, go ahead, but please do not involve me formally. I believe that courts are a graveyard for good valuation practices and while I do not begrudge you, I have no interest in playing that game.Data Questions: If you have a question about how a variable is computed, please check the website first, since the question has probably been answered already, but if you cannot find that answer, you know how to find me, and I will try to address your issues. As I mentioned earlier, the excel spreadsheets that contain the data include the descriptions of how I compute the variables.Suggestions and Complaints: Before you send off angry or impassioned emails to my team, about my data, you should know that this team has only one member and it is me. I am not a full time data service, and I cannot provide customized data solutions. If you find a mistake in a computation or a typo, please do let me know, and I will fix the error, perhaps not as quickly as you would like me to, but I will.In sum, I hope you find the data that I provide useful. In the next month, I will add about a dozen posts on what I see in the data, but I will do so with the recognition that change is the only constant and that assuming that things always revert back to historic norms is not an investment philosophy.
YouTube Video
Data Updates for 2021Data Update 1: A (Data) Look Back at a Most Forgettable Year!
December 2, 2020
The Sharing Economy come home: The IPO of Airbnb!
Setting the Table
As with any valuation, the first step in valuing Airbnb is trying to understand its history and its business model, including how it has navigated the economic consequences of the COVID. In this section, I will start with a brief history of the company, move on to reviewing its financials leading into 2020, and then look at how it has performed in 2020. I will end the section by looking at information disclosed in the recent prospectus filing that provides insights into the company’s journey to its initial public offering.
Timeline of Airbnb
Airbnb's roots go back to 2007, when during an industrial design conference in San Francisco, Brian Chesky and Joe Gebbia realized that there were opportunities for homeowners to rent their homes to visitors, and created a company called AirBed & Breakfast. Joined in 2008, by Nathan Blecharczyk, a Harvard graduate and technical architect, AirbedandBreakfast.com was born and later renamed Airbnb. In subsequent years, the company grew, with multiple rounds of funding from venture capital. Along the way, investors in the company rapidly escalated their pricing of the company from $1 billion in 2011 to $10 billion in 2014 to more than $30 billion in 2016. The time line below captures some (but not all) of the highlights in Airbnb’s history:

While the company has been able to hit new milestones of growth each year, there are two challenges that it has faced along the way, that need to be incorporated into any valuation you attach to the company today. Legal Challenges: The company has faced multiple challenges from cities that feel that its business model violates local zoning laws and regulations, and evades taxes. While you can attribute some of this pushback to hotel company lobbying and the inertia of the status quo, there is no doubt that Airbnb, like Uber, pushes regulatory and legal limits, taking action first and asking for permission later. While Airbnb has found a way to co-exist with laws in different cities, the restrictions they face vary widely across the world, with some locations (like New York) imposing much more stringent rules than others.Acquisitions: As the number of hosts and guests on Airbnb have climbed over the years, the company has invested in building a more robust platform for its rentals. While some of that money has been spent on internal improvements, much of it has been spent acquiring more than two dozen companies, most of them small, technology businesses.
Business Model
Airbnb's primary business model connects hosts who own houses and apartments with guests who want to rent them for short term stays, while providing a secure and easy-to-use platform for search, reservations, communications and payments. That said, though, it is worth peeking under the hood to see how this business model plays out as revenues and earnings. In the picture below, I look at the Airbnb business model, both in its original form (which still holds for hosts renting their own houses or apartments) and professional hosts (who own multiple units or even operate small hotels), a model it introduced recently and is still transitioning into:
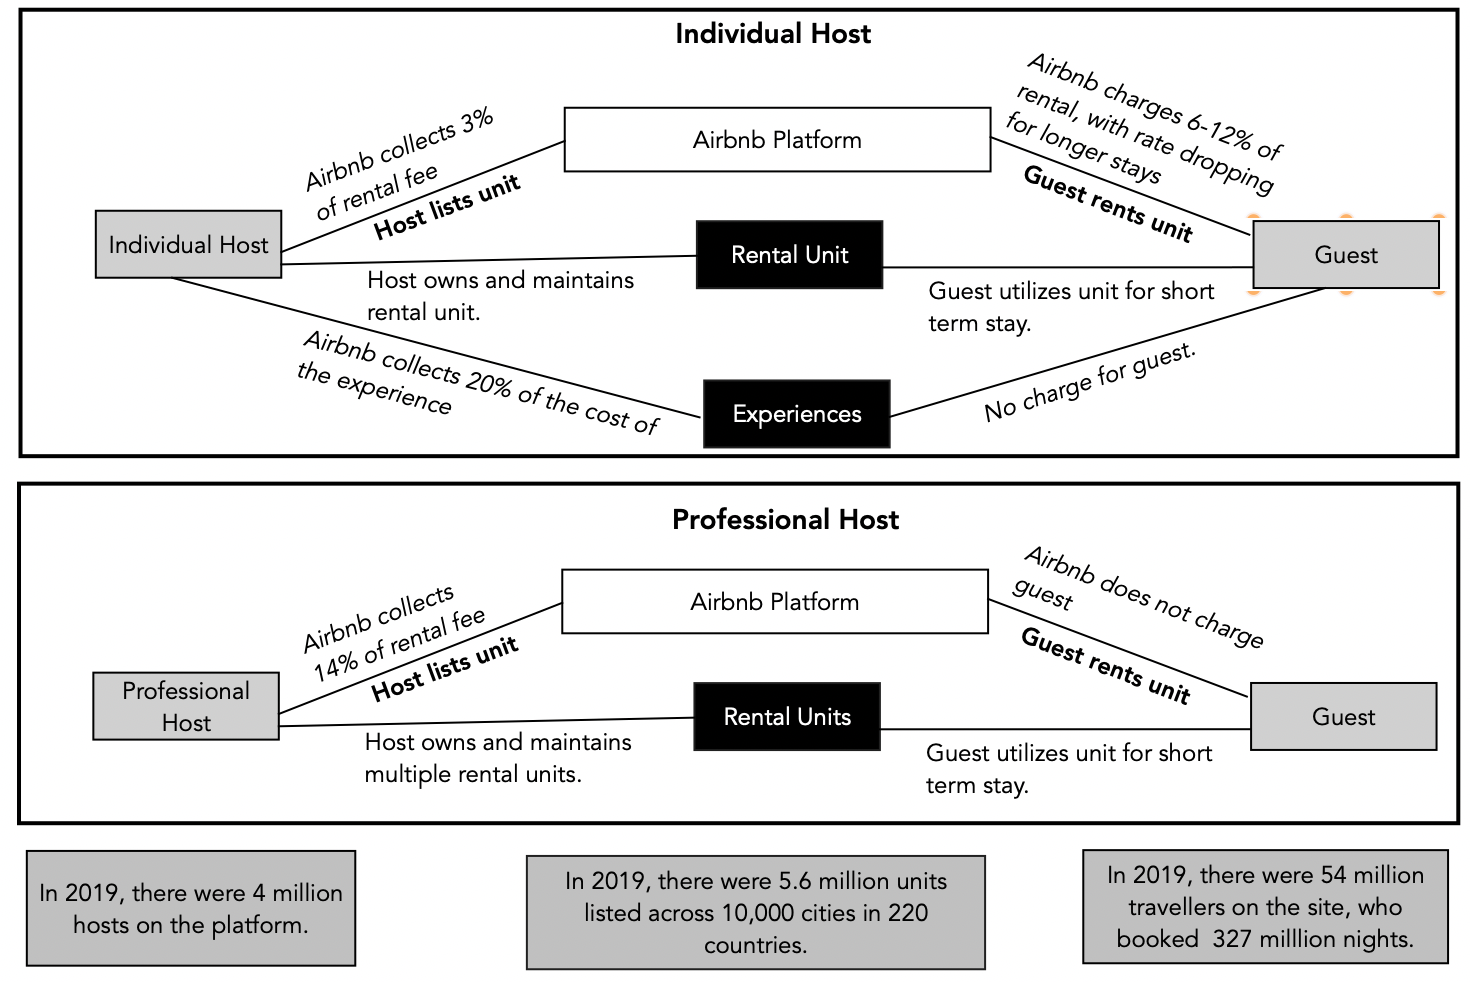
In both versions of the model, Airbnb's revenues come from fees collected on rentals, with both the host and the guest paying in the individual host version, but only the host paying in the professional host version. In 2016, Airbnb extended the model, allowing hosts to offer experiences to their guests, for a fee, with Airbnb keeping 20% of the payment. While the concept was heavily promoted, it has been slow to take off, with only $10 million in sales in 2017, but Airbnb has not given up, hiring Catherine Powell, a Disney theme park executive in 2020, to revamp the business.
The Financials, leading into 2020
The proof of a business is in the numbers, and Airbnb, in addition to posting impressive numbers on hosts, listings and guest nights, has also seen financial results from that growth. In the graph below, I look at gross bookings (the total amount spent by guests on their rentals), revenues to Airbnb from these booking (in dollar values and as a percent of gross bookings) and operating profitability, in dollar and percentage terms:
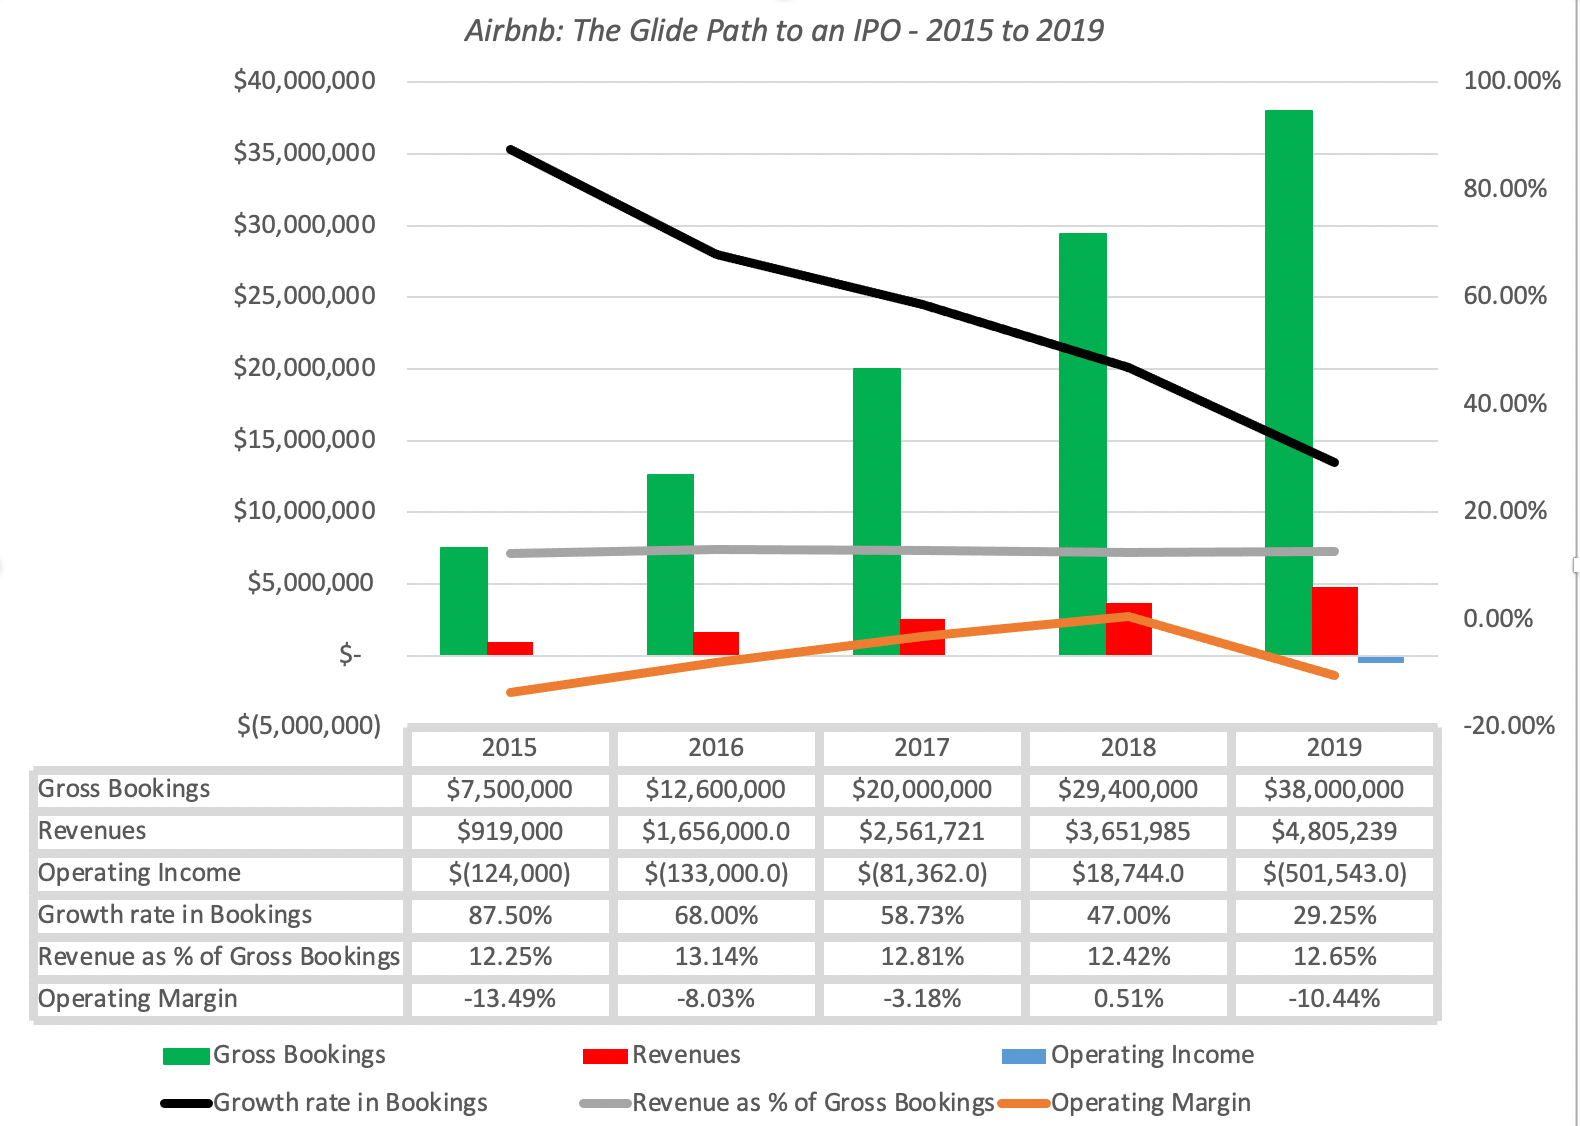 Source: Airbnb Prospectus (November 16, 2020)
Taking a closer look at the numbers, here are some preliminary features that stand out:
Growth is high, but the rate is declining: It may seem churlish too take issue with a company that has grown its revenues more than five fold over a five-year period, but as the company's base gets bigger, its growth rate, not surprisingly, is also declining. By the start of 2020, Airbnb had already become one of the largest players in its market of vacation and travel rentals, a sign of success, but also a crimp on future growth.Airbnb's revenue share has stayed stable: As gross bookings have increased, Airbnb's share of these bookings has remained stable, ranging from 12-13% of overall revenues. Note that the shift to the new business model for professional hosts (where Airbnb keeps 14% of the transaction revenue) is relatively recent, and it will take some time for that change to play out in the numbers. In addition, growth in the experiences business will also push this metric upwards, since Airbnb keeps a 20% share of those revenues.The company is edging towards profitability: To Airbnb's credit, it is closer to profitability than many of its high profile sharing-economy predecessors (such as Uber and Lyft) and the fact that it was able to report positive operating profits, albeit fleetingly in 2018, without playing the adjusted earnings game (where companies add back stock based compensation and other items to their bottom line to claim fictional profitability) puts them ahead of the pack.In summary, coming into 2020, Airbnb was delivering a combination of growth driven by disruption and a pathway to profitability that made them a prime candidate for a public offering.The COVID effect
I don’t think anyone expected 2020 to be the year that it was, and even in hindsight, it has been full of unwelcome surprises for individuals and businesses. While there were news stories about the virus for the first few weeks of 2020, they centered either on China or passengers on cruise ships that had been exposed to the virus. Once the virus made its presence felt elsewhere, in February and March, countries responded with partial and full economic shut downs that hurt all businesses. The travel business was particularly exposed, as people curtailed flying and traveling to distant destinations, and Airbnb was hurt badly in 2020, as can be seen in the graphs below:
 Source: Airbnb Prospectus
The graph to the left looks at the effect of COVID on gross bookings and cancellations (in millions of nights), with the net bookings representing the difference. Note that cancellations exceeded bookings in March and April, at the height of the global shutdown, but have come back surprisingly well in the months after. In the graph to the right, you can see the effects on the financials, in a comparison of first nine months of 2019 to the first nine months of 2020, with gross bookings dropping 39% and operating losses almost tripling over the period.
The Prospectus Revelations
If Airbnb had broached the idea of a public offering in March and April, where the numbers were not just dire but potential catastrophic, it is likely that they would have been laughed out of the market. There are two factors that may have led Airbnb to reassess their prospects and file for a public offering now.
It’s relative: The first is that it was not just Airbnb that felt the pain from the economic shut down. As we will see in the next section, the hotel and travel booking businesses were damaged even more than Airbnb, because of their large asset bases and debt levels. In relative terms, Airbnb might emerge from the COVID crisis, than going into it. Rebound:The second is that business returned stronger than most had anticipated in 2020, with third quarter numbers coming in above expectations, and markets rebounded even more strongly with stocks recouping all of their early losses. When Airbnb filed its prospectus with the SEC on November 16, I don't think that there were many who were surprised at the timing. While Airbnb's general financial performance has been mostly public for the last few years, the prospectus provides more detail as well as guidance on governance and the terms of the offering.Pathway to Profitability: Digging through Airbnb's financials over the last five years, and breaking down the expenses, here is what we see: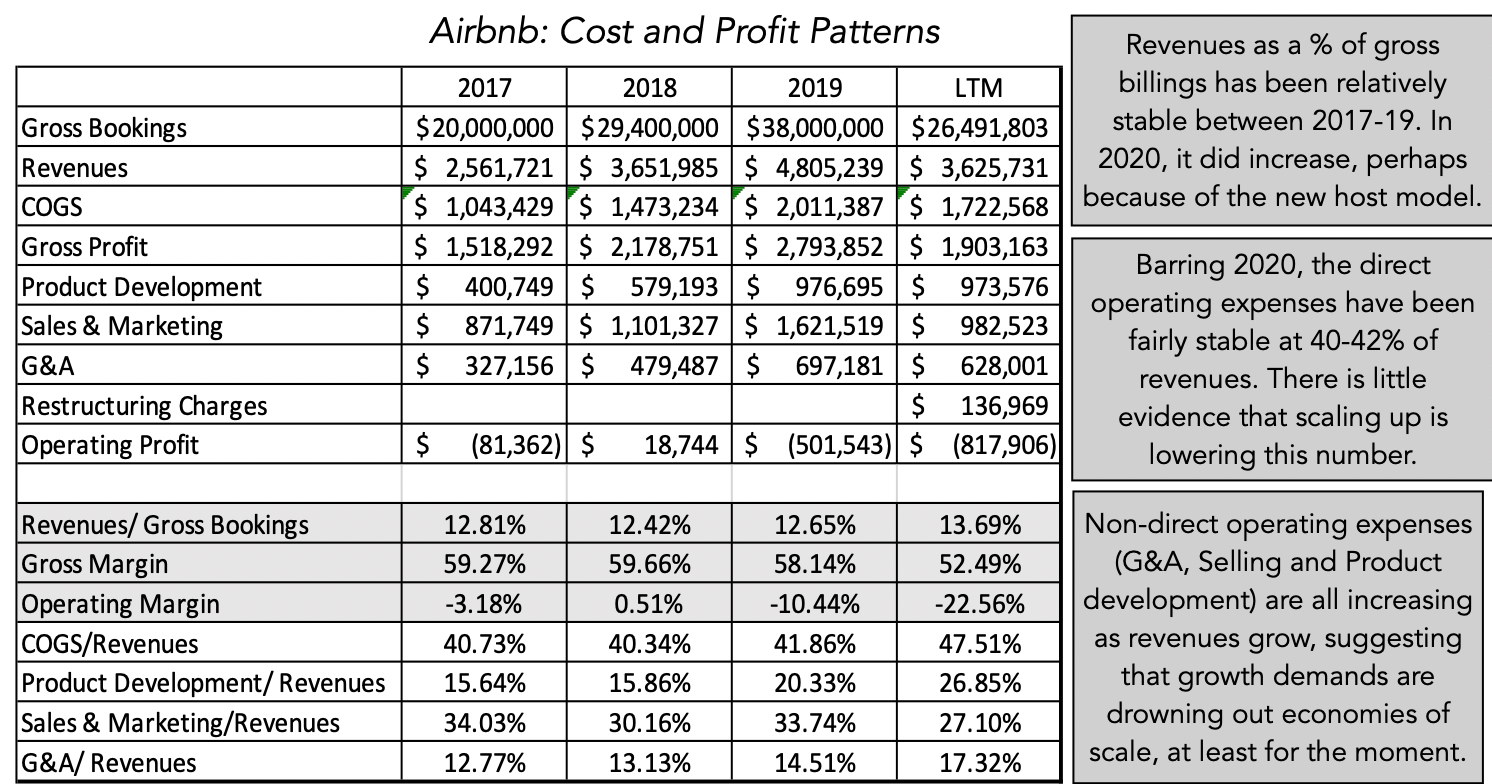 Source: Airbnb Prospectus (Nov 16)
Note that, at least through the most recent years, there is little evidence of economies of scale, since the direct operating costs have stayed at between 40-42% of revenues and the other costs have, for the most part, been rising. In 2019, the company also reported a substantial restructuring charge that presumably was one-time and extraordinary, but that item bears watching, since it has become a convenient vehicle for companies to hide ongoing operating expenses.Use of Proceeds: While the details are still being worked out, it is rumored that Airbnb is looking to raise about $3 billion in proceeds on the offering date, and that while some of the proceeds will be used to retire existing debt, most of it will be held by the company to cover future investment needs.Share classes: In keeping with the practices of tech companies that have gone public in recent years, Airbnb has shares with different voting rights: class A shares with one voting right per share, class B shares with 20 voting rights per share, and class C & class H shares with no voting rights per share. Not surprisingly, the class B shares will be held by founders and other insiders, allowing them control of the company, even if they own well below 50% of all shares outstanding. It is the class A shares that will be available to shareholders who buy on the offering day, and will remain the most liquid of the share classes thereafter. It is not clear why there are class C shares, other than to give founders, who already have control, even more control in future years, if they feel threatened. An ESG twist: It should come as no surprise that in an age where companies are valued on their "goodness", Airbnb is signaling it's intent to be socially responsible, with Brian Chesky making explicit the corporate values for the company, including "having an infinite time horizon" and "serving all of our customers". In addition, the proceeds from the non-voting class H shares will be set aside is an endowment to serve Airbnb hosts, though it is not clear whether the primary intent is to give hosts a stake in the company’s success, or to help them out during periods of need. I remain skeptical about ESG, but will hold off on passing judgment on whether this is just a public relations ploy.
The Hospitality Business
To value Airbnb, we need to start with an assessment of the market that it is targeting and then understand the competition that the company faces. In this section, I will start with a look at the market size and then examine the hotel and booking companies that comprise its competition.
The Market (TAM)
There are two ways in which I can describe Airbnb's total addressable market. One is to look the hotel business globally, which generated in excess of $600 billion in revenues in 2019, with the following characteristics:
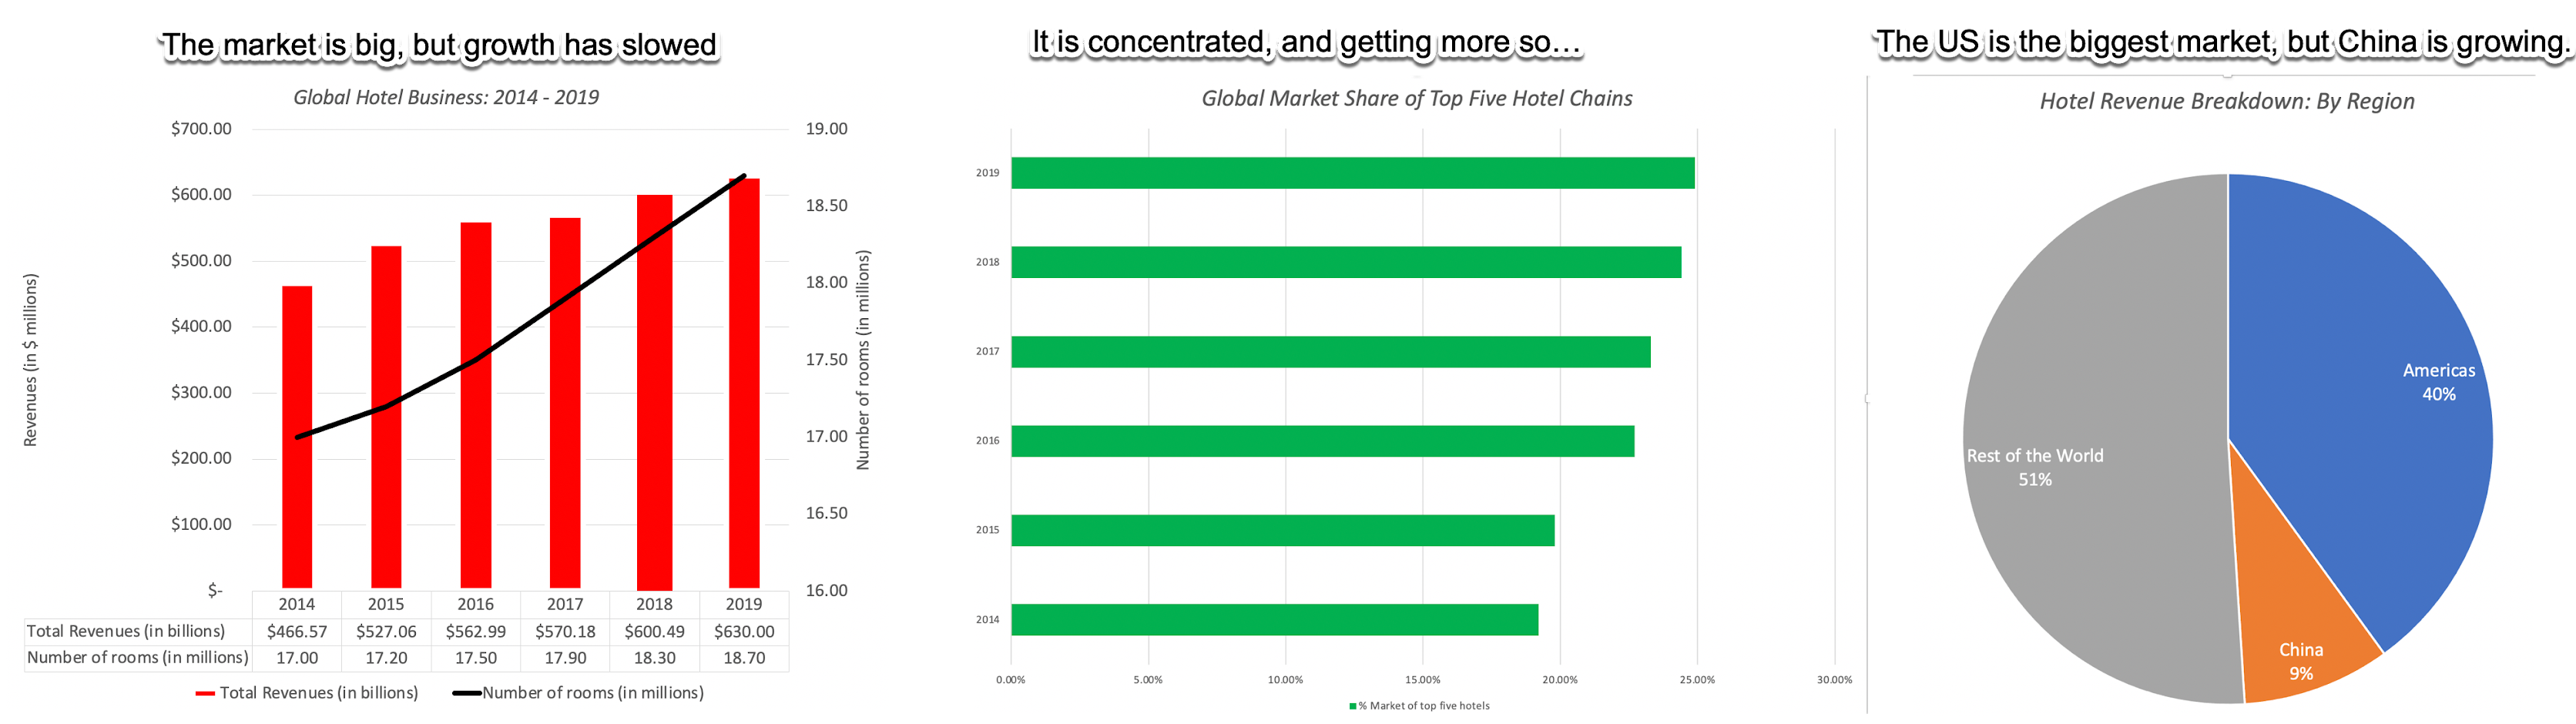 The hotel business is large, but its growth has slowed over the last five years, and it remains concentrated, with the top five hotel chains accounting for a larger and larger portion of the overall market every year since 2014. While the US remains the largest market, geographically, Asia is the center of growth, with China leading the way.
 There are some who believe that the conventional hotel market understates the potential market for a sharing economy company like Airbnb, since it can increase the supply of rental units without major new investment, and perhaps induce new entrants into the business. After all, the ride sharing companies have doubled or even tripled the size of the car service business in the last decade, using this template. It should come as no surprise that Airbnb believes that its total addressable market is much bigger than the hotel business. In 2011, in its infancy as a company, Airbnb estimated that its total addressable market at the 1.9 billion trips that were booked in 2010, and its share of that market at 10.6 million trips, as can be seen in this graph from the company in an early VC pitch:

In its prospectus, driven partially by its past success, and partly by the need to justify a large market cap, Airbnb has expanded its estimate of market potential to $3.4 trillion, as evidenced in this excerpt from the prospectus:
We have a substantial market opportunity in the growing travel market and experience economy. We estimate our serviceable addressable market (“SAM”) today to be $1.5 trillion, including $1.2 trillion for short-term stays and $239 billion for experiences. We estimate our total addressable market (“TAM”) to be $3.4 trillion, including $1.8 trillion for short-term stays, $210 billion for long-term stays, and $1.4 trillion for experiences.
In my view, Airbnb's targetable market falls somewhere in the middle, clearly higher than just the hotel business of $600 billion, but below Airbnb's upper end estimate of $2 trillion for this business. That is because there are parts of the world, where the Airbnb model will be less successful than it has been in the United States, either because of consumer behavior or regulatory restrictions. Given how much trouble Airbnb has had in the experiences business, I think Airbnb’s estimate of $1.4 trillion for that business is more fictional than even aspirational.
The Players
To make a judgment on Airbnb's future, we need to understand two peer groups. The first is the hotel business, since it is the business that is most at risk of being disrupted by the Airbnb model. The other is the online travel booking business, where there are large players like Expedia and Booking.com which have, at least for segments of their business, made their money by acting, like Airbnb, as intermediaries or brokers connecting guests with hospitality offerers.
1. The Hotel Business
The hotel business is both large and diverse, composed of hotels that range the spectrum from luxury to budget. To get a measure of the business, I have listed the 25 largest publicly traded hotel companies (in market capitalization) in the world below, with Marriott topping the list, with revenues of about $21 billion in 2019:
 The conventional hotel business is an asset-heavy business, with a significant real estate component to its value, and while some hotel companies have stayed with that model, others have moved on to a more capital-light model, where the real estate is owned by a separate entity (both in terms of ownership and control) and the hotel companies operates primarily as an operator. Marriot, for instance, follows the latter model, with the Marriott REIT owning the real estate, and Marriott collecting operating revenues from running the hotels. In addition, the global economic shutdown precipitated by COVID has wreaked havoc on hotel company revenues and profits, with revenues down about a third (in annualized terms) in the last 12 months, relative to 2019.
 2. The Travel Booking Business
While the hotel business is the one being disrupted the most by Airbnb, it is the travel booking business that is closest to the Airbnb business model. That business is also dominated by large players, with Expedia and Booking.com being the biggest. In the table below, I look at the revenues and operating income at these companies in 2019 and the last 12 months:

While Expedia and Booking.com both generate revenues from operating as middlemen between travelers and hospitality providers, just like Airbnb does, there are two key differences:
Other businesses: Both Expedia and Booking.com also operate in other businesses that drive revenues and margins. First, they generate revenues by buying blocks of hotel rooms at a discount from hotels, and then reselling them at a higher price, in what they call the "merchant" business. Second, they also derive revenues from online advertising by hotels and travel providers. Expedia gets a much larger share (47%) of its revenues from the merchant business than Booking.com (25%), which may explain its lower margins.Status Quo vs Disruption: Both Expedia and Booking.com were designed to make money off the status quo in the hospitality business, and derived all of their revenues until recently from existing hotels and airlines. In reaction to Airbnb's success, both companies have tried to expand into the home and apartment rental businesses, but these listings still represent a small fraction of overall revenues.The Valuation
To value Airbnb, I will follow a familiar script, at least for me. I will start by telling my Airbnb story, based upon the market it is in and its competition, current and potential, and then use this story as a launching pad for my valuation of the company. I will complete the valuation by looking at its sensitivity to key value drivers and bring in uncertainty into the equation.
Story and Numbers
I believe that Airbnb will continue to grow, while finding a pathway to profitability. Airbnb's growth in gross bookings will come not only from disrupting and taking market share from the hotel business, bad news for conventional hotel companies and travel providers who serves them, but also from continued expansion of non-conventional hospitality providers (home and apartment owners). As it grows, Airbnb's share of those gross bookings is likely to plateau at close to current levels, but its operating margins will continue to improve towards travel booking industry levels, as product development, marketing and G&A costs decrease, not in dollar terms, but as a percent of revenues. While Airbnb is enthusiastic about the experiences business, it is likely to remain a tangential business, contributing only marginally to revenues and profitability. Since Airbnb has a light debt load and is closer to profitability than most of the sharing-economy companies that have gone public in recent years, I will assume that their risk will approach that of the travel business, and that the risk of failure is low. In terms of inputs, this story translates into the following:
The COVID After-effects: The comeback from COVID will be slow in 2021, with Airbnb seeing revenues return, albeit to less than 2019 levels, while continuing to lose money (with operating margins of -10%).Growth in Gross Bookings: In 2019, Airbnb’s gross bookings grew 29.25%, lower than the growth rate in prior years, reflecting its increasing scale. After its recovery from COVID in 2021, gross bookings will continue to grow at a compounded annual growth rate of 25% between 2022 and 2025, and growth will drop down over the following years. In 2031, I expect Airbnb’s gross bookings to climb above $150 billion, about 60% higher than Booking.com’s gross bookings in 2019 and 40% higher than Expedia's gross bookings in that year.Revenues as percent of Bookings: Over the next decade, revenues as a percent of gross bookings will increase only mildly from current levels (12%-13) to 14%, sustained by the new host model for professional hosts and the supplemental benefits from Experiences business. Target Operating Margin: This will be a key component of Airbnb’s story, and I will assume that the operating margins will improve over the next decade to 25%, lower than Booking.com’s 2019 operating margin of 35.48%, but higher than the margins for Expedia or the hotel business.Sales to Invested Capital: While Airbnb has a capital-light model, it’s platform requires new investments in either product development and acquisitions. In 2020, Airbnb's sales to invested capital was 1.82, but the invested capital was negative in the prior year, making it unreliable, and Booking.com had a sales to invested capital of 1.91 in 2019. I assume that Airbnb will be able to generate $2.00 of revenues per dollar of invested capital in the next decade.Cost of Capital & Failure Risk: For the cost of capital, I will assume that Airbnb’s cost of capital will be 6.50%, close to the cost of capital of hotel companies, to start the valuation, but over time, it will rise to 7.23%, reflecting an expected increase in the treasury bond rate from current levels to 2% in 2031. While Airbnb has flirted with profitability and has little debt, it still remains a young, money losing company, and I will assume a 10% chance of failure.Share Count: Getting the share count for a company on the verge of going public is always tricky, as preferred shares get converted to common shares, options and warrants are outstanding and additional shares are issued on the offering date. For Airbnb, there is the added complication of a 2 for 1 stock split which occurred only a few weeks prior to the offering. For the moment, therefore, the share count is still a number that is in progress, but the next update on the prospectus should provide more clarity. (Right after I posted this, Airbnb updated their prospectus to reflect a more accurate share count. The value per share should now be closer to the right value)With these inputs, my valuation of Airbnb is captured in the picture below: Download spreadsheet
The value that I derive for Airbnb, with my story and inputs, is about $36 billion, with $3 billion in expected proceeds from the IPO augmenting the value and netting out the value of options outstanding. The per share value based upon the latest share count is about $48/share.
Value Drivers and Dealing with UncertaintyThere are two key drivers of Airbnb’s value. The first is the growth rate in gross bookings and the resulting expected dollar value in 2031, with value increasing with expected gross bookings. The other is the target operating margin, in 2031, with higher margins translating into higher value. In the table below, I list out the value of equity in Airbnb for variants of gross booking growth and operating margins:
Rather than view this table as anything goes, I would use it to make break even assessments, given what Airbnb trades at. For instance, if the market capitalization of Airbnb today is $60 billion, you would need it to deliver gross billings of $200 billion in 2031, with an operating margin of close to 35%. There is ample room for disagreement on Airbnb’s value, since there are plausible combinations of revenue growth and margins that deliver very different equity values. To more explicitly capture the effect of this uncertainty, I replace my point estimates of gross bookings growth, target margin and cost of capital with distributions, run simulations and capture the consequences in a value distribution: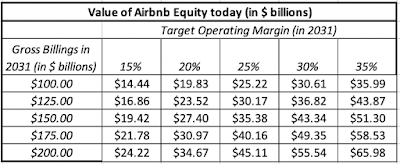

 Download spreadsheetIn short, there is nothing sacrosanct about my value judgment for Airbnb and if you disagree with me, even strongly, I understand your point of view. In fact, it is these differences that allow for buyers and sellers to co-exist in the market.
Previewing the IPO
While we can debate what Airbnb’s value truly is, an IPO is a pricing game. Put simply, rather than operate under the delusion that it is value that drive decisions, it is healthier to recognize that bankers price IPOs, not value them, for the offering, that much of the trading on the offering day and the weeks thereafter is driven by traders, trying to gauge mood and momentum. In this section, I will look at the contours of this pricing game for Airbnb, and implications for investors who may be more concerned about value.An IPO is a Pricing Game
To price an IPO, traders look at two places for guidance. The first is the VC pricing of the company in the rounds leading into the public offering. The second is the market pricing of publicly traded companies in the peer groups, companies that investors will compare the company to, in setting prices.
1. Venture Capital Pricing: As mentioned earlier, Airbnb has raised more than two dozen rounds of venture capital over its lifetime, and has been reprised multiple times. In the graph below, I look at the trend lines in Airbnb’s pricing, based upon VC assessments:

The pricing attached to Airbnb climbed dramatically in the first few years, reaching $31 billion in 2016, but then settled into a period of stagnation. In April 2020, at the height of the COVID crisis, the company raised more capital from VC investors, who reduced its pricing to $26 billion.
2. Peer Group Pricing: To price Airbnb, relative to publicly traded companies, I have computed pricing multiples for hotel and booking companies in the table below:
 Applying any of these multiples to Airbnb’s current operating metrics (revenues, EBITDA or net income) will yield valuations that are too low, because the company is still growing and finessing its business model. To get a more realistic pricing, I apply the multiples to Airbnb’s expected values for these metrics in 2025, and then discounting the future values back to today.
In summary, these numbers yield a much higher pricing for Airbnb’s equity, if it is priced similarly to Booking.com, and a much lower pricing, if Expedia is used as the comparable.
Investment Judgments
In the coming weeks, Airbnb will update its prospectus to reflect more details on its IPO, and bankers will set an offering price per share, based primarily on the feedback that they get from potential investors to different I may be jumping the gun here, but given how well the market has treated capital-light and technology companies this year, I would not be surprised if the market attaches a pricing of all above my estimated value for Airbnb's equity. As a market participant, you have three ways of participating in the Airbnb sweepstakes:Get in on the offering: Given the propensity of bankers to under price offerings, and given how the market has been behaving in the last few months, you can try to get a share of the shares at the offering price. This game gets easier to play if you are on the preferred client list at Morgan Stanley or Goldman Sachs, and are allowed access to the offering, but much more difficult, if you are not. Even if you do get in on the offering, there is no guaranteed payoff, because bankers do sometimes over price IPOs, as they did a few times in 2019.Play the trading game: In the trading game, value is a minor factor, at best, in whether you succeed. Your success will depend upon gauging the market mood and momentum on Airbnb and getting ahead of it and paying attention to what I call incremental information, small news stories that may have little or even no effect on value but can be consequential for momentum. Be an investor: If you are truly a value investor, you should not be ruling out Airbnb just because it is money-losing or a young company facing multiple uncertainties. Instead, you should value Airbnb yourself, and draw up decision rules well ahead of the offering. Since I have my estimated value for Airbnb at $36 billion, I will go first, using the valuation results, by decile, that come from my simulation:
If equity is priced at <$28 billion (20% percentile): A bargainIf equity is priced between $28 & $33 (40th percentile) billion: A solid buyIf equity is priced between $33 (40th percentile) & $38 billion (60thpercentile): A fair valueIf equity is priced between $38 (60th percentile) & $44 billion (80thpercentile): Too richly pricedIf equity is priced > $44 billion: Over valued
As I have argued in prior posts, it is not my preference to sell short on stocks like Airbnb, even if I believe the they are significantly over priced, given how much more powerful momentum is than any fundamentals in driving stock prices.
YouTube Video
Raw Data
Airbnb Prospectus (November 16, 2020)Spreadsheets
Valuation of Airbnb for IPO (November 30, 2020)Simulation Results (November 30, 2020)Aswath Damodaran's Blog

- Aswath Damodaran's profile
- 725 followers

