
Aswath Damodaran's Blog, page 9
January 27, 2022
Data Update 3 for 2022: Inflation and its Ripple Effects!
Inflation numbers have been coming in high now, for more than a year, but for much of the early part of 2021, bankers, investors and politicians seemed to be either in denial or casually dismissive of its potential for damage. Initially, the high inflation numbers were attributed to the speed with the economy was recovering from COVID, and once that excuse fell flat, it was the supply chain that was help responsible. By the end of 2021, it was clear that this bout of inflation was not as transient a phenomenon as some had made it out to be, and the big question leading in 2022, for investors and markets, is how inflation will play out during the year, and beyond, and the consequences for stocks, bonds and currencies.
Inflation: Measurement and Determinants
As the inflation debate was heating up in the middle of last year, I wrote a comprehensive post on how inflation is measured, what causes it and how it affects returns on different asset classes. Rather than repeat much of that post, let me summarize my key points.
Measuring inflation is not as simple as it looks, and measures of inflation can vary depending on the basket of good/services used, the perspective adopted (consumer, producer, GDP deflator) and the sampling used to collect prices. That said, the three primary inflation indices in the US, the CPI, the PPI and the GDP deflator all told the same story in 2021: Download historical inflation numbers
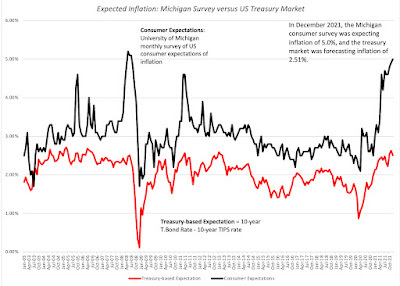
The inflation rate during the course of the year reached levels not seen in close to 40 years, with every price index registering a surge.While news stories focus on reported (and past0 inflation, it is expected inflation that should drive investment, and measures of these expectations can come from surveys of consumers (University of Michigan) or from the market, as the difference between the treasury bond rate and the inflation-protected treasury bond, of equivalent maturity:
 Download data
Using the ten-year bond, it is clear that while inflation expectations have inched up in the bond market, but that rise is far more muted than in the actual inflation indices, and consumer expectations of inflation now significantly exceed the bond-market imputed estimate for expected inflation.While the implied inflation in bond rates is low, investors seem to be anticipating higher inflation. Using a measure that the Federal Reserve has developed, I report the percent of investors expecting inflation to be greater than 2.5%, representing one end of the inflation expectation spectrum, and those expecting deflation, representing the other, in the graph below:
 Download dataAs you can see the 93.96% of investors were expecting inflation to be greater than 2.5%, by the end of December 2021, up from 6.74% in December 2020, suggesting a sea change in the market. Conversely, the percent of investors expecting deflation has dropped to a vanishing low number, suggesting that Cathie Wood has little company, in her contention that deflation is the real danger to markets and economies.The undeniable fact is that inflation came back in 2021, but the question of why it happened, and whether it will stay high, is hotly debated. To those who believe that it is a spike that will dissipate over time, it is another casualty of COVID, as a combination of virus-driven supply chain issues and government spending to offset shutdowns has driven prices up. In this mostly benign story, inflation will go back down, once these pressure ease, though it is unclear to what level. To others, and especially those old enough to remember the 1970s, it does seem like a return to more unsettled times, with potentially dangerous consequences for the economy and markets.
Interest Rates and Inflation
Inflation and interest rates are intertwined, and when their paths deviate, as they sometimes do, there is always a reckoning. While we have increasingly given central banks primacy in discussions of interest rates, it remains my view that markets set rates, and while central banks can nudge market expectations, they cannot alter them. Put simply, no central bank, no matter how powerful, can force market interest rates down, if inflation expectations stay low, or up, if investor are anticipating high inflation.
US Treasuries: A Mostly Uneventful Year
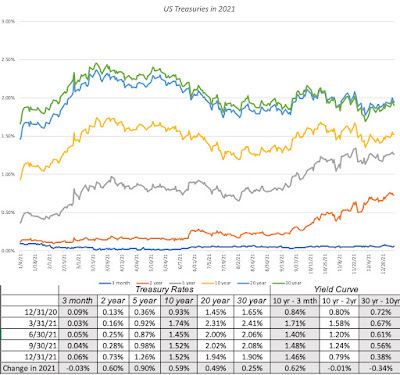
After a turbulent year in 2020, when COVID shut the global economy down, and interest rates plunged and stayed down for the rest of the year, 2021 was a more settled year, with long term rates rising gradually over the course of the year, but short terms rates staying put:
 Treasury Rates Data
While treasury bills continued to yield rates close to zero, rates increased for longer term treasuries, with 2-10 years rates rising much more than rates on the longest term treasuries (20-year to 30-year). For those who track the slope of the yield curve, and I am not one of those who believes that it has much predictive power, it was a confusing year. The treasury curve became steeper, but only at the shortest end of the spectrum, with the slope rising for the 2-year, relative to the 3-month, but not at all, when comparing the 10-year to the 2-year rate. Beyond the 10-year maturity, the slope of the yield curve actually flattened out, with the difference between the 30-year rate and the 10-year rate declining by 0.34%.
Corporate Bonds: No Shortage of Risk Capital
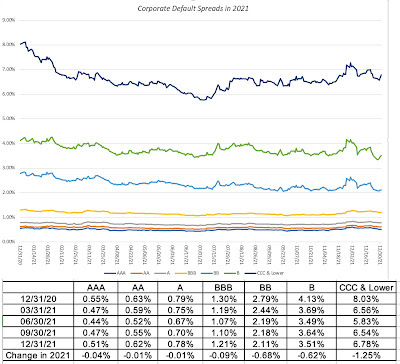
In my last post, I chronicled the movement in the equity risk premium, i.e. the price of risk in the equity market, during 2021, but the bond market has its own, and more measurable, price of risk in the form of corporate default spreads. Using bond ratings classes to categorize companies, based upon credit risk, I looked at the movement of default spreads during 2021:
 Download data
Corporate default spreads decrease across ratings classes, but the decline is much larger for lower rated bonds, with the default spread on high yield bonds registering a drop of 1.25%. Note that the decrease in default spreads, at least for the lower ratings, mirrors the drop in the implied equity risk premium during the course of 2021. Read together, it suggests that private risk capital continued to not just stay in the game, but increased its stake during the course of the year, extending a decade-long run.
Expected Inflation, Interest Rates and Bond Returns
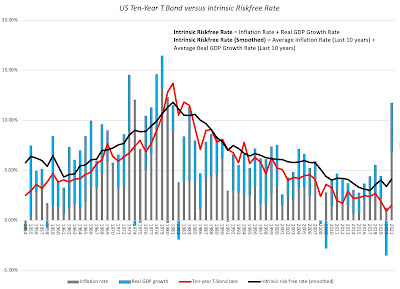
While day to day movements in interest rates are driven by multiple forces, including the latest smoke signals coming from central banks and investor sentiment, the longer term and drivers of interest rates are fundamental. In particular, if you start by breaking down a long term riskfree rate (like the 10-year treasury bond) into an expected inflation and an expected real interest rate components, you can also reconstruct an intrinsic risk free rate by assuming that the real growth in the economy is a stand-in for the real interest rate and that most investors form expectations of future inflation by looking at the inflation in the most recent year(s):
 Download data
In this picture, ythe actual ten-year treasury bond rate is superimposed against a rough measure of the intrinsic risk free rate (obtained by adding together the actual inflation rate and real growth rate each year) and a smoothed out version (where I used the average inflation rate and real growth rate over the previous ten years). Not only has the intrinsic risk free rate moved in sync with the ten-year bond rate for most of the last seven decades, but you can also see that the main reason why rates have been low for the last decade is not the Fed, with all of its quantitative easing machinations, but a combination of low growth and low inflation. Coming into 2022, though, the intrinsic risk free rate is clearly running ahed of the ten-year treasury bond rate, and if history is any guide, that gap will close either with a rise in the treasury bond rate or a decline in the risk free rate (coming from a recession or a rapid drop off in inflation).
Unexpected Inflation and Asset Returns
Note that it is expected inflation that drives interest rates, and that the actual inflation rate can come in above or below expectations. In my post on inflation last year, I drew a contrast between expected and unexpected inflation, arguing that financial assets are affected differently by each component. If expected inflation is high, but it is predictable, investors and businesses have the opportunity to incorporate that inflation into their decision making, with investors demanding higher interest rates on bond and expected returns on stocks, and businesses raising prices on their products/services to cover expected inflation. Unexpected inflation is what catches us off guard, with unexpectedly high inflation leading to a reassessment of pricing (for all financial assets) and an uneven impact across businesses, leaving those with pricing power in a better position than those without that power.
To assess how inflation has affected asset returns over time, I broke down the actual inflation rates since 1954 into expected and unexpected components each year, using a brute force assumption that the average inflation rate over the last ten years is the expected inflation rate. (In the last two decades, we have had access to more sophisticated measures of expected inflation, including the difference between the nominal treasury bond and TIPs rates, but not in earlier years). In the graph below, I look at annual returns on stocks, treasury bonds and corporate bonds, with the unexpected inflation numbers also shown:
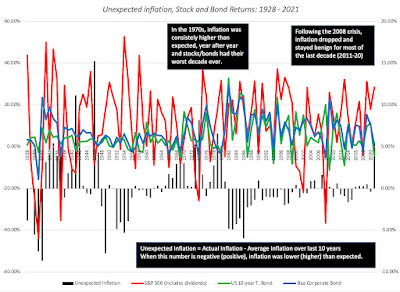
There are a few aspects of this graph that stand out. With my crude measure of inflation expectations, it looks like it takes time for inflation expectations to shift, during periods of higher or lower inflation, as can be seen in the extended stretches of higher than expected inflation, in the 1970s, and lower than expected inflation in the 1980s.
While it is not immediately visible in the graph, returns on stocks and bonds are affected by unexpected inflation, and to illustrate by how much, I broke the 94 years of data into five quartiles, based upon the level of unexpected inflation, with the lowest (highest) quintile representing the years when inflation came in most below (above) expectations, and estimated the annual returns (nominal and real) for stocks, treasuries and corporate bonds in the table below:
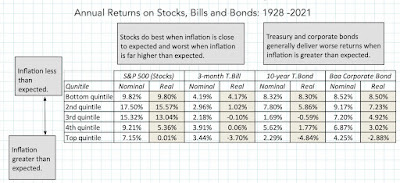
With treasuries and corporates, the returns generally get worse, as inflation comes in above expectations, with real returns showing the damage from unexpected inflation. With equities, the sweet spot in terms of returns is when inflation is at or below expectations, and the worst scenarios are when inflation comes in well above expectations. I also looked at how inflation plays out on equity sub-groupings, on two dimensions, the first being market capitalization and the second being price to book, with the former becoming a stand-in for the vaunted small cap premium and the latter for the value versus growth question.
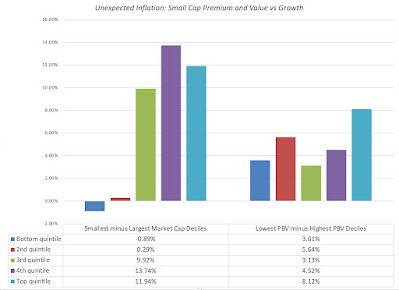
Over much of the last century, small cap stocks have done better than large cap stocks, when inflation has come in well above expectations, perhaps providing some insight into why the vaunted small cap premium seems have to disappeared over the last two decades of muted inflation. Similarly, the value effect, computed as the premium (or discounted) return earned by low price to book stocks over high price to book, becomes more pronounced during periods when inflation is greater than expected and much less so, during periods when inflation is lower than anticipated. Using the same approach with gold and real estate, with the caveat that historical data on the former is more limited, I get the following results:
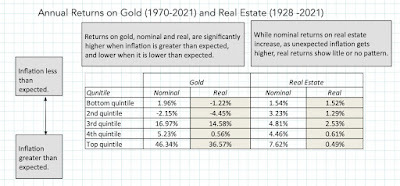 While gold and real estate both do better than financial assets, when inflation is greater than expected, there is also a clear difference between the two investment classes. Real estate operates more as a neutral hedge, delivering returns that are, for the most part, unscathed by unexpectedly high inflation, but gold is a bet on inflation, delivering the highest returns, when inflation is much greater than expected, and negative returns, when it is lower than expected. Much as I would like to extend this analysis to newer investment classes, there is not enough historical data on crypto currencies or NFTs to allow for the analysis. As I noted in my inflation post in 2021, though, the early evidence is not promising for these new investment categories, at least as inflation and crisis hedges, since they have behaved more like risky equities, at least on a day-to-day basis and during the 2020 crisis, than like gold.
Inflation and Currencies Much of this post has been about inflation in the US, and by extension, in US dollar terms, it is worth emphasizing that inflation is a currency-specific phenomenon. While inflation in the US dollar, by dint of its status as the currency in which commodities are priced, can sometimes spill over into other currencies, it remains true that you can have high inflation in one currency, while there is low inflation in other currencies. Inflation differences across currencies play out in two domains, with the first being interest rates in different currencies and the other being exchange rate.
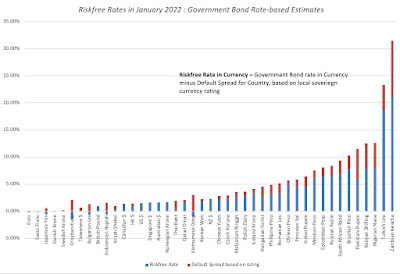
Interest Rates across Currencies I start every one of my discussions of discount rates with a truism, by stating that the riskfree rate that you start with should reflect the currency in which you have decided to do your valuation. That then becomes the springboard for estimating risk free rates in different currencies, following one of two paths. In the first, you start with government bond rates in the local currency, in different currencies, and adjust those rates for default risk in the local currency government bond. (Government bonds in local currencies do default, and account for a significant proportion of sovereign defaults in the last 50 years). My estimates for the start of 2022 for the currencies where local-currency government bonds are available is below:
 Download data
Riskfree rates are highest in currencies, like the Zambian Kwacha or Turkish Lira, where inflation is highest, lower in low-inflation currencies and even negative in currencies, where deflation may be the long term prediction. I am using the default spreads based upon the local currency sovereign ratings for the countries in question, with the government bond rate being the risk free rate only for currencies where the issuing government in triple-A rated. If you dislike this assumption, or do not believe that the government bond rate is a market-set number in a particular market, there is a second approach, where you start with the risk free rate in US dollar or Euros, and adjust it for differential inflation, i.e., the difference in expected inflation between the US and the country in question:
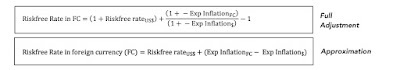 Thus, if the US treasury bond rate is 1.5%, and expected inflation rates in the US and Indonesia are 1% and 4% respectively, the approximate riskfree rate in Indonesian Rupiah will be 4.5% (=1.5% + (4%-1%)) and the more precise riskfree rate in Rupiah will be 4.52% (=1.015*(1.04/1.01)-1). While the expected inflation rate in dollars may be an easy get, it is more difficult to get expected inflation rates in other currencies, but the IMF has estimates for the next five years at this link.
Exchange Rates Just as interest rates in currencies are determined, in large part, by inflation differentials, exchange rates over time are also driven by those same inflation differentials. Drawing on one of the oldest relationships in exchange rates, purchasing power parity, you can extract the forward exchange rate in a currency:
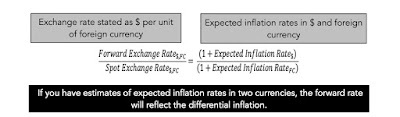
Thus, currencies with higher inflation can be expected currency devaluation over time, relative to currencies with lower inflation. As with interest rates, in the short term, there are forces, ranging from central banking intervention to momentum and speculation, that can cause rates to deviate from the inflation script, but in the long term, it is almost impossible to break the cycle. Connecting this linkage to the discussion of US inflation in the prior sections, here are the takeaways. If you believe that inflation will stay high, not just in the US, but across the globe, the exchange rate effects will be muted. If, on the other hand, you believe that the inflation shock will vary across countries, your actions will be more nuanced. For the countries where you believe that local inflation will decrease, relative to the US, the US dollar will weaken against their currencies, augmenting returns you will earn in their markets (stock or bond). For countries, where you see local inflation surging more than you expect to see in the US, the US dollar will strengthen against their currencies, reducing the returns you make in their markets. As with the discussion of asset returns, it is not expected inflation that is the source of exchange rate risk, since you can incorporate those expectations into exchange rates, but unexpected inflation, which, when extreme, can cause significant revaluations of currencies.
Conclusion As with any historical data assessment, I could give you the standard boilerplate disclaimer that past performance is not always a good predictor of the past, but to the extent that the past provides signals, your expectations of how inflation will play out in the coming year will play a key role in your asset allocation and stock selection decisions. If you believe that last year's surge in inflation is a precursor to a long time period when inflation is likely to stay high, and come in above expectations, you should be shifting your holdings away from financial to real assets, and within your equity holdings, towards small cap stocks, stocks trading at lower pricing multiples (PE, Price to Book) and companies with more pricing power. If, on the other hand, you believe that inflation worries are overdone, and that there will be a reversion back to the low inflation that we have seen in the last decade, staying invested in stocks, and especially in larger cap and high growth stocks, even if richly priced, makes sense.
YouTube Video
Data LinksInflation Data: CPI, PPI and GDP DeflatorIntrinsic versus Actual T.Bond Rates: 1954-2021Inflation and Returns on Asset ClassesRiskfree Rates in Currencies (Government Bond based estimates)Blog Post LinksInflation and Investing: False Alarm or Fair Warning?The Fed, Interest Rates and Stock Prices: Fighting the Fear Factor


Data Update 3: Inflation and its Ripple Effects!
Inflation numbers have been coming in high now, for more than a year, but for much of the early part of 2021, bankers, investors and politicians seemed to be either in denial or casually dismissive of its potential for damage. Initially, the high inflation numbers were attributed to the speed with the economy was recovering from COVID, and once that excuse fell flat, it was the supply chain that was help responsible. By the end of 2021, it was clear that this bout of inflation was not as transient a phenomenon as some had made it out to be, and the big question leading in 2022, for investors and markets, is how inflation will play out during the year, and beyond, and the consequences for stocks, bonds and currencies.
Inflation: Measurement and Determinants
As the inflation debate was heating up in the middle of last year, I wrote a comprehensive post on how inflation is measured, what causes it and how it affects returns on different asset classes. Rather than repeat much of that post, let me summarize my key points.
Measuring inflation is not as simple as it looks, and measures of inflation can vary depending on the basket of good/services used, the perspective adopted (consumer, producer, GDP deflator) and the sampling used to collect prices. That said, the three primary inflation indices in the US, the CPI, the PPI and the GDP deflator all told the same story in 2021:
Download historical inflation numbersThe inflation rate during the course of the year reached levels not seen in close to 40 years, with every price index registering a surge.While news stories focus on reported (and past0 inflation, it is expected inflation that should drive investment, and measures of these expectations can come from surveys of consumers (University of Michigan) or from the market, as the difference between the treasury bond rate and the inflation-protected treasury bond, of equivalent maturity:
Download dataUsing the ten-year bond, it is clear that while inflation expectations have inched up in the bond market, but that rise is far more muted than in the actual inflation indices, and consumer expectations of inflation now significantly exceed the bond-market imputed estimate for expected inflation.While the implied inflation in bond rates is low, investors seem to be anticipating higher inflation. Using a measure that the Federal Reserve has developed, I report the percent of investors expecting inflation to be greater than 2.5%, representing one end of the inflation expectation spectrum, and those expecting deflation, representing the other, in the graph below:
Download dataAs you can see the 93.96% of investors were expecting inflation to be greater than 2.5%, by the end of December 2021, up from 6.74% in December 2020, suggesting a sea change in the market. Conversely, the percent of investors expecting deflation has dropped to a vanishing low number, suggesting that Cathie Wood has little company, in her contention that deflation is the real danger to markets and economies.The undeniable fact is that inflation came back in 2021, but the question of why it happened, and whether it will stay high, is hotly debated. To those who believe that it is a spike that will dissipate over time, it is another casualty of COVID, as a combination of virus-driven supply chain issues and government spending to offset shutdowns has driven prices up. In this mostly benign story, inflation will go back down, once these pressure ease, though it is unclear to what level. To others, and especially those old enough to remember the 1970s, it does seem like a return to more unsettled times, with potentially dangerous consequences for the economy and markets.Interest Rates and Inflation
Inflation and interest rates are intertwined, and when their paths deviate, as they sometimes do, there is always a reckoning. While we have increasingly given central banks primacy in discussions of interest rates, it remains my view that markets set rates, and while central banks can nudge market expectations, they cannot alter them. Put simply, no central bank, no matter how powerful, can force market interest rates down, if inflation expectations stay low, or up, if investor are anticipating high inflation.
US Treasuries: A Mostly Uneventful Year
After a turbulent year in 2020, when COVID shut the global economy down, and interest rates plunged and stayed down for the rest of the year, 2021 was a more settled year, with long term rates rising gradually over the course of the year, but short terms rates staying put:
Treasury Rates DataWhile treasury bills continued to yield rates close to zero, rates increased for longer term treasuries, with 2-10 years rates rising much more than rates on the longest term treasuries (20-year to 30-year). For those who track the slope of the yield curve, and I am not one of those who believes that it has much predictive power, it was a confusing year. The treasury curve became steeper, but only at the shortest end of the spectrum, with the slope rising for the 2-year, relative to the 3-month, but not at all, when comparing the 10-year to the 2-year rate. Beyond the 10-year maturity, the slope of the yield curve actually flattened out, with the difference between the 30-year rate and the 10-year rate declining by 0.34%.
Corporate Bonds: No Shortage of Risk Capital
In my last post, I chronicled the movement in the equity risk premium, i.e. the price of risk in the equity market, during 2021, but the bond market has its own, and more measurable, price of risk in the form of corporate default spreads. Using bond ratings classes to categorize companies, based upon credit risk, I looked at the movement of default spreads during 2021:
Download dataCorporate default spreads decrease across ratings classes, but the decline is much larger for lower rated bonds, with the default spread on high yield bonds registering a drop of 1.25%. Note that the decrease in default spreads, at least for the lower ratings, mirrors the drop in the implied equity risk premium during the course of 2021. Read together, it suggests that private risk capital continued to not just stay in the game, but increased its stake during the course of the year, extending a decade-long run.
Expected Inflation, Interest Rates and Bond Returns
While day to day movements in interest rates are driven by multiple forces, including the latest smoke signals coming from central banks and investor sentiment, the longer term and drivers of interest rates are fundamental. In particular, if you start by breaking down a long term riskfree rate (like the 10-year treasury bond) into an expected inflation and an expected real interest rate components, you can also reconstruct an intrinsic risk free rate by assuming that the real growth in the economy is a stand-in for the real interest rate and that most investors form expectations of future inflation by looking at the inflation in the most recent year(s):
Download dataIn this picture, ythe actual ten-year treasury bond rate is superimposed against a rough measure of the intrinsic risk free rate (obtained by adding together the actual inflation rate and real growth rate each year) and a smoothed out version (where I used the average inflation rate and real growth rate over the previous ten years). Not only has the intrinsic risk free rate moved in sync with the ten-year bond rate for most of the last seven decades, but you can also see that the main reason why rates have been low for the last decade is not the Fed, with all of its quantitative easing machinations, but a combination of low growth and low inflation. Coming into 2022, though, the intrinsic risk free rate is clearly running ahed of the ten-year treasury bond rate, and if history is any guide, that gap will close either with a rise in the treasury bond rate or a decline in the risk free rate (coming from a recession or a rapid drop off in inflation).
Unexpected Inflation and Asset Returns
Note that it is expected inflation that drives interest rates, and that the actual inflation rate can come in above or below expectations. In my post on inflation last year, I drew a contrast between expected and unexpected inflation, arguing that financial assets are affected differently by each component. If expected inflation is high, but it is predictable, investors and businesses have the opportunity to incorporate that inflation into their decision making, with investors demanding higher interest rates on bond and expected returns on stocks, and businesses raising prices on their products/services to cover expected inflation. Unexpected inflation is what catches us off guard, with unexpectedly high inflation leading to a reassessment of pricing (for all financial assets) and an uneven impact across businesses, leaving those with pricing power in a better position than those without that power.
To assess how inflation has affected asset returns over time, I broke down the actual inflation rates since 1954 into expected and unexpected components each year, using a brute force assumption that the average inflation rate over the last ten years is the expected inflation rate. (In the last two decades, we have had access to more sophisticated measures of expected inflation, including the difference between the nominal treasury bond and TIPs rates, but not in earlier years). In the graph below, I look at annual returns on stocks, treasury bonds and corporate bonds, with the unexpected inflation numbers also shown:
There are a few aspects of this graph that stand out. With my crude measure of inflation expectations, it looks like it takes time for inflation expectations to shift, during periods of higher or lower inflation, as can be seen in the extended stretches of higher than expected inflation, in the 1970s, and lower than expected inflation in the 1980s.
While it is not immediately visible in the graph, returns on stocks and bonds are affected by unexpected inflation, and to illustrate by how much, I broke the 94 years of data into five quartiles, based upon the level of unexpected inflation, with the lowest (highest) quintile representing the years when inflation came in most below (above) expectations, and estimated the annual returns (nominal and real) for stocks, treasuries and corporate bonds in the table below:
With treasuries and corporates, the returns generally get worse, as inflation comes in above expectations, with real returns showing the damage from unexpected inflation. With equities, the sweet spot in terms of returns is when inflation is at or below expectations, and the worst scenarios are when inflation comes in well above expectations. I also looked at how inflation plays out on equity sub-groupings, on two dimensions, the first being market capitalization and the second being price to book, with the former becoming a stand-in for the vaunted small cap premium and the latter for the value versus growth question.
Over much of the last century, small cap stocks have done better than large cap stocks, when inflation has come in well above expectations, perhaps providing some insight into why the vaunted small cap premium seems have to disappeared over the last two decades of muted inflation. Similarly, the value effect, computed as the premium (or discounted) return earned by low price to book stocks over high price to book, becomes more pronounced during periods when inflation is greater than expected and much less so, during periods when inflation is lower than anticipated. Using the same approach with gold and real estate, with the caveat that historical data on the former is more limited, I get the following results:
While gold and real estate both do better than financial assets, when inflation is greater than expected, there is also a clear difference between the two investment classes. Real estate operates more as a neutral hedge, delivering returns that are, for the most part, unscathed by unexpectedly high inflation, but gold is a bet on inflation, delivering the highest returns, when inflation is much greater than expected, and negative returns, when it is lower than expected. Much as I would like to extend this analysis to newer investment classes, there is not enough historical data on crypto currencies or NFTs to allow for the analysis. As I noted in my inflation post in 2021, though, the early evidence is not promising for these new investment categories, at least as inflation and crisis hedges, since they have behaved more like risky equities, at least on a day-to-day basis and during the 2020 crisis, than like gold.Inflation and Currencies Much of this post has been about inflation in the US, and by extension, in US dollar terms, it is worth emphasizing that inflation is a currency-specific phenomenon. While inflation in the US dollar, by dint of its status as the currency in which commodities are priced, can sometimes spill over into other currencies, it remains true that you can have high inflation in one currency, while there is low inflation in other currencies. Inflation differences across currencies play out in two domains, with the first being interest rates in different currencies and the other being exchange rate.
Interest Rates across Currencies I start every one of my discussions of discount rates with a truism, by stating that the riskfree rate that you start with should reflect the currency in which you have decided to do your valuation. That then becomes the springboard for estimating risk free rates in different currencies, following one of two paths. In the first, you start with government bond rates in the local currency, in different currencies, and adjust those rates for default risk in the local currency government bond. (Government bonds in local currencies do default, and account for a significant proportion of sovereign defaults in the last 50 years). My estimates for the start of 2022 for the currencies where local-currency government bonds are available is below:
Download data
Riskfree rates are highest in currencies, like the Zambian Kwacha or Turkish Lira, where inflation is highest, lower in low-inflation currencies and even negative in currencies, where deflation may be the long term prediction. I am using the default spreads based upon the local currency sovereign ratings for the countries in question, with the government bond rate being the risk free rate only for currencies where the issuing government in triple-A rated. If you dislike this assumption, or do not believe that the government bond rate is a market-set number in a particular market, there is a second approach, where you start with the risk free rate in US dollar or Euros, and adjust it for differential inflation, i.e., the difference in expected inflation between the US and the country in question:
Thus, if the US treasury bond rate is 1.5%, and expected inflation rates in the US and Indonesia are 1% and 4% respectively, the approximate riskfree rate in Indonesian Rupiah will be 4.5% (=1.5% + (4%-1%)) and the more precise riskfree rate in Rupiah will be 4.52% (=1.015*(1.04/1.01)-1). While the expected inflation rate in dollars may be an easy get, it is more difficult to get expected inflation rates in other currencies, but the IMF has estimates for the next five years at this link.Exchange Rates Just as interest rates in currencies are determined, in large part, by inflation differentials, exchange rates over time are also driven by those same inflation differentials. Drawing on one of the oldest relationships in exchange rates, purchasing power parity, you can extract the forward exchange rate in a currency:
Thus, currencies with higher inflation can be expected currency devaluation over time, relative to currencies with lower inflation. As with interest rates, in the short term, there are forces, ranging from central banking intervention to momentum and speculation, that can cause rates to deviate from the inflation script, but in the long term, it is almost impossible to break the cycle. Connecting this linkage to the discussion of US inflation in the prior sections, here are the takeaways. If you believe that inflation will stay high, not just in the US, but across the globe, the exchange rate effects will be muted. If, on the other hand, you believe that the inflation shock will vary across countries, your actions will be more nuanced. For the countries where you believe that local inflation will decrease, relative to the US, the US dollar will weaken against their currencies, augmenting returns you will earn in their markets (stock or bond). For countries, where you see local inflation surging more than you expect to see in the US, the US dollar will strengthen against their currencies, reducing the returns you make in their markets. As with the discussion of asset returns, it is not expected inflation that is the source of exchange rate risk, since you can incorporate those expectations into exchange rates, but unexpected inflation, which, when extreme, can cause significant revaluations of currencies.
Conclusion As with any historical data assessment, I could give you the standard boilerplate disclaimer that past performance is not always a good predictor of the past, but to the extent that the past provides signals, your expectations of how inflation will play out in the coming year will play a key role in your asset allocation and stock selection decisions. If you believe that last year's surge in inflation is a precursor to a long time period when inflation is likely to stay high, and come in above expectations, you should be shifting your holdings away from financial to real assets, and within your equity holdings, towards small cap stocks, stocks trading at lower pricing multiples (PE, Price to Book) and companies with more pricing power. If, on the other hand, you believe that inflation worries are overdone, and that there will be a reversion back to the low inflation that we have seen in the last decade, staying invested in stocks, and especially in larger cap and high growth stocks, even if richly priced, makes sense.
YouTube Video
Data LinksInflation Data: CPI, PPI and GDP DeflatorIntrinsic versus Actual T.Bond Rates: 1954-2021Inflation and Returns on Asset ClassesRiskfree Rates in Currencies (Government Bond based estimates)Blog Post LinksInflation and Investing: False Alarm or Fair Warning?The Fed, Interest Rates and Stock Prices: Fighting the Fear Factor
January 19, 2022
Data Update 2 for 2022: US Stocks kept winning in 2021, but���
Leading into 2021, the big questions facing investors were about how quickly economies would recover from COVID, with the assumption that the virus would fade during the year, and the pressures that the resulting growth would put on inflation. In a post at the start of 2021, I argued that while stocks entered the year at elevated levels, especially on historic metrics (such as PE ratios), they were priced to deliver reasonable returns, relative to very low risk free rates (with the treasury bond rate at 0.93% at the start of 2021). At the start of 2022, it feels like Groundhog Day, with the same questions about economic growth and inflation looming for the year, and the same judgment about stocks, i.e., that they look expensive. In this post, I will begin with a historical assessment of stock returns in the recent past, then move on to evaluate the returns that investors can expect to make, given how they are priced at the start of 2022, and end with a do-it-yourself valuation of the index right now.
The year that was....
If equity markets surprised us with their resilience in 2020, not just weathering a pandemic for the ages, but prospering in its midst, US equity markets, in particular, managed to find light even in the darkest news stories, and continued their rise through 2021. Foreign markets, though, had a mixed year, and that divergence is worth noting, since it may provide clues to what may be coming in the next year.
US Equities, in the aggregate
US equities had a good year, by any measure, with the S&P 500 rising from 3756 at the start of 2021 to end the year at 4766, an increase of 26.90%. While that followed another good year for stocks in 2020, with the index rising 16.25%, from 3231 to 3756, the index took different pathways during the two years:
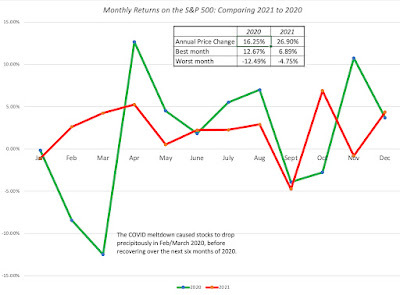
In 2020, the market was up, but only after it absorbed the after-shocks of the inception of the virus in February and March of 2020. In 2021, the index had a smoother ride, up in nine of twelve months, with only September qualifying a significant drop (with the index down 4.75%). When you augment this price change with the dividends on the index during 2021, the total return on the S&P 500 for 2021 was 28.47%. I report a dataset containing annual returns on stocks, going back to 1928, and to put 2021 in context, I looked at the historical returns on the index:
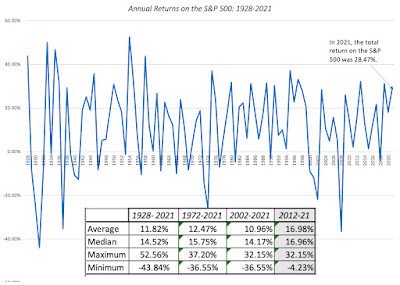 Download historical returns on US stocks
Looking at the 94 years in this dataset, the returns in 2021 would have ranked 20th on the list, good, but not exceptional. Note, though, that 2021 is the third consecutive year of very good returns on the index, with 2019 delivering 31.21%, and 2020 generating 18.02%, and that the cumulative return over the three years (2019-21) is 98.95%. If you compute cumulative returns, on a rolling three-year time period (1928-30, 1929-31, 1930-32 etc.), the 2019-21 time period would rank 8th on the list of 92 3-year time periods. The table below provides the rankings for returns over 5-year and 10-year periods, and where the most recent three-year, five-year and ten-year cumulative returns would rank on the list:
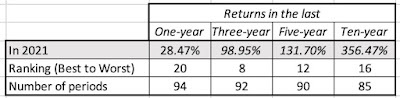 Download return rankings
In sum, if you have money to invest over the last decade, and you stayed invested, you should count yourself as lucky to have enjoyed one of the great market runs of the last century. Conversely, if you stayed out of the market, for the last decade, you would have committed one of the great investing mistakes of all time, and blaming the Fed or bubble-talk will not bring you absolution.
US Equities, by sub-group
It has always true that when markets move, up or down, not all sectors and sub-groups are treated equally. I do believe that too much is often made of these differences, as it is generally more the rule than the exception that markets, when they are up strongly, get the bulk of that rise from a small sub-set of stocks or sectors. Using S&P's sector classification, I take a look at how each one did in 2022, looking at the percent changes in market capitalization:
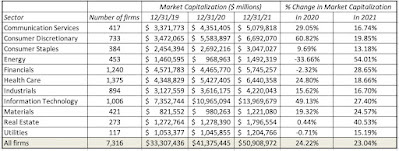
In contrast to 2020, when technology and consumer discretionary firms ran well ahead of the pack, the best performing sectors in 2021 were energy and real estate, two of the biggest laggards in 2020. That can be viewed as vindication, at least in this year, for contrarians, but as a cautionary note for ESG advocates, who assumed that fossil fuel companies were on a death march, based upon their performance over the last decade.
There is no debate more likely to draw heat than the value versus growth debate, and at the risk of being labeled simplistic by value investors, I looked at returns on companies, in 2021, based upon their PE ratios at the start of 2021:
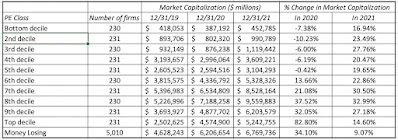
Unlike 2020, where high PE stocks beat low PE stocks decisively, the results in 2021 were mixed, with no clear patterns across the classes. The results are similar if you break stocks down based upon price to book ratios or revenue growth rates. Finally, and in keeping with my fixation on corporate age and life cycles, I broke companies down by company age (measured from the founding year):
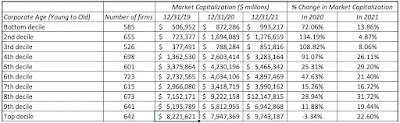
Again, unlike 2020, when young companies delivered significantly higher returns than older companies, the best returns in 2021 were delivered by middle aged companies.
For the rest of the world
While US equities continued to set new highs in 2021, the picture in the rest of the world was not as rosy, as you can see in the table below (with percent returns in US dollar terms):
In US dollar terms, India had the best-performing market in 2021, following a strong 2020, but China, the best performer in the world in 2020 came back to earth in 2021. North America (US and Canada) outperformed the globe, but Latin America was the worst performing region, down more than 20% in US dollar terms. There are many reasons why markets diverge, but here again the contrast with 2020 is worth drawing. In 2020, the COVID crisis played out across markets, increasing the co-movement and correlation across developed markets, with the US, Europe and Japan moving mostly in sync. In 2021, you saw a return to more normal times, with markets in each country affected more by local factors.
The Price of Risk in Equity Markets
The allure of having the historical data that we do in financial markets, especially in the United States, is that there is information in the past. The danger of poring over this historical data is that a focus on the past can blind us to structural changes in markets that can make the future very different from the past. To get a measure of what equity markets are offering in terms of expected returns, we are better served with a forward-looking and dynamic measure of these returns, and that is the focus of this section.
Implied Equity Risk Premiums
To understand the intuition behind the implied equity risk premium, it is easiest to start with the concept of a yield to maturity on a bond, computed as the discount rate that makes the present value of the cash flows on the bond (coupons, during the bond's lifetime, and face value, at maturity) equal to the price of the bond. With equities, the cash flows take the form of dividends and buybacks, and in addition to estimating them using future growth rates, you have to assume that they continue in perpetuity. In computing this implied equity risk premium for the S&P 500, I start with the dividends and buybacks on the stocks in the index in the most recent year (which is known) and assume that they grow at the rate that analysts who follow the index are projecting for the next five years. Beyond the fifth year, I make the simplifying assumption that earnings growth will converge on the nominal growth rate of the economy, which I set equal to the risk free rate.
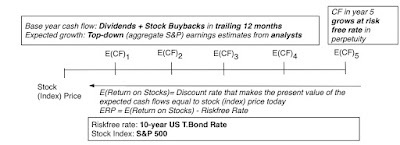 If you set the present value of the expected cash flows equal to the index level today, and solve for a discount rate (you may need to use the solver function in Excel, or trial and error), the resulting number is the expected return on stocks, based upon how stocks are priced today, and expected cash flows. This approach is built on the proposition that the intrinsic value of stocks is the present value of the expected cash flows that you generate in perpetuity, from holding these stocks, but it is model agnostic. Put simply, it does not require that you believe in any risk and return model in finance, since it is based on price and expected cash flows. To the critique that analysts can over estimate future earnings and growth, the response is that even if they do (and there is no evidence that top-down forecasts are biased), it is the price of risk, given expected cash flows.
The Implied ERP - Start of 2022
I have computed the implied equity risk premium at the start of every month, since September 2008, and during crisis periods, I compute it every day. Over the course of 2021, as the index rose, risk free rates climbed and analysts got much more upbeat about expected earnings for the next three years, the equity risk premium drifted down, to end the year at 4.24%:
 Download spreadsheet
Much as I would love to claim that I have the estimated the equity risk premium to the second decimal point, the truth is that there is some give in these numbers and that changing assumptions about earnings and cash flows generates an equity risk premium between 4-5%. The contrast between the behavior f equity risk premiums in 2020 and 2021 are in the picture below, where I show my (daily) estimates of ERP during 2020 on the left, and my (monthly) estimates of ERP for 2021 on the right.
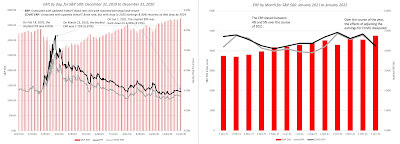 Download data on ERP by month from 2008-2021
During 2020, the equity risk started the year at about 4.7%, spiraled to almost 8% on March 23, 2020, before reverting back quickly to pre-crisis levels by September 2020. During 2021, you saw equity risk premiums revert back to a more sedate path, with numbers staying between 4% and 5% through the course of the entire year.
Historical Perspective
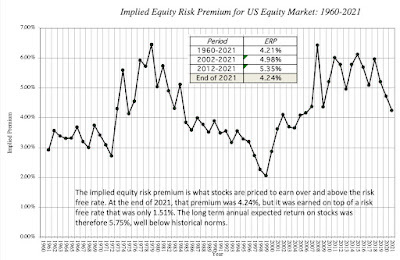
As talk of a bubble fills the air, one way to reframe the question of whether stocks are in bubble territory is to ask whether the current implied equity risk premium has become ���too low���. If your answer is yes, you are arguing that stocks are over priced, and if the answer is no, that they are under priced. At least on the surface, the current level of the equity risk premium is not flashing red lights, since at 4.24%, it is running slightly above the long term averages of 4.21% (1960 - 2021).
 Download past implied ERP
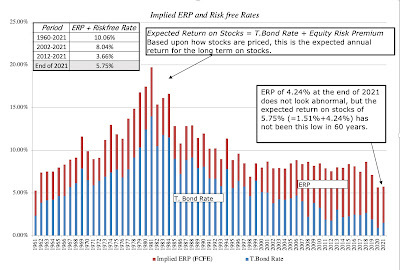
That said, there are two reasons for concern. The first is that the premium is now lower than the average premium since 2008, a period that perhaps better reflects the new global economy. The second and scarier reason is that the 5.75% expected return that is implied in today���s stock prices is close to a sixty-year low:
 Download past implied ERP
A pessimist looking at this graph will conclude that expected returns on stocks have become too low, and that we are due for a correction, but that would be more a statement about treasury bond rates being too low than about equity risk premiums. Even if you belong to the camp arguing that low risk free rates are now the norm, this graph suggests that we all need to re-examine how much we, as individuals, are saving for retirement, since the old presumption that you can earn 8-10% investing in stocks will longer hold. Across the United States, defined-benefit pension funds that have set aside funds on this same assumption will face massive funding shortfalls, unless they reevaluate benefit levels or infuse new funds.
A Market Assessment
If you look at history, it seems difficult to argue against the notion that market timing is the impossible dream, but that has never stopped investors from trying to time markets, partly because the payoff from being right is immense. I have long claimed that I am not a market timer, but that is a lie, since every investor times markets, with the difference being in whether the timing is implicit (with cash holdings in your portfolio increasing, when you feel uneasy about markets, and decreasing, when you feel bullish) or explicit (where you actively bet on market direction). Rather than just give you just my estimate of whether I think the market is under or over valued, I will ask each of you to make your own judgments, while also offering my own.
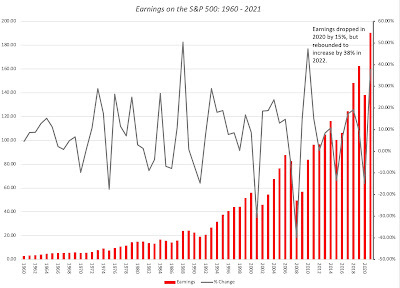
The process of valuing the index starts with an assessment of expected earnings, and with the S&P 500, there is no shortage of either historical data or assessments of the future, on this dimension. Let's start with a look at S&P earnings over time:
 Download historical earnings
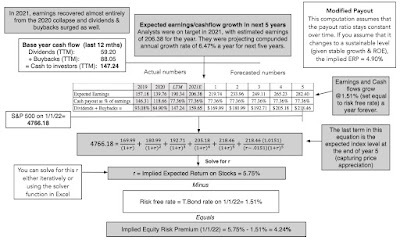
While COVID wreaked havoc with corporate earnings in 2020, the comeback in earnings in 2021 has been remarkable, with trailing 12-month earnings (October 2020 - September 2021) at 190.34, and estimated earnings for 2021 of 206.38, both significantly higher than the 162.35 that was earned in 2019 (pre-COVID). At the end of 2021, analyst estimates for earnings in 2022 and 2023 reflect their views that the earnings recovery will continue:
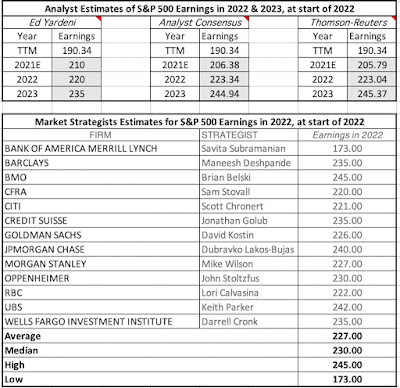 I will use the analyst estimates as my expected earnings for the index for the next two years, but assume that earnings growth rate thereafter will move down over the following three years to a stable growth rate (set equal to the risk free rate). It is true that analysts are often wrong, and in some cases, biased, but the latter is more of a problem with analyst estimates for individual companies, than for market aggregate earnings. However, if you believe that analysts have overestimated earnings, my valuation spreadsheet gives you the option of haircutting those estimates. Conversely, if your contention is that analysts are still playing catch-up, you can increase their estimates by a factor of your choosing.
Investors don't get value from earnings directly, but do get value from the cash flows flowing from those earnings. As I have noted in prior posts, these cash flows, which used to entirely take the form of dividends, have increasingly shifted, over the last three decades, to stock buybacks.
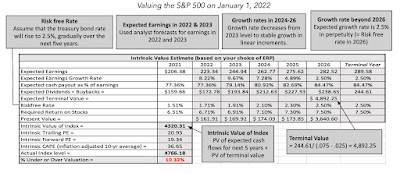
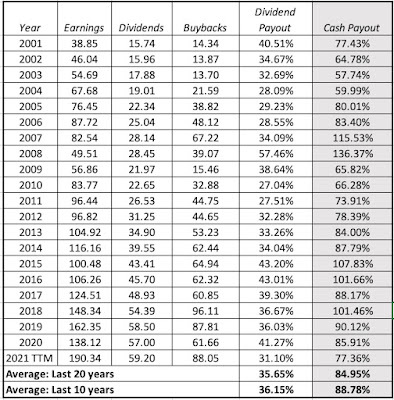 While dividends are stickier than buybacks, insofar as companies are more willing to reduce the latter during crisis years like 2009 and 2020, it is also clear, as the comeback in buybacks in 2021 shows. In my base case valuation, I will start with 77.36%, the percent of earnings that companies have returned to shareholders, in dividends and buybacks, in the last twelve months, but I will increase this over time to a cash payout ratio that is consistent with my estimate of stable growth (risk free rate) and the return on equity of 16.10% that S&P 500 companies have earned, on average, over the last decade. (Sustainable Payout Ratio = 1 - g/ ROE; with a 16.10% return on equity and a 2.5% growth rate, the payout ratio in stable growth is 84.47%= 1 - .025/.161).
On the risk free rate, I start with 1.51%, the 10-year treasury bond rate on January 1, 2022, but I will assume that this rate will drift upwards over the next five years to reach 2.5%. That reflects my view that inflation pressures will push up long term rates in the year to come and has little to do with what the Fed may or may not do with the Fed funds rate. Finally, I build in the expectation that a fair ERP for the S&P 500 should be 5%, higher than the long term historical average of 4.21%, but closer to the average ERP since 2008. On both these macro assumptions, I encourage you to take your own point of view. With these assumptions in place, my valuation for the S&P 500, as of January 1, 2022, is shown below:
 Download spreadsheet to value S&P 500 index
Note that even in the two weeks since I did this valuation, there have been material changes in key inputs, with the treasury bond rate rising to 1.87% on January 19, 2022, and the S&P dropping to 4533, down 3.8% from its level at the start of the year.
In Conclusion
As with any valuation, I don't believe that I should try to convince you that my valuation is the right one, nor do I have no desire to do so. In fact, I know that my valuation is wrong, with the question being in what direction, and by how much. I would strongly encourage you to take my valuation spreadsheet, change the numbers that I have used on earnings, cash flows, the risk free rate and the equity risk premium to reflect your views, and come up with your own assessment of value. Good investing requires taking ownership of your investment decisions, and trusting this choice to talking heads on TV, market strategists at investment banks or those market gurus who looked good last year is a dereliction of investment duty.
YouTube Video
Datasets (to download)
Historical returns on stocks, bonds, bills and real estate: 1928 - 2021Historical implied ERP on the S&P 500: 1960 -2021Spreadsheet (to value the S&P 500)
Spreadsheet to compute implied ERP on January 1, 2022Spreadsheet to value the S&P 500 on January 1, 2022
Data Update 2 for 2022: US Stocks kept winning in 2021, but…
Leading into 2021, the big questions facing investors were about how quickly economies would recover from COVID, with the assumption that the virus would fade during the year, and the pressures that the resulting growth would put on inflation. In a post at the start of 2021, I argued that while stocks entered the year at elevated levels, especially on historic metrics (such as PE ratios), they were priced to deliver reasonable returns, relative to very low risk free rates (with the treasury bond rate at 0.93% at the start of 2021). At the start of 2022, it feels like Groundhog Day, with the same questions about economic growth and inflation looming for the year, and the same judgment about stocks, i.e., that they look expensive. In this post, I will begin with a historical assessment of stock returns in the recent past, then move on to evaluate the returns that investors can expect to make, given how they are priced at the start of 2022, and end with a do-it-yourself valuation of the index right now.
The year that was....
If equity markets surprised us with their resilience in 2020, not just weathering a pandemic for the ages, but prospering in its midst, US equity markets, in particular, managed to find light even in the darkest news stories, and continued their rise through 2021. Foreign markets, though, had a mixed year, and that divergence is worth noting, since it may provide clues to what may be coming in the next year.
US Equities, in the aggregate
US equities had a good year, by any measure, with the S&P 500 rising from 3756 at the start of 2021 to end the year at 4766, an increase of 26.90%. While that followed another good year for stocks in 2020, with the index rising 16.25%, from 3231 to 3756, the index took different pathways during the two years:
In 2020, the market was up, but only after it absorbed the after-shocks of the inception of the virus in February and March of 2020. In 2021, the index had a smoother ride, up in nine of twelve months, with only September qualifying a significant drop (with the index down 4.75%). When you augment this price change with the dividends on the index during 2021, the total return on the S&P 500 for 2021 was 28.47%. I report a dataset containing annual returns on stocks, going back to 1928, and to put 2021 in context, I looked at the historical returns on the index:
Download historical returns on US stocksLooking at the 94 years in this dataset, the returns in 2021 would have ranked 20th on the list, good, but not exceptional. Note, though, that 2021 is the third consecutive year of very good returns on the index, with 2019 delivering 31.21%, and 2020 generating 18.02%, and that the cumulative return over the three years (2019-21) is 98.95%. If you compute cumulative returns, on a rolling three-year time period (1928-30, 1929-31, 1930-32 etc.), the 2019-21 time period would rank 8th on the list of 92 3-year time periods. The table below provides the rankings for returns over 5-year and 10-year periods, and where the most recent three-year, five-year and ten-year cumulative returns would rank on the list:
Download return rankings
In sum, if you have money to invest over the last decade, and you stayed invested, you should count yourself as lucky to have enjoyed one of the great market runs of the last century. Conversely, if you stayed out of the market, for the last decade, you would have committed one of the great investing mistakes of all time, and blaming the Fed or bubble-talk will not bring you absolution.
US Equities, by sub-group
It has always true that when markets move, up or down, not all sectors and sub-groups are treated equally. I do believe that too much is often made of these differences, as it is generally more the rule than the exception that markets, when they are up strongly, get the bulk of that rise from a small sub-set of stocks or sectors. Using S&P's sector classification, I take a look at how each one did in 2022, looking at the percent changes in market capitalization:
In contrast to 2020, when technology and consumer discretionary firms ran well ahead of the pack, the best performing sectors in 2021 were energy and real estate, two of the biggest laggards in 2020. That can be viewed as vindication, at least in this year, for contrarians, but as a cautionary note for ESG advocates, who assumed that fossil fuel companies were on a death march, based upon their performance over the last decade.
There is no debate more likely to draw heat than the value versus growth debate, and at the risk of being labeled simplistic by value investors, I looked at returns on companies, in 2021, based upon their PE ratios at the start of 2021:
Unlike 2020, where high PE stocks beat low PE stocks decisively, the results in 2021 were mixed, with no clear patterns across the classes. The results are similar if you break stocks down based upon price to book ratios or revenue growth rates. Finally, and in keeping with my fixation on corporate age and life cycles, I broke companies down by company age (measured from the founding year):
Again, unlike 2020, when young companies delivered significantly higher returns than older companies, the best returns in 2021 were delivered by middle aged companies.
For the rest of the world
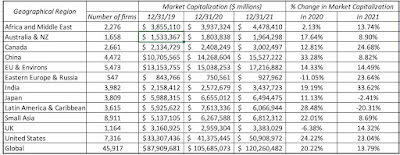
While US equities continued to set new highs in 2021, the picture in the rest of the world was not as rosy, as you can see in the table below (with percent returns in US dollar terms):
In US dollar terms, India had the best-performing market in 2021, following a strong 2020, but China, the best performer in the world in 2020 came back to earth in 2021. North America (US and Canada) outperformed the globe, but Latin America was the worst performing region, down more than 20% in US dollar terms. There are many reasons why markets diverge, but here again the contrast with 2020 is worth drawing. In 2020, the COVID crisis played out across markets, increasing the co-movement and correlation across developed markets, with the US, Europe and Japan moving mostly in sync. In 2021, you saw a return to more normal times, with markets in each country affected more by local factors.
The Price of Risk in Equity Markets
The allure of having the historical data that we do in financial markets, especially in the United States, is that there is information in the past. The danger of poring over this historical data is that a focus on the past can blind us to structural changes in markets that can make the future very different from the past. To get a measure of what equity markets are offering in terms of expected returns, we are better served with a forward-looking and dynamic measure of these returns, and that is the focus of this section.
Implied Equity Risk Premiums
To understand the intuition behind the implied equity risk premium, it is easiest to start with the concept of a yield to maturity on a bond, computed as the discount rate that makes the present value of the cash flows on the bond (coupons, during the bond's lifetime, and face value, at maturity) equal to the price of the bond. With equities, the cash flows take the form of dividends and buybacks, and in addition to estimating them using future growth rates, you have to assume that they continue in perpetuity. In computing this implied equity risk premium for the S&P 500, I start with the dividends and buybacks on the stocks in the index in the most recent year (which is known) and assume that they grow at the rate that analysts who follow the index are projecting for the next five years. Beyond the fifth year, I make the simplifying assumption that earnings growth will converge on the nominal growth rate of the economy, which I set equal to the risk free rate.
If you set the present value of the expected cash flows equal to the index level today, and solve for a discount rate (you may need to use the solver function in Excel, or trial and error), the resulting number is the expected return on stocks, based upon how stocks are priced today, and expected cash flows. This approach is built on the proposition that the intrinsic value of stocks is the present value of the expected cash flows that you generate in perpetuity, from holding these stocks, but it is model agnostic. Put simply, it does not require that you believe in any risk and return model in finance, since it is based on price and expected cash flows. To the critique that analysts can over estimate future earnings and growth, the response is that even if they do (and there is no evidence that top-down forecasts are biased), it is the price of risk, given expected cash flows.The Implied ERP - Start of 2022
I have computed the implied equity risk premium at the start of every month, since September 2008, and during crisis periods, I compute it every day. Over the course of 2021, as the index rose, risk free rates climbed and analysts got much more upbeat about expected earnings for the next three years, the equity risk premium drifted down, to end the year at 4.24%:
Download spreadsheet
Much as I would love to claim that I have the estimated the equity risk premium to the second decimal point, the truth is that there is some give in these numbers and that changing assumptions about earnings and cash flows generates an equity risk premium between 4-5%. The contrast between the behavior f equity risk premiums in 2020 and 2021 are in the picture below, where I show my (daily) estimates of ERP during 2020 on the left, and my (monthly) estimates of ERP for 2021 on the right.
Download data on ERP by month from 2008-2021
During 2020, the equity risk started the year at about 4.7%, spiraled to almost 8% on March 23, 2020, before reverting back quickly to pre-crisis levels by September 2020. During 2021, you saw equity risk premiums revert back to a more sedate path, with numbers staying between 4% and 5% through the course of the entire year.
Historical Perspective
As talk of a bubble fills the air, one way to reframe the question of whether stocks are in bubble territory is to ask whether the current implied equity risk premium has become “too low”. If your answer is yes, you are arguing that stocks are over priced, and if the answer is no, that they are under priced. At least on the surface, the current level of the equity risk premium is not flashing red lights, since at 4.24%, it is running slightly above the long term averages of 4.21% (1960 - 2021).
Download past implied ERP
That said, there are two reasons for concern. The first is that the premium is now lower than the average premium since 2008, a period that perhaps better reflects the new global economy. The second and scarier reason is that the 5.75% expected return that is implied in today’s stock prices is close to a sixty-year low:
Download past implied ERP
A pessimist looking at this graph will conclude that expected returns on stocks have become too low, and that we are due for a correction, but that would be more a statement about treasury bond rates being too low than about equity risk premiums. Even if you belong to the camp arguing that low risk free rates are now the norm, this graph suggests that we all need to re-examine how much we, as individuals, are saving for retirement, since the old presumption that you can earn 8-10% investing in stocks will longer hold. Across the United States, defined-benefit pension funds that have set aside funds on this same assumption will face massive funding shortfalls, unless they reevaluate benefit levels or infuse new funds.
A Market Assessment
If you look at history, it seems difficult to argue against the notion that market timing is the impossible dream, but that has never stopped investors from trying to time markets, partly because the payoff from being right is immense. I have long claimed that I am not a market timer, but that is a lie, since every investor times markets, with the difference being in whether the timing is implicit (with cash holdings in your portfolio increasing, when you feel uneasy about markets, and decreasing, when you feel bullish) or explicit (where you actively bet on market direction). Rather than just give you just my estimate of whether I think the market is under or over valued, I will ask each of you to make your own judgments, while also offering my own.
The process of valuing the index starts with an assessment of expected earnings, and with the S&P 500, there is no shortage of either historical data or assessments of the future, on this dimension. Let's start with a look at S&P earnings over time:
Download historical earnings
While COVID wreaked havoc with corporate earnings in 2020, the comeback in earnings in 2021 has been remarkable, with trailing 12-month earnings (October 2020 - September 2021) at 190.34, and estimated earnings for 2021 of 206.38, both significantly higher than the 162.35 that was earned in 2019 (pre-COVID). At the end of 2021, analyst estimates for earnings in 2022 and 2023 reflect their views that the earnings recovery will continue:
I will use the analyst estimates as my expected earnings for the index for the next two years, but assume that earnings growth rate thereafter will move down over the following three years to a stable growth rate (set equal to the risk free rate). It is true that analysts are often wrong, and in some cases, biased, but the latter is more of a problem with analyst estimates for individual companies, than for market aggregate earnings. However, if you believe that analysts have overestimated earnings, my valuation spreadsheet gives you the option of haircutting those estimates. Conversely, if your contention is that analysts are still playing catch-up, you can increase their estimates by a factor of your choosing.Investors don't get value from earnings directly, but do get value from the cash flows flowing from those earnings. As I have noted in prior posts, these cash flows, which used to entirely take the form of dividends, have increasingly shifted, over the last three decades, to stock buybacks.
While dividends are stickier than buybacks, insofar as companies are more willing to reduce the latter during crisis years like 2009 and 2020, it is also clear, as the comeback in buybacks in 2021 shows. In my base case valuation, I will start with 77.36%, the percent of earnings that companies have returned to shareholders, in dividends and buybacks, in the last twelve months, but I will increase this over time to a cash payout ratio that is consistent with my estimate of stable growth (risk free rate) and the return on equity of 16.10% that S&P 500 companies have earned, on average, over the last decade. (Sustainable Payout Ratio = 1 - g/ ROE; with a 16.10% return on equity and a 2.5% growth rate, the payout ratio in stable growth is 84.47%= 1 - .025/.161).On the risk free rate, I start with 1.51%, the 10-year treasury bond rate on January 1, 2022, but I will assume that this rate will drift upwards over the next five years to reach 2.5%. That reflects my view that inflation pressures will push up long term rates in the year to come and has little to do with what the Fed may or may not do with the Fed funds rate. Finally, I build in the expectation that a fair ERP for the S&P 500 should be 5%, higher than the long term historical average of 4.21%, but closer to the average ERP since 2008. On both these macro assumptions, I encourage you to take your own point of view. With these assumptions in place, my valuation for the S&P 500, as of January 1, 2022, is shown below:
Download spreadsheet to value S&P 500 index
Note that even in the two weeks since I did this valuation, there have been material changes in key inputs, with the treasury bond rate rising to 1.87% on January 19, 2022, and the S&P dropping to 4533, down 3.8% from its level at the start of the year.
In Conclusion
As with any valuation, I don't believe that I should try to convince you that my valuation is the right one, nor do I have no desire to do so. In fact, I know that my valuation is wrong, with the question being in what direction, and by how much. I would strongly encourage you to take my valuation spreadsheet, change the numbers that I have used on earnings, cash flows, the risk free rate and the equity risk premium to reflect your views, and come up with your own assessment of value. Good investing requires taking ownership of your investment decisions, and trusting this choice to talking heads on TV, market strategists at investment banks or those market gurus who looked good last year is a dereliction of investment duty.
YouTube Video
Datasets (to download)
Historical returns on stocks, bonds, bills and real estate: 1928 - 2021Historical implied ERP on the S&P 500: 1960 -2021Spreadsheet (to value the S&P 500)
Spreadsheet to compute implied ERP on January 1, 2022Spreadsheet to value the S&P 500 on January 1, 2022
January 8, 2022
Data Update 1 for 2022: It is Moneyball Time!
Happy New Year, and I hope that 2022 brings you good tidings! To start the year, I returned to a ritual that I have practiced for thirty years, and that is to take a look at not just market changes over the last year, but also to get measures of the financial standing and practices of companies around the world. Those measures took a beating in 2020, as COVID decimated the earnings of companies in many sectors and regions of the world, and while 2021 was a return to some degree of normalcy, there is still damage that has to be worked through. This post will be one of a series, where I will put different aspects of financial data under the microscope, to get a sense of how companies are adapting (or not) to a changing world.
The Moneyball Question
When I first started posting data on my website for public consumption, it was designed to encourage corporate financial analysts and investors alike to use more data in their decision making. In making that pitch, I drew on one of my favorite movies, Moneyball, which told the story of Billy Beane (played by Brad Pitt), the general manager of the Oakland As, revolutionized baseball by using data as an antidote to the gut feeling and intuition of old-time baseball scouts.
In the years since Beane tried it with baseball, Moneyball has decisively won the battle for sporting executives' minds, as sport after sport has adopted its adage of trusting the data, with basketball, football, soccer and even cricket adopting sabermetrics, as this sporting spin off on data science is called. Not surprisingly, Moneyball has found its way into business and investing as well. In the last decade, as tech companies have expanded their reach into our personal lives, collecting information on choices and decisions that used to private, big data has become not just a buzzword, but also a justification for investing billions in companies/projects that have no discernible pathway to profitability, but offer access to data. Along the way, we have all also bought into the notion of crowd wisdom, where aggregating the choices of tens of thousands of choice-makers, no matter how naive, yields a consensus that beats expert opinion. After all, we get our restaurant choices from Yelp reviews, our movie recommendations from Rotten Tomatoes, and we have even built crypto currencies around the notion of crowd-checking transactions.
Don't get me wrong! I was a believer in big data and crowd wisdom, well before those terms were even invented. After all, I have lived much of my professional life in financial markets, where we have always had access to lots of data and market prices are set by crowds of investors. That said, it is my experience with markets that has also made me skeptical about the over selling of both notions, since we have an entire branch of finance (behavioral finance/economics) that has developed to explain how more data does not always lead to better decisions and why crowds can often be collectively wrong. As you use my data, I would suggest four caveats to keep in mind, if you find yourself trusting the data too much:More data is not always better than less data: In a post from a few months ago, I argued that we as investors and analysts) were drowning in data, and that data overload is now a more more imminent danger than not have enough data. I argued that disclosure requirements needed to be refined and that a key skill that analysts will need for the future is the capacity to differentiate between data and information, and materiality from distraction.Data does not always provide direction: As you work with data, you discover that its messages are almost always muddled, and that estimates always come with ranges and standard errors. In short, the key discipline that you need to tame and use data is statistics, and it is one reason that I created my own quirky version of a statistics class on my website.Mean Reversion works, until it does not: Much of investing over the last century in the US has been built on betting on mean reversion, i.e. that things revert back to historical norms, sooner rather than later. After all, the key driver of investment success from investing in low PE ratio stocks comes from their reverting back towards the average PE, and the biggest driver of the Shiller PE as a market timing device is the idea that there is a normal range for PE ratios. While mean reversion is a strong force in stable markets, as the US was for much of the last century, it breaks down when there are structural changes in markets and economies, as I argued in this post. The consensus can be wrong: A few months ago, I made the mistake of watching Moneyheist, a show on Netflix, based upon its high audience ratings on Rotten Tomatoes, and as I wasted hours on this abysmal show, I got a reminder that crowds can be wrong, and sometimes woefully so. As you look at the industry averages I report on corporate finance statistics, from debt ratios to dividend yields, remember that just because every company in a sector borrows a lot, it does not mean that high debt ratios make sense, and if you are using my industry averages on pricing multiples, the fact that investors are paying high multiples of revenues for cloud companies does not imply that the high pricing is justified.In short, and at the risk of stating the obvious, having access to data is a benefit but it is not a panacea to every problem. Sometimes, less is more!The Company Sample for 2022When I first started my data collection and analysis in 1990, data was difficult to come by, and when available, it was expensive. Without hundreds of thousands of dollars to spend on databases, I started my journey spending about a thousand dollars a year, already hitting budget constraints, subscribing to a Value Line database that was mailed to me on a CD every year. That database covered just 1700 US companies, and reported on a limited list of variables on each, which I sliced and diced to report on about a dozen variables, broken down by industry. Times have changed, and I now have access to extraordinarily detailed data on almost all publicly traded global companies. I am grateful to all the services that provide me with raw data, but I am cognizant that they are businesses that make money from selling data, and I try not to undercut them, or act as a competitor. That is why almost every variable that you will see me reporting on my website represents a computation or estimate of mine, albeit with raw data from a provider, rather than a regurgitation of data from a service. It is also why I report only aggregated data on industries, rather than company-level data.
Regional BreakdownMy data sample for 2022 includes every publicly traded firm that is traded anywhere in the world, with a market capitalization that exceeds zero. That broad sweep yields a total of 47,606 firms, spread across 135 countries and every continent in the world:
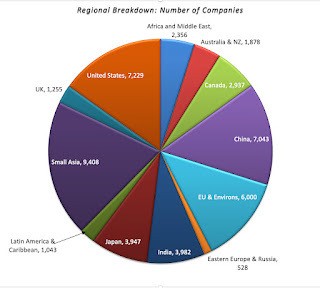
The largest slice is Small Asia, where small has to be read in relative terms, since it includes all of Asia, except for India, China and Japan, with 9,408 firms. It is followed by the United States, with 7,229 firms, and then China (including Hong Kong listings), with 7.043 firms. Since many of these firms have small market capitalizations, with some trading at market caps of well below $10 million, the chart below looks at the breakdown of the sample in market capitalization:
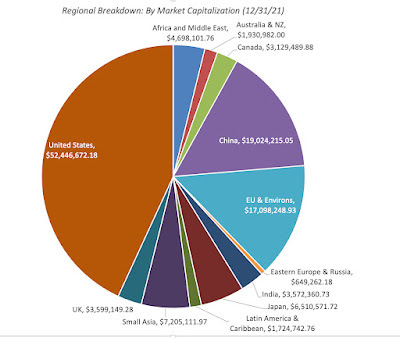
The market capitalization breakdown changes the calculus, with the US dominating with $52 trillion in collective market cap, more than 40% of the overall global value, followed by China with $19 trillion in aggregate market capitalization.
Sector/Industry BreakdownThe most useful way to categorize these 47,606 companies is by industry groupings, but that process does raise thorny questions about what industry groupings to use, and where to put firms that are not easily classifiable. To illustrate, what business would you put Apple, a company that was categorized (rightly) as a computer hardware company 40 years ago, but that now gets more than 60% of its revenues and profits from the iPhone, a telecommunication device that is also a hub for entertainment and services? I started my classification with a very broad grouping, based upon S&P's sector classes:
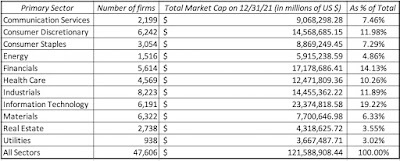 This should not come as a surprise, especially given their success in markets over the last decade, but technology is the largest sector, accounting for 19.22% of global market capitalization, though industrials account for the largest number of publicly traded firms. One sector to note is energy, which at 4.86% of global market capitalization at the start of 2022, has seen its share of the market drop by roughly half over the last decade. Addressing the legitimate critique that sector classifications are too broad, I created 94 industry groupings for the companies, drawing on the original classifications that I used for my Value Line data thirty years ago (to allow for historical comparisons) and S&P's industry list. The table below lists my industry groups, with the number of companies in each one:
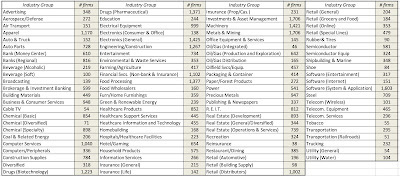 I am sure that some of you will find even these industry groupings to be over-broad, but I had to make a compromise between having too many groupings, with not enough firms in each one, and too few. It also required that I make judgment calls on where to put individual firms, and some of those calls are debatable, but I feel comfortable that my final groups are representative.
The Data VariablesWhen I first started reporting data, I had only a dozen variables in my datasets. Over time, that list has grown, and now includes more than a hundred variables. A few of these variables are macro variables, but only those that I find useful in corporate finance and valuation, and not easily accessible in public data bases. Most of the variables that I report are micro variables, relating to company choices on investing, financing and dividend policies, or to data that may be needed to value these companies.
Macro DataIf your end game is obtaining macroeconomic data, there are plenty of free databases that provide this information today. My favorite is the one maintained by the Federal Reserve in St. Louis, FRED, which contains historical data on almost every macroeconomic variable, at least for the US. Rather than replicate that data, my macroeconomic datasets relate to four key variables that I use in corporate finance and valuation.Risk Premiums: You cannot make informed financial decisions, without having measures of the price of risk in markets, and I report my estimates for these values for both debt and equity markets. For debt markets, it takes the form of default spreads, and I report the latest estimates of these corporate bond spreads at this link. In the equity market, the price of risk (equity risk premium) is more difficult to observe, and I start by reporting on the conventional estimate of this measure by looking at historical returns (going back to 1928) on stocks, bonds, bills and real estate at this link. I offer an alternative forward-looking and more dynamic measure of this premium in an implied premium, with the start of 2022 estimate here and the historical values (going back to 1960) of this implied premium here.Risk free Rates: While the US treasury bond rate is widely reported, I contrast its actual value with what I call an intrinsic measure of the rate, computed by adding the inflation rate to real growth each year at this link. Currency and Country Risk: Since valuation often requires comfort with moving across currencies, I provide estimates of risk free rates in different currencies at this link. I extend my equity risk premium approach to cover other countries, using sovereign default spreads as my starting point, at this link.Tax Rates: Since the old saying about death and taxes is true, I report on marginal tax rates in different countries at this link, and while I would love to claim that I did the hard work, the credit belongs to KPMG for keeping this data updated over time.I do update my equity risk premiums for the US at the start of every month on my website, and the country equity risk premiums once every six months.
Micro DataI am not interested in reported financial ratios, just for the sake of reporting them, and my focus is therefore on those statistics that I use in corporate finance and valuation. You may find my choices to be off putting, but you could combine my reported data to create your own. For example, I believe that return on assets, an accounting ratio obtained by dividing net income by total assets, is an inconsistent abomination, leading to absurd conclusions, and I refuse to report it, but I do report returns on invested capital and equity.
Rather than just list out the variables that I provide data on, I have classified them into groups in the table below:
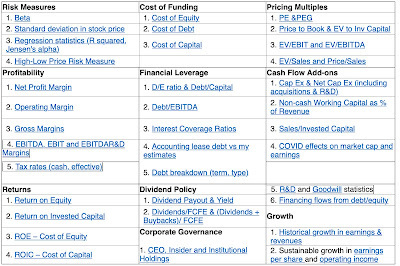 Data on my site
With each of these variables, I report industry averages for all companies globally, as well as regional averages for five groups: (a) US, (b) EU, UK and Switzerland, (c) Emerging Markets, (d) Japan and (e) Australia, NZ and Canada. Since the emerging market grouping is so large (representing more than half my sample) and diverse (across every continent), I break out India and China as separate sub-groups. You can find the data to download on my website, at this link.
Data Timing and TimelinessAlmost all of the data that you will see in my updates reflects data that I have collected in the last week (January 1, 2022- January 8, 2022. That said, there will be difference in timeliness on different data variables, largely based upon whether the data comes from the market or from financial statements. For data that comes from the market, such as market capitalization and costs of capital, the current data is as of January 1, 2022.For data that comes from financial statements, the numbers that I use come from the most recent filings, which for most companies will be data through September 30, 2021. Thus, my trailing PE ratio for January 1, 2022, is computed by dividing the market capitalization on January 1, 2022, by the earnings in the twelve months ending in September 2021. While that may seem inconsistent, it is consistent with the reality that you, as an investor or analyst, use the most current data that you can get for each variable. As we go through the year, both the market and the accounting numbers will change, and a full-fledged data service would recompute and update the numbers. I am not, and have no desire to be, a data service, and will not be updating until the start of 2023. Thus, there are two potential dangers in using my data later in the year, with the first emerging if the market sees a steep shift, up or down, which will alter all of the pricing multiples, and the second occurring in sectors that are either transforming quickly (disrupted sectors) or are commodity-based (where changes in commodity prices can alter financials quickly).
Estimation ChoicesWhen I embarked on the task of estimating industry averages, I must confess that I did not think much of the mechanics of how to compute those averages, assuming that all I would have to do is take the mean of a series of numbers. I realized very quickly that computing industry averages for pricing and accounting ratios was not that simple. To illustrate why, I present you with a slice of my table of PE ratios, by industry grouping, for US firms, the start of 2022:
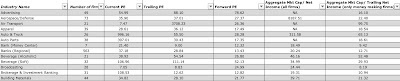 PE ratio, by industry, for US companiesTake the broadcasting group, just as an illustration, where there were 29 firms in my US sample. The three columns with PE ratios (current, trailing and forward) represent simple averages, but these case be skewed for two reasons. The first is the presence of outliers, since PE ratios can be absurdly high numbers (as is the case with auto & truck companies), and can pull the averages up. The second is the bias created by removing firms with negative earnings, and thus no meaningful PE ratio, from the sample. The last two columns represent my attempts to get around these problems. In the second to last column, I compute an aggregated PE ratio, by taking the total market capitalization of all firms in the group and dividing by the total earnings of all firms in the group, including money losers. In effect, this computes a number that is close to a weighted average that includes all firms in the group, but if a lot of firms are money-losers, this estimate of the PE ratio will be high. To see that effect, I compute an aggregated PE ratio, using only money-making firms, in the last column. You may look at the range of values for PE ratios, from 7.05 to 24.99 for broadcasting firms, and decide that I am trying to confuse the issue, but I am not. It is the basis for why I take all arguments that are based upon average PE ratios with a grain of salt, since the average that an analyst uses will reflect the biases they bring to their sales pitches.
 The other issue that I had to confront, especially because my large sample includes many small companies, listed and traded in markets with information disclosure holes, is whether to restrict my sample to markets like the US and Europe, where information is more dependable and complete, or to stay with my larger sample. The problem with doing the former is that you create bias in your statistics by removing smaller and risker firms from your sample, and I chose to have my cake and eat it too, by keeping all publicly traded firms in my global sample, but also reporting the averages for US and European firms separately.
Using the DataI report the data on my website, because I want it to be used. So, if you decide that some of the data is useful to you, in your investing or analysis, you are welcome to use it, and you don't have to ask for permission. If you find errors in the data, please let me know, and I will fix it. If you are looking for a variable that I do not compute, or need an average for a region that I don't report separately on (say Brazil or Indonesia), please understand that I cannot meet customized data requests. I am a solo operator, with other fish to fry, and there is no team at my disposal. As I mention in my website, this data is meant for real time analysis for those in corporate finance and valuation. It is not designed to be a research database, though I do have archived data on most of the variables going back in time, and you may be able to create a database of your own. If you do use the data, I would ask only three things of you:Understand the data: I have tried my best to describe how I compute my numbers in the spreadsheets that contain the data, in worksheets titled "Variables and FAQ". On some of the variables, especially on equity risk premiums, you may want to read the papers that I have, where I explain my reasoning, or watch my classes on them. Whatever you do, and this is general advice, never use data from an external source (including mine), if you do not understand how the data is computed.Take ownership: If you decide to use any of my data, especially in corporate financial analysis and valuation, please recognize that it is still your analysis or valuation. Don't bring me into your disagreements, especially in legal settings: If you are in disagreement with a colleague, a client or an adversary, I am okay with you using data from my website to buttress your arguments, but please do not bring me in personally into your disputes. This applies in spades, if you are in a legal setting, since I believe that courts are where valuation first principles go to die.ConclusionI would love to tell you that I am driven by altruistic motives in sharing my data, and push for sainthood, but I am not. I would have produced all of the data that you see anyway, because I will need it for my work, both in teaching and in practice, all year. Having produced the data, it seems churlish to not share it, especially since it costs me absolutely nothing to do so. If there is a hidden agenda here, it is that I think that in spite of advances over the last few decades, the investing world still has imbalances, especially on data access, and I would like it make a little flatter. Thus, if you find the data useful, I am glad, and rather than thank me, please pass on the sharing.
YouTube
LinksData for 2022 on my websiteArchived Data from previous years
December 15, 2021
Back in the Classroom: Time to Teach!
At the start of every semester for as long as I can remember, I have invited people to sit in informally on my classes at NYU or take the shorter online versions on my website. After thirty six years of teaching, you would think I would be jaded, but I am not. As we get ready for the spring, I am excited, perhaps more so than usual, because I hope to finally be in a real classroom, instead of online, for my classes.
Spring is here, and the classroom beckons!
I have always described myself as a teacher, first and foremost, but like many of you, COVID has been a disruptor. For much of the last two years, rather than teach my classes in a classroom, I taught my classes from my home office, making a few low-cost, low-tech investments to improve my set up.

I know that many of us, especially as we age, take the dystopian view that technology has hurt more than helped, and while I share the concern about the damage that social media has wrought on society, I remain thankful for the good that has come from technological advances. The combination of speedy internet access and delivery platforms (Zoom, Teams, Skype, Blue Jeans etc.) allowed me to deliver my classes from home, with some help. With a M1 MacBook Pro, a 27 inch LG display and my iPad Pro in sidecar mode, I could see everyone in my class, albeit with some work; with Zoom, the limit was 48 students at a time. My Rode Go lav mike and my AirPods Pro, took care of my audio needs, and my Logitech C920 camera supplemented my computer's camera to cover my video requirements, with two extra spotlights for late evening sessions, when natural light failed. To top it all off, and this was priceless, I could see the Pacific Ocean, out of my window, especially when I was able to teach standing, using my Flexispot standing desk to elevate my monitor. (If you are wondering why I have been so specific about my accessories, it is not because I receive sponsorship payments from any of these companies, but because it may help you replicate my set up, other than the view of the Pacific, if you are teaching or working from home. If you have a bigger budget, I would try to emulate Professor Andrew Lo, who described his astounding set up for teaching last year.)
In these last two years, I have learned a lot about online teaching and I hope that learning makes me a better teacher, both online and in the classroom.
First, with today's technology, online classes get scarily close to physically being in a classroom, a reminder to me, and teachers all over the world, that unless we offer something unique in a classroom setting, disruption is coming for the teaching business. Second, I learned there is some learning that is better delivered online, than in a physical setting, and I believe that there are some topics that I will continue to deliver online, even after this virus passes on. Third, while I still loved teaching online, I desperately missed the feeling of being in an actual classroom, looking at a collection of faces, some with eyes closed, some bored and some waiting to ask a question. After all, every teacher is a repressed actor, and actors draw their energy from their audiences, and I have been missing mine!Each semester, I step into a classroom wanting to teach the “best” class that I ever have, perhaps even the perfect class, knowing fully well that I will fall short, in practice, because there will be things to improve.Classes
I am a dabbler, not a specialist, and my teaching reflects that predisposition. During my teaching lifetime, I have taught a wide swath of classes, ranging from banking to equity instruments, but in the last twenty years, my focus has been on three classes, corporate finance, valuation and investment philosophies, with the last one taught only online. My classroom teaching at Stern has been mostly corporate finance and valuation, to both MBAs and undergraduates. With MBAs, the corporate finance class has been a first year elective and the valuation has been an elective in the second year, and with undergraduates, I have alternated between the two classes across the years. I have added shorter online versions of each class, offered on my website, at no cost, but with no credit. Starting a few years ago, Stern has offered certificate versions of each of the three classes, albeit at a price, but with more structure (quizzes, exams, projects) and a certificate, if you make it through.
Pre-Game Prep
In all of my regular classes, I have drawn on the assumption that my students come in with an exposure and understanding of three areas, accounting (more in the context of being able to read financial statements than the mechanics of debit and credit), basics of finance (especially the time value of money and an understanding of markets) and statistics (how to make sense of data). Being a control freak, I have created my own versions of what I would like my students to know in each of these disciplines, and you can find my versions on my website. With each of my classes, I am sure that purists in each of these areas would blanch not just at my choice of topics that matter, but also at my sloppiness in description, but I will let you be the judge of content.
The place to start is with accounting. Much as I abuse accountants in my classroom, I also recognize that almost all of the raw material we use in corporate finance and valuation comes from accounting statements. Put simply, if you cannot tell the difference between operating and net income, or what to consider as debt, you will be lost in any type of financial analysis. In my eleven-session (with each session lasting 15-20 minutes) accounting class, I cover the material that I draw on in my finance classes:
 Web page for class
Once you have the accounting basics under your belt, you can turn to the basics of finance. The time value of money is at the heart of almost everything in finance, and understanding the mechanics and intuition of present value is a bedrock on financial analysis. In my introductory finance class, I cover the time value of money, and how risk plays out in that computation, as well as look at three macro variables that we encounter repeatedly in financial analyses - inflation, interest rates and exchange rates.
 Web page for class
Finally, we live in the age of data, and it is surprising that we use that data so little, and when we do, so badly. If the role of statistics is to make sense of large and contradictory data, it is a critical skill in every discipline, and especially one, with as many numbers as finance. With the full disclosure that I am a statistical novice, I put together a statistics class, purely as a user of its many tools, and in 13 sessions, I cover everything from descriptive statistics to multiple regressions and simulations.
 Web page for class
If you are well versed in accounting, statistics and the basics of finance, you may find the material in these classes simplistic, but it never hurts to reinforce existing concepts.
The Game
If you have the pre-game behind you, it is time to turn to the main attractions (or tortures, depending on your perspective), and I will present them in the sequence that I think it makes the most sense to take them, if you want to torture yourself by taking all three.
a. Corporate Finance
If you have taken a corporate finance class in your past life, you may be surprised by what I cover, and what I do not, in my corporate finance class. My version of the class should have a different name, since it is not just about corporations and I am not sure that it is all about finance either. It covers the first financial principles that govern how to run a business, and as a consequence, it has the broadest reach and the deepest impact of any of my classes. Whether you are an entrepreneur, starting on the long process of converting an idea into a business, a manager, evaluating how to make business decisions consistently or a consultant, offering advice on what a business should do differently, corporate finance is your go-to class, since it offers guiding principles for all your tasks. I start the class with a one-page summary of the entire class:
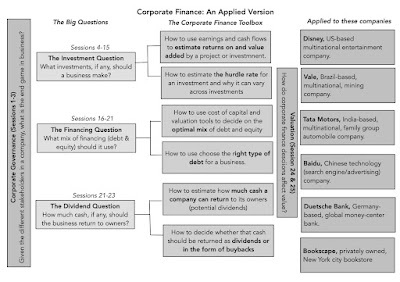 Web page for classAs you can see from the coverage, everything that happens in business is fair game in a corporate finance class, from whether ESG adds or detracts from value, why companies are shifting from paying dividends to buying back stock and how corporate tax changes can affect financing decisions. It is also, in every sense of the word, an applied class, with every concept applied to real companies that range the spectrum, across the life cycle, geographies and sectors.
I will be teaching this class to Stern MBAs, starting on January 31, 2022, meeting every Monday and Wednesday, from 10.30 am - 11.50 am, New York time, through May 9, 2022. If you are a Stern MBA, you are welcome to take the class, but if you are not, you can take the class informally, by watching the recorded sessions at this link, taking the quizzes and exam, if you are up for them, and even tracking the emails that I send the class at this link. Since the 26 sessions of the class are 80 minutes apiece, this will require a substantial investment in time, though no investment in money, albeit with no certification or credit. If that time investment is too much of a burden, I have created an online version of the class here, with 15-minute sessions replacing the longer classroom sessions, and while they will cost you nothing as well, they come with no certification. If certification is your end game, and I understand that it may help augment a resume, you can take the NYU version of the online class in the fall of 2022, with a more polished interface and personal interaction, but the same content, where you will get a certification and NYU will get a portion of your savings.
b. Valuation
My valuation class starts with an ambitious agenda, i.e., to give you the tools and techniques to value or price just about anything, from bitcoin to collectibles to infrastructure projects, and from any perspective, from a potential buyer to an accountant estimating fair value.
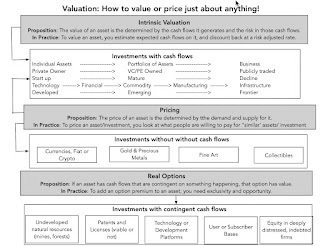 Web page for class
Along the way, I emphasize what I believe to be long standing truths about valuation. First, it is a craft, not an art or a science, and you get better at valuation by doing, not by reading or watching others do valuation. Second, while there are many practitioners and academics who use the words value and price interchangeably, the value and pricing processes are not only driven by different determinants, but also can yield different numbers for the same asset. Third, while valuations ultimately are collections of numbers, those numbers lose their resonance and meaning, if they are not connected to narratives that tie these numbers together.
This class will be taught to two different audiences, Stern MBAs, many of whom were in my corporate finance class last spring, and Stern undergraduates, mostly juniors. While the first group will meet every Monday and Wednesday, from 1.30 pm - 2.50 pm, from January 31, 2022, to May 9, 2022, and the second will meet every Monday and Wednesday from 3.30 pm - 4.45 pm, from January 24, 2022, to May 9, 2022, the classes are identical in content and delivery. You are welcome to unofficially partake in either of these classes, both in recorded form, but as with corporate finance, you can take an online version of the valuation class, with twenty six shorter (15-minute) sessions, for free, with no certification, on my site, or for a price and a certificate from NYU.
c. Investment Philosophy
This class has its origins in a seminar class that I was asked to teach more than twenty years ago, where successful investors would come in each session and talk about what they did in investing that made them successful. As we transitioned from technical analysts to value and growth investors to market timers, each of whom was successful, albeit with wildly different views of markets and divergent paths to success, I concluded that there could not be one template for investment success, and started looking at not only differences in investment philosophies, but also what personal qualities made for success, with each one. That led to a book, and then to a class on investment philosophies, where I cover the range of choices.
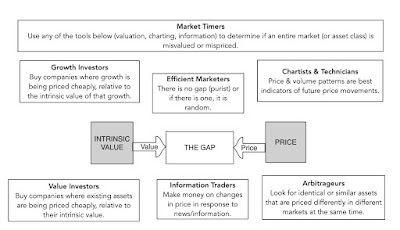 Web page for class
If there are two lessons that I hope that people take away from this class, it is (a) that no investment philosophy, no matter how storied and successful it has been in the past, has a monopoly on investment virtue and that (b) the right investment philosophy for you is the one that best fits your personality and strengths.
While I do not teach this course in a classroom, there are two ways you can take the class. One is online, on my website, where I lead you through a journey through different investment philosophies, weighing not just past successes, but also the combination of factors that you need to have to succeed each one, over the course of 36 sessions. As with the other online classes on my site, it is free, but without certification. If you do want certification, there is the NYU version of the class available here, but for a price (that I do not set or control... so it is not fair to argue its fairness or unfairness with me).
Game Plan
While I hope that the descriptions of the classes will help you decide which of these courses best fits you, you may still be confused about the choices and the sequence. I hope that the flow chart below provides a little more clarity:
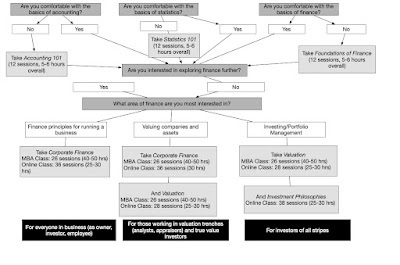 Web page for all classesAs you can see, if your end game is financial decision making within a business, as owner or employee, the corporate finance class will do, whereas if your intent is to learn the skills of appraising value, either for accounting/regulatory or transaction purposes, adding valuation will augment your tool kit. Finally, if you are an investor in companies, and are uninterested in the mechanics of value, you can go directly to the investment philosophies class, or make an intermediate stop, and take a look at valuation.
Conclusion Each time I present these choices, I will always have a few people demand to know my investment record, and with respect, I will refuse, for two reasons. First, there is nothing in my track record, whether positive or negative, that will help you assess whether what I talk about has heft, since luck is the dominant factor in any investor's track record, even over long periods. Second, this demand would make complete sense, if I were seeking to manage your money, which I am not, or promising you investment riches, which I am also not. If this absence of proof is a deal breaker for you, I understand, but if it is, trust me when I say that these are not the droids classes that you were looking for. My classes may not make you richer or wiser, but I hope that they give you a fresh perspective on finance and markets and the confidence to question what others contend to be truths. May the force be with you!
YouTube Video
Class List
Accounting for finance and investing (My webpage, YouTube Playlist)Foundations of Finance (My webpage, YouTube Playlist)Statistics for finance and investing (My webpage, YouTube Playlist)Corporate Finance (Spring 2022 MBA Class, Free Online, NYU Certificate in Fall 2022)Valuation (Spring 2022 MBA Class, Spring 2022 Undergraduate Class, Free Online, NYU Certificate)Investment Philosophies (Free Online, NYU Certificate)December 10, 2021
Managing across the Corporate Life Cycle: CEOs and Stock Prices!
One of the big news stories of last week was Jack Dorsey stepping down as CEO of Twitter, and the market's response to that news was to push up Twitter's stock price by almost 10%. That reaction suggested, at least for the moment, that investors believed that Twitter would be better off without Dorsey running it, a surprise to those in the founder-worship camp. As the debate starts about whether Dorsey's hand-picked successor, Parag Agrawal, is the right person to guide Twitter through its next few years, I decided to revisit a broader question of what it is that makes for a "great CEO" and how there is no one right answer to that question, because it depends on the company, and where it stands in its life cycle. In the process, I will also look at the thorny issue of what happens when there is a mismatch between a company and its CEO, either because the board picks the wrong candidate for the job or because the company has changed over time, and the CEO has not. Finally, I will use the framework to look at the relationships between founders and their companies, and how mishandling management transitions can have damaging, perhaps even devastating, consequences for value.
The "Right" CEO: A Corporate Life Cycle Perspective
The notion that there is a collection of characteristics that makes a person a great CEO for a company, no matter what its standing, is deeply held and fed into by both academics and practitioner. In this section, I will begin by looking at the mythology behind this push, and why it does not hold up to common sense questioning.
The Mythology of the Great CEO
Are there a set of qualities that make for a great CEO? To answer the question, I looked at two institutions, one academic and one practice-oriented, that are deeply invested in that idea, and spend considerable time advancing it.
The first is the Harvard Business School, where every student who enters the MBA program is treated as a CEO-in-waiting, notwithstanding the reality that there are too few openings to accommodate that ambition. The Harvard Business Review, over the years, has published multiple articles about the characteristics of the most successful CEOs, and this one for instance, highlights four characteristics that they share in common: (a) deciding with speed and conviction, (b) engaging for impact with employees and the outside world (c) adapting proactively to changing circumstances and (d) delivering reliably.The second is McKinsey, described by some as a CEO factory, because so many of its consultants go on to become CEOs of their client companies. In this article, McKinsey lists the mindsets and practices of the most successful CEOs in the following picture: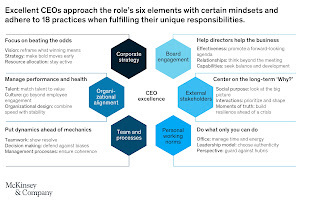
Given how influential these organizations are in framing public perception, it is no surprise that most people are convinced that there is a template for a great CEO that applies across companies, and that boards of directors in search of new CEOs should use this template. That perspective also gets fed by books and movies about successful CEOs, real or imagined. Consider Warren Buffett, Jack Welch and Steve Jobs, very different men who have been mythologized in the literature, as great CEOs. Many of the books about Buffett read more like hagiographies than true biographies, given how star struck the writers of these books are about the man, but by treating him as a deity, they do him a disservice. The fall of GE has taken some of the shine from Jack Welch's star, but at his peak, just over a decade ago, he was viewed as someone that CEOs should emulate. With Steve Jobs, the picture of an innovative, risk-taking disruptor comes not just from books about the man, but from movies that gloss over his first, and rockier, stint as founder-CEO of Apple in the 1980s. The problem with the one-size-fits-all great CEO model is that it does not hold up to scrutiny. Even if you take the HBR and McKinsey criteria for CEO success at face value, there are three fundamental problems or missing pieces. First, even if all successful CEOs share the qualities listed in the HBR/McKinsey papers, not all people or even most people with these qualities become successful CEOs. So, is there a missing ingredient that allowed them to succeed? If so, what is it? Second, I find it odd that there are no questionable qualities listed on the successful CEO list, especially given the evidence that over confidence seems to be a common feature among CEOs, and that it is this over confidence that allows them to take act decisively and adopt long term perspectives. When those bets, often made in the face of long odds, pay off, the makers of those bets will be perceived as successful, but when they do not, the decision makers are consigned to the ash heap of failure. Put simply, it is possible that the quality that binds together successful CEOs the most is luck, a quality that neither Harvard Business School nor McKinsey can pass on. Third, there are clearly some successful CEOs who not only do not possess many of the listed qualities, but often have the inverse. If you believe that Elon Musk and Marc Benioff, CEOs of Tesla and Salesforce, are great CEOs, how many of the Harvard/McKinsey criteria would they possess?
The Corporate Life Cycle
I believe that the discussion of what makes for a great CEO is flawed for a simple reason. There is no one template that works for all companies, and one way to see why is to bring in the notion that companies go through a life cycle, from start-ups (at birth) to maturity (middle age) to decline (old age). At each stage of the life cycle, the focus in the company changes, as do the qualities that top managers have to bring for success:
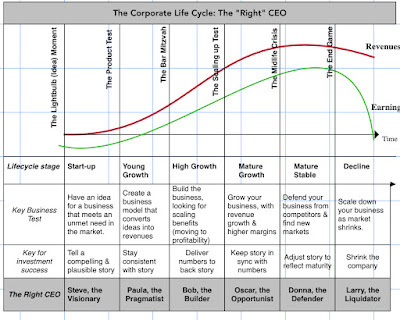
Early in the life cycle, as a company struggles to find traction with a business idea that meets an unmet demand, you need a visionary as a CEO, capable of thinking outside the box, and with the capacity to draw employees and investors to that vision. In converting an idea to a product or service, history suggests that pragmatism wins out over purity of vision, as compromises have to be made on design, production and marketing to convert an idea company into a business. As the products/services offered by the company scale up, the capacity to build businesses becomes front and center, as production facilities have to be built, and supply chains put in place, critical for business success, but clearly not as exciting as selling visions. Once the initial idea has become a business success, the needs to keep scaling up may require coming up with extensions of existing product lines or geographies to grow, where an opportunistic, quick-acting CEO can make a difference. As companies enter the late phases of middle age, the imperative will shift from finding new markets to defending existing market share, in what I think of the trench warfare phase of a company, where shoring up moats takes priority over new product development. The most difficult phase for a company is decline, as the company is dismantled and its sells or shuts down its constituent parts, since any one who is put in charge of this process has only pain to mete out, and bad press, to go with it. Have you ever read a book or seen a movie about a CEO who shrunk his or her company, where that person is painted as anything but a villain? In fact, I used "Larry the Liquidator" as my moniker for that CEO, to pay homage to one of my favorite movies of all time, "Other People's Money":
As you watch the video, note that the CEO of the company, under activist attack, is played by Gregory Peck (the distinguished gray-haired gentleman who sits down at the start of the video), who presumably embodies all the qualities that Harvard and McKinsey believe embody a great CEO, and Danny DeVito plays "Larry the Liquidator". Talk about type casting, but this company needs more DeVito, less Peck!
Mismatches, Transitions and Turnover
If you buy into my structure of a corporate life cycle, and how the right CEO for a company will change as the company ages, you can already see the potential for mismatches between companies and CEOs, for three reasons.
A Hiring Mistake: The first is that the board of directors for a company seeking a new CEO hires someone who is viewed by many as a successful CEO, but whose success came at a company at a very different stage in its life cycle. I think Uber dodged the bullet in 2017, when they decided not to hire Jeff Immelt as CEO for the company. Even if you had believed that Immelt was successful at his prior job as CEO for GE, and that is arguable, he would have been a horrifically bad choice as CEO at Uber, a company that is as different from GE as you can get, in every aspect, not just corporate age. A Gamble on Rebirth: The second is when a board of director picks a mismatched CEO intentionally, with the hope that the CEO characteristics rub off on the company. This is often the case when you have a mature or declining company that thinks hiring a visionary as a CEO will lead to reincarnation as a growth company. While the impulse to become young again is understandable, the odds are against this gamble working, leaving the CEO tarnished and company worse off, in the aftermath. It was the reason that Yahoo! hired Marissa Mayer as a CEO in 2012, hoping that her success at Google would rub off on the company, an experiment that I argued would not end well for either party (and it did not).A Changing Business; The third is a more subtle problem, where a company is well matched to its CEO at a point in time, but then evolves across the life cycle, but the CEO does not. Using the Uber example again, Travis Kalatnick, a visionary and rule breaker, might have been the best match for Uber as a company, in early years, when it was disrupting a highly regulated business (taxi cabs), but even without his personal missteps, he was ill-suited to a company that faced a monumental task of converting a model built on acquiring new riders into one that generated profits in 2017.In NY case, a CEO/company mismatch is a problem, though the consequences can range from benign to malignant.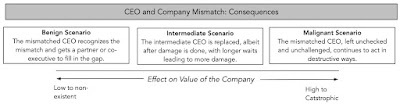 In the most benign case, a mismatched CEO recognizes the mismatch, sets ego aside and finds a partner or co-executive with the skills needed for the company. In my view, and many of you may disagree with me, the difference between the first iteration of Steve Jobs, where he let his vision run riot and almost destroyed Apple as a company, and the second iteration, where he led one of the most impressive corporate turnarounds in history, was his choice of Tim Cook as his chief operating officer in his second go-around and his willingness to delegate operating authority. In short, Jobs was able to continue to put his visionary skills to work, while Cook made sure that the promises Jobs made were delivered as products on the ground. In the most malignant form, a badly mismatched CEO is entrenched in his or her position, perhaps because the board of directors has become a rubber stamp or by tilting voting rules (shares with different voting rights) in favor of incumbency, and continues on a pathway that takes the company to ruin. In the intermediate case, the board of directors, perhaps with a push from activist investors and large stockholders, engineers a CEO change, albeit after some or a great deal of damage has been done.
The Compressed Life Cycle: Implications for Founder CEOs
It is a testimonial to how much technology companies have changed the economy and the market that some of the best-recognized names in business are those of the founders of successful technology company. I would wager that almost everyone has heard of Bill Gates, Jeff Bezos and Elon Musk, and that very few would recognize the names of Mary Barra (CEO of GM) or Darren Woods (CEO of Exxon Mobil). While there are some who venerate these founders, in what can only be called founder worship, there are others who have a more jaundiced view of them, both as human beings and as CEOs. The corporate life cycle framework provides a useful structure to think about how the technology companies, that dominate the twenty first century business landscape, are different from the manufacturing companies of the last century, and why these differences can create more management tensions at these companies.
Aging in Dog Years?
While every company goes thought the process of starting up, aging and eventually declining, the speed at which it does will vary depending on the business it is in. More specifically, the more capital it takes to enter a business and the more inertia there is among the existing players (producers, customers) are, the longer it will take for a company to get from start up to mature growth, but the same forces will play out in reverse, allowing the company to stay mature for a lot longer and decline a lot more gradual:
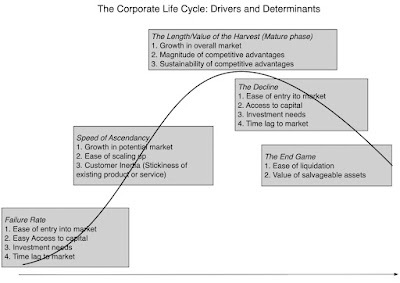 The great companies of the twentieth century took decades to ramp up, facing big infrastructure investments and long lags before expansion, had long stints as mature firms, milking cash flows, before embarking on long and mostly gradual declines. To illustrate, Sears and GE had century-long runs as successful companies, before time and circumstances caught up with them, and GM and Ford struggled for three decades setting up manufacturing capacity and tweaking their product offerings, before enjoying the fruits of their success. In contrast, consider Yahoo!, a company that was founded in 1994, that managed to reach a hundred billion in market capitalization by the turn of the century, enjoyed a few years of dominance, before Google's arrival and conquest of the market, before finally being acquired by Verizon in 2017. This compression of the life cycle has played out in tech company after tech company and the graph below captures the difference:
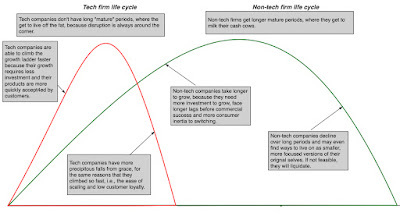
In short, tech companies age in dog years, with a 20-year tech company often resembling a hundred-year old manufacturing company, with creaky business models and facing disruption.
Implications for Founder CEOs and Management Turnover
Companies have always had founders, and while the conflict between founders and others in the company have been around for decades, the compressed life cycle has exacerbated these tensions and magnified problems. In particular, the research on founder CEOs has yielded two disparate findings. The first is that in the early stages of companies, founder CEOs either step down or are pushed out at much higher rates than in more established companies. The second is that those founder CEOs who nurse their companies to more established status, and to public offerings, are more entrenched that their counterparts at mature companies.
To understand the first phenomenon, i.e., the high displacement rate among founder CEOs of very young companies, I will draw on the work of Noah Wasserman at Harvard Business School who has focused intensively on this topic. Using data on top management turnover at young firms, many of them non-public, he concludes that almost 30% of CEOs at these firms are replaced within a few years of inception, usually at the time of new product development or fresh financing. Much of this phenomenon can be explained by venture capitalists, with large stakes, pushing for change in these companies, but a portion of it is voluntary, and to explain why a founder CEO might willingly step down, Wasserman uses the concept of the founder's dilemma, where founders trade off full control of a much less valuable firm (with themselves in control) for lesser control of a much more valuable firm (with someone else at the helm). In the corporate life cycle structure, it is a recognition on the part of founders or capital providers that the skills needed to take a company forward require a different person at the top of the organization, especially as a firm transitions from one stage of the life cycle to the next.
The founders who do manage to stay at the helm of companies that make it through to early growth status are put on a pedestal, relative to CEOs of established companies. While that may be understandable, in some cases, it can take the form of founder worship, where founders are viewed as untouchable, and any challenge to their authority is viewed as bad, leading to efforts to change the rules of the game to prevent these challenges. In the United States, where prior to 2004, it was unusual to see shares with different voting rights in the same firm, it is now more the rule than the exception in many tech companies.
Endowing CEOs with increased powers to fend off challenges seems like a particularly bad idea at tech companies, since their compressed life cycles are likely to create more, rather than less, mismatches between companies and their founder/CEOs, and sooner, rather than later. To see, why consider how corporate governance played out at Ford, a twentieth century corporate giant. Henry Ford, undoubtedly a visionary, but also a crank on some dimensions, was Ford's CEO from 1906 to 1945. His vision of making automobiles affordable to the masses, with the Model T, was a catalyst in Ford's success, but by the end of his tenure in 1945, his management style was already out of sync with the company. With Ford, time and mortality solved the problem, and his grandson, Henry Ford II, was a better custodian for the firms in the decades that followed. Put simply, when a company lasts for a century, the progression of time naturally takes care of mismatches and succession. In contrast, consider how quickly Blackberry, as a company, soared, how short its stay at the top was and how steep its descent was, as other companies entered the smart phone business. Mike Lazaridis, one of the co-founders of the company, and Jim Balsillie, the CEO he hired in 1992 to guide the company, presided over both its soaring success, gaining accolades for their management skills for doing so, and over its collapse, drawing jeers from the same crowd. By the time, the change in top management happened in 2012, it was viewed as too little, too late.
In my view, the next decade will bring forth more conflict, rooted in the compressed life cycle of companies. If I were a case study writer, and thank God I am not, I would not rush to write case studies or books about successful tech company CEOs, because many of those same CEOs will become case studies of failure within a few years. If I am an investor, I would worry more than ever before about giving up voting power to founder/CEOs, even if they are well regarded, because today's star CEO can become tomorrow's problem. I wonder whether the way Facebook has dealt with its privacy and related problems over the last few years would have been different, if investors had not allowed Mark Zuckerberg to effectively control 57% of the voting rights with less than 20% of the outstanding shares. It is worth noting that Twitter was one of the few social media companies that chose not to split its voting rights across shares, and that may explain the Jack Dorsey departure.
Implications for Investors I have long argued that when investing in young tech companies, you are investing in a story about the company, not an extrapolation of numbers. The compressed corporate life cycle, and the potential for CEO/company mismatches that it creates, adds a layer of additional uncertainty to valuation. In short, when assessing the value of a young company's story, you are also assessing the capacity of the management of the company to deliver on that story. To the extent that the founder is the lead manager, and the narrative-setter, any concerns you have about the founder's capacity to convert that story into business success will translate into lower value. Let me illustrate using three examples, the first being Amazon in my early valuations of the company between 1997 and 2000, the second being Twitter, especially in the context of Jack Dorsey's departure and Paytm, the Indian online company, whose recent IPO was a dumpster fire.I have always liked Amazon, as a company, and one reason for that was Jeff Bezos. Many younger investors are surprised when I tell them that Bezos was not a household name for much of Amazon's early rise, and that it was The Washington Post acquisition in 2013 that brought him into public view. One reason that I attached lofty values to Amazon as a company, even when it was a tiny, money-losing company was that Bezos not only told the same story, one that I described as Field of Dreams story, where if you build it (revenues), they (profits) will come. but acted consistently with that story. He built a management team that believed that story and trusted them to make big decisions for the company, thus easing the transition from small, online book retailer to one of the largest companies in the world. It is a testimonial to Bezos' success in transitioning management that Amazon's value as a company today would be close to the same, with or without him at the helm, explaining why the announcement that he was stepping down as CEO on July 5 created almost no impact on the stock price.I valued Twitter for the first time, just ahead of its IPO in 2013, and built a model premised on the assumption that the company would find a way to monetize its larger user base and build a consistently money-making enterprise. In the years since, I have been frustrated by its inability to make that happen, and in this post in 2015, I laid the blame at least partially at the feet of Twitter's management, contrasting its failure to Facebook's success. I don't know Jack Dorsey, and I wish him well, but in my view, his skill set seemed ill suited to what Twitter needed to succeed as a business, especially as he was splitting his time as Square's CEO, and talking about taking a six-month break in Africa. In fact, eight years after going public, Twitter's strongest suit remains that it has lots of users, but its capacity to make money of these users is still questionable. One reason why the market responded so positively, jumping 10% on the news that Dorsey was leaving, is indicative of the relief that change was coming, and the reason that it has fallen back is that it is not clear that Parag Agrawal has what the company needs now. He has time to prove investors wrong, but he is on probation, as investors look to him to reframe Twitter's narrative and start delivering results.A few weeks ago, I valued one of India's new unicorns, Paytm, an online payment processing company built on the promise of a huge and growing online payment market in India. In my valuation, I told an uplifting story of a company that would not only continue to grow its user base and services, but also that it would increase its take rate (converting users to revenues) and benefit from economies of scale to become profitable over the course of the next decade.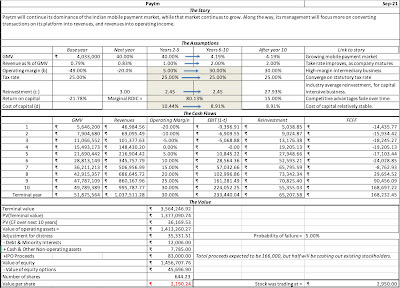
I valued Paytm at about ₹2,200, but in telling that story, I noted one big area of concern with existing management, that seemed to be more intent on adding users and services than on converting them into revenues, and pre-disposed to grandiosity in its statement of purpose and forecasts. In the months since, the company has gone public, and while the offering price, at ₹2150, was close to my value, the stock price collapsed in the days after to less than ₹1400 and has languished at about ₹1600-₹1700 since. It is always dangerous to try to explain why markets do what they do over short periods, but I do think that the company's founders and spokespeople did not do themselves any favors, ahead of the IPO. Specifically, if you were concerned about Vijay Sharma's capacity to convert the promise of Paytm into eventual profits, before the IPO, you would have been even more concerned after listening to him in the days leading into the IPO. It is still too early to conclude that there is a company/CEO mismatch, but if I were top management of the firm, I would talk less about users and gross merchandise value, and focus more on improving the abysmally low take rate at the firm. If there is a general lessons for investors from this post, it is that when a founder CEO leaves his position, or is pushed out, the value change can be positive or negative, and that good founders will work at making themselves less central to their company's stories over time and thus less critical to its value. It should also be a cautionary note for those investors who have looked the other way as venture capitalists, founders and insiders have fixed the corporate governance game in their favor, in young tech companies that go public, ensuring that mismatches from companies and CEOs, if they occur in the future, will persist.
Family Group Companies: The Life Cycle Effect In much of the world, businesses, even if they are publicly traded, are run by family groups. To the extent that the top management of these businesses are members of the family, these companies are uniquely exposed to company/CEO mismatches, especially as second or third generations of a family enter the management ranks, and these families enter new businesses.
Family Group Companies: The Life Cycle Effect? Much of Asian and Latin American business is built around family groups, which have roots that go back decades. Using a combination of connections and capital, these family groups have lived through economic and political changes, and as many of the companies that they own have entered public markets, they have stayed in control. In some cases, this control has come from dominant shareholdings, but more often, it is exercised by using holding company structures and corporate pyramids that effectively leave the family in control, even as the public acquires a larger stake in equity. To see how the corporate life cycle structure story plays out in family group companies, it is worth remembering that family groups often control companies that spread across many different business, effectively resembling conglomerates in their reach, but structured as individual companies. Consequently, it is not only possible, but likely, that a family group will control companies at different stages in the corporate life cycle, ranging from young, growth companies at one end of the spectrum to declining companies at the other end of the spectrum. In fact, one of the reasons family groups survived and thrived in economies where public markets were under developed was their capacity to use cash generated in their mature and declining businesses to cover capital needs in their growing businesses. This intra-group capital market becomes trickier to balance, as family group companies go public, since you need shareholder assent for these capital transfers. With weak corporate governance, more the rule than the exception at family group companies, it is entirely possible that shareholders in the more mature and cash-generating companies in a family group are being forced to invest in younger, growth companies in that same group.
Implications for CEOs and Management There is research on CEO turnover in family group companies, and the results are not surprising. In a recent study, researchers looked at 4601 CEOs in companies, classifying them based on whether they were family CEO or outside CEOs, and found the forced turnover was much less frequent in the first group. In other words, family CEOs are less likely to be fired, and more likely to stay around until a successor is found, often within the family. While this is good news in terms of continuity, it is bad news if there is a company/CEO mismatch, since that mismatch will wreak havoc for far longer, before it is fixed. What can family groups do about dealing with the mismatch, especially as the potential for that mismatch increases, as disruption turns some mature and growing businesses into declining ones and capital gets shifted to new businesses in the green energy and technology space? First, power has to become more diffuse within the family, away from a powerful family leader and more towards a family committee, to allow for the different perspectives needed to become successful in businesses at other stages in the life cycle. If, like me, you are a fan of Succession, the HBO series, you don't want to model yourself on Logan Roy, and the Roy family, if you are a family group company. Second, there has to be a serious reassessment of where different businesses, within the family group, are in the life cycle, with special attention to those that are transitioning from one phase to another. Third, if top management positions are restricted to family members, the challenge for the family will be finding people with the characteristics needed to run businesses across the life cycle spectrum. As many family groups enter the technology space, drawn by its potential growth, the limiting constraint might be finding a visionary, story teller from within the family, and if one does not exist, the question becomes whether the family will be willing to bring someone from outside, and give that person enough freedom to run the young, growth business. Finally, if a mismatch arises between a family member CEO and the business he or she is responsible for running, there has to be a willingness to remove that family member from power, sure to raise family tensions and create fights.
Implications for Investors Are family group companies, in general, better or worse investments than investments in other publicly traded companies? The evidence, not surprisingly, is mixed, with some finding a positive payoff, which they attribute to a better alignment of long term investor and management interests at these companies, and others finding negative returns, largely as a result of management succession problems. To address why family control can help in some cases, and hurt in others, it again helps to bring in the corporate life cycle. In the portions of the corporate life cycle, where patience and a steady hand are required, the presence of a family member CEO may increase value, since he or she will be more inclined to think about long term consequences for value, rather than short term profit or pricing effects. On the other hand, if a family CEO is entrenched in a company that is transitioning from growth to mature, or from mature to declining, and is not adaptable enough to modify the way he or she manages the company, it is a negative for value. Family group companies composed primarily of companies in the former grouping will therefore trade at premiums, whereas family group companies that include a disproportionately large number of disrupted or new businesses will be handicapped.
Conclusion I started this post by talking about Jack Dorsey leaving Twitter, and why the market celebrated that news, but I would like to end on a more general note. If there is a take away from bringing a life cycle perspective to assessing CEO quality, it is that one size cannot fit all, and that a CEO who succeeds at a company at one stage in the life cycle may not have the qualities needed to succeed at another. For boards of directors, in search of new CEOs, my suggestion is that you pay less attention to past track records of nominees, in their prior stints as employees or as CEOs of other companies) and more attention to the qualities that they possess, to see if they match what the company needs to succeed.
YouTube Video
November 9, 2021
Tesla's Trillion Dollar Moment: A Valuation Revisit!
I have been writing about, and valuing, Tesla for most of its lifetime in public markets, and while it remains a company that draws strong reactions, it is also one that I truly enjoy valuing. It has been a while since my last valuation of the company, which occurred in January 2020, and given how much the landscape has changed since, partly as a result of the company's own actions and partly because of how COVID has upended its competitors in the automobile business, it is time to revisit the company and reassess its value, especially as the company’s market capitalization crosses a trillion dollars.
Tesla: The Back Story
I first valued Tesla in 2013, as a "luxury automobile company" and I have valued almost every year since. If you are interested, you can see my valuations from 2014, 2016 and 2017. If you review those valuations, you will notice that in each valuation, my story for the company expanded, and my valuations increased, but the market price for the company jumped even more, leading me to conclude in each of them that it was not a company that I would invest in. While these valuations led me to different assessments of value, there were common themes across time:
At its core, Tesla has been an automobile company: In my 2016 post on Tesla, I described it as the ultimate story stock, driven less by news about its most recent financial performance, and more by news that alters its story trajectory. I would be lying if I said that I have had clarity about Tesla's story over the last decade, because it has so many tangents, distractions and shifts along the way, flirting with narratives about being a battery company, an energy company and a technology company. In 2021, looking at the company, I feel more convinced than I was a few years that it is, at its core, an automobile company, and while it will continue to derive revenues from batteries and perhaps even software, its pathway to becoming a trillion dollar market cap company still runs through the "car company" story.Tesla has disrupted and reinvented the automobile business: Putting any company into the automobile business handicaps it, when it comes to value, for a simple reason. The automobile business has been in trouble for quite a while, struggling with anemic revenue growth in the aggregate, and abysmal profit margins, with even the very best in the group struggling to earn returns that match, let alone beat, their costs of capital. As I have valued Tesla over the years, I have come to the realization that it is the most 'uncar-like" automobile company in the world, and its uniqueness shows up on two dimensions. The first is on profitability, where its operating cost structure, unconventional distribution model (which bypasses dealerships), and capacity to augment revenues with related products and services, has given it an opening to deliver much higher margins than any automobile company in history. The second is on investment and capital intensity, where it has managed to take what critics pointed to as weaknesses (unwillingness to build large and expensive assembly plants ahead of time, to meet future demand) and made them into strengths. Put simply, the company has been able to scale up more quickly, while reinvesting less in capacity, than any other automobile company.Tesla positioned itself well for structural shifts in the economy: Tesla's success over the last few years has also been fed by three other external forces. The first is in the government and business response to climate change, and the resulting policies favoring electric cars over gas-powered, cars. It is undeniable that Tesla, especially in its early years, was a beneficiary of tax credits and other benefits meted out to electric car makers and buyers. The second is the rise of ride sharing, with a host of companies around the world upending the status quo in car service. While Tesla has not directly benefited yet from this trend, it has opened up possibilities for the future, built around self-driving cars, that have added to the company's allure. The third is the rise of ESG as an investing force, and the resulting shift away by investors from all things fossil-fuel related, has benefited Tesla, at the expense of the legacy automobile companies.Tesla is built around an outsized personality: When valuing publicly traded companies, I seldom talk about its top management explicitly, since the numbers reflect what they bring to the firm. That rule does not work with Tesla, since its founder and CEO, Elon Musk, has many qualities, but being self effacing is not one of them. Tesla and Musk are locked at the hip, and it is almost impossible to have a view on one, without having a similar view on the other. Put simply, I am still to meet an investor who loves (dislikes) Tesla as a company, and dislikes (loves) Musk. On the plus side, Musk is a visionary and out-of-the-box thinker, and an evangelist for his visions, who draws true believers to his cause. On the other side of the ledger, he is unpredictable and prone to distractions that draw attention away from the company, and his impulses have created costs for the company and its investors. While his net effect has clearly been a net positive for investors in Tesla, over the last decade, it is worth remembering that you are getting a package deal, when you invest in the company.Tesla draws extreme reactions: I have never valued a company, where there is as much divergence in views about the future, cross market players, that I have seen with Tesla and Musk. There are some who see Elon as the ultimate con man, and Tesla as a shell game, and many in this group have spent the last decade making Tesla one of the most shorted stocks in history. There are others who view him a savior, and map out pathways for Tesla to become the most successful company of all time, and many of them have bought shares in the company, and held through good and bad times.My two most recent valuations were in June 2019 and January 2020, and I am going to go back to them, not just because they are recent, but because they led to investment decisions on my part.
In June 2019, Tesla had hit a rough spot, partly due to concerns about production bottlenecks and debt, and partly due to self inflicted wounds. Musk's tweets about going private, with funding secured, contributing to a sell off, driving the stock down to $180 ($36 in today's split adjusted terms). I valued the company, with conservative assumptions about growth and margins, and incorporating my concerns about managerial missteps, at about $190: While the buffer (between value and price) was small, I did buy shares in the company.Between June 2019 and January 2020, the stock went on a tear, as the stock price more than tripled, and I revisited my Tesla valuation. With a more expansive view of future growth and profitability, I revalued Tesla in January 2020 and more than doubled my valuation, though that still left me well below the market price. I sold my shares then, and I know that many of you have pointed out how much money I have lost as a consequence of that sale, as the stock price has increased almost ten-fold since then, and I will come back and talk about my regrets, or absence thereof, towards the end of this post.Tesla: The Numbers
It has been roughly 22 months since my last valuation of Tesla, and it is astonishing how much change there has been, not just in the company, but also in the macro environment that it operates. In this section, I will start by chronicling the astonishing rise of Tesla in public markets in the last decade, follow by looking at the company's operating details and close by examining how the company has found a way to turn the COVID crisis into an opportunity.
Stock Prices and Market Cap
To put Tesla's explosive performance in the last two years in perspective, I will look at its market performance since its entry into public markets. The graph below contains Tesla's stock price, adjusted for stock splits, going back to 2010, and ending in November 2021:

While the graph illustrates the surge in the stock price, the table embedded in the graph conveys the rise more vividly, by listing Tesla's market capitalization in millions of dollars. In sum, the company's market cap has risen from $2.8 billion in August 2010 to more than a trillion dollars in November 2021, and along the way, it has not only made Elon Musk into the wealthiest man in the world, but also enriched those who bought into his vision early, and stayed invested in the company.
Revenues and Earnings
While the initial rise in Tesla's market capital was driven by the promise of the company, and detractors were quick to note Tesla's paltry revenues and big losses, the company's more recent financials reflect how it has acquired substance over time. In the graph below, I report on Tesla's quarterly revenues, gross profits and operating profits going back to 2013:

Tesla's quarterly revenues have risen from negligibly small values at the start of the last decade to almost $14 billion in the third quarter of 2021, making it the 20th largest automobile company in the world in 2020 (in revenue terms). The company spent much of the last decade losing large amounts each year, but it now not only generates an operating profit, but a healthy one at that, with a pre-tax operating margin of close to 15% in the third quarter of 2021.
The COVID Effect
While Tesla's resurgence has been building for a while, its growth has clearly exploded in the last year and a half, a period where our personal and business lives have been upended by COVID. During this most trying of times for all businesses, and especially for those in manufacturing, Tesla has not just survived, but thrived, gaining market at the expense of its rivals and accelerating towards profitability. To understand why, I would point you to a series of posts that I did during 2020 about how COVID was playing out in markets, and the winners and losers. In particular, I noted to the following aspects that made the COVID crisis different, from prior crises:
Risk capital stayed in the game: The most striking feature of last year's crisis was how quickly markets came back from the savage sell off between February 14 and March 23 of 2020, and I argued that the biggest reason for that come back was the resilience of private risk capital. Instead of withdrawing from markets, as in prior crises, venture capital investing, initial public offerings and investment in the riskiest segments of both stock and bond markets continued, and actually increased, through 2020, and those trends have continued this year. Flexibility over Rigidity: While the overall market quickly recovered, the recovery was uneven, and the crisis left behind winners and losers. In this post, I argued that one of the key dividing lines between the two groups was flexibility, with companies with more flexible investing, financing and dividend policies winning out over companies with more rigidity on those dimensions. To be specific, service/technology companies gained at the expense of manufacturing & natural resource firms, debt-light firms won at the expense of those with much bigger debt burdens and firms that paid large dividends lost value, relative to firms that did not.Young beat old: Another factor differentiating winners and losers during 2020 was that, unlike prior crises, young companies (early in their life cycles) benefited at the expense of mature and aging companies (with far more of their value coming from investments in place).I summarized the transfer of wealth in a table in my final update:As you can see young, high growth companies, with little debt and no dividends, benefited at the expense of older companies, with more debt and dividend commitments. You could argue that if central casting were creating the perfect COVID winner, it would look a lot like Tesla, a young, adaptable company in a sector filled with companies with expensive manufacturing facilities, large debt burdens and legacy dividend policies. In fact, many of what many (including me) considered to be Tesla's weaknesses (make-shift manufacturing, seat-of-the-pants financing) in the pre-COVID age became strengths during COVID. While conventional automobile companies shuttered and scaled down manufacturing, Tesla continued to make and sell cars through the pandemic, and it is inarguable that it has come out of this crisis, far stronger than it was going into it. The table below breaks down the Tesla's performance from the last quarter of 2019 to the third quarter of 2021:
 Tesla: The COVID QuartersFocusing on the key financials of the company and looking at Tesla's performance through the COVID quarters, there are trends that stand out. The first is that the company stumbled briefly on revenues in the second quarter of 2020, as COVID restrictions kicked in, but saw a surge in growth in the quarters since, with growth rates significantly higher than in the pre-COVID years. The second, and more significant, is that the company seems to have turned the corner on profitability, with margins not just improving, but dramatically so, with gross margins moving towards 30% and operating margins exceeding 14% in the most recent quarter.In brief, if there Tesla's growth was lagging, leading into 2020, and there were worries about its capacity to be profitable, the COVID quarters seem to have removed both concerns.
Tesla: Updated Story and Valuation
I have long argued that the three most freeing words in investing and valuation are "I was wrong", and with Tesla, I have had to say those words repeatedly over the last decade. Through its lifetime, I have under estimated Tesla's value, and while COVID may have given the company an assist, my updated valuation will reflect what I have learned, since January 2020, about the company.
Story Components - Revisiting the Past
Over the years, I have tried, not always successfully, to navigate between the extremes on Tesla, and tell a story that reflects the company's strengths and weaknesses. Not surprisingly, that story has changed over time, as the company, the business and the world have all changed. In the table below, I list the stories that I have told, with end-year revenues, operating margins and valuations for equity, for each one, in 2013, 2017, 2019 and 2020:

Over time, as you can see my story for Tesla has become bigger (in what I see both as its potential market and the revenues from it) and I have adapted my story to reflect the company's capacity to reinvest far more efficiently than the typical automobile company that I used in my very first valuation.
To see how much I was off the mark with my September 2013 valuation, I decided to compare my predicted revenues and operating income with the actual revenues and operating income from 2013-14 to 2020-21:
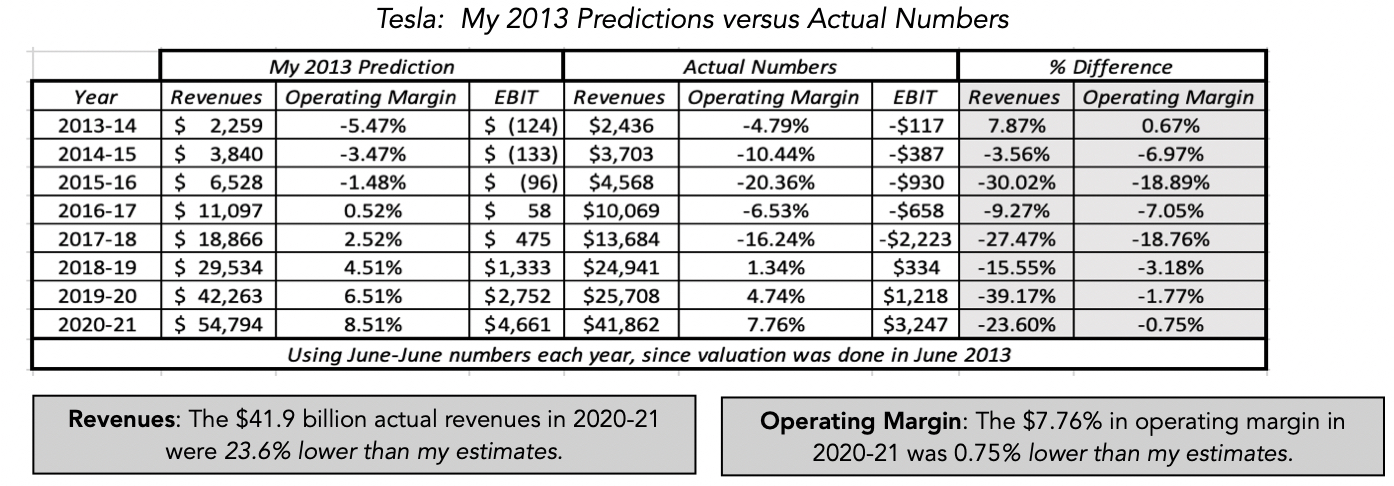 This may surprise you, since my 2013 valuation seems, at least in hindsight, to be hopelessly pessimistic, but I actually over estimated Tesla's revenues and profitability in the years since; the actual revenues in 2020-21 came in almost 24% below my prediction and my predicted margin of 8.52% was 0.75% higher than the actual margin posted by the company in that year. That said, I assumed in the 2013 valuation that, by 2021, Tesla's growth would be plateauing, and the company would be moving towards being a profitable, luxury car company. Instead, the company seems to be just getting started, redefining itself as a mass market company, with much bigger ambitions. I know that for some, my shifting stories and valuations are a sign of weakness, both in my analytical capabilities and in the very idea of intrinsic valuation. For me, and this may be just my delusions talking, an unwillingness to change your valuation stories and inputs, especially in a company that delivers as many twists and turns as Tesla, is a far greater sin.
Updated Story and Valuation Whatever your priors were on Tesla coming into COVID, it is difficult to argue with the fact that the company has benefited from the economic changes it has wrought, and that its story has become bigger. The question of how big is what will determine value, but rather than give you my assessment at the start, I want to try an experiment. Ultimately, whatever story you tell about Tesla has to show up in five inputs that drive its value: (a) Revenue growth, or what you see as end revenues for the company in steady state, (b) Business profitability, reflecting what you see as unit economics, and captured in the pre-tax operating margin, (c) Investment efficiency, measuring how much investment will be needed to get to your estimated end revenues, (d) Operating risk, incorporated into a cost of capital for the company and (e) the chance that the company will not make it, gauged with a probability of failure. If you are willing to go along, with each input, I will lay out the choices (as objectively as I can) and I would like you to take your pick, given what you believe about the company. As you make these choices, though, please do not open the spreadsheet that I will provide at the end, to convert your choices into value, since that will create a feedback loop that can feed your biases.Revenues: I do believe that Tesla has come out COVID with the potential for far more revenues than it did, going in. In particular, as the automobile market increasingly shifts to electric cars, Tesla will hold a strong competitive advantage in that portion of the market, and have the chance to be a market leader. To get a sense of what this will mean in terms of revenues by 2032, consider the following choices:

Note that if your story draws primarily on Tesla remaining an auto company, revenues of $400 billion will translate into about ten million cars sold in that year, more than ten times the number of cars the company sold in 2020-21. If you believe that there are other businesses that Tesla will enter, you can augment your revenues with the added sales in those other businesses, keeping in mind that most of these businesses have far less revenue potential than the car business.Profitability: The biggest eye opener for me, during COVID, has been the surge in profitability at Tesla, with the operating margin nearing 15% in the third quarter of 2021. While that number is volatile and there will be ups and downs, it looks like the electric car business has far better unit economics than the conventional automobile business. Notwithstanding Tesla's first mover advantage, this margin will come under pressure not only from increased competition from electric car offerings from existing automakers and new entrants (Neo, Rivian etc.), but also from having to cut prices to increase market share in Asia, where car prices tend to be lower than in the US and Europe. Laying out the choices in terms of profitability:
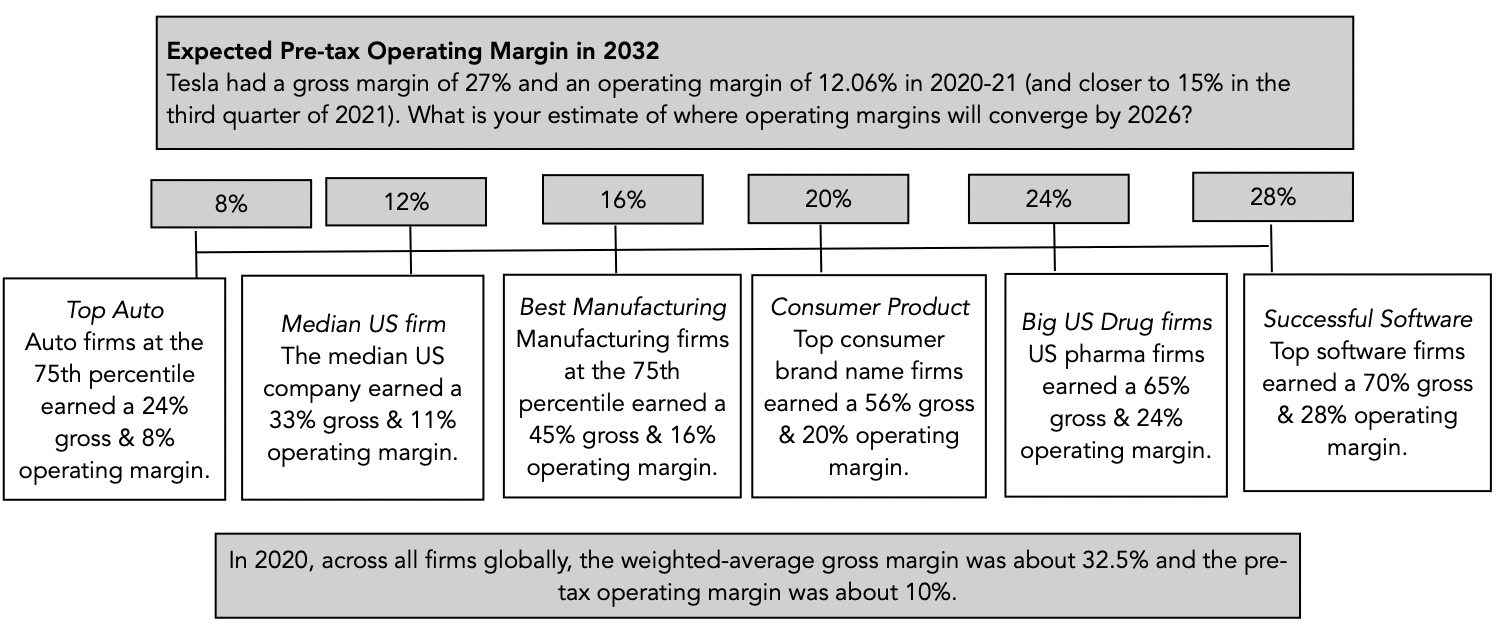
As you make this choice, recognize that Tesla is already approaching peak level gross margins for a manufacturing company, with its 30% gross margin in the last twelve months.Reinvestment:When I first valued Tesla in 2013, it had one plant in Fremont that produced all of the cars that it sold. At the time, one of my concerns was that the company would need massive reinvestment in assembly plants to ramp up even to luxury car revenue levels, and that this reinvestment would create significant cash burn. In the years since, Tesla has not only added capacity in lumps with assembly plants/giga factories in Storey County (Nevada), Buffalo (New York), Shanghai (China), Berlin (Germany) and Austin (Texas), but has spent far less than I originally estimated that they would have to invest. That said, if you are projecting that Tesla will sell 8, 10 or 12 million cars a year, a decade from now, it will need to reinvest in additional capacity. I use the sales to capital ratio as my proxy for investment efficiency (with higher values implying more efficiency investing), and the choices are below:
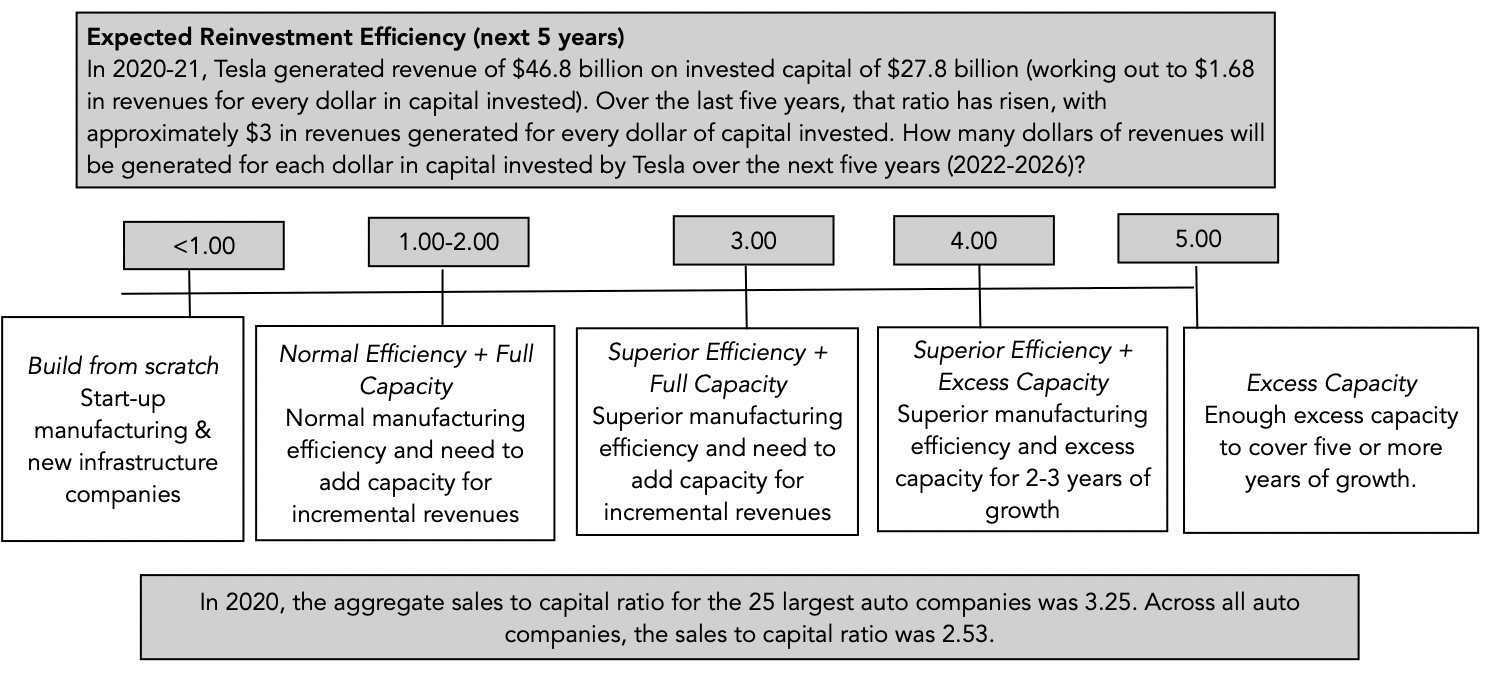 To the extent that the company has the excess capacity to cover growth for the next few years, I will allow for a a higher sales to capital ratio in the early years, but move it towards a more sustainable number thereafter. Risk: When I valued Tesla last in early 2020, I used a cost of capital of 7%, reflecting a risk free rate of 1.75% and an equity risk premium of 5.2% for mature markets. In November 2021, the risk free rate is down to 1.56% and equity risk premiums have drifted to 4.62%, and the cost of capital for the median firm had drifted down to about 5.90%. The choices you have on cost of capital are structured around those market realities:
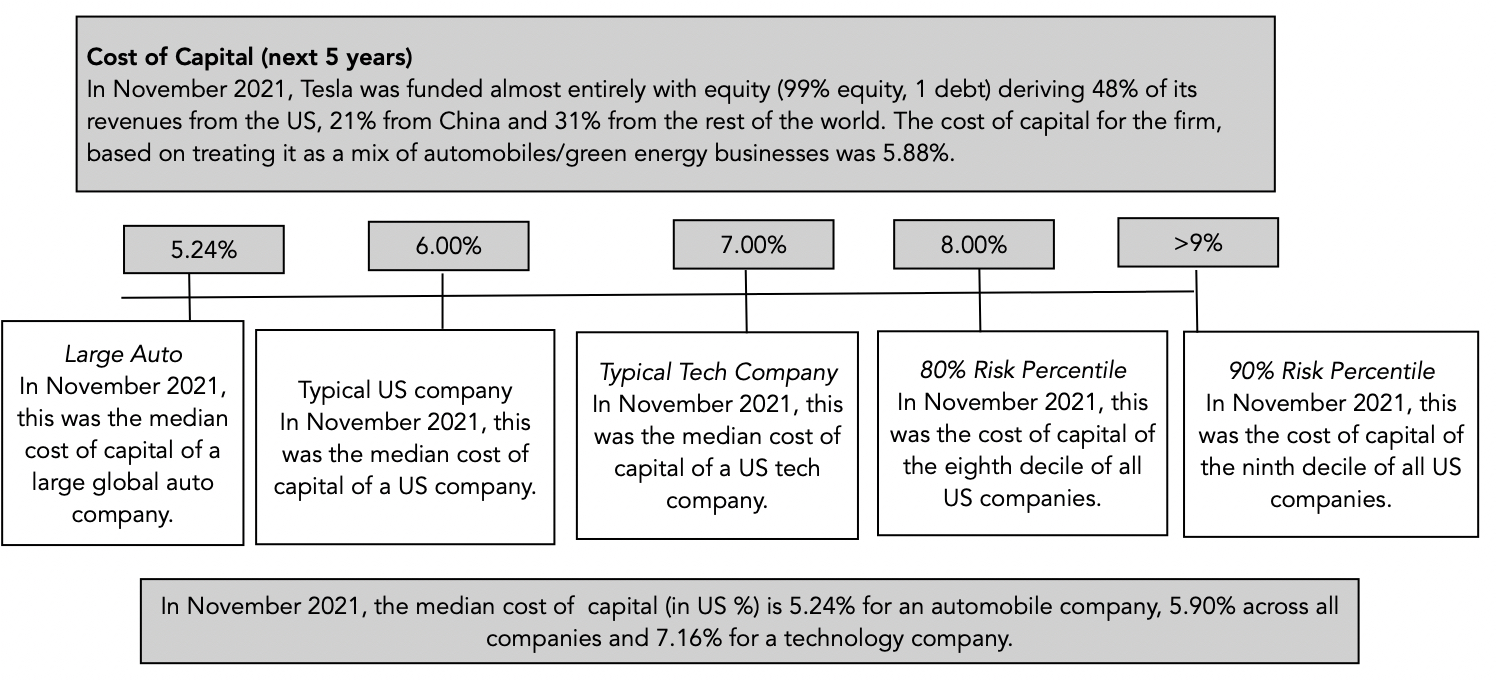 The other risk measure that will affect value is the likelihood of failure, a number that has varied over Tesla's history, partly because it used to lose money and partly because of a choice it made to borrow money in 2016. In making this assessment now, recognize that Tesla now has a cash balance that exceeds its debt due and is making money, at least for the moment.Management: Taking to heart how closely Tesla and Elon Musk are connected, one of the concerns with Tesla has always been the sheer unpredictability of Mr. Musk. The Musk effect on value can be positive, neutral or negative, depending on your priors:

While Musk has been better behaved and more focused for the year and a half, with the exception of indulging in tweeting about cryptos, he seems to have reverted to bad habits in the last two weeks, seeking guidance from his Twitter followers on whether to sell a significant portion of his Tesla shares and indulging in a back-and-forth with senators about the billionaire tax.
I made the choices just as you did, and in the most upbeat of my forecasts, I aimed for revenues of roughly $400 billion (about ten million cars, augmented by revenues from ancillary businesses) in 2032, operating margins of 16% and a sales to capital ratio of 4.00 for the next five years (making Tesla far more profitable and investment efficient than any large manufacturing company in the world). With a cost of capital of 6% (close to the median company) and no chance of failure, it should come as no surprise that my estimated value of equity for the company has increased more than six-fold since my last valuation, to about $692 billion for equity in the aggregate, and $640 billion for equity in common stock.
 Download spreadsheet
There are very few companies in the world that I would value at more than half a trillion dollars, and with Tesla, I get there almost entirely based upon its potential for growth and profitability. That said, though, the value per share that I get of $571, even in this most upbeat of scenarios, is less than half the current stock price, leaving me with the conclusion that the stock is over valued. Rather than take issue with my valuation, put your inputs into the attached spreadsheet and estimate your value of equity for the firm.
What’s your story?
Given my choice to sell shares in Tesla at precisely the wrong time (in January 2020) and my history of undershooting on value for the company, I am the last person you should be relying on for your Tesla investment judgments. There are multiple caveats that go with my valuation, and it is possible that you are able to find a story that yields a valuation not just higher than mine, but also higher than the stock price. Alternatively, you might be one of those who believes that much of what we have seen as improvements in the last two years at Tesla are a mirage, and that I am being delusional in my assumptions. While I welcome debate and disagreement, I have found that, with Tesla, it is easy to get off on tangents and argue about what ultimately become distractions, and I would posit that almost any disagreement that we have about Tesla ultimately becomes one about how much revenues the company can generate from the businesses you see it operating in, and how profitable it will be as a company.
Revenues: In making my revenue estimates, I have assumed that Tesla will get a predominant portion of its revenues from selling cars, partly because of its history and partly because its alternative revenue sources (batteries, software etc.) are not big revenue items. It is possible, though, that there are new businesses with ample revenues that Tesla can enter, that can create new and substantial revenue streams. It is also possible that the electric car business will resemble technology businesses in their winner-take-all characteristics, and that Tesla will have a dominant market share of that business. In either case, you will have to find ways to get to revenues far greater than my already-daunting number of $414 billion in 2032. (Just for perspective, the total revenues of all publicly traded automobile companies, globally, in 2020-21 was $2.33 trillion and this would give Tesla roughly one sixth of the overall market.)Profitability: The other key driver of Tesla's value is its operating margin. While I think that my estimate of 16% is already at the upper end of what a manufacturing company can generate, there are a couple of ways in which Tesla might be able to get even higher margins. One is to enter a side business, perhaps software or ride sharing (with automated driving cars), that has much higher margins than the auto business. The other is to benefit from technological advantages to reap the benefits of economies of scale in production; this would require gross margins to continue to climb from less than 30% to much higher levels.You can check this for yourself, but the other assumptions about reinvestment and risk don't have as big an impact on value, and I have computed Tesla's equity value (in common stock) as a function of targeted revenues and operating margins.
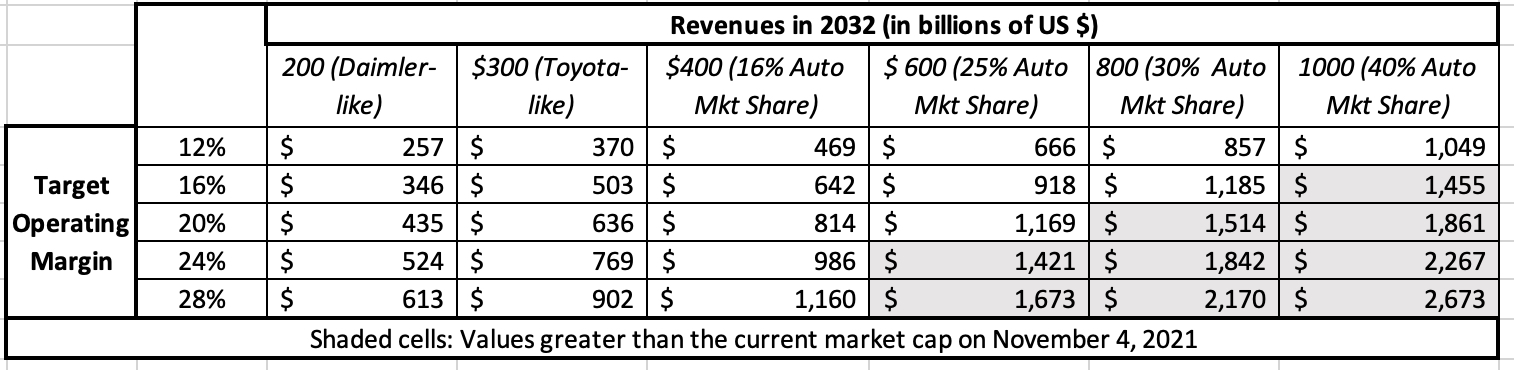
As you can see, there are pathways that exist to get to the current stock price and above, but they require that you enter rarefied territory with Tesla, assuming that it will have more revenues than any company (not just automobile) in history, while delivering operating margins similar to those delivered by the largest and most successful technology stocks, none of which have the drag of substantial manufacturing costs.
Tesla: The Pricing Game
If you are holding or buying Tesla, finding a story to justify its current market capitalization will require a real stretch, a story that will require the company to not just be successful but a one-of-a-kind company. That said, I believe that Tesla is a "trade", not an "investment", and that perspective provides answers to four questions that you may have about the stock.
How do you explain the current stock price? For much of the last decade, Tesla skeptics have struggled with explaining why the stock is priced at the levels that it is, by the market. Put simply, they have wondered how a company with little revenue and big losses acquires a market capitalization of hundreds of billions of dollars. I have never tried to explain what other people pay for a stock, but the answer may lie in the fact that those trading Tesla are pricing it, based on pricing variables (mood, momentum), rather than on fundamentals (earnings and cash flows). Why does the price change so much on news stories? Tesla has always been a company, where small and sometime trivial news stories cause big price changes. Take the news story a couple of weeks that Hertz was considering ordering 100,000 cars from Tesla. Given that the current market cap of Tesla reflects an expectation that the company will sell 10 million cars or more in a few years, the Hertz order, by itself, will have a tiny impact on value, and certainly far less than the hundred billion dollar jump in Tesla's market capitalization, after the news. However, if you view Tesla as a "story stock", the Hertz news story can be viewed as a sign that the company has made the transition from being a second car for the wealthy to a much wider market, potentially leading to a higher pricing.Does price affect value? Much as I would like to argue that intrinsic valuations are about cash flows, growth and risk, and are therefore insulated from market dynamics, the truth is more nuanced. The ten-fold surge in the stock price since last January did have an effect on my valuation, pushing me towards more upbeat and bigger stories, even though I still found the company to be over valued. If stock prices drop by 50% in the next few weeks, my assessment of value may be lower, as a consequence. In sum, it is almost impossible to value companies in a vacuum, where what the market is doing can be ignored.If I think the stock is over priced, why not sell short? To the question of why, if I believe in intrinsic value, I am not selling short on Tesla, it is because I believe that, at least in the short term, momentum beats fundamentals, and I have no desire to be caught in the whiplash effect. If you are a Tesla trader, I wish you the best, but I do hope that you don't delude yourself, if successful, with tales of fundamentals. You were on the right side of momentum, and whether this was a function of luck or skill, I will leave it for you to decide.Conclusion
In the last year and a half, I have heard from many of you about my decision to sell Tesla, and while I am thankful for your concern about my investment performance, there are a few of you who have asked me whether I was sorry that I had sold Tesla, just ahead of its run-up in the last year and a half. I would be lying if I said that I did not think about the money I could have made, by holding on, when the stock crossed a trillion-dollar market cap, but those second thoughts have been fleeting and I have no regret. Like everyone else, I would rather make money on my investments, than lose money, but I would also rather leave money on the table and have an investment philosophy, flawed though it may be, than make money, and end up without a core set of beliefs about markets. I can say with certainty that I will be back valuing Tesla some time in the future, either because it has crossed a new threshold or because it is in the news. This company is far too interesting to ignore!
YouTube Video
Spreadsheets
Automobile Sector in November 2021Tesla: November 2021 Valuation
October 25, 2021
The Billionaire Tax: The Worst Tax Idea Ever?
If you have been tracking the torturous workings of the infrastructure bills working their way through Congress, consideration is now being given to a "billionaire" tax, focused on a extraordinarily small subset of Americans, and intended to raise tens, perhaps even hundreds, of billions of dollars in revenues, to cover the costs of the bill. I am constantly amazed by the capacity of legislatures to write bad tax law, but this one takes the cake as perhaps the worst thought-through and most ineffective attempt ever, at rewriting tax code. That is a little unfair, I know, because the details are still being hashed out, and it is conceivable that the final version will be redeemable, but given that the clock is ticking, I am not hopeful!
The Billionaire Tax: History and Proposal
To get a sense of why we are discussing a billionaire tax, you have to start with a historical context, beginning with a recognition of increasing wealth inequality and the perception (real or otherwise) that the wealthiest were not paying their fair share of taxes, continuing with promises made during the most recent presidential campaign and culminating in the last few months of legislative slogging to get a passable bill.
The Rise of Populism
For much of this century, the big story in economics and politics has been increasing inequality, with the spread in income and wealth between the richest and the rest of society widening over time. The graph below, from the Pew Research Center, is a good starting point, since it highlight the shift in the share of aggregate US income flowing to upper, middle and lower income households.
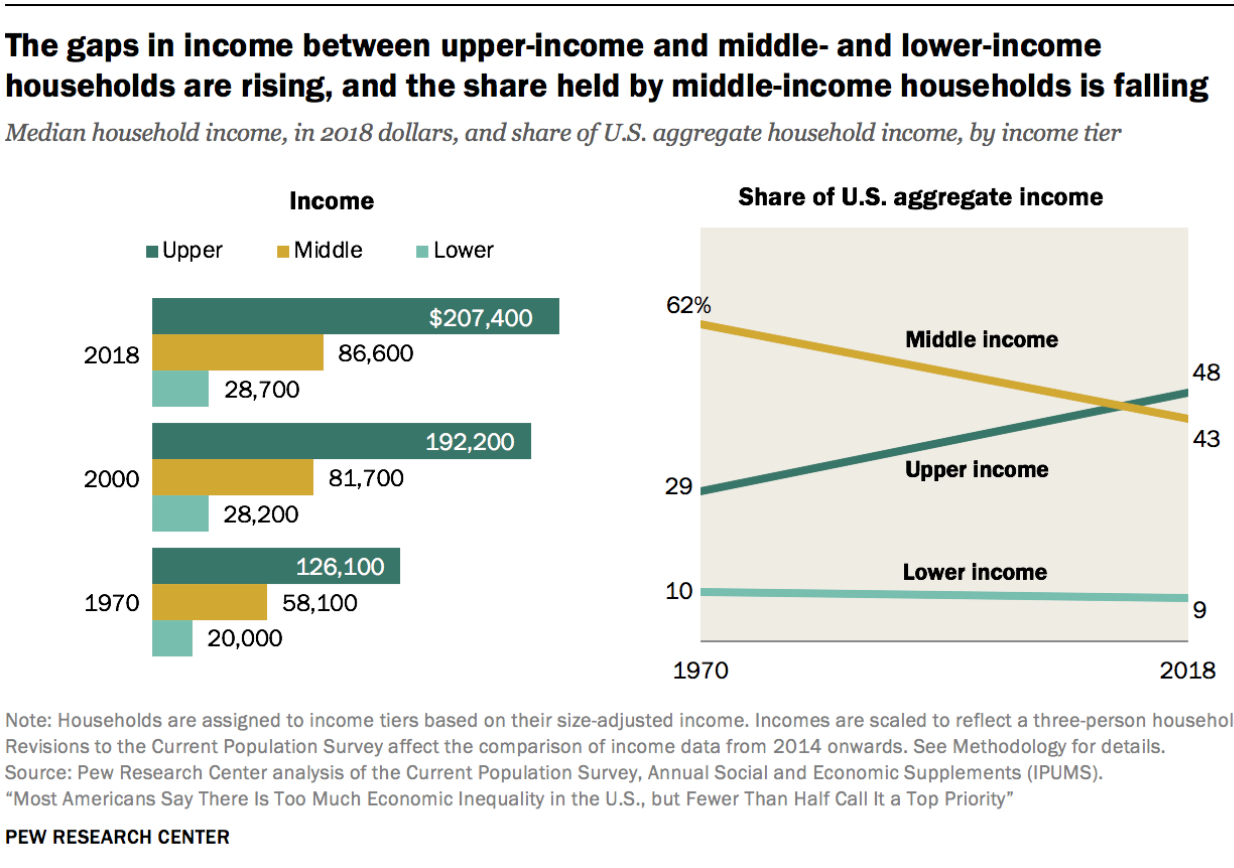
While economists and politicians continue to debate the causes and consequences of this inequality, that income inequality is magnified when you look at the wealth levels different income groups, with the lowest income households falling even further behind. A rising stock market has augmented the wealth inequality, since the wealthiest hold the preponderance of equities in the market.
In conjunction with this widening inequality, the perception is building that the wealthy don't pay their fair share in taxes, even though the question of whether they are depends upon the prism you look through. If you focus just on federal tax dollars paid by each group, the wealthy are actually paying a larger share of federal taxes collected than ever before in history, undercutting the claim that they are welching on their tax responsibilities.
 The pushback from progressives is that this graph misses key components, including other taxes collected by the government (payroll taxes, Medicare taxes, estate taxes etc.), and that it is the tax rate that is paid, not dollar taxes, that better measures fairness. In 2018, for instance, the federal effective tax rates paid by different income groups were as follows:
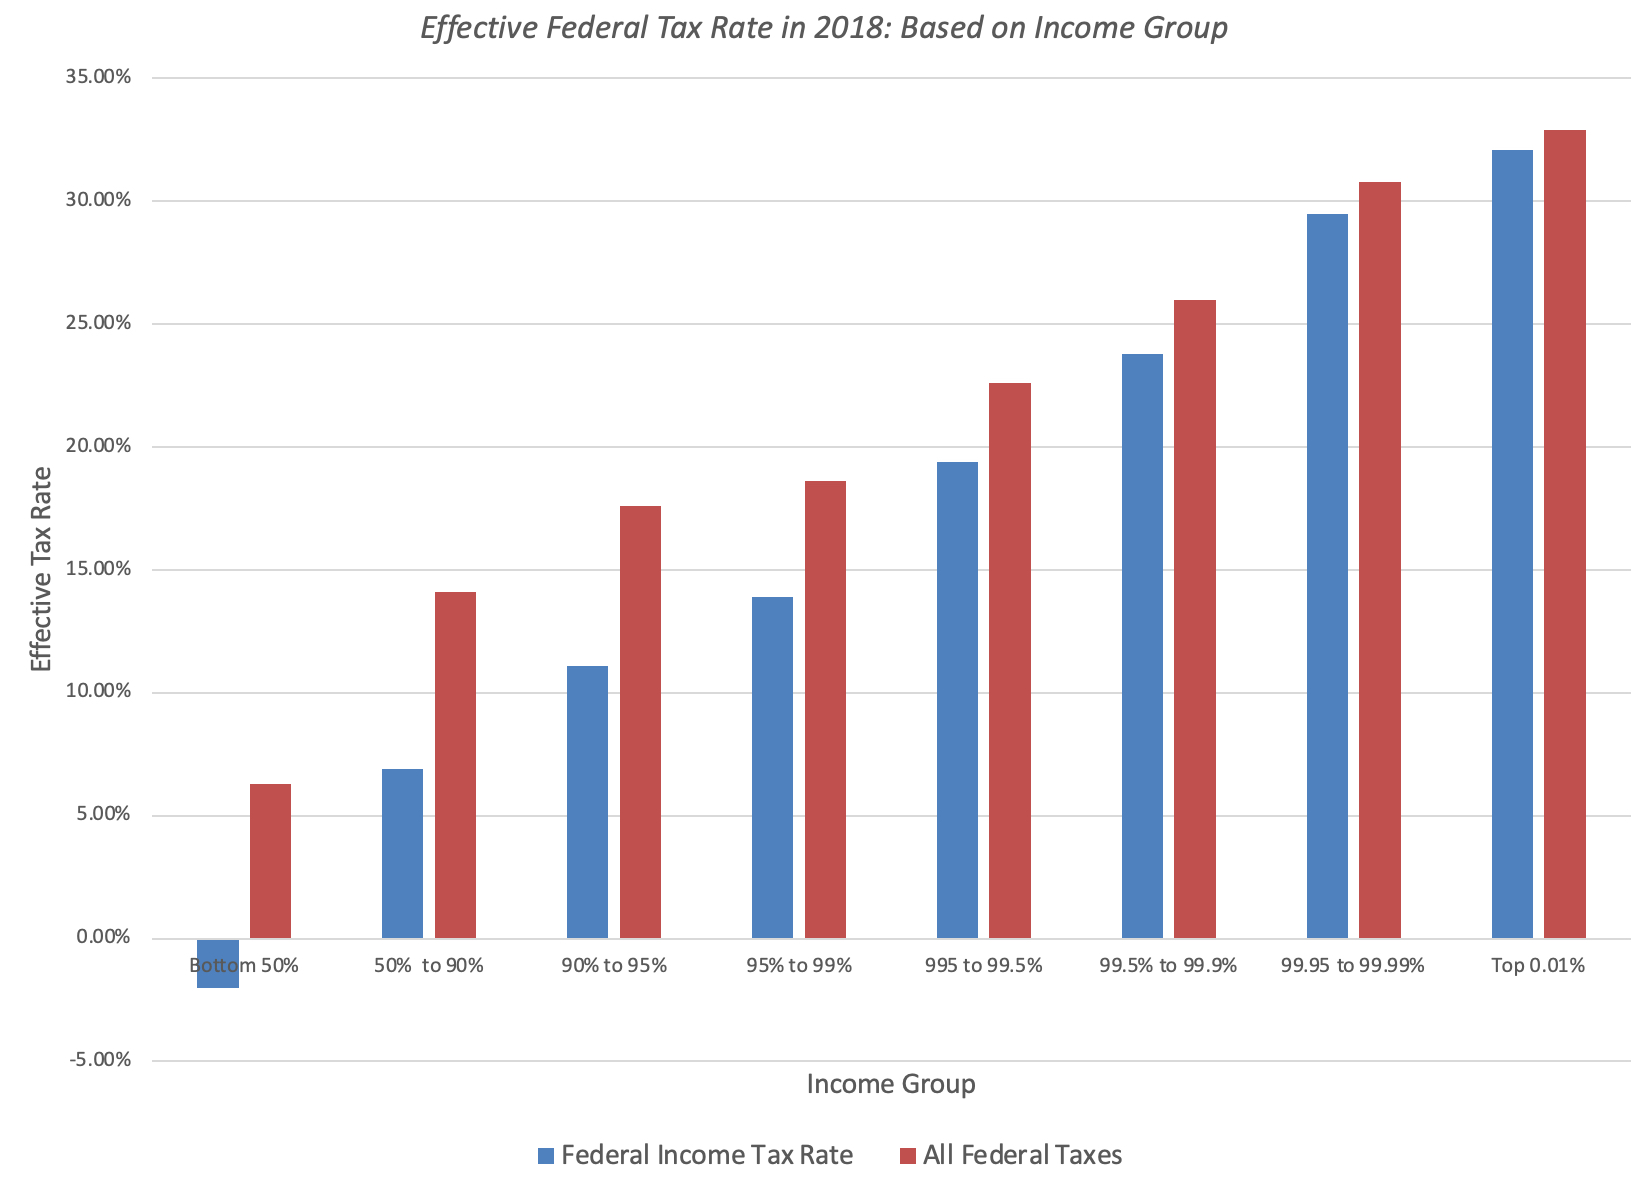
Clearly, while the richest are paying a higher percentage of income in taxes than the poorest, the argument made by some is that they are paying a lower percent of their taxes than they were 40 or 50 years ago (which is true) and that they can afford to pay more (which is debatable).
Elections and Infrastructure Legislation
To understand why the billionaire tax proposal has become one of the center pieces of the revenue side of the infrastructure bill, we have to retrace the path taken during the 2020 presidential election. During the presidential campaign, President Biden promised repeatedly that he would not raise taxes on anyone making less than $400,000 a year in income, effectively locking out 98.2% of income tax payers from any proposed tax increase. In conjunction, he also argued that the the top 1.8% of the populace were not paying their fair share of taxes, and that corporations were also paying too little, and that any rewrite of the tax code would force them to pay their "fair share". In keeping with these two promises, the version of the big infrastructure bills that was initially promoted by the administration raised a significant portion of revenues from changes in tax rates for the wealthiest individuals (by raising the marginal tax rate from 37% to 39.6% for those in the $400,000 plus income range and by adding a surtax on capital gains for those making more than a million dollars in income) and by raising corporate tax rates from 21% to 28%. After months of back and forth between members, the House Ways and Means Committee approved tax provisions on September 15 that included many of these proposals, raising the corporate tax rate from 21% to 26.5%, while putting limits on interest tax deductions, and the individual tax rate to 39.6% (for income) and 25% (for capital gains).
Breaking the Logjam?
The proposals to raise revenues, from the While House and the House committee ran aground, because of objections on raising tax rates from Senator Sinema last week, leading to a rethink of the revenue side. As higher tax rates were taken off the table, the congressional committees had to look elsewhere, and the billionaire tax proposal seems to be gaining traction, as the replacement. Since almost everything we know about the proposals comes from unofficial sources or news leaks, and talks are still continuing, everything could change in the next couple of days, but here is what the proposals look like on Monday, October 25:
Targeted Taxpayers: The tax will be targeted at individuals who own more than $1 billion in assets or have had income of more than $100 million for three consecutive years. That is pretty elite company, and it is estimated that less than 1000 taxpayers in the United States would be affected.Taxable Items: The tax would apply to a wide array of assets, including stocks, bonds, real estate and art. I am assuming that closely held businesses are not covered by the tax, or if they are, they will be dealt with differently, but since the proposal is still in the process of being written, we just don't know.The Proposal: The changes in values of these assets will be subject to tax, even though the individuals continue to hold them, making this a tax on "unrealized" capital gains. There is talk that taxpayers will be allowed to deduct "unrealized" capital losses as well, though the details remain fuzzy. The Tax Rate: It is not clear what tax rate would apply on these changes in value, i.e., whether it would be an extension of the capital gains tax rate to these unrealized capital gains, or some other rate, and also whether the tax rate will be the same for all assets, irrespective of liquidity.In conjunction, corporations will also face a corporate minimum tax rate, putting a floor (at least in theory) on how low they can make their effective tax rates. I will leave it others to discuss that aspect of the tax code, which at least has a defensible basis, but I find the billionaire tax to be problematic at multiple levels.The Worst Tax Code Change EverAs I noted earlier, there may be changes that happen between now and when this gets voted on that help make it better, but as it stands, this is an extraordinarily bad tax proposal, and for many reasons:Micro targeting: Since very few of us to like paying more in taxes, but don't seem to mind seeing others paying more, the political payoff from targeting very few taxpayers is that you minimize the backlash. I know that each of us probably has a billionaire that we hate, and may take secret pleasure in watching that billionaire pay more, but if you view the prime role of taxes as generating revenues for governments, it is dangerous to focus raising tax revenues from this small a number. As a general rule, taxes that are broad based and affect most people are more likely to deliver predicted revenues than those that affect a narrow subset of the population, and the billionaire tax is about as narrowly focused as tax law gets. You may have little sympathy for the seven hundred or so billionaires affected by these taxes, but you should also recognized that these individuals also have the most resources to find ways to minimize the impact of these laws. In fact, not only is an army of tax lawyers, accountants and investment vehicles being created while the law in being written, but I would not be surprised if they are providing input on its actual form.Taxing capital gains (and losses): The basis used for computing taxes can have implications for revenues from the tax code, and that basis can range from sales (with value added and sales taxes) to salary/wage income, to capital gains. Rather than get into moralistic arguments about whether salary income is more virtuous than capital gains income (or unearned income, as its critics like to call it), I will focus on tax revenue reality. Taxes based upon revenues/sales will yield more predictable revenue for the government than taxes based upon salary income, and taxes based upon salary income will yield more stable revenues than taxes based upon capital gains. Capital gains come from stock price changes, which are far more volatile, than income earned by taxpayers, and that income, in turn, changes more on a year-to-year basis than the value of the assets they own. Without passing any judgment on which approach is better, consider tax revenues collected by California, a state that not only taxes all capital gains as ordinary income, but is also more dependent on capital gains than almost any other state, with tax revenues collected by Florida, a state without taxes on individual income:
 Federal Reserve Data Base (FRED)
California's tax revenues are significantly more volatile than Florida's tax revenues, and capital gains are a big reason why that is the case. If you are in finance, and you were measuring the risk of different tax revenue sources, capital gains tax revenue would have a "higher beta" than "income tax revenues or sales tax revenues. It is true that prudent governments can find ways to put aside big portions of the capital gains tax revenues, in years of plenty, to cover shortfalls in years where capital gains tax collections are low, but when was the last time you saw prudent governance?Including "unrealized" gains: The new feature of this law is its attempt to tax unrealized capital gains on assets. The problem with taxing "unrealized" gains or income is that since they are unrealized, and taxes have to be paid with cash, the question of how to come up with the cash becomes an issue, making it a central challenge for any plan, built around it. In fact, there are two practical problems with the proposal, at least as described in the press. Liquidity questions: If the billionaire is going to apply on assets like real estate and fine art, and not just on stocks and bonds, the idea that you can sell some your holdings in the open market and get the cash you need to pay taxes does not apply as easily, since these non-traded assets are often illiquid and cannot be sold off in small parts. It will also mean that taxpayers who own non-traded assets will need appraisers to revalue these assets every year, great for the appraisal business, but almost guaranteed to create a hotbed of litigation around the appraised values.Losses and Gains: After a decade of rising stock and bond prices, I guess that many have forgotten that not only can what goes up come down, but also that you can have extended periods where assets stagnate or drop in value. While there is airy talk of being allowed to claim unrealized losses as deductions, how exactly would this work? Put simply, if stocks are up 20% in 2021 and down in 2022, would taxpayers get refunds on their taxes paid in 2021? It is also not clear what the tax code writers are assuming about what the market will do over the next decade, when they estimate that this tax will deliver about $200 billion in revenues, but are they assuming that the good times will continue? Stock and bonds have a really good run, but history suggests that there will be not just bad times, but extended bad times for markets:
 Damodaran Online
There may be no revenues at all from this tax code change, if the market has a decade like the 1970-1979 or 2000-2009, and if that happens, what are the contingency plans for the expenditure that is being funded by these revenues? With side effects for other tax revenues: There is another point that I still not seen a response to, and that is the effect that this billionaire tax will have on revenues from other parts of the tax code, particularly estate taxes. If paying the billionaire tax changes the tax basis for assets, as it should since they are being marked to market, and taxed, that will also mean that when these stocks are inherited, and ultimately sold, there will be less capital gains taxes collected. If all that the billionaire tax code change is doing is moving forward the collection of taxes to earlier, rather than later, there is a time value benefit to the government, but it has to be a net benefit. In other words, the lost future taxes will have to be netted out against the $200 billion that it is expected to bring in revenues over the next decade.It is a wealth tax, albeit on incremental, not total wealth: For a few years, progressives led by Senator Warren have argued for a wealth tax, and its pluses and minuses have been debated widely. The administration is trying hard to avoid using the words "wealth taxes" to describe this proposal, but that is sophistry. Janet Yellen's claims notwithstanding, this is a wealth tax, albeit on incremental wealth, rather than total wealth. Put simply, this proposal is biased towards people with inherited wealth, invested in non-traded assets and mature businesses, and against people invested in publicly traded equities in growth companies, many of which they have started and built up. If that is the message that the tax law writers want to send, they should at least have the decency to be up front about that message, and to defend it.Side CostsIf the history of tax law is that there are always unintended consequences, the problem with this law is that the consequences are entirely predictable and mostly bad, and you and I, even though we are not in the billionaire club, will face them. Price Effects: If there is a billionaire tax on unrealized gains, some or even many of these billionaires will have to sell portions of their asset holdings to pay taxes dues. There is no way that an Elon Musk would have been able to pay taxes on the unrealized gains on his Tesla holdings in 2020, without selling a portion of his holding. While there may be enough liquidity in a stock like Tesla to absorb that selling, there are other assets where the liquidity effect is going to be larger and more permanent. Founder/Managers: One reason that investors prefer companies that have founders with substantial stock holdings running them is because they believe that there is less of a conflict of interest in these firms, than it those run by professional managers with little or now shareholdings. If this proposal is pushed through, and especially if the tax rate is set at capital gains levels, founders will have no choice but to reduce holdings over time, both to pay taxes and to shift to less traded assets.Public to Private: As I said earlier, I am not sure how privately held businesses will be treated, for computing the billionaire tax, but if there is indeed a carve out for these businesses, I will predict that there will be more companies where rich founders will choose to take the company private again.For those who view the tax code as an instrument to deliver pain, the only consolation prize will be that punishment is being meted out to those who "deserve" it the most, but I am afraid that it is a booby prize. With the billionaire tax, the intended targets will pay far less in taxes than you think they should and now that the door to unrealized profits being taxed has been opened, how do you know that you are not next on the target list?
ConclusionI understand that those working on these tax code changes face a tough task, given the constraints that they have on them (not raising tax rates, not taxing people who make less than $400,000), but these are constraints that they imposed on themselves, either because too much was promised on campaign trails or because they are working with paper-thin majorities, where one hold out can stop the process. The problem with the billionaire taxes is that it will be ineffective at collecting tax revenues, and I am willing to wager that a decade from now, we will find that it collected only a small fraction of its promised revenues. Good intentions about creating a better social safety net cannot excuse the writing of tax laws that are inefficient at collecting revenues, ineffective even in their punitive intent and potentially dangerous for the rest of us, in terms side costs.
YouTube Video
October 19, 2021
Triggered Disclosures: Escaping the Disclosure Dilemma
In a post a few weeks ago, I argued that the disclosure process had lost its moorings, as corporate disclosures (annual filings, prospectuses for IPOs) have become more bulky, while also become less informative. I argued that some of this disclosure complexity could be attributed to the law of unintended consequences, with good intentions driving bad disclosure rules, and that some of it is deliberate, as companies use disclosures to confuse and confound, rather than to inform. For those of you who agreed with my thesis, the end game looks depressing, as new interest groups push for even more disclosures on their preferred fronts, with the strongest pressure coming from the environmental, social and governance (ESG) contingent. In this post, I propose one way out of the disclosure dilemma, albeit one with little chance of being adopted by the SEC or any other regulatory group, where you can have your cake (more disclosure on relevant items) and eat it too (without drowning in disclosure).
The Disclosure Dilemma: Disease and Diagnosis
For those of you who did not read my first post on disclosures, let me summarize its key points. The first is that company disclosures have become more bulky over time, whether it be in the form on required filings (like annual reports or 10K/10Q filings in the US) or prospectuses for initial public offerings. The second is that these disclosures have become less readable and more difficult to navigate, partly because they are so bulky, and partly because disclosures with big consequences are mingled with disclosure with small or even no consequences, often leaving it up to investors to determine which ones matter. The net effect is that investors feel more confused now, when investing in companies, than ever before, even though the push towards more disclosures has ostensibly been for their benefit.
As we look at the explosion of disclosures around the world, there are many obvious culprits. The first is that technology has made it possible to collect more granular data, and on more dimensions of business, than ever before in history, and to report that data. The second is that interest groups have become much more savvy about lobbying regulatory groups and accounting rule writers to get their required data items on the required list. The third is that companies have learned that converting disclosures into data dumps has the perverse effect of making it less likely that they will held accountable, rather than more. That said, there are three other reasons for the disclosure bloat:
The first is the prevailing orthodoxy in disclosure is tilted towards " one size fits all ", where all companies are covered by disclosure requirements, even if they are only tangentially exposed. Though that practice is defended as fair and even handed, it is adding to the bloat, since disclosures that are useful for assessing some firms will be required even for firms where they have little informative value. The second is the notion of materiality , a key component of how accountants and regulators think about what needs to be disclosed. Using the words of IFRS (1.7), ‘Information is material if omitting, misstating or obscuring it could reasonably be expected to influence decisions that the primary users of general purpose financial statements make on the basis of those financial statements, which provide financial information about a specific reporting entity’. As we will argue in the next section, this definition of materiality may be leading to too much disclosure for backward looking items and too little for forward looking items.The third is that the disclosure rule writers happen to be in the disclosure business , and since more disclosure is good for business, the conflict of interest will always tilt toward more rather than less disclosure. No matter how many complaints you hear from accountants and data services about disclosure bloat, it has been undeniable that it has created more work for accountants, appraisers and others in the disclosure ecosystem.It is quite clear, though, that unless we break this cycle, where each corporate shortcoming or market upheaval is followed by a fresh round of new disclosures, we are destined to make this disclosure problem worse. In fact, there may come a point where only computers can read disclosures, because they are so voluminous and complicated, perhaps opening the door for artificial intelligence or matching learning into investing, but for all the wrong reasons.Escaping the Disclosure Trap
There is a way out of this disclosure trap, but it will require a rethink of the status quo in disclosures. It starts first by moving away from "one size fits all" disclosure rules to disclosures tailored to companies, a "triggered" disclosure process, where a company's value story (big market, lots of subscribers) triggers disclosures on the parameters of that story. It extends into materiality, by reframing that concept in terms of value, rather than profits, and connecting it to disclosure, with disclosure requirements increasing proportionately with the value effect. Finally, it requires creating a separation between those who write the disclosure rules and those who make money from the disclosure business.
One size (does not) fit all!
When disclosure laws were first written in the aftermath of the great depression, they were focused on the publicly traded firms of the time, a mix of utilities, manufacturing and retail firms. At the time, the view that disclosure requirements should be general, and apply to all companies, was rooted in the idea of fairness. In the decades since, there have been exceptions to this general rule, but they have been narrowly carved out for segments of firms. For instance, oil companies are required to disclose their ownership of "proven undeveloped reserves", in addition to details about quantity, new investments and progress made during the year in converting those reserves. The disclosure rules for banks and insurance companies require them to reveal the credit standing of their loan portfolios and their regulatory capital levels to investors and the public. These exceptions notwithstanding, disclosure laws written to cover concerns in one sector (such as the use of management options at technology firm or lease commitments at retail and restaurant companies) have been applied broadly to all companies. It is time to rethink this principle and allow for a more variegated disclosure policy, with some disclosures required only fir subsets of companies. Since the next big bout of disclosures that are coming down the pike will be related to ESG, this discussion will play out in a wide range of ESG data items. For instance, while it makes sense to require that fossil fuel and airline companies report on their carbon footprints and greenhouse gas emissions, it may just be a time consuming and wasteful exercise to require it of technology companies.
From earnings-based to value-based materiality
I do not think that you will find many who disagree with the premise that any information that has a material effect should be disclosed, but there is disagreement on what comprises materiality. I believe that the "materiality principle", as defined by accountants, is diluted by measuring it in terms of impact on net income and the fact that accountants tend to be naturally conservative in measuring that impact. Simply put, it is safer for an accounting or audit firm to assume that a disclosure is material, and include it in reports, even if it turns out to be immaterial, than it is to assume that it is immaterial, and be found wrong subsequently. One solution to this problem is to redefine materiality in terms of effects on value, rather than earnings, thus accomplishing two objectives. First, it will reduce the number of noise disclosures, i.e., those that pass the materiality threshold for earnings, but don't have a significant impact on value. Second, since value is driven by expected cash flows in the future and not in the past, it will shift the focus on disclosures to items that will have an impact on future earnings and cash flows, rather than on past earnings or book value.
Triggered Disclosures
At first sight, the requirements to make disclosures slimmer and more informative may seem at war with each other, since disclosure bloat has largely come from well-intentioned attempts to make companies reveal more about themselves. Triggered disclosures, where disclosures are tailored to a company's make-up and stories, are one solution, where contentions made by a company trigger additional disclosures related to that contention. Thus, a company that claims that brand name is its supreme competitive advantage would then have to provide information to not only back up that claim, but also to allow others to value that brand name.Disclosure Illustration: Initial Public Offerings
It is difficult to grapple with disclosure questions in the abstract, and to illustrate how my proposed solutions will play out in practice, I will focus on initial public offerings, where there is a sense that the disclosure rules are not having their desired effect. In my last post, I noted that prospectuses, the primary disclosure documents for a companies going public, have bulked up, contrasting the Microsoft and Apple prospectuses that came in at less than a 100 pages in the 1980s to the 400+ page prospectuses that we have seen with Airbnb and Doordash in more recent years. At the same time, applying a disclosure template largely designed for mature public companies to young companies, often with big losses and unformed business models, has resulted in prospectuses that are focused in large parts on details that are of little consequence to value, while ignoring the details that matter. Since companies going public often do so on the basis of stories that they tell about their futures, and these stories vary widely across companies, this segment lends itself well to the triggered disclosure approach. To do so, I will draw on a paper that I co-wrote with Dan McCarthy and Maxime Cohen, to provide details. In that paper, we argue that a going-public company that wants to build its story around certain dimensions (a large total addressable market or a large user base) will trigger disclosure of a more systematic, business type-specific, collection of “base disclosures” that are required to understand the economics of businesses of that type, whatever type that might be.
Total Addressable Market (TAM)
Companies going public have increasingly supported high valuations by pointing to market potential, using large TAMs as one of the justifications. These TAMs are often not only aspirational, but also come with very little justification and no timeline for how long it will take for the existing market sizes to grow into those TAMs. For instance, the graph below shows the TAMs that Uber and Airbnb claimed in their prospectuses at the time of their initial public offerings.
 Uber and Airbnb ProspectusesIs Uber’s total addressable market really $5.2 trillion? I don’t think so, but you can see why the company was tempted to go with that inflated number to push a “big market” narrative. To prevent the misuse of TAM as little more than a marketing ploy, companies that specify a TAM should also have to provide the following:
a. TAM, SAM and bridges: Companies that specify a TAM should also specify the existing market size (i.e., the serviceable addressable market or SAM), as well as additional “bridges” so that investors can understand the evolution from SAM to TAM (e.g., an estimate of how many individuals would be interested in the company’s product before considering price). Investors who may be skeptical of a lofty TAM could still look to SAM as a more achievable intermediate metric.b. Market share estimates: As long as companies do not have to twin TAM with expectations of market share, there is little incentive for them to restrain themselves when estimating TAM. We would recommend requiring that companies that disclose TAM figures couple them with forecasts of their market share of those TAM figures. For companies that are tempted to significantly inflate their TAMs, the worry that they will be held accountable if their revenues do not measure up to their promises, will act as a check.c. Ongoing metrics or measures: Companies usually provide TAM, SAM, and variants thereof on a one-shot basis, disclosing these figures in their pre-IPO prospectuses and then never again. We believe that investors should be given these measures on an ongoing basis. This will help on two levels. First, it will allow investors to see how well the company is adhering to its prior disclosures and forecasts and provide investors with updates if conditions have changed. Second, companies that know they will be held accountable to their IPO disclosures after they go public will be more incentivized to make those disclosures realistic and achievable.
To the extent that investors will continue to assess premiums for companies that have bigger markets, the bias on the part of companies will still be to overestimate TAM. That said, these recommendations should help rein in some of those biases.
Subscription-Based Companies A subscription-based company derives its value from a combination of its subscriber base (and additions to it) and the subscription fees its charges these subscribers. Consequently, the value of an existing subscriber can be written as the present value of the expected marginal profit (subscription fee net of the costs of servicing that subscription) from the subscription each year, over the expected life of the subscriber (based upon renewal/churn rates in subscribers), and the value of a new subscriber will be driven all of the same factors, net of the cost of acquiring that subscriber. The overall value of the company can be written in terms of its existing and new subscribers:

Companies that sell a “subscriber” story have the obligation, then, to provide the information needed to derive this value:Existing subscriber count: Observing the total number of subscribers in each period (e.g., month or quarter) allows us to track overall growth trends in the number of subscribers, and to understand how revenue per subscriber evolves over time, because revenue is disclosed.Subscriber churn: To value a subscriber, a key input is the renewal rate or its converse, the churn rate. Holding all else constant, a subscription business with a higher renewal rate should have more valuable subscribers than one with a lower renewal rate. It would stand to reason that any subscription-based company should report this number, but it is striking just how many do not disclose these measures or disclose them opaquely. For example, while the telecom industry regularly discloses churn figures, Netflix has not disclosed its churn rate in recent years. Contribution profitability: For subscribers to be valuable, they need to generate incremental profits, and to estimate these profits, you need to know not just the subscription fees that they pay, but also the cost of servicing a subscription; the net figure (subscription fee minus cost of service) is called the contribution margin. Many subscription companies explicitly disclose contribution profits (e.g., Blue Apron, HelloFresh, and Rent the Runway), but many others do not (e.g., StitchFix). In the absence of explicit contribution profit data, investors often resort to simple proxies for it, such as gross profit, but these proxies are imperfect and noisy.Subscriber acquisitions & drop offs: To move from the value of a single subscriber to the value of the entire subscriber base, we must also know how many subscribers are acquired over time, not just the net subscriber count. Put differently, if a company grew the overall size of its subscriber base from 10 million to 12 million subscribers in a year, it is quite different if that net growth came about because the company acquired 10 million customers that year but then lost 8 million of them, versus if the company acquired 2 million customers and lost none of them. Acquisition (or equivalently, churn) disclosures are what allow us to piece this apart.Cost of acquiring subscribers (CAC): Subscription-based companies attract new subscribers by offering special deals or discounts, or through paid advertising. While the cost of acquiring subscribers can sometimes be backed out of other disclosures at subscription-based companies (such as subscribers numbers, churn and marketing costs), it would make sense to require that it be explicitly estimated and reported by the company.Cohort data: While many subscriber companies are quick to report total numbers, only a provide a breakdown of subscribers, based upon subscription age. This breakdown, called a cohort table, can be informative to observe retention and/or monetization patterns across cohorts, as noted by Fader and McCarthy in their 2020 paper on the topic. Many subscription-based firms, including Slack, Dropbox, and Atlassian, now disclose cohort data, and the figure below shows one such chart for Slack Technologies:
 Source: Slack Technologies Form S1
By breaking down cohort-specific retention and monetization trends, a cohort chart offers investors visibility into retention and development patterns as a function of subscriber tenure (e.g., does the retention rate get better or worse as subscribers get older), and trends across time, as subscribers stay on the platform.
Transaction-Based Companies The guiding principles driving our disclosure recommendations for subscription-based businesses largely extend to transaction-based businesses, with the primary difference being that subscription revenues are replaced with transaction revenues, a number that is not only more difficult to estimate, but one that can vary more widely across customers. The value of the customer base at transaction-based businesses is driven off the activity of these customers, translating into transaction revenues and profits.
As with subscriber-based businesses, this framework can only be used if the company provides sufficient data from which one can estimate the inputs. Deconstructing this picture, many of the key disclosures track those listed for subscription based companies, including contribution profitability, customer acquisition costs and cohort data. In addition, there are three key additional pieces of information that can be useful in valuing these companies:Active customer count: We replace the notion of a subscriber with that of an “active” customer, which is more suitable for transaction-based businesses. After all, a customer in your platform who never transacts is not affecting value, and one issue that transaction-based companies have struggled with is defining "activity". Wayfair, Amazon, and Airbnb, for example, define an active customer to be one who has placed at least one order over the past 12 months. In contrast, Lyft, Overstock, and many other companies define a customer as active if they placed an order in the past 3 months. Total orders: In transaction-based companies, the average purchase frequency of active customers can change, often significantly, over time. We need to know the total orders because this further allows us to decompose changes in revenue per active customer into changes in order frequency per active customer and changes in average order value. While some transaction-based businesses disclose this information, including Wayfair, Overstock, Airbnb, and Lyft, this data is notably absent for many others, such as Amazon.Promotional activity: It can be easy to significantly increase purchase activity through enticing targeted promotions, creating the illusion of rapid growth that may not be sustainable over the long run, due to their substantial cost. Since these promotions are often reported as revenue reductions, rather than expenses, the cost of these campaigns are often opaque, to investors. For example, DoorDash did not disclose their total promotional expense during the most recent 6 months in their IPO prospectus, creating substantial uncertainty for investors as to how this may have influenced gross food sales). Fintech Companies In the last decade, we have seen banks, insurance companies and investment firms face disruption from firms in the "fin-tech" space, covering a diverse array of companies in the space. With all of these companies, though, there is (or should be) a lingering concern that part of their value proposition comes from "regulatory arbitrage", i.e., that these disruptions can operate as financial service companies, without the regulatory overlay that constrains these companies, at least in their nascent years. Since this regulatory arbitrage is a mirage, that will be exposed and closed as these fin-tech companies scale up, investors in these companies need more information on:Quality/Risk metrics on operating activity: In the aftermath of the 2008 crisis, banks, insurance companies and investment banks have all seen their disclosure requirements increase, but ironically, the young, technology-based companies that have entered this space seem to have escaped this scrutiny. In fact, the absence of a regulatory overlay at these companies makes this oversight even more dangerous, since an online lender that uses a growing loan base as its basis for a higher valuation, but does not report on the default risk in that loan base, is a problem waiting to blow up. It is highly informative for investors to observe the evolution of these measures in the years and quarters leading up to the IPO. Indeed, lenders can be tempted to strategically lower their credit standards to issue more loans (and hence significantly increase revenue through loan-related fees, which are often assessed upfront) to create the illusion of growth at the expense of long-term profitability and trust (since many of these risky loans are likely to default in the future).Capital Buffer: It is worth remembering that banks existed prior to the Basel accords, and that the more prudent and long-standing ones learned early on that they needed to set aside a capital buffer to cover unexpected loan losses or other financial shortfalls. In the last century, regulators have replaced these voluntary capital set asides, at banks and insurance companies, with regulatory capital needs, tied (sometimes imperfectly) to the risk in their business portfolios. Many fintech companies have been able to avoid that regulatory burden, largely because they are too small for regulatory concern, but since they are not immune from shocks, they too should be building capital buffers and reporting on the magnitude of these buffers to investors. ConclusionAs data becomes easier to collect and access, the demands for data disclosure from different interest groups will only increase over time, as investors, regulators, environmentalists and others continue to add to the list of items that they want disclosed. That will make already bulky disclosures even bulkier, and in our view, less informative. There are three ways to have your cake and eat it too. The first is to allow for increasing customization of disclosure requirements to the firms in question, since requiring all firms to report everything not only results in disclosures becoming data dumps, but also in the obscuring of the disclosures that truly matter. The second is to shift the materiality definition from impact on earnings to impact on value, thus moving the focus from the past to the future. Finally, tying disclosures to a company's characteristics and value stories will limit those stories and create more accountability.
YouTube Video
PapersGoing to Pieces: Valuing Users, Subscribers and CustomersInitial Public Offerings: Dealing with the Disclosure Dilemma (with Dan McCarthy and Maxime Cohen)Blog PostsUser and Subscriber Businesses: The Good, the Bad and the Ugly!Disclosure Dilemma: When more (data) leads to less (information)
Aswath Damodaran's Blog

- Aswath Damodaran's profile
- 725 followers

