
Aswath Damodaran's Blog, page 5
November 1, 2023
Tesla in November 2023 : Story twists and turns, with value consequences!
I was planning to start this post by telling you that Tesla was back in the news, but that would be misleading, since Tesla never leaves the news. Some of that attention comes from the company's products and innovations, but much of it comes from having Elon Musk as a CEO, a man who makes himself the center of every news cycle. That attention has worked in the company's favor over much of its lifetime, as it has gone from a start-up to one of the largest market cap companies in the world, disrupting multiple businesses in the process. At regular intervals, though, the company steps on its own story line, creating confusion and distractions, and during these periods, its stock price is quick to give up gains, and that has been the case for the last few weeks. As the price dropped below $200 today (October 30,2023), I decided that it was time for me to revisit and revalue the company, taking into account the news, financial and other, that has come out since my last valuation in January 2023, and to understand the dueling stories that are emerging about the company.
My Tesla History
When I write and teach valuation, I describe it as a craft, and there are very few companies that I enjoy practicing that craft more than I do with Tesla. Along the way, I have been wrong often on the company, and if you are one of those who only reads valuations by people who get it right all the time, you should skip the rest of this post, because I will cheerfully admit that I will be wrong again, though I don't know in which direction. My first valuation of Tesla was in 2013, when it was a nascent automobile firm, selling less than 25,000 cars a year, and viewed by the rest of the automobile sector with a mix of disdain and curiosity. I valued it as a luxury automobile firm that would succeed in that mission, giving it Audi-level revenues in 2023 of about $65 billion, and operating margins of 12.50% that year (reflecting luxury auto margins). To deliver this growth, I did assume that Tesla would have to invest large amounts of capital in capacity, and that this would create a significant drag on value, resulting in a equity value of just under $10 billion.
In subsequent valuations, I modified and adapted this story to reflect lessons that I learned about Tesla, along the way. First, I learned that the company was capable of generating growth much more efficiently, and more flexibly, than other auto companies, reducing the capital investment needed for growth. Second, I noticed that Tesla customers were almost fanatically attached to the company's products, and were willing to evangelize about it, yielding a brand loyalty that legacy auto companies could only dream about. Third, in a world where many companies are run by CEO who are, at best, operating automatons, and at worst, evidence of the Peter Principle at play, where incompetence rises to the top, Tesla had a CEO whose primary problem was too much vision, rather than too little. In valuation terms, that results in a company whose value shifts with narrative changes, creating not only wide swings in value, but vast divergences in opinion on value. In 2016, I looked at how Tesla's story would vary depending upon the narrative you had for the company and listed some of the possible choices in a picture:
 I translated these stories into inputs on revenue growth, profit margins and reinvestment, to arrive at a template of values:
 Note that is multiple stock splits ago, and the prices per share here are not comparable to the share price today, but the overall lessons contained in this table still apply. First, when you see significant disagreements about what Tesla is worth, those differences come from divergent stories, not disagreements about numbers. Second, every news story or financial disclosure about Tesla has to be used to evaluate how the company's narrative is changing, creating multiplier effects that create disproportionate value changes. Along the way, Tesla (or more precisely, Elon Musk) has made choices that could be, at best, described as puzzling, and, at worst, as perilous for the company's long term health, from borrowing money in 2017, when equity would have been a much better choice, to setting arbitrary targets on production (remember the 5000 cars a week for the company in 2018) and cash flows (positive cash flows in 2018) that pushed the company into a corner. If you add to that the self-inflicted wounds including Musk tweeting out that he had a deal to sell the company at $420 a share, funding secured, in 2018, it is not surprising that the stock has had periods of trauma. It was after one of these downturns in 2019, when the stock hit $180 (with a market cap of $32 billion), that I bought Tesla for the first time, albeit labeling it as my corporate teenager, an investment that would frustrate me because it would get in the way of its own potential. I profited mightily on that investment, but I sold too soon, when Tesla's market capitalization hit $150 billion, and just before COVID put the company on a new price orbit. In fact, I revisited the company's value in November 2021, when its market capitalization hit a trillion, marveling at its rise, but also noting that it was priced to deliver such wondrous results ($600-$800 billion in revenues, with 20%+ margins) that I was uncomfortable going along:

In 2022, the stock came back to earth with a vengeance, losing more than 65% of its equity value, leaving the stock (on a post-split basis) trading at close to $100 a share at the end of the year. Three weeks later, i.e., at the start of 2023, I revalued the stock, allowing for uncertainties in my estimate of revenues and margins to deliver a median value per share of $153, with significant variation in potential outcomes:
 I was about a week late on my valuation, since the stock price had already broken through this value by the time I finished it, leaving my portfolio Tesla-free, in 2023.
Tesla Update
My last Tesla valuation is less than ten months old, and while that is not long in calendar time, with Tesla, it feels like an eternity, with this stock. As a lead in to updating the company’s valuation, it makes sense to start with the stock price, the market’s barometer for the company's health. The stock, which started the year in a swoon, recovered quickly in the first half of the year, peaking around mid-year at close to $300 a share.

The last four months have tested the stock, and it has given back a significant portion of its gains this year, with the stock dropping below $200 on October 30, 2023. Since earnings reports are often viewed as the catalysts for momentum shifts, I have highlighted the four earnings reports during the course of 2023, with a comparison of earnings per share reported, relative to expectations. The first earnings report, in January 2023, has been the only one where the company beat expectations, and it matched expectations in the April report, and fallen behind in the July and October reports.
The earnings per share focus misses much of Tesla’s story, and it is instructive to dig deeper into the income statement and examine how the company has performed on broader operating metrics:

In the twelve months, ending September 2023, Tesla reported operating income of $10.7 billion on revenues of $95.9 billion; that puts their revenues well ahead of my 2013 projection of $65 billion, albeit with an operating margin of 11.18%, lagging my estimate of 12.5%. That makes Tesla the eleventh largest automobile company in the world, in revenue terms, and the seventh most profitable on the list, making it more and more difficult for naysayers to argue that it is a fad that will pass. Breaking down the news in the financials by business grouping, here is what the reports reveal:
Auto business: Tesla's auto business saw revenue growth slow down from the torrid pace that it posted between 2020 and 2022, with third quarter year-on-year revenue growth dropping to single digits, but given the flat sales in the auto sector and a sluggish electric car market, it remains a stand-out. The more disappointing number, at least for those who were expecting pathways to software-company like margins for the company, was the decline in profit margins on automobiles from 2022 levels, though the 17.42% gross margin in the third quarter, while disappointing for Tesla, would have been cause for celebration at almost any of its competitors.Energy business: Tesla's energy business, which was grounded by its acquisition of Solar City in 2016, has had a strong year, rising from 4.8% of the company's revenues in 2022 to 6.2% in the twelve months ending September 2023. In conjunction, the profitability of the business also surged in the last twelve months, and while some of this increase will average out, some of it can be attributed to a shift in emphasis to storage solutions (battery packs and other) from energy generation.In short, Tesla's financial reports, are an illustration of how much expectations can play a role in how markets react to the news in them. The post-COVID surge in Tesla's revenues and profitability led to unrealistically high expectations of what the company can do in this decade, and the numbers, especially in the last two quarters, have acted as a reality check. As a story stock, Tesla is affected as much by news stories about the company and its CEO, as it is by financials, and there are three big story lines about the company that bear on its value today:Price Cuts: During the course of 2023, Tesla has repeatedly cut prices on its offerings, with the most recent ones coming earlier this month, The $1,250 reduction in the Model 3 should see its price drop to about $39,000, making it competitive, even on a purely price basis, in the mass auto market in the United States. Some of this price cutting is tactical and in response to competition, current or forecast, but some of it may reflect a shift in the company's business model.Full Self Driving (FSD): Tesla, as a company, has pushed its work on full self driving to the forefront of its story, though there remains a divide in how far ahead Tesla is of its competition, and the long term prospects for automated driving. Its novelty and news value has made it a central theme of debate, with Tesla fans and critics using its successes and failures as grist for their social media postings. While an autopilot feature is packaged as a standard feature with Teslas, it offers FSD software, which is still in beta version, offers an enhanced autopilot model, albeit at a price of $12,000. The FSD news stories have also reignited talk of a robotaxi business for Tesla, with leaks from the company of a $25,000 vehicle specifically aimed at that business.Cybertruck: After years of waiting, the Tesla Cybertruck is here, and it too has garnered outsized attention, partly because of its unique design and partly because it is Tesla's entree into a market, where traditional auto companies still dominate. While there is still debate about whether this product will be a niche offering or one that changes the trucking market, it has undoubtedly drawn attention to the company. In fact, the company's reservation tracker records more than two millions reservations (with deposits), though if history is a guide, the actual sales will fall well short of these numbers.This being Tesla, there are dozens of other stories about the company, but that is par for the course. We will focus on these three stories because they have the potential to upend or alter the Tesla narrative, and by extension, its value.
Story and Valuation: Revisit and Revaluation
In my Tesla valuations through the start of 2023, I have valued Tesla as an automobile company, with the other businesses captured in top line numbers, rather than broken out individually. That does not mean that they are adding significantly to value, but that the value addition is buried in an input to value, rather than estimated standing alone. In my early 2023 valuation, I estimated an operating margin of 16% for Tesla, well above auto industry averages, because I believed that software and or the robotaxi businesses, in addition to delivering additional revenues, would augment operating margins, since they are high-margin businesses.
The news stories about Tesla this year have made me reassess that point of view, since they feed into the narrative that Tesla not only believes that the software and robotaxi businesses have significant value potential as stand-alone businesses, but it is acting accordingly. To see why, let me take each of the three news story lines and work them into my Tesla narrative:
Cybertrucks: The easiest news items to weave into the Tesla narrative is the Cybertruck effect. If the advance orders are an indication of pent-up demand and the Cybertruck represents an extension into a hitherto untapped market, it does increase Tesla's revenue growth potential. There are two potential negatives to consider, and Musk referenced them during the course of the most recent earnings call. The first is that, even with clever design choices, at their rumored pricing, the margins on these trucks will be lower than on higher-end offerings. The other is that the Cybertruck may very well require dedicated production facilities, pushing up reinvestment needs. If Cybertruck sales are brisk, and the demand is strong, the positives will outweigh the negatives, but if the buzz fades, and it becomes a niche product, it may very well prove a distraction that reduces value. The value added by Cybertrucks will also depend, in part, on who buys them, with Tesla gaining more if the sales comes from truck buyers, coming from other companies, than it will if the sales comes from Tesla car buyers, which will cannibalize their own sales.FSD: As I look at the competing arguments about Tesla's FSD research, it seems clear to me that both sides have a point. On the plus side, Tesla is clearly further along this road than any other company, not only from a technological standpoint, but also from business model and marketing standpoints. While I do not believe that charging $12,000 for FSD as an add-on will create a big market, lowering that price will open the door not only to software sales to Tesla drivers, but perhaps even to other carmakers. In addition, it seems clear to me that the Tesla robotaxi business has now moved from possible to plausible on my scale, and thus merits being taken seriously. On the minus side, I do agree that the world is not quite ready for driverless cars, on scale, and that rushing the product to market can be catastrophic. Price cuts: The Tesla price cuts have led to a divide among Tesla bulls, with some pointing to it as the reason for Tesla's recent pricing travails and others viewing it as a masterstroke advancing it on its mission of global domination. To decide which side has the more realistic perspective, I decided to take a look at how price cuts play out in value for a generic company. The first order effect of a price cut is negative, since lowering prices will lower margins and profits, and it is easy to compute. It is the second order effects that are tricky, and I list the possibilities in the figure below, with value consequences:
In short, price cuts can, and often will, change the number of units sold, perhaps offsetting some of the downside to price cut (tactical), make it more difficult for competitors to keep up or enter your business (strategic) and expand the potential for side or supplemental businesses to thrive (synergistic). This figure explains the divide on the Tesla price cuts, with the pessimists arguing that electric car demand is too inelastic for volume increases that will compensate for the lower margins, and the optimists arguing that the value losses from lower margins will be more than offset by a long-term increase in Tesla's market share, and increase the value from their software and robotaxi businesses.
To bring these stories into play, I break Tesla down into four businesses - the auto business, the energy business, the software business and the robotaxi business. I do know that there will be Tesla optimists who will argue that there are other businesses that Tesla can enter, including insurance and robots, but for the moment, I think that the company has its hands full. I look out the landscape for these businesses in the picture below, looking at the potential size and profitability of the market for each of these businesses, as well as Tesla's standing in each.

Note that the auto business is, by far, the largest in terms of revenue potential, but it lags the other business in profitability, especially the software and robotaxi businesses, where unit economics are favorable and margins much higher. Note also that estimates for the future in the robotaxi and auto software businesses are squishy, insofar as they are till nascent, and there is much that we do not know.My Tesla story for each of these businesses is below, with revenue and profitability assumption, broken down by business:

With these stories in place, I estimate revenues, earnings and cash flows for the businesses, and in sum, for the company, and use these cash flows to estimate a value per share for the company:
 Download spreadsheet
In sum, the value per share that I get with Tesla's businesses broken down and allowing for divergent growth and profitability across businesses, is about $180 a share. That is higher than my estimate at the start of the year, with part of that increase coming from the higher profit potential in the side businesses, and expectations of a much larger end game in each one. Given that this value comes from four businesses, you can break down the value into each of those businesses, and I do so below:
 Just as a note of caution, these businesses are all linked together, since the battery technology that drives the auto and energy businesses are shared, and FSD software sales will be tied to car sales. Consequently, you would not be able to spin off or sell these businesses, at least as these estimated values, but it does provide a sense of investors should watch for in this company. Thus, with a chunk of value tied to FSD, from software and robotaxis, any signs of progress (failure) on the FSD front will have consequences for value.
An Action Plan As you review my story and numbers, you will undoubtedly have very different views about Tesla going forward, and rather than tell me that you disagree with my views, which serves neither of us, please download the spreadsheet and make your own projections, by business. So, if you believe that I am massively underestimating the size of the robotaxi business, please do make your own judgment on how big it can get, with the caveat that making that business bigger will make your auto and software businesses smaller. After all, if everyone is taking robotaxis, the number of cars sold should drop off and existing car owners may be less likely to pay extra for a FSD package. At $197 a share, Tesla remains over valued, at least based on my story, but a stock that has dropped $54 in price in the last few weeks could very well drop another $20 in the next few. To capture that possibility, I have a limit buy at my estimated value of $180, with the acceptance that it may never hit that price in this iteration. For those of you who wonder why I don't have a margin of safety (MOS), I have argued that the MOS is a blunt instrument that is most useful when you are valuing mature companies where you face a luxury of riches (lots of under valued companies). Furthermore, as my January 2023 simulation of Tesla value reveals, this is a company with more upside than downside, and that make a fair-value investment one that I can live with. Put simply, the possibility of other businesses that Tesla can enter into adds optionality that I have not incorporated into my value, and that acts as icing on the cake. Obviously, and this will sound like the postscript from an email that you get from your investment banking friends, I am not offering this as investment advice. Unlike those investment banking email postscripts, I mean that from the heart and am not required by either regulators or lawyer to say it. I believe that investors have to take ownership of their investment decisions, and I would suggest that the only way for you to make your own judgment on Tesla is to frame your story, and value it based on that story. Of course, you are welcome to use, adapt or just ignore my spreadsheet in that process.
YouTube Video
Data and SpreadsheetsTesla 10Q (third quarter of 2023)My Tesla Valuation (October 30, 2023)


October 12, 2023
Good Intentions, Perverse Outcomes: The Impact of Impact Investing!
I have made no secret of my disdain for ESG, an over-hyped and over-sold acronym, that has been a gravy train for a whole host of players, including fund managers, consultants and academics. In response, I have been told that the problem is not with the idea of ESG, but in its measurement and application, and that impact investing is the solution to both market and society's problems. Impact investing, of course, is investing in businesses and assets based on the expectation of not just earning financial returns, but also creating positive change in society.
It is human nature to want to make the world a better place, but does impact investing have the impact that it aims to create? That is the question that I hope to address in this post. In the course of the post, I will work with two presumptions. The first is that the problems for society that impact investing are aiming to address are real, whether it be climate change, poverty or wealth inequality. The second is that impact investors have good intentions, aiming to make a positive difference in the world. I understand that there will be some who feel that these presumptions are conceding too much, but I want to keep my focus on the mechanics and consequences of impact investing, rather than indulge in debates about society's problems or question investor motives.
Impact Investing: The What, The Why and the How!
Impact investments are investments made with the intent of generating benefits for society, alongside a financial return. That generic definition is not only broad enough to cover a wide range of impact investing actions and motives, but has also been with us since the beginning of time. Investors and business people have often considered social payoffs when making investments, though they have differed on the social outcomes that they seek, and the degree to which they are willing to sacrifice the bottom line to achieve those outcomes. In the last two decades, this age-old investing behavior has come under the umbrella of impact investing, with several books on how to do it right, academic research on how it is working (or not), and organizations dedicated to advancing its mission. The Global Impact Investing Network (GIIN), a non-profit that tracks the growth of this investing movement, estimated that more than $1.16 trillion was invested by impact investors in 2021, with a diverse range of investors: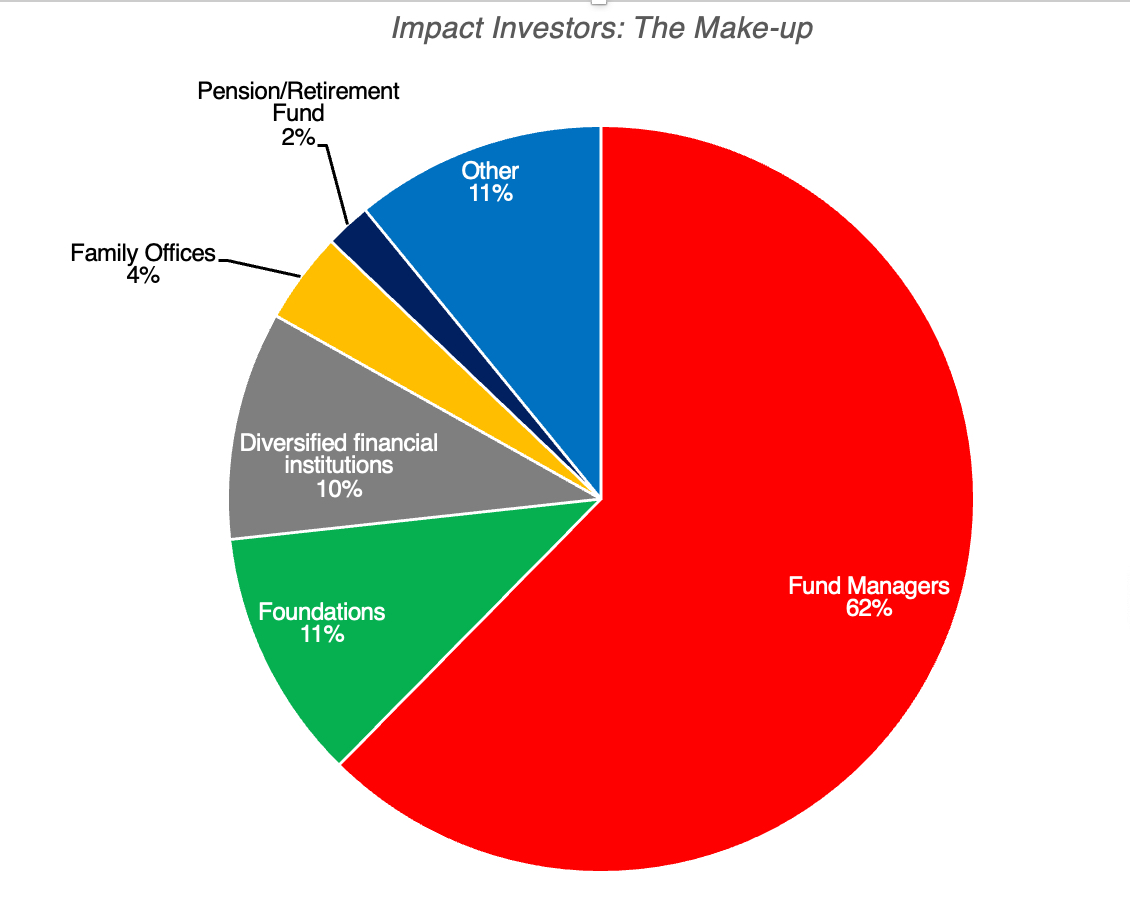 Global Impact Investing Network, 2022 Report
Not surprisingly, the balance between social impact and financial return desired by investors, varies across investor groups, with some more focused on the former and others the latter. In a survey of impact investors, GIIN elicited these responses on what types of returns investors expected to earn on their impact investments, broken down by groups:
 Global Impact Investing Network, 2020 Report
Almost two thirds of impact investors believe that they can eat their cake and have it too, expecting to earn as much or more than a risk-adjusted return, even as they do good. That delusion running deepest among pension funds, insurance companies, for-profit fund managers and diversified financial investors, who also happen to account for 78% of all impact investing funds. If having a positive impact on society, while earning financial returns, is what characterizes impact investing, it can take one of three forms:Inclusionary Impact Investing: On the inclusionary path, impact investors seek out businesses or companies that are most likely to have a positive impact on whatever societal problem they are seeking to solve, and invest in these companies, often willing to pay higher prices than justified by the financial payoffs on the business. Exclusionary Impact Investing: In the exclusionary segue, impact investors sell shares in businesses that they own, or refuse to buy shares in these businesses, if they are viewed as worsening the targeted societal problem.Evangelist Impact Investing: In the activist variant, impact investors buy stakes in businesses that they view as contributing to the societal problem, and then use that ownership stake to push for changes in operations and behavior, to reduce the negative social or environmental impact.The effect of impact investing in the inclusionary and exclusionary paths is through the stock price, with the buying (selling) in inclusionary (exclusionary) investing pushing stock prices up (down), which, in turn, decreases (increases) the costs of equity and capital at these firms. The changes in costs of funding then show up in investing decisions and growth choices at these companies, with good companies expanding and bad companies shrinking.
 With evangelist impact investing, impact investors aim to get a critical mass of shareholders as allies in pushing for changes in how companies operate, shifting the company away from actions that create bad consequences for society to those that have neutral or good consequences.

As you can see, for impact investing to have an impact on society, a series of links have to work, and if any or all of them fail, there is the very real potential that impact investing can have perverse consequences.With inclusionary investing, there is the danger that you mis-identify the companies capable of doing good, and flood these companies with too much capital. Not only is capital invested in these companies wasted, but increases the barriers to better alternatives to doing good. With exclusionary investing, pushing prices down below their "fair" values will allow investors who don’t care about impact to earn higher returns, from owning these companies. More importantly, if it works at reducing investment from public companies in a "bad" business, it will open the door to private investors to fill the business void. With evangelist investing, an absence of allies among other shareholders will mean that your attempts to change the course of businesses will be largely unsuccessful. Even when you are successful in dissuading these companies from "bad" investments, but may not be able to stop them from returning the cash to shareholders as dividends and buybacks, rather than making "good" investments.In the table below, I look at the potential for perverse outcomes under each of three impact investing approaches, using climate change impact investing as my illustrative example:

The question of whether impact investing has beneficial or perverse effects is an empirical question, not a theoretical one, since your assumptions about market depth, investor behavior and business responses can lead you to different conclusion. It is worth noting that impact investing may have no effect on stock prices or on corporate behavior, either because there is too little money behind it, or because there is offsetting investing in the other direction. In those cases, impact investing is less about impacting society and more about alleviating the guilt and cleansing the consciences of the impact investors, and the only real impact will be on the returns that they earn on their portfolios.
The Impact of Impact Investing: Climate Change
While impact investing can be directed at any of society's ills, it is undeniable that its biggest focus in recent years has been on climate change, with hundreds of billions of dollars directed at reversing its effects. Climate change, in many ways, is also tailored to impact investing, since concerns about climate change are widely held and many of the businesses that are viewed as good or bad, from a climate change perspective, are publicly traded. As an empirical question, it is worth examining how impact investing has affected the market perceptions and pricing of green energy and fossil fuel companies, the operating decisions at these companies, and most critically, on the how we produce and consume energy.
Fund Flows
The biggest successes of climate change impact investing have been on the funding side. Not only has impact investing directed large amounts of capital towards green and alternative energy investments, but the movement has also succeeded in convincing many fund managers and endowments to divest themselves of their investments in fossil fuel companies.
As concerns about climate change have risen, the money invested in alternative energy companies has expanded, with $5.4 trillion cumulatively invested in the last decade: Source: BloombergNEF
On the divestment side, the drumbeat against fossil fuel investing has had an effect, with many investment fund managers and endowments joining the divestiture movement:Almost half of this investment in alternative energy sources has been in renewable energy, with electrified transport and electrified heat accounting for a large portion of the remaining investments.

By 2023, close to 1600 institutions, with more than $40 trillion of funds under their management, had announced or concluded their divestitures of investments in fossil fuel companies.
If impact investing were measured entirely on fund flows into green energy companies and out of fossil fuel companies, it has clearly succeeded.
Market Price (and Capitalization)
It is undeniable that fund flows into or out of companies affects their stock prices, and if the numbers in the last section are even close to reality, you should have expected to see a surge in market prices at alternative energy companies, as a result of funds flowing into them, and a decline in market prices of fossil fuel companies, as fossil fuel divestment gathers steam.
On the alternative energy front, as money has flowed into these companies, there has been a surge in enterprise value (equity and net debt) and market capitalization (equity value); I report both because impact investing can also take the form of green bonds, or debt, at these companies. The enterprise value of publicly traded alternative energy companies has risen from close to zero two decades ago to more than $700 billion in 2020, before losing steam in the last three years:
Adding in the value of private companies and start-ups in this space would undoubtedly push up the number further.On the fossil fuel front, the fossil fuel divestments have had an impact on market capitalizations, though there are signs that the effect is weakening:

In the last decade, when fossil fuel divestment surged, the percentage changes in market capitalization at fossil fuel companies lagged returns on the market, with fossil fuel companies reporting a compounded annual percentage increase of 4.49% a year.. The negative effect was strongest in the middle of the last decade, but market prices for fossil fuel companies have recovered strongly between 2020 and 2023.
It is worth noting that even after their surge in market cap in the last decade, alternative energy companies have a cumulated enterprise value of about $600 billion in September 2023, a fraction of the $8.5 trillion of cumulated enterprise value at fossil fuel companies.
Investor perceptions
Impact investing has always been about changing investor perceptions of energy companies, more than just prices. In fact, some impact investors have argued that their presence in the market and advocacy for alternative energy has led investors to change their views about fossil fuel companies, shifting from viewing them as profitable, cash-rich businesses with extended lives, to companies living on borrowed time, looking at decline and even demise. In intrinsic valuation terms, that shift should show up in the pricing, with lower value attached to the latter scenario than the former:

On the green energy front, to see if investors perceptions of these companies have changed, I look at two the pricing metrics for green energy companies - the enterprise value to EBITDA and enterprise value to revenue multiples:
 The numbers offer a mixed message on whether impact investing has changed investor perceptions, with EV to EBITDA multiples staying unchanged, between the 1998-2010 and 2011-2023 time periods, but EV as a multiple of revenues soaring from 2.62 in the 1998-2010 time period to 5.95 in the 2011-2023 time period. The fund flows into green energy are affecting pricing, though it remains an open question as to whether the pricing is getting too rich, as too much money chases too few opportunities.
Looking at fossil fuel firms, the poor performance in the last decade seems to support the notion that impact investing has changed how investors perceive fossil fuel companies, but there are some checks that need to be run to come that conclusion.
Oil Price Effect: The market capitalization of oil companies is dependent on oil prices, as you can see in the figure below, where the collective market capitalization of fossil fuel companies is graphed against the average oil price each year from 1970 to 2022; almost 70% of the variation in market capitalization over time explained by oil price movements.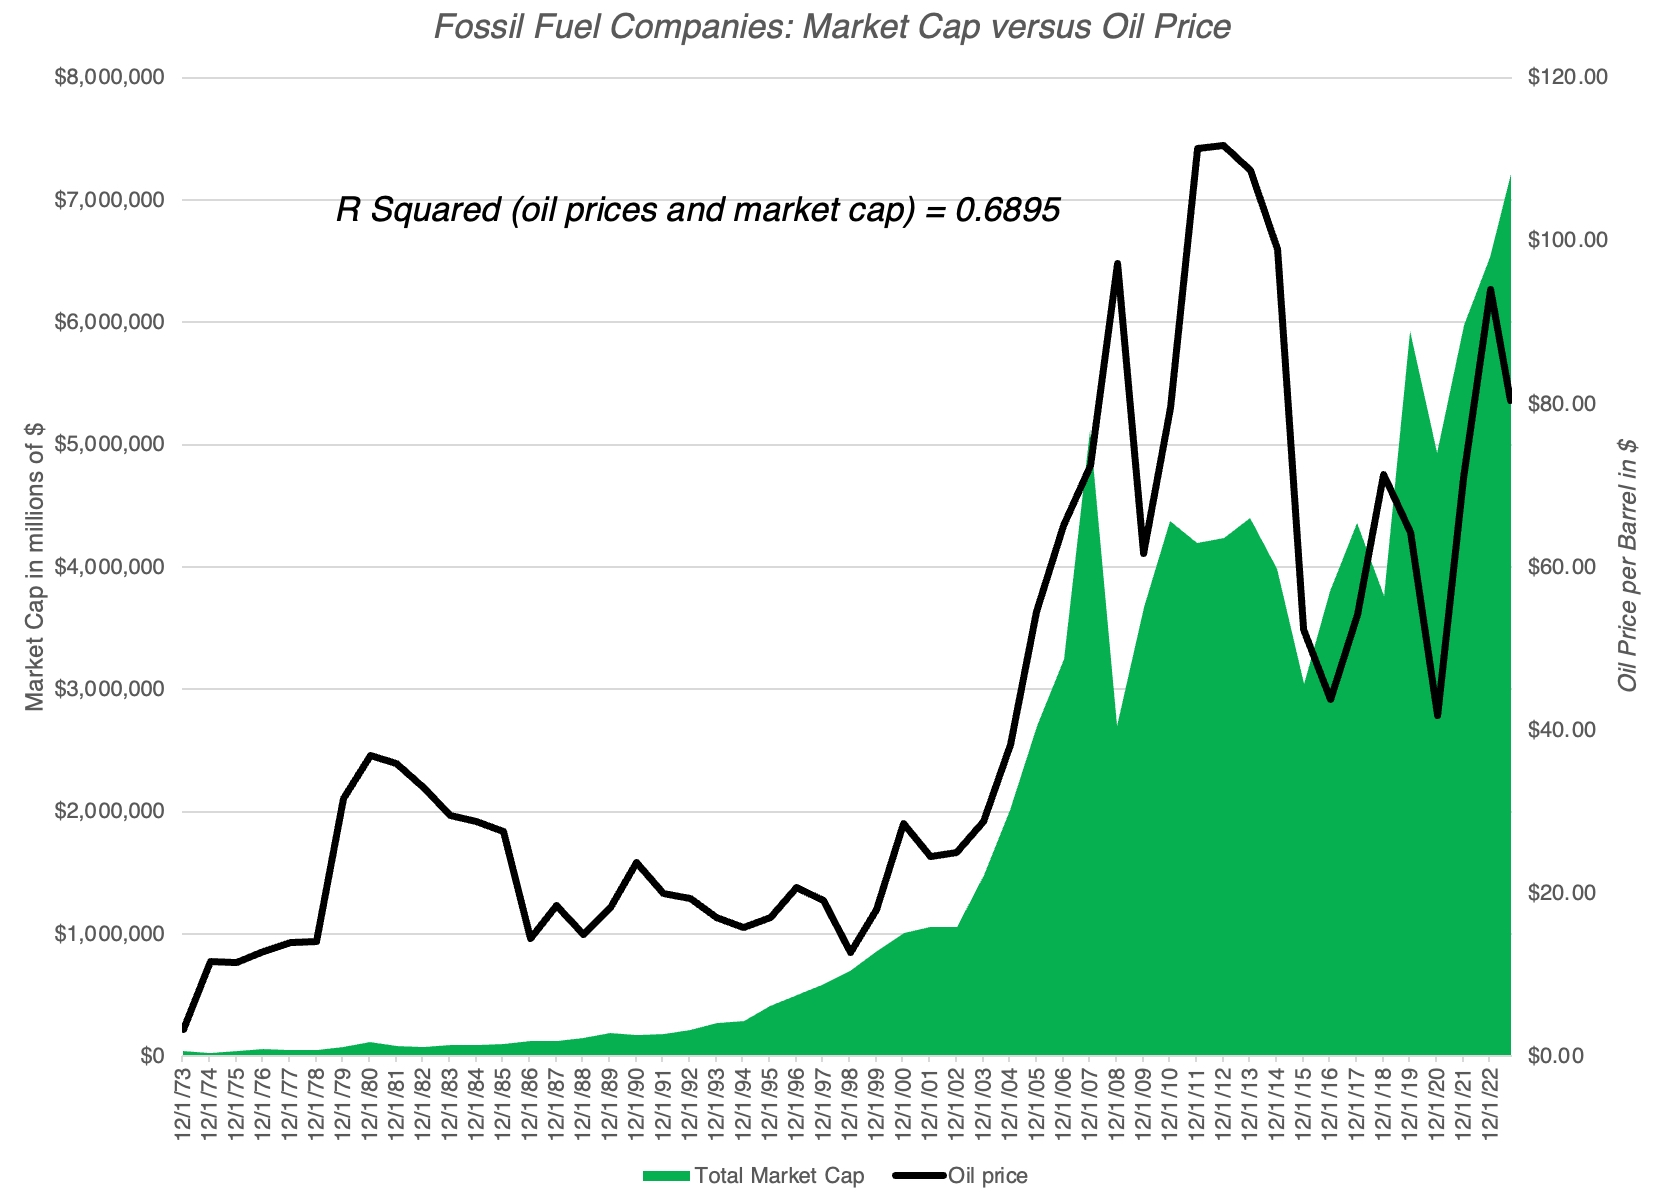
To separate impact investing divestment effects from oil price effects, I estimated the predicted market capitalization of fossil fuel companies, given the oil price each year, using the statistical relationship between market cap and oil prices in the twenty five years leading into the forecast year. (I regress market capitalization against average oil price from 1973 to 1997 to estimate the expected market cap in 1998, given the oil price in 1998, and so on, for every year from 1998 to 2023. Note that the only thing you can read these regressions is that market capitalization and oil prices move together, and that there is no way to draw conclusions about causation):

If divestitures are having a systematic effect on how markets are pricing fossil fuel companies, you should expect to see the actual market capitalizations trailing the expected market capitalization, based on the oil price. That seems to be the case, albeit marginally, between 2011 and 2014, but not since then. In short, the divestiture effect on fossil fuel companies has faded over time, with other investors stepping in and buying shares in their companies, drawn by their earnings power.Pricing: If impact investing is changing investor perceptions about the future growth and termination risk at fossil fuel companies, it should show up in how these companies are priced, lowering the multiples of revenues or earnings that investors are willing to pay. In the chart below, I look at the pricing of fossil fuel companies over time, using EV to sales and EV to EBITDA as pricing metrics:
 While the pricing metrics swing from year to year, that has always been true at oil companies, since earnings and revenues vary, with oil prices. However, if impact investing is having a systematic effect on how investors are pricing companies, there is little evidence of that in this chart.In sum, while it is possible to find individual investors who have become skeptical about the future for fossil fuel companies, that view is not reflective of the market consensus. I do believe that investors are pricing fossil fuel companies now, with the expectation of much lower growth in the future, than they used to, but that is coming as much from these companies returning more of their earnings as cash and reinvesting less than they used to, as it is from an expectation that the days of fossil fuel are numbered. Some impact investors will argue that this is because investors are short-term, but that is a double-edged sword, since it undercuts the very idea of using investing as the vehicle to create social and environmental change.
Operating Impact
Impact investing, in addition to affecting pricing of green energy and fossil fuel companies, can also have effects on how fossil fuel companies perform and operate. On the profitability front, fossil fuel companies seem to have weathered the onslaught of climate change critics, with revenues and profit margins (EBITDA and operating) bouncing back from a slump between 2014 and 2018 to reach historic highs in 2022.
While the pricing metrics swing from year to year, that has always been true at oil companies, since earnings and revenues vary, with oil prices. However, if impact investing is having a systematic effect on how investors are pricing companies, there is little evidence of that in this chart.In sum, while it is possible to find individual investors who have become skeptical about the future for fossil fuel companies, that view is not reflective of the market consensus. I do believe that investors are pricing fossil fuel companies now, with the expectation of much lower growth in the future, than they used to, but that is coming as much from these companies returning more of their earnings as cash and reinvesting less than they used to, as it is from an expectation that the days of fossil fuel are numbered. Some impact investors will argue that this is because investors are short-term, but that is a double-edged sword, since it undercuts the very idea of using investing as the vehicle to create social and environmental change.
Operating Impact
Impact investing, in addition to affecting pricing of green energy and fossil fuel companies, can also have effects on how fossil fuel companies perform and operate. On the profitability front, fossil fuel companies seem to have weathered the onslaught of climate change critics, with revenues and profit margins (EBITDA and operating) bouncing back from a slump between 2014 and 2018 to reach historic highs in 2022.
 A key development over the last decade, as profits have returned, is that fossil fuel companies are returning much of cash flows that they are generating to their shareholders in the form of dividends and buybacks, notwithstanding the pressure from activist impact investors that they reinvest that money in green energy projects:
 In one development that impact investors may welcome, fossil fuel companies are collectively investing less in exploration for new fossil fuel reserves in the last decade than they did in prior ones:
 If you couple this trend of exploring less with the divestitures of fossil fuel reserves, over the last decade, there is a basis for the argument that fossil fuel companies are reducing their fossil fuel presence, and some impact investing advocates may be tempted to declare victory. After all, if the objective is to reduce fossil fuel production, does it not advance your cause if less money is being spent exploring for coal, oil and gas? Before claiming a win, though, there is a dark side to this retreat by public fossil-fuel companies, and that comes from private equity investors and privately-owned (or government-owned) oil companies stepping into the breach; many of the divestitures and sales of fossil fuel assets by publicly traded companies have been to private buyers, and the assets being divested are often among the dirtiest (from a climate-change perspective) of their holdings.. Over the last decade, some of private equity’s biggest players have invested well over $1.1 trillion in fossil fuel, with the investments ranging the spectrum.
 Source: Pitchbook
While there was an uptick in investments in renewables in 2019 and 2020, the overwhelming majority of private equity investments during the decade were in fossil fuels. In the process, private equity firms like the Carlyle Group and KKR have become major holders of fossil fuel reserves, and there are a few private buyers who have profited from buying abandoned and castoff oil wells from oil companies, pressured to sell by impact investors. While climate change advocates are quick to point to this public-to-private transition of fossil fuel assets as a flaw, they fail to recognize that it is is a natural side-effect of an approach that paints publicly traded fossil fuel firms as villains and shuns their investments, while continuing to be dependent on fossil fuels for meeting energy needs. On the activist front, there is evidence that impact investing's capacity to change oil company behavior is losing its potency. While fossil fuel companies were quick to give in to pressure from impact investors to de-carbonize, for much of the last decade, the Russian invasion of Ukraine seems to have been an "emperor-has-no-clothes" moment for green energy advocates, laying bare how reliant the globe still is on fossil fuels for its energy needs. In the aftermath, the biggest fossil fuel companies have become bolder about their plans to stay in and grow their fossil fuel investments, with Royal Dutch taking a stake in Qatari gas field, BP announcing it will produce more oil and gas, Exxon Mobil buying Pioneer Natural Resources, a shale driller for $60 billion, and Petrobras reversing course on divestitures.
Macro Impact The success or failure of impact investing, when it relates to climate change, ultimately comes from the changes it creates in how energy is produce and consumed, and it is on this front that the futility of the movement is most visible. While alternative energy sources have expanded their production, it has not been at the expense of oil consumption, which has barely budged over the last decade.
 EIA: World Oil Consumption
Fairly or unfairly, the pandemic seems to have done more to curb oil consumption than all of impact investing's efforts over the last decade, but the COVID effect, which saw oil consumption drop in 2020 has largely faded. Taking a global and big-picture perspective of where we get our energy, a comparison of energy sources in 1971 and 2019 yields a picture of how little things have changed:
EIA: World Oil Consumption
Fairly or unfairly, the pandemic seems to have done more to curb oil consumption than all of impact investing's efforts over the last decade, but the COVID effect, which saw oil consumption drop in 2020 has largely faded. Taking a global and big-picture perspective of where we get our energy, a comparison of energy sources in 1971 and 2019 yields a picture of how little things have changed:
 IEA: World Energy Balances Overview
Fossil fuel, which accounted for 86.6% of energy production in 1971, was responsible for 80.9% of production in 2019, with almost all of that gain from coming from nuclear energy, which many impact investors viewed as an undesirable alternative energy source for much of the last decade. Focusing on energy production just in the US, the failure of impact investing to move the needle on energy production can be seen in stark terms:
 Source: U.S. Energy Information Administration
Fossil fuels account for a higher percent of overall energy produced in the United States today than they did ten or fifteen years ago, with gains in solar, wind and hydropower being largely offset by reductions in nuclear energy. If this is what passes for winning in impact investing, I would hate to see what losing looks like. I have tried out variants of this post with impact investing acquaintances, and there are three broad responses that they have to its findings (and three defenses for why we should keep trying):
Source: U.S. Energy Information Administration
Fossil fuels account for a higher percent of overall energy produced in the United States today than they did ten or fifteen years ago, with gains in solar, wind and hydropower being largely offset by reductions in nuclear energy. If this is what passes for winning in impact investing, I would hate to see what losing looks like. I have tried out variants of this post with impact investing acquaintances, and there are three broad responses that they have to its findings (and three defenses for why we should keep trying):Things would be worse without impact investing: It is impossible to test this hypothetical, but is it possible that our dependence on fossil fuels would be even greater, without impact investing making a difference? Of course, but that argument would be easier to make, if the trend lines were towards fossil fuels before impact investing, and moved away from fossil fuels after its rise. The data, though, suggests that the biggest shift away from fossil fuels occurred decades ago, well before impact investing was around, primarily from the rise of nuclear energy, and that impact investing's tunnel vision on alternative energy has actually made things worse.It takes time to create change: It is true that the energy business is an infrastructure business, requiring large investments up front and long gestation periods. It is possible that the effects of impact investing are just not being felt yet, and that they are likely to show up later this decade. This would undercut the urgency argument that impact investors have used to induce their clients to invest large amounts and doing it now, and if they had been more open about the time lag from the beginning, this argument would have more credibility today.Investing cannot offset consumption choices: If the argument is that impact investing cannot stymie climate change on its own, without changes in consumer behavior, I could not agree more, but changing behavior will be painful, both politically and economically. I would argue that impact investing, by offering the false promise of change on the cheap, has actually reduced the pressure on politicians and rule-makers to make hard decisions on taxes and production.Even conceding some truth in all three arguments, what I see in the data is the essence of insanity, where impact investors keep throwing in more cash into green energy and more vitriol at fossil fuels, while the global dependence on fossil fuels increases.
Impact Investing: Investing for change Much of what I have said about impact investing's quest to fight climate change can be said about the other societal problems that impact investors try to address. Poverty, sexism, racism and inequality have had impact investing dollars directed at them, albeit not on the same scale as climate change, but are we better off as a society on any of these dimensions? To the response that doing something is better than being doing nothing, I beg to differ, since acting in ways that create perverse outcomes can be worse than sitting still. To end this post on a hopeful note, I believe that impact investing can be rescued, albeit in a humbler, more modest form. With your own money, pass the sleep test: If you are investing your own money, your investing should reflect your pocketbook as well as your conscience. After all, investors, when choosing what to invest in, and how much, have to pass the sleep test. If investing in Exxon Mobil or Altria leads you to lose sleep, because of guilt, you should avoid investing in these companies, no matter how good they look on a financial return basis.With other people's money, be transparent and accountable about impact: If you are investing other people’s money, and aiming for impact, you need to be explicit on what the problem is that you are trying to solve, and get buy in from those who are investing with you. In addition, you should specify measurement metrics that you will use to evaluate whether you are having the impact that you promised.Be honest about trade offs: When investing your own or other people's money, you have to be honest with yourself not only about the impact that you are having, but about the trade offs implicit in impact investing. As someone who teaches at NYU, I believe that NYU's recent decision to divest itself of fossil fuels will not only have no effect on climate change, but coming from an institution that has established a significant presence in Abu Dhabi, it is an act of rank hypocrisy. It is also critical that those impact investors who expect to make risk-adjusted market returns or more, while advancing social good, recognize that being good comes with a cost.Less absolutism, more pragmatism: For those impact investors who cloak themselves in virtue, and act as if they command the moral high ground, just stop! Not only do you alienate the rest of the world, with your I-care-about-the-world-more-than-you attitude, but you eliminate any chances of learning from your own mistakes, and changing course, when your actions don't work.Harness the profit motive: I know that for some impact investors, the profit motive is a dirty concept, and the root reason for the social problems that impact investing is trying to address. While it is true that the pursuit of profits may underlie the problem that you are trying to solve, the power from harnessing the profit motive to solve problems is immense. Agree with his methods or not, Elon Musk, driven less by social change and more by the desire to create the most valuable company in the world, has done more to address climate change than all of impact investing put together. I started this post with two presumptions, that the social problems being addressed by impact investors are real and that impact investors have good intentions, and if that is indeed the case, I think it is time that impact investors face the truth. After 15 years, and trillions invested in its name, impact investing, as practiced now, has made little progress on the social and environmental problems that it purports to solve. Is it not time to try something different?
YouTube Video
ESG PostsSounding Good or Doing Good: A Skeptical Look at ESGThe ESG Movement: The Goodness Gravy Train rolls on!ESG's Russia Test: Trial by Fire or Crash and Burn?
October 6, 2023
Invisible, yet Invaluable: Valuing Intangibles in the Birkenstock IPO!
A few days ago, I valued Instacart ahead of its initial public offering, and noted that the reception that the stock gets will be a good barometer of where risk capital stands in the market, right now. After a buzzy open, when the stock jumped from its offering price of $30 a share to $42, the stock has quickly given up those gains and now trades at below to its offer price. In this post, I will look at another initial public offering, Birkenstock, that is likely to get more attention in the next few weeks, given that it is targeting to go public at a pricing of about €8 billion, for its equity, in a few weeks. Rather than make this post all about valuing Birkenstock, and comparing that value to the proposed pricing, I would like to use the company to discuss how intangible assets get valued in an intrinsic valuation, and why much of the discussion of intangible valuation in accounting circles is a reflection of a mind-set on valuation that often misses its essence.
The Value of Intangible Assets
Accounting has historically done a poor job dealing with intangible assets, and as the economy has transitioned away from a manufacturing-dominated twentieth century to the technology and services focused economy of the twenty first century, that failure has become more apparent. The resulting debate among accountants about how to bring intangibles on to the books has spilled over into valuation practice, and many appraisers and analysts are wrongly, in my view, letting the accounting debate affect how they value companies.
The Rise of Intangibles
While the debate about intangibles, and how best to value them, is relatively recent, it is unquestionable that intangibles have been a part of valuation, and the investment process, through history. An analyst valuing General Motors in the 1920s was probably attaching a premium to the company, because it was headed by Alfred Sloan, viewed then a visionary leader, just as an investor pricing GE in the 1980s was arguing for a higher pricing, because Jack Welch was engineering a rebirth of the company. Even a cursory examination of the the Nifty Fifty, the stocks that drove US equities upwards in the early 1970s, reveals companies like Coca Cola and Gilette, where brand name was a significant contributor to value, as well as pharmaceutical companies like Bristol-Myers and Pfizer, which derived a large portion of their value from patents. In fact, IBM and Hewlett Packard, pioneers of the tech sector, were priced higher during that period, because of their technological strengths and other intangibles. Within the investment community, there has always been a clear recognition of the importance of intangibles in driving investment value. In fact, among old-time value investors, especially in the Warren Buffet camp, the importance of having "good management' and moats (competitive advantages, many of which are intangible) represented an acceptance of to how critical it is that we incorporate these intangible benefits into investment decisions.
With that said, it is clear that the debate about intangibles has become more intense in the last two decades. One reason is the perception that intangibles now represent a greater percent of value at companies and are a significant factor in more of the companies that we invest in, than in the past. While I have seen claims that intangibles now account for sixty, seventy or even ninety percent of value, I take these contentions with a grain of salt, since the definition of "intangible" is elastic, and some stretch it to breaking point, and the measures of value used are questionable. A more tangible way to see why intangibles have become a hot topic of discussion is to look at the evolution of the top ten companies in the world, in market capitalization, over time:

In 1980, IBM was the largest market cap company in the world, but eight of the top ten companies were oil or manufacturing companies. With each decade, you can see the effect of regional and sector performance in the previous decade; the 1990 list is dominated by Japanese stocks, reflecting the rise of Japanese equities in the 1980s, and the 2000 list by technology and communication companies, benefiting from the dot-com boom. Looking at the top ten companies in 2020 and 2023, you see the dominance of technology companies, many of which sell products that you cannot see, often in production facilities that are just as invisible. The other development that has pushed the intangible discussion to the forefront is a sea change in the characteristics of companies entering public markets. While companies that were listed for much of the twentieth century waited until they had established business models to go public, the dot-com boom saw the listing of young companies with growth potential but unformed business models (translating into operating losses), and that trend has continued and accelerated in this century. The graph below looks at the revenues and profitability of companies that go public each year, from 1980 to 2020:
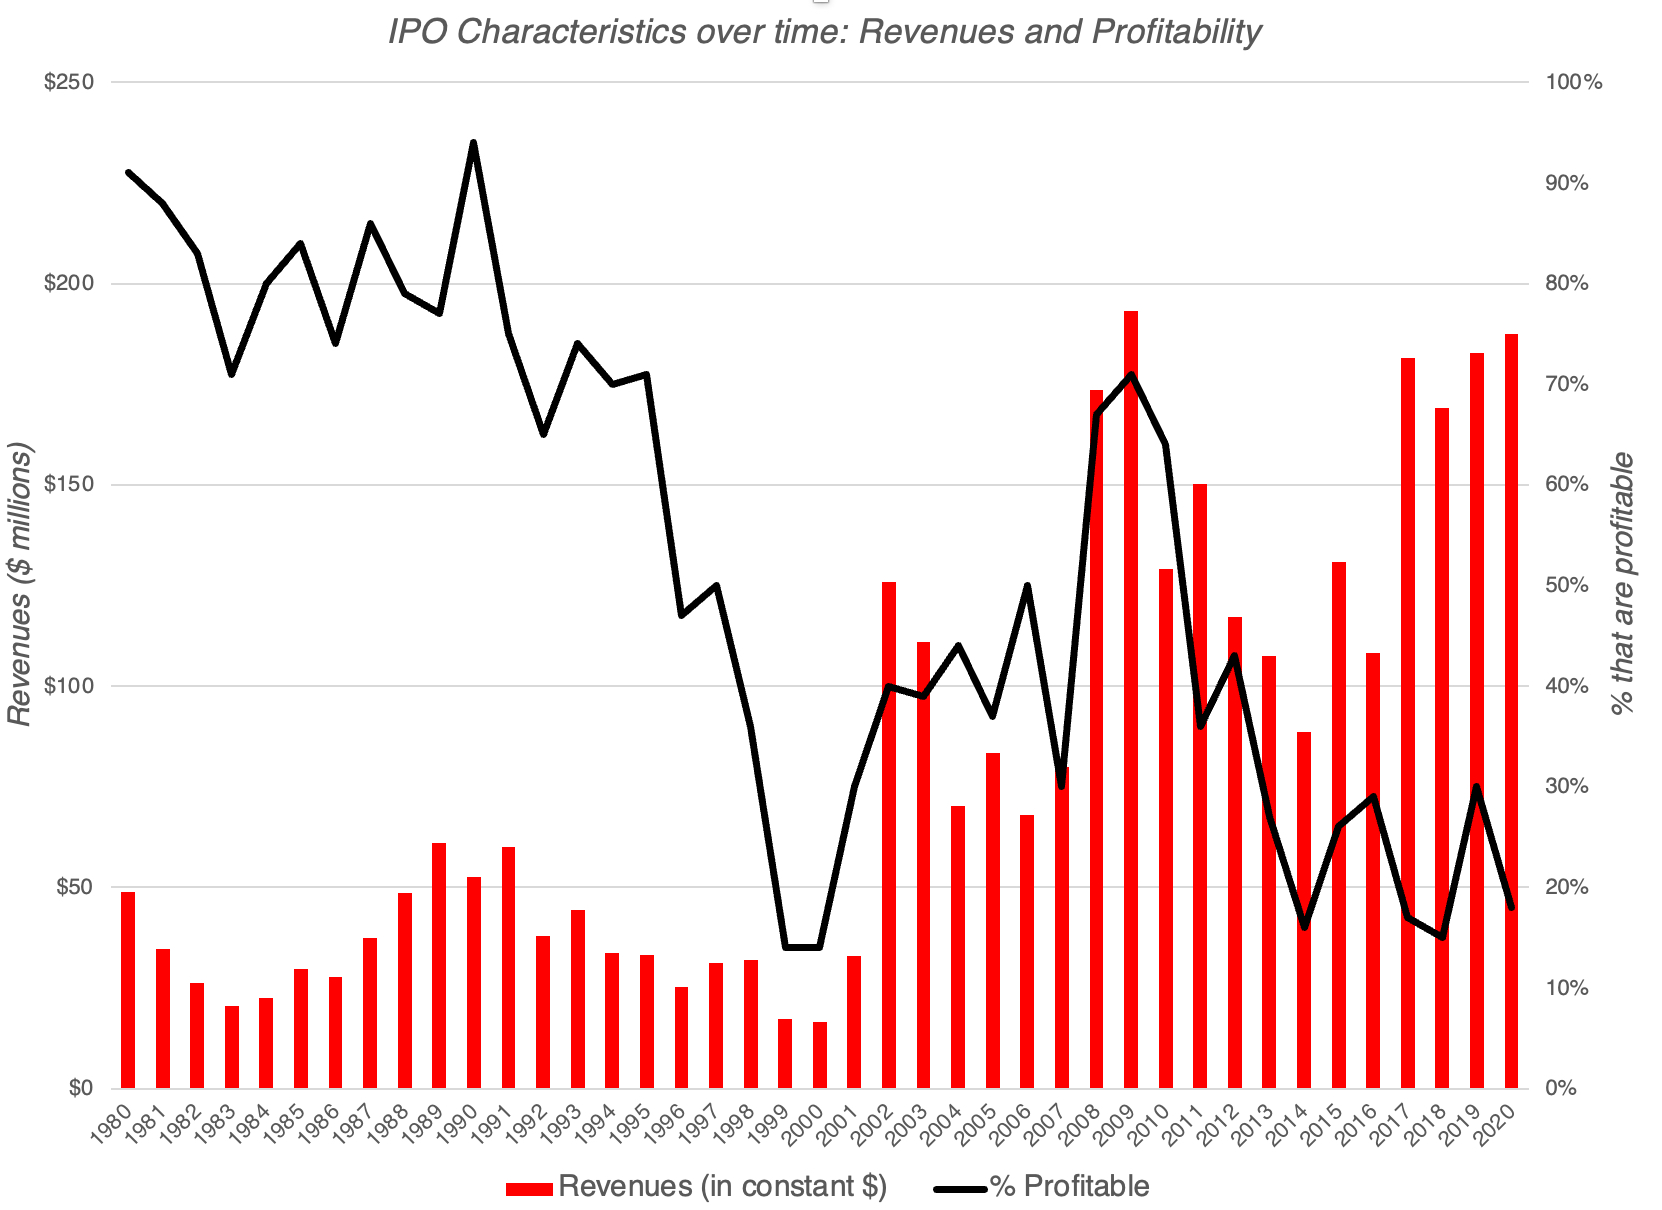
As you can see, the percent of money-making companies going public has dropped from more than 90% in the 1980s to less than 20% in 2020, but at the same time, while also reporting much higher revenues, reporting the push by private companies to scale up quickly. In valuing these companies, investors and analysts face a challenge, insofar as much of the values of these firms came from expectations of what they would do in the future, rather than investments that they have already made. I capture this effect in what I call a financial balance sheet:

While you can value assets-in-place, using historical data and the information in financial statements, in assessing the value of growth assets, you are making your best assessments of investments that these companies will make in the future, and these investments are formless, at least at the moment.
The Accounting Challenge with Intangibles
The intangible debate is most intense in the accounting community, with both practitioners and academics arguing about whether intangibles should be "valued", and if so, how to bring that value into financial statements. To see why the accounting consequences are likely to be dramatic, consider how these choices will play out in the balance sheet, the accountants' attempt to encapsulate what a business owns, what it owes and how much its equity is worth.

There are inconsistencies in how accountants measure different classes of assets, and I incorporate them into my picture above, leaving the intangible assets section as the unknown: Any changes in accounting rules on measuring the value of intangibles, and bringing them on the balance sheet, will also play out as changes on the other side of the balance sheet, primarily as changes in the value of assessed or book equity. Put simply, if accountants decide to bring intangible assets like brand name, management quality and patent protection into asset value will increase the value of book equity, at least as accountants measure it, in that company. In their attempt to bring intangible assets on to balance sheets, accountants face a barrier of their own creation, emanating from how they treat the expenditures incurred in building up these assets. To understand why, consider how fixed assets (such as plant and equipment and equipment) become part of the balance sheet. The expenditures associated with acquiring these fixed assets are treated as capital expenditures, separate from operating expenses, and only the portion of that expenditure (depreciation or amortization) that is assumed to be related to the current year's operations is treated as an operating expense. The unamortized or un-depreciated portions of these capital expenses are what we see as assets on balance sheets. The expenses that result in intangible asset acquisitions are, for the most part, not treated consistently, with brand name advertising, R&D expenses and investments in recruiting/training, the expenses associated with building up brand name, patent protection and human capital, respectively, being treated as operating, rather than capital, expenses. As a consequence of this mistreatment, I have argued that not only are the biggest assets, mostly intangible, at some companies kept off the balance sheet, but their earnings are misstated:
 There are ways in which accounting can fix this inconsistency, but it will result in an overhaul of all of the financial statements, and companies and investors balk at wholesale revamping of accounting numbers (EBITDA, earnings per share, book value) that they have relied on to price these firms. So, how far has accounting come in bringing intangible assets on to balance sheets? One way to measure progress on this issue is to look at the portion of the book value of equity at US companies that comes from tangible assets, in the chart below:
 Looking across all US firms from 1980 to 2022, the portion of book value of equity that comes tangible assets has dropped from more than 70% in 1998 to about 30% in 2022. That would suggest that intangible assets are being valued and incorporated into balance sheets much more now than in the past. Before you come to that conclusion, though, you may want to consider the breakdown of the intangible assets on accounting balance sheets, which I do in the graph below:

Over the last 25 years, as intangible assets have risen in value, goodwill has been, by far, the biggest single component of that value, accounting for about 60% of all intangibles on US corporate balance sheets; the jump in 2001 came from a change in accounting rules on acquisitions, when pooling was banned and companies were forced to recognize goodwill on all acquisitions. So what? I have long argued that goodwill is not an asset, intangible or not, but more a plug variable, signifying the difference between the price paid to acquire a target company and its book value, with adjustments for fairness, and designed to make balance sheets balance. Thus, much of the talk about intangibles in accounting has been just that, talk, with little of real consequence for balance sheets. There is another measure that you can use to see the futility, at least so far, of accounting attempts to value intangibles. In the graph below, I look at the aggregated market capitalization of companies, in 2022, which should incorporate the pricing of intangibles by the market, and compare that value to book value (tangible and intangible), by sector, reflecting accounting attempts to value these same intangibles.
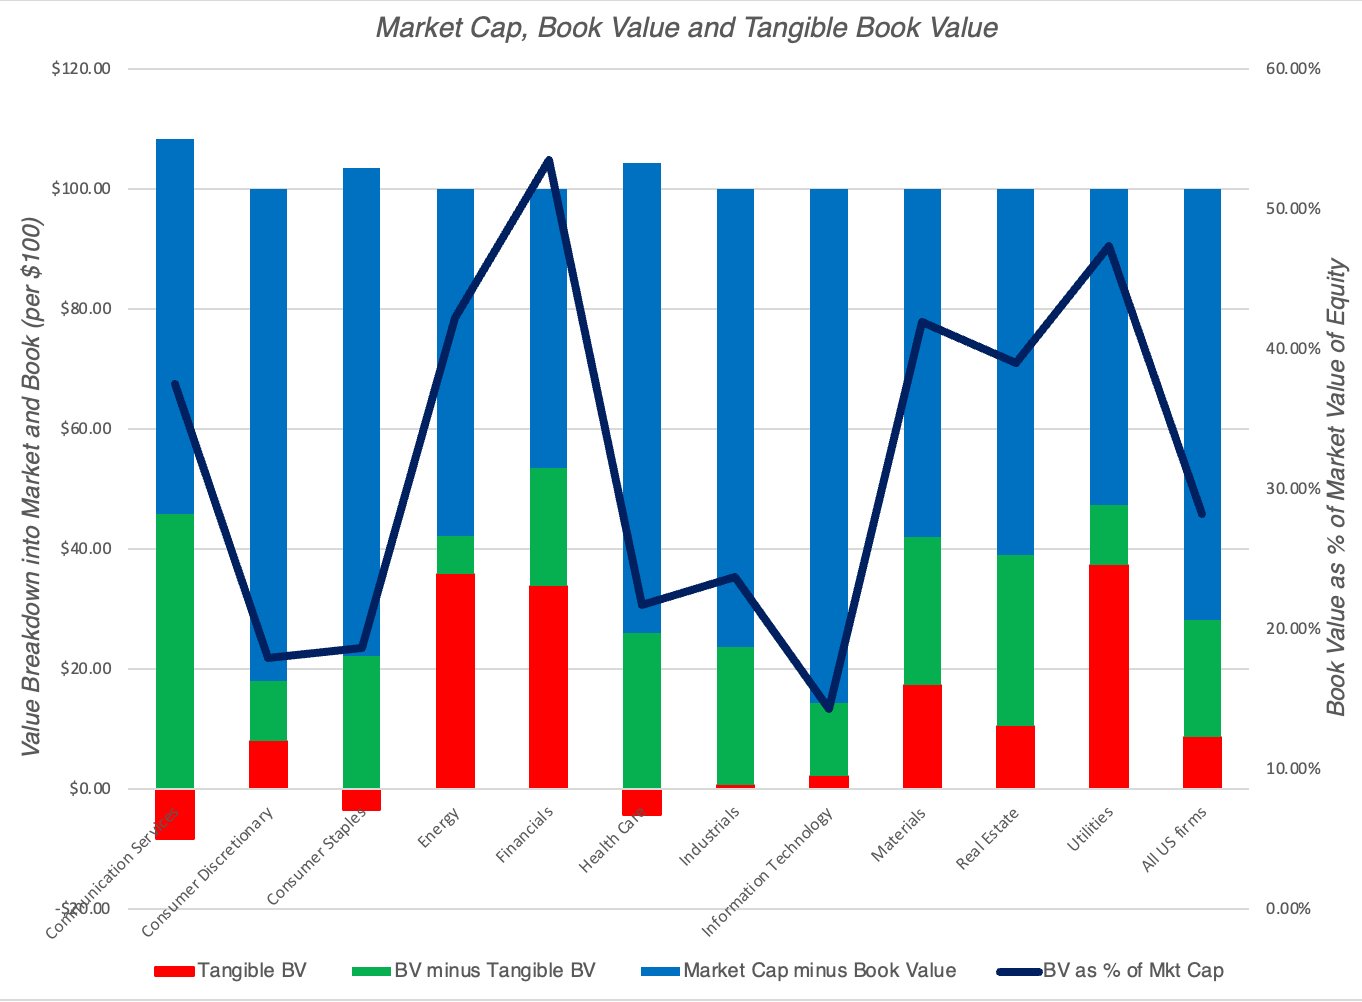
The sectors where you would expect intangible assets to be the largest portion of value are consumer products (brand name) and technology (R&D and patents). These are also the sectors with the lowest book values, relative to market value, suggesting that whatever accountants are doing to bring in intangibles in these companies into book value is not having a tangible effect on the numbers. In sum, the accounting obsession with intangibles, and how best to deal with them, has not translated into material changes on balance sheets, at least with GAAP in the United States. It is true that IFRS has moved faster in bringing intangible assets on to balance sheets, albeit not always in the most sensible ways, but even with those rules in place, progress on bringing intangible assets onto balance sheets has been slow. To be frank, I don't think accounting rule writers will be able to handle intangibles in a sensible way, and the barriers lie not in rules or models, but in the accounting mindset. Accounting is backward-looking and rule-driven, making it ill equipped to value intangibles, where you have no choice, but to be forward looking, and principle-driven.
The Intrinsic Value of Intangibles
I have been teaching and writing about valuation for close to four decades now, and I have often been accused of giving short shrift to intangible assets, because I don't have a session dedicated to valuing intangibles, in my valuation class, and I don't have entire books, or even chapters of my books, on the topic. While it may seem like I am in denial, given how much value companies derive from assets you cannot see, I have never felt the need to create new models, or even modify existing models, to bring in intangibles. In this section, I will explain why and make the argument that if you do intrinsic valuation right, intangibles should be, with imagination and very little modification of existing models, already in your intrinsic value.
To understand intrinsic value, it is worth starting with the simple equation that animates the estimation of value, for an asset with n years of cash flows:

Thus, the intrinsic value of an asset is the present value of the expected cash flows on it, over its lifetime. When valuing a business, where cash flows could last for much longer (perhaps even forever), this equation can be adapted:

In this equation, for anything, tangible or not, has to show up in either the expected cash flows or in the risk (and the resulting discount rate); that is my "IT" proposition. This proposition has stood me in good stead, in assessing the effect on value of just about everything, from macro variables like inflation to buzzwords like ESG.
Using this framework for assessing intangible assets, from brand name to quality management, you can see that their effect on value has to come from either higher expected cash flows or lower risk (discount rates). To provide more structure to this discussion, I reframe the value equation in terms of inputs that valuation analysts should be familiar with - revenue growth, operating margins and reinvestment, driving cash flows, and equity and debt risk, determining discount rates and failure risk.
In the picture, I have highlight some of the key intangibles and which inputs are mostly likely to be affected by their presence. It is the operating margin where brand name, and the associated pricing power, is likely have its biggest effect, though it can have secondary effects on revenue growth and even the cost of capital. Good management, another highly touted intangible, will manifest in a business being able to deliver higher revenue growth, but also show up in margins and reinvestment; the essence of superior management is being able to find growth, when it is scarce, while maintaining profitability and not reinvesting too much. Connections to governments and regulators, an intangible that is seldom made explicit, can affect value by reducing failure risk and the cost of debt, while increasing growth and or profitability, as the company gets favorable treatment on bids for contracts.This is not a comprehensive list, but the framework applies to any intangible that you believe may have an effect on value. This approach to intangibles also allows you to separate valuable intangibles from wannabe intangibles, with the latter, no matter how widely sold, having little or no effect on value. Thus, a company that claims that it has a valuable brand name, while delivering operating margins well below the industry average, really does not, and the effect of ESG on value, no matter what its advocates claim, is non-existent. It is true that this approach to valuing intangibles works best for a company with a single intangible, whether it be brand name or customer loyalty, where the effect is isolated to one of the value drivers. It becomes more difficult to use for companies, like Apple, with multiple intangibles (brand name, styling, operating system, user platform). While you can still value Apple in the aggregate, breaking out how much of that value comes from each of the intangibles will be difficult, but as an investor, why does it matter?
The Birkenstock IPO: A Footwear company with intangibles
If you have found this discussion of intangibles abstract, I don't blame you, and I will try to remedy that by applying my intrinsic value framework to value Birkenstock, just ahead of its initial public offering. As a company with multiple intangible components in its story, it is well suited to the exercise, and I will try to not only estimate the value of the company with the intangibles incorporated into the numbers, but also break down the value of each of its intangibles.
The Lead In
Birkenstock is primarily a footwear company, and to get perspective on growth, profitability and reinvestment in the sector, I looked at all publicly traded footwear companies across the globe. the table below summarizes key valuation metrics for the 86 listed footwear companies that were listed as of September 2023.

In the aggregate, the metrics for footwear companies are indicative of an unattractive business, with more than half the listed companies seeing revenues shrink in the decade, leading into 2022 and more than quarter reporting operating losses. However, many of these companies are small companies, with a median revenue at $170 million, struggling to stay afloat in a competitive product market. Since Birkenstock generated revenues of $1.4 billion in the twelve months leading into its initial public offering, with an expectation of more growth in the future, I zeroed in on the twelve largest companies in the apparel and footwear sector, in market capitalization, and looked at their operating metrics:

As you can see, these companies look very different from the sector aggregates, with solid revenue growth (median compounded growth rate of 8.66% a year, for the last decade) and exceptional operating margins (gross margins close to 70% and operating margins of 24%). Each of the companies also has a recognizable or many recognizable brand names, with LVMH and Hermes topping the list. In this business, at least, brand name seems to be dividing line between success and mediocrity, and having a well-recognized brand name contributes to growth and profitability. It is this grouping that I will draw on more, as I look valuing Birkenstock.
Birkenstock's History
In my work on corporate life cycles, I talk about how companies age, and how importance it is that they act accordingly. Generally, as a company moves across the life cycle, revenue growth eases, margins level off and there is less reinvestment. As a business that has been around for almost 250 years, Birkenstock should be a mature or even old company, but it has found a new lease on life in the last decade.
Birkenstock was founded in 1774 by Johann Adam Birkenstock, a Germany cobbler, and it stayed a family business for much of its life. In the decades following its founding, the company modified and adapted its footwear offerings, catering to wealthy Europeans in the growing German spa culture in the 1800s, and modifying its product line, adding flexible insoles in 1896 and pioneering arch supports in 1902. During the 1920s and 1930s, the company carved out a market around comfort and foot care, partnering with physicians and podiatrists, offering solutions for customers with foot pain. In 1963, the company introduced its first fitness sandal, the Madrid, and sandals now represent the heart of Birkenstock's product line.
Along the way, serendipity played a role in the company's expansion. In 1966, a Californian named Margot Fraser, when visiting her native Germany, discovered that Birkenstocks helped her tired and hurting feet, and she convinced Karl Birkenstock to try selling the company's sandals in California. It is said that Karl advanced her credit, and helped her persuade reluctant California retailers to carry the company’s unconventional footwear in their stores. That proved timely, since people protesting against the war and society's ills latched on to these sandals, making them them symbolic footwear for the rebellious. in the 1990s, the brand had a rebirth, when a very young Kate Moss wore it for a cover story, and it became a hot brand, especially on college campuses. Today, Birkenstock gets more than 50% of its revenues in the United States, with multiple celebrities among its customers. The company's prospectus does a good job painting a picture of both the product offerings and customer base, leading into the IPO, and I have captured those statistics in the picture below:

Unlike some in its designer and brand name peers, the company’s products are not exorbitantly over priced and the company’s best seller, the Arizona, sells for close to $100. While the company sells more shoes to women than men, it sells footwear to a surprisingly diverse customer base, in terms of income, with 20% of its sales coming from customers who earn less than $50,000 a year, and in terms of age, with almost 40% of its revenues coming from Gen X and Gen Z members.
For much of its history, Birkenstock was run as a family business, capital constrained and with limited growth ambitions, perhaps explaining its long life. The turning point for the company, to get to its current form, occurred in 2012, when the family, facing internal strife, turned control of the company over to outside managers, choosing Markus Bensberg, a company veteran, and Oliver Reichert, a consultant, as co-CEOs of the company. Reichert, in particular, was a controversial pick since he was not only an outsider, but one with little experience in the shoe business, but the choice proved to be inspired. With an assist again from serendipity, when Phoebe Philo exhibited a black mink-lined Arizona on a Paris catwalk in 2012, leading to collaborations with high-end designers like Dior, the company has found a new life as a growth company, with revenues rising from €200 million in 2012 to more than €1.4 billion in the twelve months leading into the IPO, representing an 18.2% compounded annual growth rate over the decade:
 Birkenstock Prospectus 2023 (October 4 filing)
The surge in revenues has been particularly pronounced since 2020, the COVID year, with different theories on why the pandemic increased demand for the product; one is that people working from home chose the comfort of Birkenstocks over uncomfortable work shoes. The company's growth has come with solid profitability, and the table below shows key profit metrics over the last three years:
 Birkenstock Prospectus 2023 (October 4 filing)
Note that the company's operating and gross margins, at least in the last two years, match up well with the operating margins of the large, brand name apparel & footwear companies that we highlighted in the last section. It may be early to value brand name, but the company certainly has been delivering margins that put it in the brand name group.
The strong growth since 2020 provide a strong basis for why the company is planning its public offering now, but there is another factor that may explain the timing. In 2021, the family sold a majority stake in the firm to L. Catterton, an LVMH-backed private equity firm, at an estimated value in excess of €4 billion Euros. That deal was funded substantially with debt, leaving a debt overhang of close to €2 billion, in 2023; the prospectus states that all of of the company's proceeds from the offering will be used to pay down this debt. That said, the pricing for the offering has increased since news of it was first floated in July, with €6 billion plus pricing in initial reports increasing to €8 billion in early September and to €9.2 billion in the most recent news stories. The company has picked up anchor investors along the way, with the Norwegian sovereign fund planning to buy €300 million of the initial offering.
Birkenstock's Intangibles
Birkenstock is a good vehicle for identifying and valuing intangibles, since it has so many of them, with some more sustainable and more valuable than others:
Birkenstock Valuation
My Birkenstock valuation is built around an upbeat story of continued high growth and sustained operating margins, with the details below:
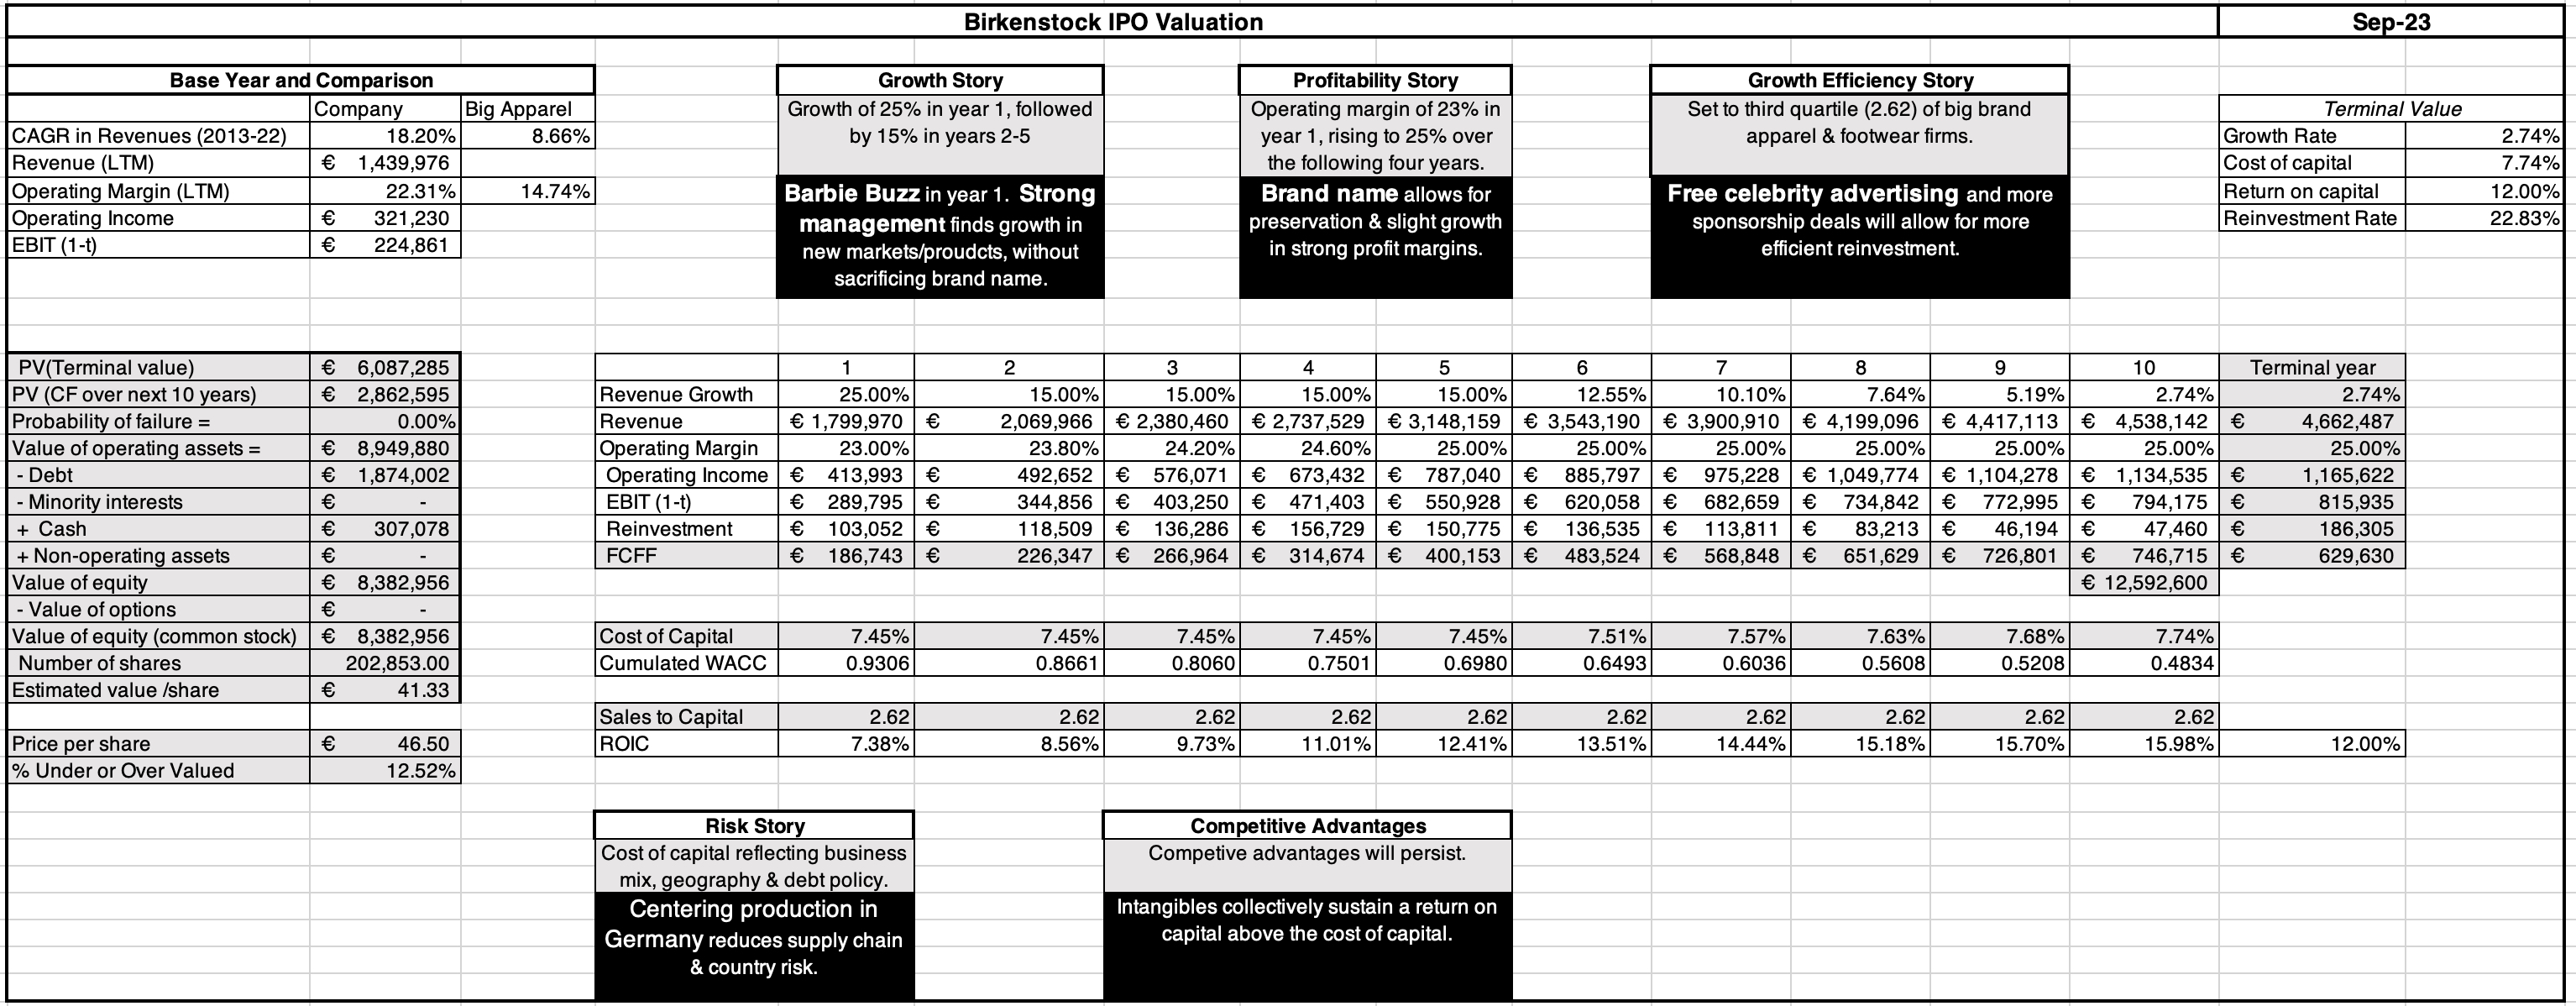 Download spreadsheet
The value that I estimate for Birkenstock, with my inputs on growth, profitability and risk, is about €8.38 billion, about 10% less than the rumored offering pricing, but still well within shouting distance of that number. In case you are tempted to use the company's many intangibles as the explanation for the difference, note that I have already incorporated them into my inputs and value. To make explicit that effect, I have isolated each intangible and its effect on value in the table below:

To value each intangible, I toggle the input that reflects the intangible on and off to determine how much it changes value. The intangible that has the biggest effect on value is brand name, followed by the strength of the management team, with the Barbie Buzz and Celebrity Effects lagging. Another way of visualizing how these intangibles play into value is to build up to estimated value of equity of €8.38 billion in pieces:
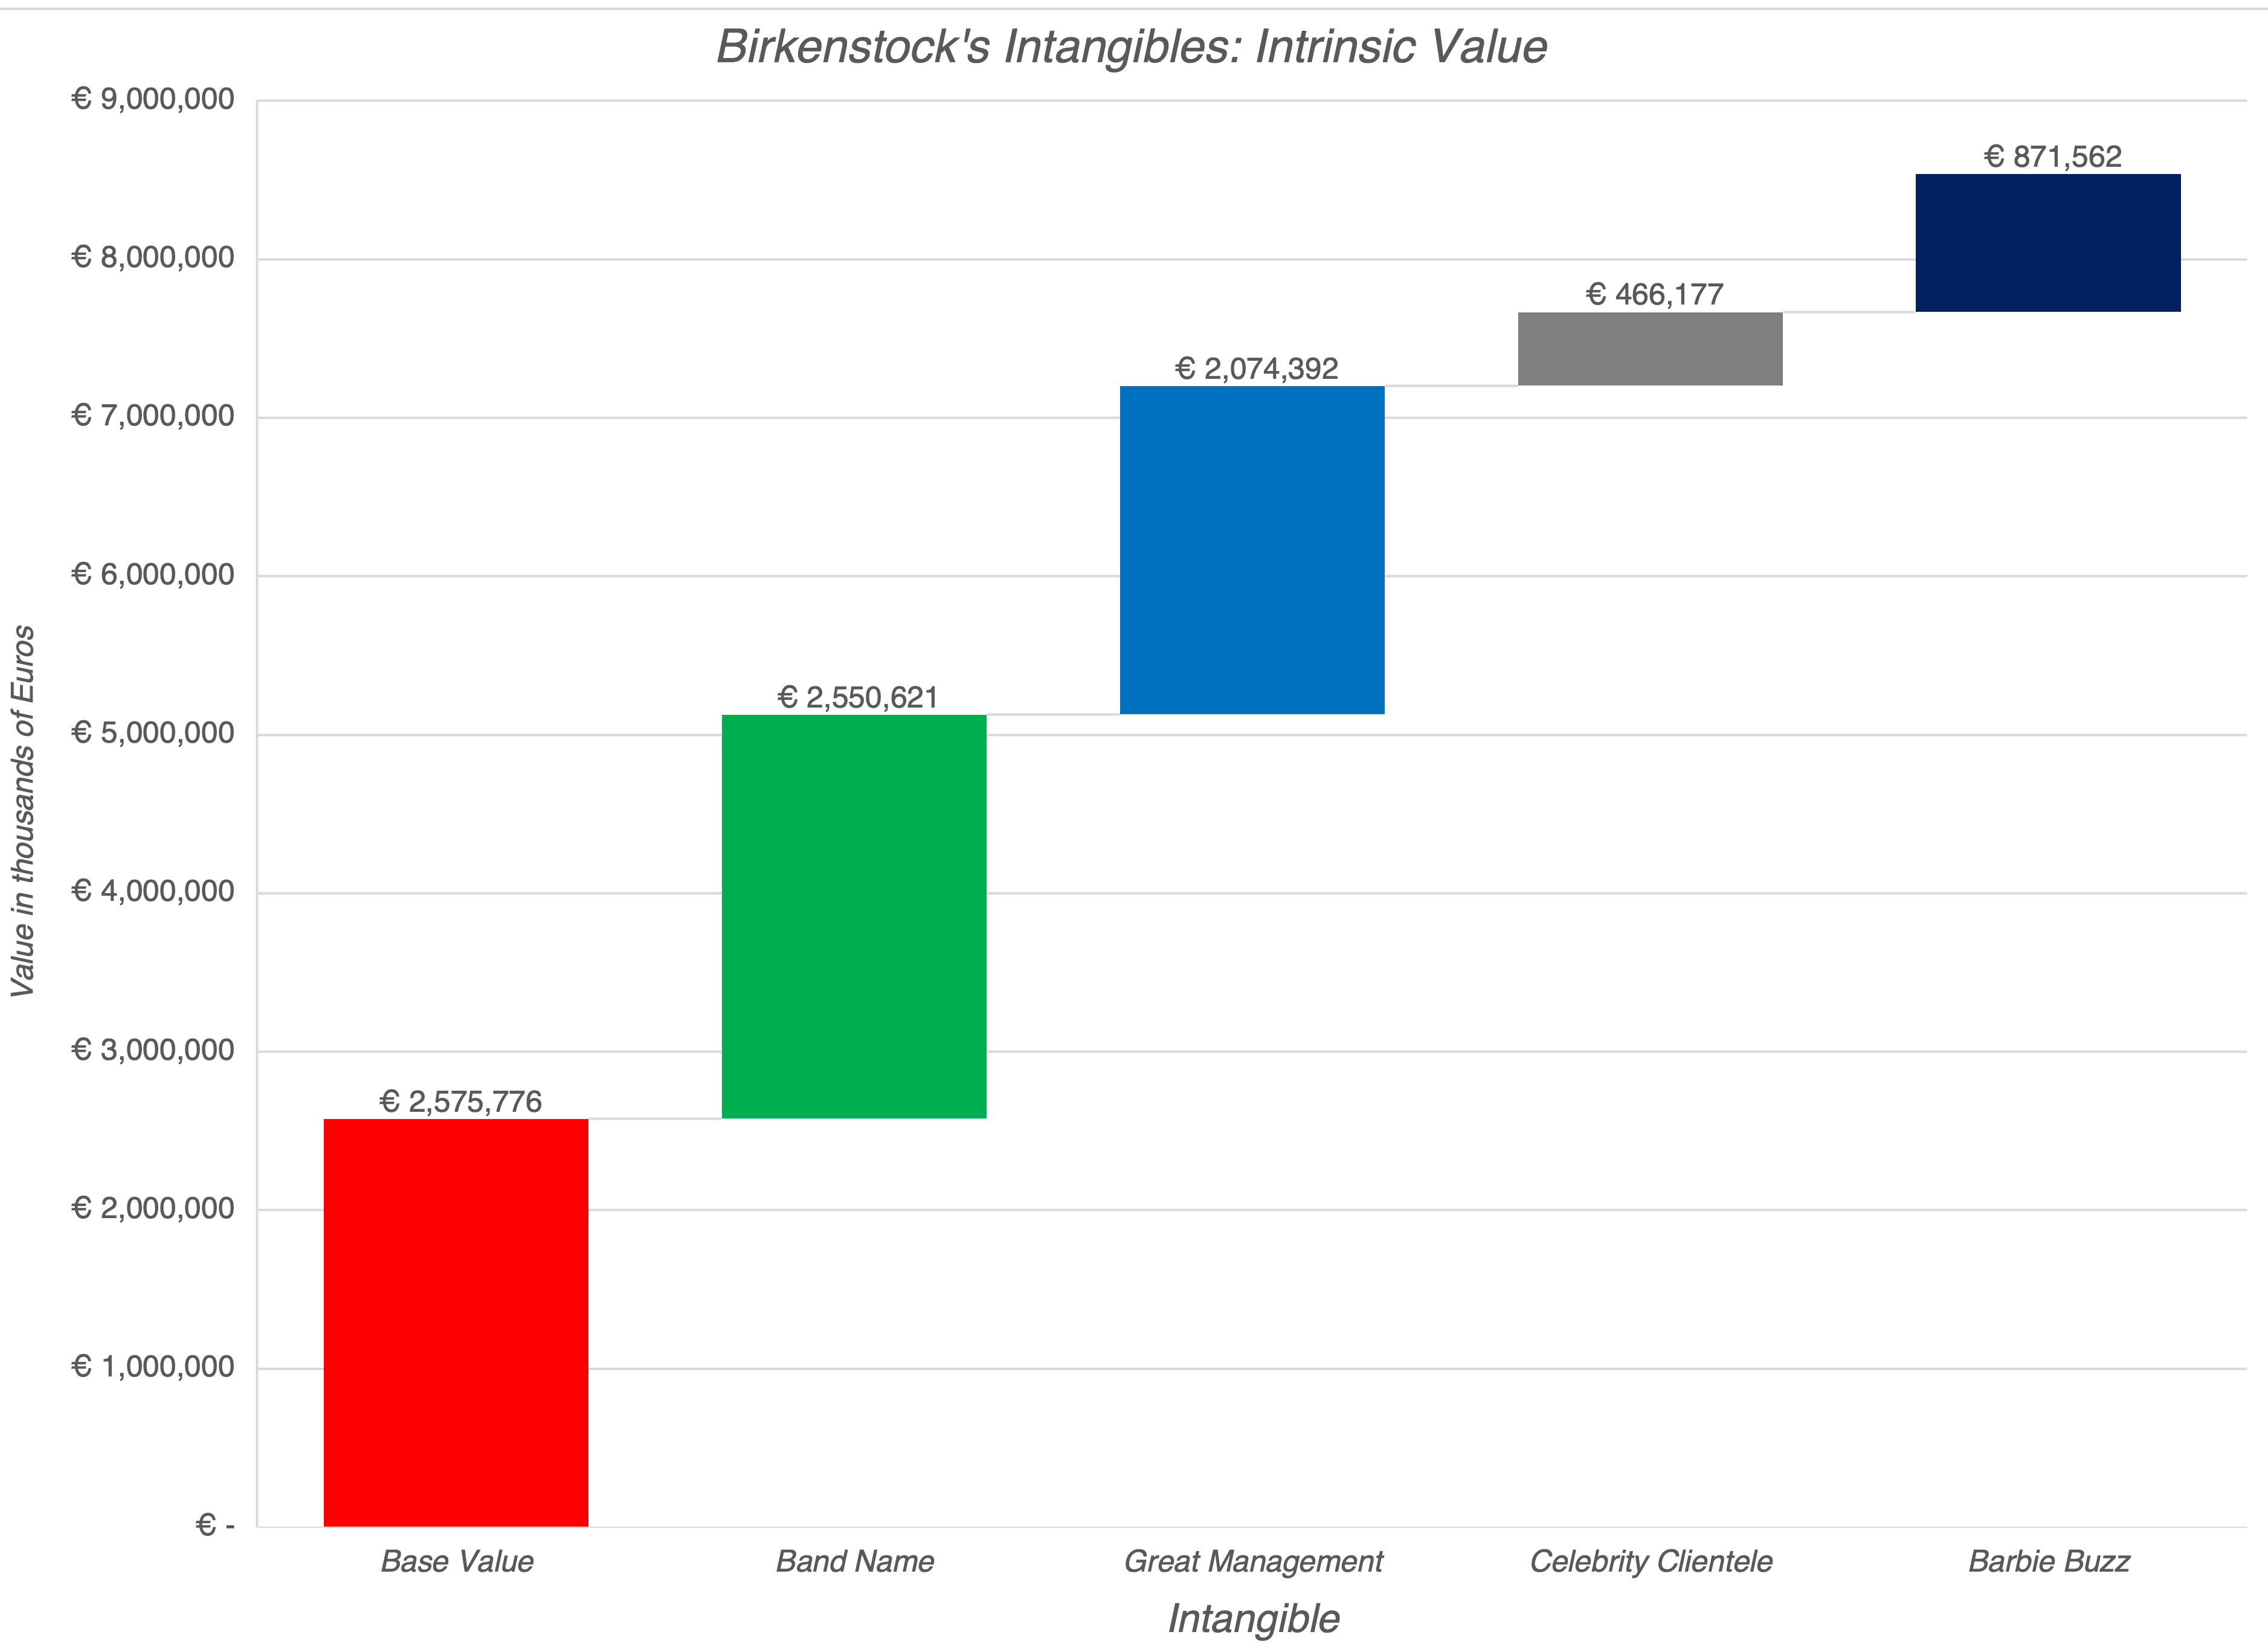
These value judgments are based upon my estimates, and they are, of course, open for debate. For instance, you might argue that the effect of good management on revenue growth is more or less than my estimate, or even that the effects spill over into other inputs (cost of capital, margins and reinvestment), but that is a healthy debate to have.
Pricing Factors
It is undeniable that the Birkenstock IPO will be priced, not valued, and the question of how the stock will do is just as much dependent, perhaps more so, on market mood and momentum, as it is on the fundamentals highlighted in the valuation.
Looking at news about the company, the timing works well, since the company is coming into the market on a wave of good publicity. Almost every news story that I have read about the company paints a positive picture of it, with laudatory mentions of Oliver Reichert and the company's products, intermixed with pictures of not only Barbie's pink Birkenstock but a host of other celebrities.It is the market mood that is working against the company, at least at the moment that I am writing this post (October 6, 2023). As I wrote in my post on bipolar markets just a few days ago, the market mood has soured, with the optimism that we had dodged the bullet that was so widely prevalent just a few weeks ago replaced with the pessimism that dark days lie ahead for the global economy and markets.At its offering pricing of €9.2 billion (€45 to €50 per share), the company and its bankers seem to be betting that the good vibes about the company will outweigh the bad vibes in the market, but that is gamble. As someone who has tried and rejected the Arizona sandal, I am unlikely to be a customer for Birkenstock footwear, but this is a company with a truly unique brand name and a management team that understands the delicate balance between utilizing a brand name well and overdoing it. It is, in my view, a reach at €45 or €50 per share, but if the market turns sour, and the stock drops to below €40, I would be a buyer.YouTube Video
AttachmentsBirkenstock Prospectus (October 4 filing)My valuation of Birkenstock with intangibles breakdown
October 4, 2023
Market Bipolarity: Exuberance versus Exhaustion!
As we enter the last quarter of 2023, it has been a roller coaster of a year. We started the year with significant uncertainty about whether the surge in inflation seen in 2022 would persist as well as about whether the economy was headed into a recession. In the first half of the year, we had positive surprises on both fronts, as inflation dropped after than expected and the economy stayed resilient, allowing for a comeback on stocks, which I wrote about in a post in July 2023. That recovery notwithstanding, uncertainties about inflation and the economy remained unresolved, and those uncertainties became part of the market story in the third quarter of 2023. In July and the first half of August of 2023, it looked like the market consensus was solidifying around a soft-landing story, with no recession and inflation under control, but that narrative developed cracks in the second half of the quarter, with markets giving back gains. In this post, I will look at how markets did during the third quarter of 2023, and use that performance as the basis for examining risk capital's presence (or absence) in markets.
The Markets in the Third Quarter
Coming off a year of rising rates in 2022, interest rates have continued to command center stage in 2023. While the rise in treasury rates has been less dramatic this year, rates have continued to rise across the term structure:
 US Treasury
While short term rates rose sharply in the first half of the year, and long term rates stabilized, the third quarter has sen a reversal, with short term rates now stabilizing and long term rates rising. At the start of October, the ten-year and thirty-year rates were both approaching 15-year highs, with the 10-year treasury at 4.59% and the 30-year treasury rate at 4.73%. As a consequence, the yield curve which has been downward sloping for all of the last year, became less so, which may have significance for those who view this metric as an impeccable predictor of recessions, but I am not one of those. Moving on to stocks, the strength that stocks exhibited in the first half of this year, continued for the first few weeks of the third quarter, with stocks peaking in mid-August, but giving back all of those gains and more in the last few weeks of the third quarter of 2023:

As you can see, it has been a divergent market, looking at performance during 2023. In spite of losing 3.65% of their value in the third quarter of 2023, large cap stocks are still ahead 12.13% for the year, but small cap stocks are now back to where they were at the start of 2023. The NASDAQ also gave back gains in the third quarter, but is up 27.27% for the year, but those gaudy numbers obscure a sobering reality. Seven companies (NVIDIA, Apple, Microsoft, Alphabet, Meta, Amazon and Tesla) account for $3.7 trillion of the increase in market cap in 2023, and removing them from the S&P 500 and NASDAQ removes much of the increase in value you see in both indices. Breaking global equities down by sector, and looking at the changes in 2023, both for the entire year as well as just the third quarter, we arrive at the following:

In keeping with our findings from contrasting the NASDAQ to other US indices, technology has been the best performing sector for 2023, followed by consumer discretionary and communication services. However, also in keeping with our findings on divergence across stocks, five of the eleven sectors have decreased in value in 2023, with real estate and utilities the worst performing sectors. Some of these differences across sectors reflect reversals from the damage done in 2022, but some of it is reflective of the disparate impact of inflation and higher rates across companies
Finally. I looked at global equities, broken down by region of the world, and in US dollars, to allow for direct comparison:

India is the only region of the world to post positive returns, in US dollar terms, in the third quarter, and is the best performing market of the year, running just ahead of the US; note again that of the $5.2 trillion increase in value US equities, the seven companies that we listed earlier accounted for $3.7 billion. Latin America had a brutal third quarter, and is the worst performing region in the world, for the year-to-date, followed by China. If you are an equity investor, your portfolio standing at this point of 2023 and your returns for the year will be largely determined by whether you had any money invested in the "soaring seven" stocks, as well as the sector and regional skews in your investments.
Price of Risk
The drop in stock and bond prices in the third quarter of 2023 can partly be attributed to rising interest rates, but how much of that drop is due to the price of risk changing? Put simply, higher risk premiums translate into lower asset prices, and it is conceivable that political and macroeconomic factors have contributed to more risk in markets. To answer this question, I started with the corporate bond market, where default spreads capture the price of risk, and looked at the movement of default spreads across ratings classes in 2023:

As you can see, bond default spreads, after surging in 2022, had a quiet third quarter, decreasing slightly across all ratings classes. Looking across the year to date, there has been little movement in the higher ratings classes, but default spreads have dropped substantially during2023, for lower rated bonds. In the equity market, I fall back on my estimates of implied equity risk premiums, which I report at the start of every month on my website, and you can see the path that these premiums have taken during the course of the last two years below:
 The equity risk premium declined in the first half of the year, from 5.94% on January 1, 2023, to 5.00% on July 1, 2023, but have been relatively stable in the third quarter, albeit on top of higher risk free rates. Thus, the equity risk premium of 4.84% on October 1, 2023, when added to the ten-year T.Bond rate of 4.58% on that day yields an expected return on equity of 9.42%, up from 8.81% on July 1, 2023. Put simply, notwithstanding the ups and downs in stock prices and interest rates in the third quarter of 2023, there is little evidence that changes in the pricing of risk had much to do with the volatility. Much of the change in stock and corporate bond prices in the third quarter has come from rising interest rates, not a heightened fear factor.
Risk Capital
In a post in the middle of 2022, I noted a dramatic shift in risk capital, i.e., the capital invested in the riskiest investments in every asset class - young, money-losing stocks in equities, high-yield bonds in the corporate bond market and seed capital, in venture capital. After a decade of excess, where risk capital was not just abundant, but overly so, risk capital retreated to the sidelines, creating ripple effects in private and public equity markets. In making that case, I drew on three metrics for measuring risk capital - the number of initial public offerings, the amount of venture capital investment and original issuances of high yield bonds, and I decided that it is time to revisit those metrics, to see if risk capital is finding its way back into markets.
With IPOs, there have been positive developments in recent weeks, with a few high-profile IPOs (Instacart, ARM and Klaviyo) hitting the market, suggesting a loosening up of risk capital. To get a broader perspective, though, I took a look a the number of IPOs, as well as proceeds raised, in 2023, with the intent of detecting shifts:
 The good news is that there has been some recovery from the last quarter of 2022, where there were almost no IPOs, but the bad news (for those in the IPO ecosystem) is that this is still a stilted recovery, with numbers well below what we observed for much of the last decade. In addition, it should be noted that the companies that have gone public in the last few weeks have had rough going, post-issuance, in spite of being priced conservatively (relative to what they would have been priced at two years ago). Turning to venture capital financing, we look at both the dollar value of venture capital investing, as well as the breakdown into angel, early stage and late stage funding:
 The drop off in venture capital investing that we saw in the second half of 2022 has clearly continued into 2023, with the second quarter funding down from the first. I have long argued that venture capital pricing is tied to IPO and young company pricing in public markets, and given that those are still languishing, venture capital is holding back. In short, if you are a venture capitalist or a company founder, battered by down rounds and withheld capital, the end is not in sight yet. Finally, companies that have ratings below investment grade need access to risk capital, to make original issuances of bonds. In the chart below, I look at corporate bond issuances in 2023:

The good news is that corporations are back to issuing bonds, perhaps recognizing that waiting for rates to come down is futile. However, the portion of these issuances that are high-yield bonds has stayed low for the last six quarters, suggesting that the market for these bonds is still sluggish. Looking across the risk capital metrics, notwithstanding the recovery we have seen in equities this year, it looks like risk capital is still on the side lines, perhaps because that recovery is concentrated in large and money-making companies. Until you start see stock market gains widen and include smaller, money-losing companies, it is unlikely that we will see bounce backs in the venture capital and high-yield bond markets. Even when that recovery comes, I believe that we will not return to the excesses of the last decade, and that is, in my view, a good development.
What now?
Entering the last quarter of 2023, it is striking how little the terrain has shifted over the last nine months. The two big uncertainties that I highlighted at the start of the year - whether inflation would persist or subside and whether there would be a recession - remain unresolved. If anything, the failed prognostications of economists and market gurus on both of these macro questions has left us with even less faith in their forecasts, and more adrift about what's coming down the pike. On the economy, the consensus view at the start of 2023 was that we were heading into a recession, with the only questions being when it would kick in, and how deep it would be. One reason for market outperformance this year has been the performance of the economy, which has managed to not only avoid a recession but also deliver strong employment numbers:

It is true that if you squint at this graph long enough, you may see signs of slowing down, but there are few indicators of a recession. This data may explain why economists have become more optimistic about the future, over the course of 2023, as can be seen in their estimates of the probability of a recession:

The economists polled in this survey have reduced their likelihood of a recession from more than 60% to about 40%, with the steepest drop off occurring in the last two months.
On inflation, we started the year with the consensus view that inflation would come down, but only because of economic weakness. The positive surprise for markets in 2023 is that inflation has come down, without a recession yet in sight:

The drop off in inflation in the first half of 2023 was steep, both in actual numbers (CPI and PPI) and in expectations (from surveys of consumers and the treasury market). While the third quarter saw of leveling off in those gains, it is clear that inflation has dropped over the course of the year, albeit to levels that still remain about Fed targets. If you are one of those who argued that inflation was transitory, this year is not a vindication, since prices, even if they level off, will be about 20% higher than they were two years ago. There is work to be done on the inflation front, and declaring premature victory can be dangerous.
Valuing Equities
In response to what this means for the market, I have to start with a confession, which is that I am not a market timer, making it very unlikely that I will find the market to be mis-valued by a large magnitude. In keeping with a practice that I have used before (see my start-of-the year and mid-year valuations), I valued the S&P 500, given current market interest rates and consensus estimates of earnings for the future:
 Download valuation spreadsheet
As you can see, with the 10-year treasury bond rate at 4.58% and the earnings estimates from analysts for 2023, 2024 and 2025, I estimate an intrinsic value of the index of 4147, about 3.4% below the actual index level of 4288, making it close to fairly valued. My assessment is a bit of a cop-out, since they are built on current interest rate levels and consensus earnings estimates. To the extent that your views about inflation and the economy diverge from that consensus can cause you to arrive at a different value. I have tried to capture four scenarios in the picture below, with a contrast to the market consensus scenario above, and computed intrinsic value under each one:

As you can see, your views on inflation (stubborn or subsides) and the economy (soft landing or recession) will lead you to very different estimates of intrinsic value, and judgments about under or over valuation. Since I am incapable of forecasting inflation and economic growth, I fall back on another tool in my arsenal, a Monte Carlo simulation, where I allow three key variables (risk free rate, equity risk premium, earnings in 2024 & 2025) to vary, and estimate the effect on index value:

The median value across 10,000 simulations is 4199. 2.1% below the index value of 4288, confirming my base case conclusion. If there is a concern here for equity investors, it is that there is more downside than upside, across the simulation, and that should be a factor in asset allocation decisions. It can also explain not only why there is reluctance on the part of investors to jump on the bandwagon, but also the presence of high-profile investors, short selling the entire equity market.
Conclusion As I was writing this post, I am reminded of one of my favorite movies, Groundhog Day , where Bill Murray is a weatherman who wakes up and relives the same day over and over again. We started the year, talking about inflation and a possible recession, and we keep returning to that conversation repeatedly. You may want to move on, but it is unlikely that either uncertainty will be resolved in the near future. In the meantime, the market will continue swinging between wild optimism (where inflation is no longer viewed as a threat and the economy has a soft landing) and extreme pessimism (where inflation comes back with a bang and the economy falls into a recession). The truth, as is often the case, will fall somewhere in the middle, but it will not be easy to find.
YouTube Video
SpreadsheetsIntrinsic Valuation of the S&P 500 Spreadsheet
September 19, 2023
Putting the (Insta)cart before the (Grocery) horse: A COVID Favorite's Reality Check!
After years of rumors of an imminent IPO, Instacart has finally filed for a public offering of it’s shares, aspiring to raise about $600 million from markets, at a pricing of about $9-$10 billion for its equity. Coming in the week after ARM, an AI chip designer, also filed to go public, but with an estimated pricing of $55-$60 billion, it is an indication of how much the ground has shifted under Instacart since the heady days of 2020, when Instacart was viewed by some Americans as the only thing that stood between them and starvation. At that time, there were some who were suggesting that the company could go public at $50 billion or more, and pricing it on that basis, but reality has caught up with both the company and investors, and this IPO represents vastly downgraded expectations for the company’s future.
The Back Story
To value Instacart, you have to start with an understanding of the business model that animates the company, as well the underlying business that it is intermediating. I start with this section with the Instacart business model, which is not complicated, but I will spend the rest of the section exploring the operating characteristics of the grocery business, and its online segment.
The Instacart Business Model
The Instacart business model extends online shopping, already common in other areas of retailing, into the grocery store space. That is not to say that there aren't logistical challenges, especially because grocery store carry thousands of items, and grocery shopping lists can run to dozens of these, with varying unit measures (by item, by weight) and substitution questions (when items are out of stock). Instacart operates as the intermediary between customers and grocery stores, where customers pick the grocery store that they would like to shop at and the items that they would like to buy at that store, and Instacart does the rest:

Instacart hires store shoppers who gather the items for the order, checking with the customer on substitutions, if needed, and for those customers who choose the pick-up option, have them ready for pick-up. If home delivery is chosen as the option, a driver (who, in many cases, is also the shopper) delivers the groceries to the customer's home. Customers get the time-savings and convenience from having grocery shopping (and delivery, if chosen) done for them, but they pay in the form on both delivery fees and a service charge of 5-10% of the bill, depending on the store picked and the number of items in the basket. Instacart also offers a subscription model, Instacart Express, where subscribers in return for paying a subscription fee (annual or monthly) get free deliveries from the service.
For grocery stores, Instacart is a mixed blessing. It does expand the customer base by bringing in those who could not or would not have shopped physically at the store, but stores often have to pay Instacart fulfillment fees, which they sometime pass through as higher prices on products. In addition, grocery stores lose direct relationships with customers as well as data on their shopping habits, which may be useful in making strategic and tactical decision on product mix and pricing.
I will approach the analysis of the Instacart model's capacity for growth and value creation in four steps. In the first, I will look at the grocery business, both in terms of growth and profitability of grocery stores, since Instacart, as an intermediary in the business, will be affected by grocery business fundamentals. In the second, I will examine the forces that are pushing consumers to online grocery shopping, and the ceiling for that growth is much lower than it is than in other areas of retailing. In the third, I will focus on how the competition to Instacart, within the online grocery retail space, is shaping up, and the consequences for its market share. In the final, I will examine the operating costs faced by Instacart, especially in the content of how the fee pie will be shared by the company with its shoppers and drivers.
1. The Grocery Business
When you are looking for an easy company to value, where you can safely extrapolate the past and not over indulge your imagination, you should try a grocery store. For decades, at least in the US and Europe, the grocery business has had a combination of low growth and low margins that, on the one hand, keep pricing in check and on the other, make the business an unlikely target for disruption. Let's start by looking at growth in aggregate revenues, across all grocery stores in the United States over the last three decades:
 You will notice that revenue growth rate has been anemic for most of the thirty years covered in this analysis, and that even the spurts in growth you have seen in 2020 and 2022 have specific reasons, unlikely to be sustainable, with the COVID shutdown explaining the 2020 jump, and inflation in food prices explaining the 2022 increase. On the profitability front, the grocery business operates on slim margins, at every level. The gross margin, measuring how much grocery stores clear after covering the costs of the goods sold, has risen slightly over time, perhaps because of growth in processed and packaged food sales, but is still less than 25%. The operating margin, which is after all operating expenses, and a more complete measure of operating profitability has been about 5% or less for almost the entire period.
 If you are an intermediary in a business with slim operating margins, as Instacart is, the low operating profitability of the grocery business will limit how much you can claim as a price for intermediation, in service fees. To complete the grocery business story, it is also worth looking at the players in the business, and it should come as little surprise that it is dominated by a few big names. The biggest is Walmart, which derives close to 56% of its $400 billion in total revenues in the US, from groceries, but Target and Amazon (through Whole Foods and Amazon Fresh) are also big players. Krogers and Albertsons have emerged as the grocery store giants, by consolidating smaller grocery companies across the country:
The fact that the grocery business is dominated by a few big names will also play a role in the Instacart valuation story, by affecting the bargaining power that Instacart has, in negotiating for its share of the grocery pie. In sum, the overall grocery pie is growing slowly, and the slice of the pie that is profit for those in the grocery game is slim, effectively limiting the valuation stories (and values) for every player in that game.
2. The Online Option
Grocery shopping is different from other shopping, for many reasons. First, customers tend to favor a specific grocery store (or at most, a couple of stores) for most of their grocery needs. One reason for that is familiarity with store layout, since knowing where to find the items that you are looking for can make the difference between a 20-minute trip to the store and a hour-long slog. Another is location, with customers tending to shop at neighborhood stores, for much of their needs, since groceries do not do well with long transportation times. Second, for non-processed food, especially meats and produce, being able to see and sometimes touch items before you buy them is part of the shopping experience, with online pictures of the same products operating as poor substitute. For these reasons, grocery retail remained almost immune from the disruption wrought on the rest of brick-and-mortar retail, at least in the United States. Even so, there has always been always a segment of the population that has been open to online grocery shopping, sometimes because of physical constraints (homebound or unable to drive) and sometimes because of time and convenience (busy work and family schedules). That segment was viewed as a niche market, and until 2020, conventional players in the grocery business did not pay much attention to it, with the exception of Amazon. It was the COVID shutdown in 2020 that changed the dynamics, as online grocery shopping became not just an option, but sometimes the only option, for some.

As a company that was built exclusively for this purpose, Instacart had a first-move advantage and saw customers, order and revenues all soar during the year. Caught up in the mood of the moment, it is easy to see why so many extrapolated Instacart’s success in 2020 into the future, forecasting that the shift to online grocery shopping would be permanent, and that Instacart would dominate that business.
As COVID has eased, though, many of those who shopped for groceries online have returned to physical shopping, but it is undeniable that there are some who have decided that the convenience of online shopping exceeds any disadvantages, and have continued with that practice. In fact, while there is uncertainty on this front, the projection is that the percent of grocery shopping that will be done online will increase over time:

There are two points worth making about the trend towards online shopping. The first is that the ceiling on online grocery retail will remain much lower than the ceiling on online shopping in other areas in retail, with even optimists capping the share at 20%. In short, the growth in online grocery sales will be higher than total grocery sales growth, but not overwhelmingly so. The second is that while some have persisted with online grocery shopping after 2020, it is less in deliveries and more in pick-ups, which will have implications for the market shares of competitors in the space.
3. The Competition
In the first few months of the COVID shutdown, Instacart was dominant, partly because its platform was designed for online shopping, and partly because in a grocery market, where many stores were out of stock, it offered shopping choices to shoppers. That dominance, though, was short lived, since the grocers woke up quickly, and started offering online shopping services to their customer, with the tilt towards pick-up over delivery. The cost savings to customers was significant, since most grocery stores dispensed with service fees and used employees as shoppers, for their online customers. In the aftermath of COVID, the grocery stores have cemented their dominance of online grocery market, as can be seen in the market shares of the biggest online grocery retailers:

Walmart and Amazon are the two largest players in the online grocery market, and Instacart, while it has lost market share since 2020, is firmly in third place. Kroger's and Albertsons, the two largest grocery story chains, have also improved their standing. Instacart, as the only pure intermediary in this group, allows customers access to multiple grocery store options, and more choices when it comes to delivery, but even one that front, it is starting to face competition from Uber Eats, DoorDash and GrubHub. In short, Instacart will be lucky to hold on to its existing market share, even if it plays its cards right, leaving its growth at or below the growth in the overall online grocery shopping market. On a personal note, and it qualifies purely as anecdotal evidence, we (in my household) have not used Instacart since the peak COVID days of 2020, as we have returned to physical grocery shopping for products where it matters, while preserving online shopping for products which are staples, but only for pick up, rather than delivery. Since we shop at Ralph's, a Kroger subsidiary, we use their online shopping app, since it costless, matches in-store discounts and comes with a Ralph employee as a shopper, that is familiar with what we usually buy. I know that there are others who have stayed with Instacart, perhaps because of the grocery store choices it offers or because of its delivery options, but we have little interest in either, and perhaps are closer to the norm than the exception.
4. Operating Economics
The revenues that Instacart collects from customers, either in service fees or in subscription revenues have multiple costs to cover. By far, the biggest is the cost that the company faces in hiring and paying thousands of shoppers and drivers to operate its system. Like ride-sharing companies, the question of how Instacart categorizes these workers, and the resulting costs, will determine what it will be able to generate as operating profits:
As a company built around a technology platform, Instacart also has significant spending on R&D, as well as on customer support services. In many ways, the operating expense issues that Instacart faces parallel the issues that Uber and Lyft have faced in the last few years, and I do believe that, over time, Instacart will have no choice but to deal with their shoppers as employees, with the accompanying costs.
The Instacart IPO
To value Instacart ahead of its IPO, I will start with a look at the prospectus filed by the company, which will give me a chance to unload on my pet peeves about how these disclosures have evolved over time, then look at the operating history and unit economics at the company, before settling in on a valuation story (and valuation) of the company.
Prospectus Pet Peeves
About two years ago, I wrote a post on what I called the disclosure dilemma, where the more companies disclose, the less informative these disclosures become. As part of the post, I talked about trends in IPO prospectuses over time, and the Instacart prospectus gives me a chance to revisit some of those trends that I highlighted.
Disclosure Diarrhea: Apple and Microsoft, when they filed for their initial public offerings in the 1980s, had prospectuses that were less than 100 pages apiece; Apple weighed in at 73 pages and Microsoft had only 52. In 1997, when Amazon filed for a public offering, its prospectus was 47 pages long. I noted that prospectuses have become more and more bulky over time, with Airbnb's 2020 listing including a prospectus that was 350 pages long. With appendices, Instacart's prospectus stretches on to 416 pages.“Tech” and AI: In common with many other companies that have gone public in the last decade, Instacart is quick to label itself a technology company, when the truth is that it is a grocery delivery company that uses technology to smooth the ride. In keeping with the times, the prospectus mentions AI multiple times, I counted 32 mentions of AI in the prospectus, and I remain skeptical that AI will (or should) alter grocery shopping in fundamental ways.Adjusted EBITDA: I have written about the absolute foolishness of adding back stock-based compensation to get to adjusted earnings, noting that stock-based compensation is not a neutral non-cash expense (like depreciation) but one that an expense-in-kind, where you give away quite in your company to employees, either as options or as restricted stock. Needless to say, Instacart plows right ahead and not only adds back stock-based compensation but makes a host of other adjustments (see page 126 of prospectus). Since Instacart makes money without these adjustments, they only draw attention away from that good news.Share count shenanigans: On page 19 of the prospectus, Instacart headlines that its share count will be 279.33 million shares, if the underwriters exercise their options, but two pages later (on page 21) the company discloses that it does not count restricted stock units, which are shares in existence that still have restrictions on trading or waiting to be vested, options and shares issuable on conversion of preferred shares. Adding these exception together, you get an ignored share count of 43.62 million, which brings the total share count to 322.94 million shares.To give the company credit on useful disclosures, the company has followed the lead of other user-based companies in providing a cohort table (see page 111) on platform users (tracing how usage changes as users stay on the platform) and on unit economics (the size of an order, with the costs of filling it), but that good disclosure is hidden behind layers of flab.An Operating History
For young companies, you learn less by browsing through financial history than with much more mature companies, but it in instructive to look at the pathway that Instacart has taken to arrive at its current position. For close to seven years after its founding in 2012, Instacart struggled to find its footing with customers, as relatively few were willing to jump on the online grocery shopping bandwagon. Coming into 2020, the company had about 50 million subscribers and $215 million in revenues, and the $5.1 billion that customers spent on groceries on its platform was a tiny fraction of the $800 billion US grocery market. In a turn of fortune that I am sure that even Instacart did not see coming, the COVID shutdown changed the shopping dynamics. As homebound customers desperately looked for options to shop for and get groceries delivered at home, Instacart stepped into the fray, allowing user numbers, the value of gross transactions (GTV) and revenues to quadruple in 2020.
 It is undeniable that Instacart, like Zoom and Peloton, was a COVID winner, but like those companies, it has struggled to build on those winnings and deliver on the resulting unrealistic expectations. The good news for Instacart is that many of the customers who joined its platform at the height of COVID have stayed on, but the bad news is that growth has leveled off in the years since, and especially so leading into the initial public offering. As subscribers and grocery sales on the Instacart platform grew between 2019 and 2023, its business model has also been taking form, turning from losses to a measure of profitability in the twelve months leading into the offering:
 Instacart ProspectusNote again, though, that the bulk of the improvement in operating metrics occurred in 2020, and while the numbers have continued to improve since 2020, the change has been marginal. To understand the drivers of Instacart’s profitability over time, let us break down its components:Take Rate: When an grocery order is placed on the Instacart platform, the service fees that Instacart collects represent its revenues from transactions, and the take rate measures these revenues as a percentage of the transaction value. Instacart's take rate has improved over time, doubling from 2.86% in 2019 to 5.70% in 2020, before leveling off in 2021 and 2022, and then increasing again to 7.49% in the last twelve months of 2023.
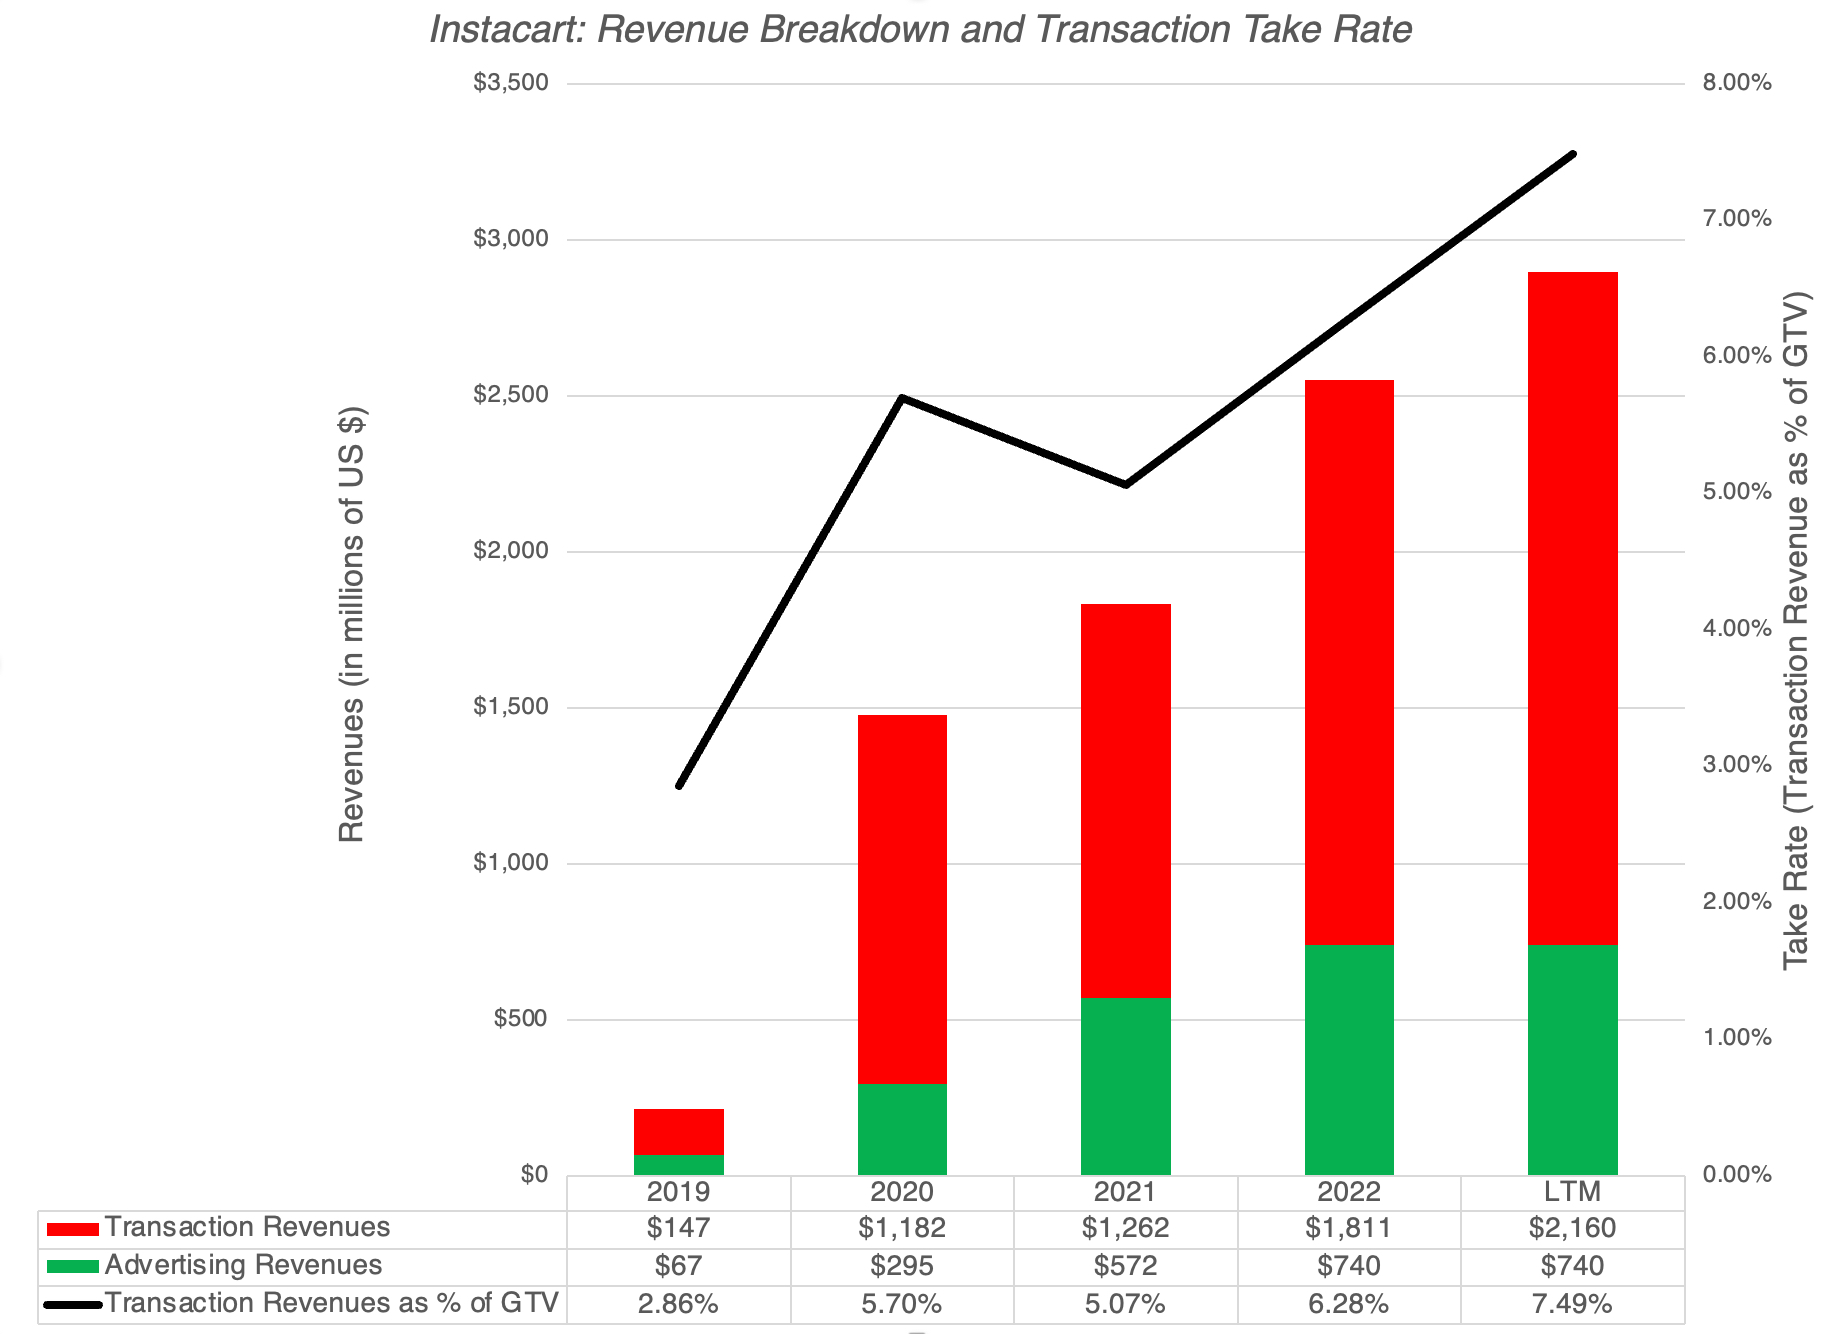
Just to provide a contrast, Airbnb and Doordash, two other companies in the intermediary business have much higher take rates at 14% and 11.79% respectively. Much of that difference, though, is unbridgeable for a simple reason: the grocery business has significantly lower operating margins (at 5%) than the hospitality (15% in 2022) or restaurant businesses (16% in 2022). Put simply, Instacart's take rate will be lower, even with full economies of scale at play, that its counterparts in businesses with more profit buffer.Operating expenses: The revenues that Instacart collects, from transactions and advertising, are used to cover its operating expenses, which are broken down into three categories: cost of goods sold, operations and support and G&A:

There are economies of scale that kicked in, in 2020, and the good news is that those economies o scales continued to benefit the company in 2021 and 2022, as all three categories of expense decreased, as a percent of sales. Customer Acquisition and Reinvestment: Growth comes with reinvestment, and in the case of Instacart, as with many other tech companies, that reinvestment is embedded in its operating expenses (instead of capital expenses), since their two biggest capital expenditures are the costs of acquiring new subscribers (shown as part of sales and marketing) and investments in technology/platform (shown as R&D).

Looking at the customer acquisition (selling) costs alone, there is evidence that these costs, in dollar terms and as a percent of revenues, after the steep drop off in 2020, are rising over time, indicating that there are more competitors for new online grocery shoppers. If you add to that the same trend in R&D spending, it does look like the company is working harder and spending more to deliver growth after the COVID boost in 2020.Unit Economics: With transaction-based businesses, like Instacart, understanding how the unit economies (on individual orders and platform users) are evolving over time can be useful in forecasting the future. Looking across Instacart's entire history, the typical order size has remained remarkably stable, at around $100, with the spurt in 2020 being the exception.
 Instacart Prospectus
On an inflation-adjusted basis, especially in 2021 and 2022, the average order size has decreased over time. That, by itself, may not be a problem, if Instacart customers are ordering more often, especially as they stay on the platform for longer, and to answer this, I look at Instacart's estimates of revenues, by cohort class:
 Instacart Prospectus
The good news is that customers who joined the platform in 2017, 2018, 2019 and 2021 spend more on the platform, the longer they are on it. The bad news is that customers in joined in 2020, Instacart's biggest year of growth in users, are spending less on the platform in 2021 and 2022, indicating that some of the COVID gains are slipping away. That should not be surprising, since many customers who used Instacart in 2020 did so only because they had no alternatives, and once the shutdown ended, returned to old habits.
As the company has struggled, coming off its COVID high, there has been turnover in its management ranks. Apoorva Mehta, who founded the company and oversaw its COVID growth, stepped down as CEO of the company in 2022, and was replaced with Fido Simo, a Facebook executive, with the impetus for the change rumored to have come from Sequoia, the biggest single stockholder in the company. Before you instinctively jump to the defense of founders, like Mr. Mehta, it is worth noting that he owned only 10% of the outstanding shares in the company in 2022. In short, scaling up and high growth often require large capital infusions, and a side cost almost always will be a reduction in founder control of the company.
The Valuation Story & Intrinsic Value
With that long lead-in, I have the basis for my Instacart story, and it reflects both the good and bad news in the company's operating history.
 My Instacart Valuation
With my story and inputs, the value per share that I get for Instacart is about $29, close to the offer price being floated of $30 per share.
There is, of course, the very real possibility that I could be wrong on my estimates (in either direction) of key inputs: the growth in GTV, the take rate, the operating margin and the cost of capital, and to account for this uncertainty, I fall back on a simulation:

As you can see, at the offer price of $30/share, the company is priced close to its median value, and the distribution of values suggests that there is less upside in this company than in some of the other growth companies I have valued in recent years.
The Offering
Instacart was expected to hit the market on September 19, and the reception that it gets may tell us as much about the market, as it does about the company. In my posts on the market, starting mid-year last year and extending into this one, I noted that risk capital had retreated o the sidelines, and one of the statistics that I used was the number of IPOs hitting the market. After hitting an all-time high in 2021, the IPO market has frozen, and the ARM, Instacart and Birkenstock IPOs hitting the market in September may be a sign of a thaw. That sign will become stronger, if the offerings are well received and there is a price pop on the offering.
Pricing versus Investing
I have long argued that IPOs are priced, not valued, notwithstanding the lip service that everyone involved in the process, including VCs, founders and bankers, pays to valuation, The difference between valuing and pricing is that while the former requires that you grapple with business questions on growth, profitability and reinvestment, the latter is based on how much investors are paying for peer group companies, a subjective judgment, but one made nevertheless. In keeping with this theme, I compared the proposed pricing for Instacart against the pricing of its peer group. That peer group is not other grocery companies, since the Instacart model is very different, but other intermediary companies like Airbnb and Doordash, which like Instacart, take a slice of transaction revenues in the markets they serve, and try to keep costs under control:

While Instacart looks cheap, relative to Doordash and Airbnb, this pricing is an illustration of the limits of the approach. Instacart trades at a much lower multiple of revenues, because its take rate (as a percent of gross transaction value) is much lower than the slices that Doordash and Airbnb keep. Airbnb keeps 14% of gross transaction value, Doordash keeps more than 11.79%, but Instacart keeps only 7.5%, if advertising revenues are excluded. Instacart and Doordash both trade at lower multiples of revenues than Airbnb, but that is because Airbnb has higher expected growth and higher operating margins in steady state.
Previewing the Offering
Since pricing is about mood and momentum, it is worth looking at the ARM IPO offering on September 14, which saw the company's stock price, which was offered at $51, open for trading at $56.10 and close the dat at $63.59. If that mood spills over into this week, I expect Instacart's IPO to pop on its opening day as well, especially given the fact that the offering price seems to reflect a relatively conservative outlook for the company, and the pricing looks favorable. Even if it does not, I don't see much benefit to buying the stock at the offering price, not only because it looks fairly valued, but also because I don't see enough of an upside, even if things work out in the company's favor.
The question of what the market will do became moot, even as I was finishing this post, the stock started trading(September 19), and popped to $42 per share, before giving back some of its gains to settle at about $38 per share. At those prices, you would need more upbeat assumptions about online grocery growth and take rates than I am willing to make, but with this market, who knows? The stock may be trading at a discount on value, a week from now.
The VC Game
In the last decade, we have raised venture capital to "great investor" status, driven by stories of investments that have paid off in huge returns. In fact, good venture capitalists are often viewed as shrewd assessors of business potential, capable of separating the wheat from the chaff, when it comes to start-ups. That is true for some of them, but I believe that venture capital is a pricing game, with little heed paid to value, and that the most successful venture capitalists share more traits with great traders, than with great investors. Not only are the best venture capitalists good at pricing the businesses they invest in, honing in on to the traits that are being priced in (users, subscribers, downloads etc.), but are just as good at making sure that these business scale up these traits. Their success comes from timing skills, entering a business at the right time and just as critically, exiting before the momentum shifts.
Instacart's multiple venture capital rounds illustrates this process well, and you can see the pricing of the company at each round below:

The earliest providers of capital to the company will walk away with substantial profits, even if the company's market cap ends up at $9 - $9.5 billion, as indicated by the offering price. The seed capital providers (Khosla, Canaan and Y Combinator) will have earned at 55% compounded annual return on their investment, at the IPO offering price, well in excess of the S&P 500 annual return of 13.04% over the same period. Every subsequent round earns a lower annual return, and all investments in Instacart made after 2015 have underperformed the S&P 500 significantly, and the NASDAQ by even more. The biggest losers in this capital game have been those who provided capital in 2020 and 2021, when COVID pushed up both capital needs and company pricing to new highs. The Series I investment in 2021, when the company was priced at $39 billion,will see markdowns in excess of 60%. While there is no redeeming grace for Fidelity and T. Rowe Price, it is true that Sequoia also invested earlier in the company, and will walk away with substantial returns on its total investment. Thus, the write down that Sequoia takes for its $300 million investment in 2021 will be more than offset by the gains it made on the $21 million that it invested in the company in 2013 and 2014.
The notion that there is smart money, i.e., that there is an investor group that is somehow wiser, more informed and less likely to act emotionally than the rest of us, and that it earns higher returns than the rest of us, is deeply held. In my view, it is a mirage, since every group that is anointed as smart money ultimately ends up looking average (in terms of behavior and returns), when all is said and done. It happened to mutual fund managers decades ago, and it has happened to hedge funds and private equity over the last two decades. For those who are holding on to the belief that venture capitalists are the last bastion of smart money, it is time to let go. While there are a few exceptions, venture capitalists for the most part are traders on steroids, riding the momentum train, and being ridden over by it, when it turns.
YouTube Video
Instacart files
Instacart ProspectusMy Instacart ValuationSeptember 11, 2023
A Business Upended: Streaming disrupts the Entertainment Business!
It has been an unsettling summer for anyone with a stake in the movie, television and broadcasting businesses. The strike by screen actors and writers which started in July is now into almost into its third month, with no end in sight, putting at risk the pipeline of movies and shows that were expected to hit theaters and streaming platforms in the next few months. On August 31, Disney pulled its television channels from Spectrum (owned by Charter, the second largest cable company in the US, after Comcast) after a dispute about payments for carrying these channels. Tennis fans, getting ready to watch the US Open on ESPN, were apoplectic, as their televisions went blank in the middle of matches, and Disney, in addition to encouraging them to complain to Spectrum, offered them an option of switching to Hulu+ Live TV, a streaming service alternative to cable. While actors and writers have been on strike before, and contractual disputes between content makers and cable providers is par for the course, the news stories of this summer seem more consequential, perhaps because they reflect longer time shifts in the movie and broadcasting businesses.
Speaking of Disney, a company that has found itself in the crosshairs of political and cultural disputes, the stock hit $80 on September 7, close to a ten-year low. To add to the angst, the threat of artificial intelligence (AI) overhangs almost every aspect of the business, and is one of the contested issues in the strike. The recent troubles in entertainment, though, reflect a longer term disruption that has occurred in the business, with the rise of streaming as an alternative to the traditional platforms for movies and television shows. In this post, I will focus on how streaming has not only changed the way we consume content, but has also modified the way that content gets made. In the process, it has altered the financial characteristics of the companies in the business in ways that the market is still trying to come to terms with, which may explain the market turmoil this year.
A Cautionary Tale: The Music Business and Streaming
If, as you watch the broadcasting business go through its struggles with streamers, you get a sense of deja vu, it is because the music business in the 1990s found itself similarly challenged, and its upending by streaming may offer lessons for the movie business. In the twentieth century, the music business followed a well-honed script. It was composed of companies which scouted for music talent, signed these musicians to music label contracts and then worked with them in their studios to produce record albums that were sold in music stores across the country. The music companies provided marketing support, seeking out radio stations that would carry their music, and distributional backing to get albums to retailers. In many ways, it was impossible for a musician to break through, without studio backing, and that power imbalance allowed the latter to claim the lion’s share of the revenues.
The disruptor who upset the music business was Napster, a platform that delivered pirated streams of music to its customers, effectively undercutting the need to go into music stores and buy expensive albums. While Napster downloads left much to be desired in terms of audio quality, and the company walked to (and often beyond) the very edge of legality, it exposed the weaknesses in the music business, from how new artists were found and marketed, to how their music was packaged and finally, how that music was sold. When the music companies of the day were able to shut Napster down in 2001, citing digital piracy, they were undoubtedly relieved, but their weaknesses had been exposed. Apple created the iTunes Store in 2001, allowing customers to buy individual songs, rather than entire albums, and the unbundling of the music business began. In the years that followed, music albums and music retailers became rarer, and the advent of the internet allowed musicians to bypass the gatekeepers at the music studios and go directly to customers. As smart phones and personal devices became more plentiful, Spotify and Pandora introduced the music streaming model, and the game was forever changed, and the consequences for the music business have been staggering:
The music business shrank and the center of gravity shifted: The entry of streaming companies changed the economics of music, since it largely removed the need to buy music, even in the single-song format. Spotifyand Pandora allowed subscribers access to immense music libraries, with high audio quality, and as they grew, revenues to existing music labels dropped:
As you can see, music revenues shifted (unsurprisingly) from studios to music streaming, but in a more troubling sign, the aggregate revenues of the music business dropped by almost 40% between 2000 and 2016. On a more optimistic note, the revenues are now back to pre-2000 levels, albeit not on inflation-adjusted basis, and 65% of all revenues in 2021 came from streaming. It is undeniable that streaming, by removing many of the intermediaries in the old music business model, has shrunk the business.The status quo crumbled: As revenues shrunk, and moved from the studios to the streamers, the companies that represented the status quo imploded. The music studio business, which had a dozen or more active players in the last century, has consolidated into a handful of firms, most of which are small parts of much bigger entertainment companies (Sony. Vivendi), and many of the biggest labels in music (Abbey Roads, Motown) are historical artifacts that have sold their music rights to others. The music retail business was decimated, as music retailers like Tower Records shut down, and as artists looking to replace lost revenues from record sales with live performances and merchandising sales, companies like LiveNation stepped in to fill the need. The divergence in musician take became larger: As revenues shrunk and partially recovered, not all musicians have shared in the new pie equally. The top one percent of musicians account for ninety percent of all music streams and close to sixty percent of revenues from concerts. A business that has always been top heavy in terms of rewarding success, has become even more so.Personalities became bigger than music labels: The advent of social media has allowed the highest profile performers to break free of most of the intermediaries in the music business. When you are Beyonce, and you have 15.3 million followers on Twitter and 317 million followers in Instagram, you have more reach and persuasive powers than any music company on the face of the earth. While it is true that social media has allowed a few musicians to break through and become successes, I think it is undeniable that social media is exacerbating the differences between big name musicians and unknowns more than it is helping close the gap.You could see these the last two phenomena at play, this year, in the Taylor Swift Eras Tour, where Taylor has effectively cut out most of the middlemen in the concert business and laid direct claim to the hundreds of millions of dollars in revenues from the tour. As movie and broadcast business executives look over their shoulders at what streaming has in store for them, a few of them are undoubtedly looking at the implosion of the music business and wondering whether a similar fate awaits them. The more optimistic among them will point to differences between the music and movie businesses that will make the latter more resilient, but the more pessimistic will note the similarities. To put it in more existential terms, if the movie business resembles the music business in how it responds to streaming, there is a boatload of pain that is coming for the status quo, with the key difference being that a meltdown similar to the one seen in music will wipe out hundreds of billions of dollars in value, rather than the tens of billions in the music business.
Movie and Broadcasting - The Twentieth Century Lead In
The movie business had its beginnings in the early 1900s, when the first movies were made and Hollywood became the destination of choice for movie makers, at least in the United States. In the years after, the great movie studios had their beginnings, with the precursor to Paramount being created by Cecil B. DeMille and others in 1915, followed soon by Metro Goldwyn Mayer (MGM), RKO, 20th Century Fox and Warner Bros (creating the Big Five), as well as by smaller players (Universal, United, Columbia), . In the golden age (at least for the studios), these five studios controlled almost every aspect of the movies, including content, distribution and exhibition, with movie actors effectively owned and controlled by the studios that discovered them. It took the US Supreme Court and use of the anti-trust law, in 1948, to first force studios out of the movie theater ownership business, and then to release movie stars from their bondage, and in the process, it ended the Studio Age.
Forced to divest themselves of movie theaters and of their control of movie stars, the studios were able to offset the negatives with the positives from new technologies (Technicolor, stereo sound) and an almost unchallenged claim on American leisure time, with close to two-thirds of Americans going to the movies at least once a week in the 1950s. In the 1970s, Hollywood discovered the payoff from blockbuster movies, and the movie business became increasingly dependent on the biggest blockbusters delivering enough revenues and profits to cover a whole host of movies that either lost money or broke even. While Jaws and the first three Star Wars movies (A New Hope, The Empire Strikes Back, The Return of the Jedi) were not the first mega-hits in history, they accelerated the trend towards the blockbuster phenomenon that continues through today. In the 1980s, the birth of video players created ways for studios to supplement revenues at movie theaters with revenues from selling videos and DVDs, while opening the door to illegal copying and piracy.
Through this period, the big studios still controlled a large share of the content business, but independent studies, often more daring in choice of topics and settings, took a share. That said, the movie business remained concentrated, with the biggest players dominating each segment of the business.

That movie business was built around box office receipts at movie theaters, split between the movie makers and the theater owners. The latter were capital intensive, since they occupied valuable real estate, owned or leased by the theater companies. Though the theater-owners were nominally independent, studios retained significant bargaining power with these exhibitors and the sharing of supplemental revenues.
The broadcasting business lagged the movie business, in terms of development, because televisions did not start making their way into households in sufficient numbers until the 1950s, but it too was built around a system of content-production, distribution and exhibition, but with advertising at the heart of its revenue generation. The dominance of the three big networks (ABC, CBS and NBC) in television viewing meant that television shows had to reach the broadest possible audiences to be successful, and television show success was measured with (Nielsen) ratings, measuring how much they were watched, and an entire business was built around these measurements. That business was disrupted in the 1970s and 1980s with the arrival of cable television, and cable's capacity to carry hundreds of channels, some of which catered to niche markets, shaking the major network hold on viewers and changing content again. At the start of 2010, it was estimated that close to 75% of all US households received their television through a cable or satellite provider, setting the stage for the next big disruption in the business.
Movie and Broadcasting: The Streaming Era
Netflix, which is now synonymous with the streaming threat to movies, started its life as a video rental company, more of a threat to Blockbuster video, the lead player in that business, than to any of the larger players in the content business. It is worth remembering that Netflix entree into the business was initially on the US postal system, with the innovation being that you could have the videos you wanted to watch mailed to you, instead of going into a video rental store. As the capacity of the internet to send large files improved, Netflix shifted to digital distribution, albeit with angst on the part of some existing customers, but it still relied entirely on rented content (from the traditional studios). It was in response to being squeezed by the studios on payments for this content that Netflix decided to try its hand at original content, with House of Cards and Orange is the new Black representing their first major forays, and set in sequence the events that have led us to where we stand today.
The Netflix Disruption
The rise of Netflix as a streaming giant has been meteoric, and it can be seen both in the growth in subscribers and revenues at the company, especially in the last decade.
 Embedded in these numbers are two other trends worth noting. The first is that the percent of content that Netflix produced (original content) increased from almost nothing in 2011 to close to 50% of content in 2022. The second is that growth in recent years, in subscribers and revenues, has come from outside the US, with US declining from 52% of all subscribers in 2018 to 33.6% of subscribers in 2022. As Netflix has grown, it has drawn competition not only from traditional content makers, with the largest studios offering their own streaming services (Disney -> Disney +, Paramount -> Paramount+ & Showtime, Warner -> (HBO) Max, Universal -:> Peacock, MGM -> MGM+), but also from large technology companies (Apple TV+ and Amazon Prime). While Netflix remains the most watched streaming service, many customers subscribe to multiple streaming services, and as streaming choices proliferate, more and more US households have started weaning themselves away from cable TV. This cord cutting phenomenon's effects can be seen in the percent of households that have no cable or satellite TV:
Between 2015 and 2021, about 20 percent of all US households dropped their cable or satellite television subscriptions, with the drop off being dramatic in younger households. In August 2022, for the first time in history, Nielsen reported that more people watched streaming than cable or broadcast TV, and there is every reason to believe that this trend will only get stronger over time. As a final note, there are two reasons why cable and satellite television has not suffered an even steeper fall. The first is that aging households continue to stick with their television watching habits, and relatively few older Americans have cut their cable subscriptions. The second is live sports, especially (American) football, where cable continues to retain a foothold, though even that advantage is under threat, as sports franchises create their own streaming platforms (MLB) or find streaming venues (MLS soccer on Apple TV, the NFL on Amazon Prime). It is in this context that Disney's battle with Charter over ESPN takes on a larger relevance, since ESPN and cable TV have had a symbiotic relationship for more than two decades. As streaming has breached the broadcasting business, you may wonder how it is affecting the movie business. In the early years, streaming allowed studios to augment the value of their content by renting it out to streamers (Netflix, in particular) for substantial revenues. As its subscription base grew, Netflix turned to making original movies, mostly for its own platform, and in 2019, it spent close to $15 billion on original content, rivaling the spending of large movie makers.

The COVID shut down of 2020, in particular, changed the dynamic further, as traditional studios, faced with the shuttering of movie theaters, released their movies directly into streaming. That phenomenon has outlasted COVID, and as it develops as a viable alternative for content distribution, it not only strikes at the heart of the traditional movie business but may also be changing consumer behavior.
The Streaming Effect
As streaming disrupts both the broadcasting and movie businesses, let us look at how it is changing these businesses from the inside, starting with content (types of movies, movie budgets, number of movies), moving on to talent (actor and writer demand and compensation) and then to customers (how much and how we watch content).
Content
The growth of streaming platforms has altered content (movies and broadcasting) in significant ways., with the first being an increase in the total volume of content, as streaming platforms try to fill their content libraries. With Netflix leading the way on original content, this has translated into a jump in movies being made, as can be seen in the graph below, from an annual average of 367 movies a year, in the United States, between 2000 and 2012 to 1200 movies a year between 2013 and 2023.
 SourceThat increase in demand for content has been accompanied by an increase in costs of movie making, with the average cost for making a movie increasing from $39.5 million between 2000 and 2012 to about $54.5 million between 2013 and 2023.
If you are wondering why you have not seen an explosion of movies at theaters, it is because fewer of these movies are being made for movie theaters, with big studios, reducing theater movie production by almost 30%, from 108 movies a year, on average from 2000 to 2012, to about 75 movies a year, from 2013 to 2023. While independent studies increased their production over the period, the overall number of movies reaching movie theaters has seen a significant drop off.
 SourceWhile the 2020 drop can be attributed to the shut down, movie production has not bounced back in the years since.
Finally, the most interesting effects of streaming may be occurring under the surface in terms of the content that is produced, and they can be traced to the very different economics of making movies for theaters (or shows for broadcasting) as opposed to creating content for streaming services. With the former, the question of whether to make content can be answered by forecasting the revenues that will be generated by that content, either as gate receipts and ancillary revenues (for movies) or in advertising revenues (for broadcasting). With streaming, the end game with new content (movies or shows) is to add new subscribers to the service, and/or induce existing subscribers to renew their subscriptions, and it is difficult to link either directly to individual shows. Even within streaming services, there seems to be no consensus on what strategy best delivers these results, perhaps because success is so difficult to measure.
Netflix has chosen what can be best described as the shotgun approach to content, producing vast amounts of content, often in the form of entire seasons, for shows, with the hope that some portion of that content would be a binge-watching hit. That approach has delivered results in terms of higher subscriber count, but at a huge content cost, with content costs growing at the same rate, or higher rates, than subscriber count, until very recently.HBO has used a more curated approach to content, making fewer shows, albeit with less divergence in quality, and releasing episodes on a weekly basis, hoping for more viral reach from successful shows (Game of Thrones and Succession qualify as big successes). The plus of this approach is lower content costs, but with much lower subscriber numbers than in the shotgun model.Disney Plus started with the premise that a massive library of content would allow the platform to draw and keep subscribers, but early on, the company discovered that to compete with Netflix on subscriber numbers, it needed new content, and much of that content has come from high-profile, expensive shows from its Avengers and Star Wars franchises. If success is measured in subscriber count, Disney Plus has succeeded, but the spending on content has exploded, dragging Disney’s profitability down with it. With Apple TV+ and Amazon Prime, the game is even more difficult to gauge. Both companies spend large amounts in content and clearly lose money on their streaming platforms, but their benefits may come from tying users more closely into their platforms. with benefits showing up other products and services they sell to those in their ecosystems.Given that all of these approaches have had difficult delivering sustained profitability, it is fair to say that while streaming has succeeded in delivering subscriber growth and changing content watching habits, it has not developed a business model that can delivered sustained profitability.Talent
The angst that many actors and writers about the sharing of streaming revenues can be best understood by considering how how they have historically received residual payments on content. Built around a pay structure negotiated in 1960, actors and writers are paid residuals each time a show runs on broadcast or cable TV, or when someone buys a DVD or videotape of the show. With streaming, that old structure has buckled, as the benefits from a show or movie are more difficult to measure, since subscription revenue or subscriber count cannot be directly connected to individual shows. (There are exceptions, where added subscriber numbers can be attributed to a hit show, say Game of Thrones at HBO, or even a high-profile individual, with Lionel Messi pushing up MLS subscriptions on Apple TV+.) To the counter that you can measure how many people watch a show or movie on Netflix or Disney+, note that streaming companies do not make money from viewers, but only from added subscription revenues. With the more diffuse link between viewership and revenues in streaming, the question of how to structure residuals to actors and writers has become a key point of contention, and one of the central elements of the current strike.
In 2019, the Screen Actors Guild made an agreement with Netflix that applied to any scripted projects produced and distributed by the platform where residuals were calculated based on the amount that a performer was originally paid and how many subscribers the streaming platform has. That agreement though has yielded wildly divergent payments to actors, with some taking to social media to showcase how little they received, even on widely watched shows, while other bigger name stars are being well compensated. One of the demands from strikers is that streaming services be more transparent about viewership on shows and that they tie compensation more closely to viewership, but this dispute will not be easily resolved. Given the stakes, an agreement will eventually be reached where actors and writers will receive more than what they are receiving now, but to the extent that streaming gets its value from adding and holding on to subscribers, I expect the divergence in pay between the stars of streaming shows and the rest of the content makers to get worse over time, just as it did in the music business.
Consumption
Has streaming changed the way that we watch movies and broadcasting content? I think so, and here are a few generalizations about those viewing changes:
More choice, but less quality control: The fact that Netflix has built its content production around the shotgun approach, and is being copied by other streamers, you and I as consumers will be spending far more time starting and abandoning shows, before finding ones to watch than we used to. Not surprisingly, quite a few us are overwhelmed by that search for watchable content, and choose to go with the familiar (explaining the success of old network shows like The Office, Friends and Suits on Netflix) or with the herd, often watching what everyone else is watching (the ten most watched shows and movies that Netflix highlights every day create feedback loops that lead them to be watched more).Copycat Productions: The content business have never been shy about imitation and sequels, trying to remake successful content with slight variations or add sequels to hits, but that has notched up with streaming. Thus, the success of a show on Netflix gives rise not only to more seasons of that show, but to a whole host of imitations. If you add to this the reality that streaming platforms track what you watch, and have algorithms that feed you more of the same, you may very well have the misfortune of being caught in a version of Groundhog Day, where you watch the same movie, with mild variations, over and over again for the rest of your life.YouTube and TikTok: As the content on streaming platforms dilutes quality and shifts to reality shows, it should come as no surprise that viewers are spending less time on streaming platforms and more on Twitch, YouTube and TikTok, where you get to watch people put out reality shows of their own, sometimes in real time.Finally, the early promise of streaming was that it would allow us to save money, by cutting the cable cord, but as with most things that technology has promised us, those financial savings have become a mirage. If you add together the cost of multiple streaming services to the higher price that you paid to get higher-spreed broadband, to watch your streaming shows, I am sure that many of you are paying more on your entertainment budget than you did in pre-streaming days.
The Streaming Effect: Business Models and Profitability
The effects of streaming on movies and broadcasting content and distribution are showing up in the financial statements of these companies and in the market pricing of these companies. In this section, I will start by looking at how the operating metrics of entertainment companies, with the intent of detecting shifts in growth and profitability, and then turn my attention to how investors are pricing in these changes.
Operating Effects
For those who are concerned about a music business-like implosion in movie business revenues, I will start with the good news. At least so far, the cumulative revenues across all entertainment companies c has held up to the streaming disruption, as can be seen in the graph below, where I look at the cumulative revenues of all movie and broadcasting related companies from 1998 to 2023:
 Note that since companies are classified based upon their core business in this graph, the streaming component of revenues are understated, since the revenues that Disney, Paramount and Warner get from their streaming businesses are counted as movie revenues. As you can, aggregate revenues did see a drop in 2020, because of COVID, but have come back since. If you are wondering why cable company revenues have been resilient in the face of cord cutting and the loss of cable TV subscriptions, it is because cable companies remain the prime providers of broadband, without which there is no streaming business. On a less upbeat note, looking at profitability at these companies, the cumulative operating profits have been less reselient, especially in the post-COVID years, with cumulative operating profits in 2022 and 2023 well below operating profits in 2019:
 If you bring the revenues and operating numbers together to compute operating margins, you start to get a clearer sense of why movie companies, in particular, are facing a crisis:

The profitability of the movie business has collapsed in the years since COVID, with operating margins dropping below 5% in 2022 and 2023, from more than 15% in the years before COVID. Streaming seems to be settling into a modicum of profitability, but here again, we may be overstating the profitability of streaming by not bringing into the metric the losses that Disney, Warner Bros and Paramount are facing on their streaming segments. In sum, entertainment companies are delivering higher revenues overall, with revenues from streaming and new technologies increasing enough to offset lost revenues in legacy businesses that are being disrupted, but the entertainment business overall is becoming less profitable.
Market Effects
As streaming has changed the movie and broadcasting businesses, financial markets have struggled to get a handle on how these changes affect the values of companies int these businesses. Looking at the cumulative market capitalization of all entertainment companies, there are two shifts that we can observe over time, one in the decade leading into COVID and one in the years after:
 Note the surge in aggregate market capitalization between 2019 and 2021, with Netflix leading the way, and with other entertainment companies partaking, and the drop in value in the last two years. The trends in cumulative market capitalization of all entertainment companies also masks shifts in value across companies within the group, as can be seen in the graph below, where I look at the diverging fortunes across the last decade of the five largest entertainment firms (in terms of market capitalization) in September 2023:
 Between 2013 and September 2023, Netflix gained $174 billion in market capitalization, posting an annual return of 24.5% a year. During the same period, Comcast, Disney and Warner saw their market capitalizations stagnate, in a period when the market was up strongly, effectively translating into a lost decade of returns to shareholders. Live Nation, the fifth largest company in the group in September 2023, barely registered in the rankings in 2013, but has risen 17.19% a year to reach its current standing. While the shifts in value from the status quo players to Netflix and Live Nation is buffering the impact of streaming on the cumulative market capitalization of this industry group, the market has become decidedly more negative on one segment of this group - movie theater companies. In the last graph, I look at the cumulative market cap of the four largest movie theater companies in North America - AMC, Cineplex, Cinemark and the Marcus Group.
 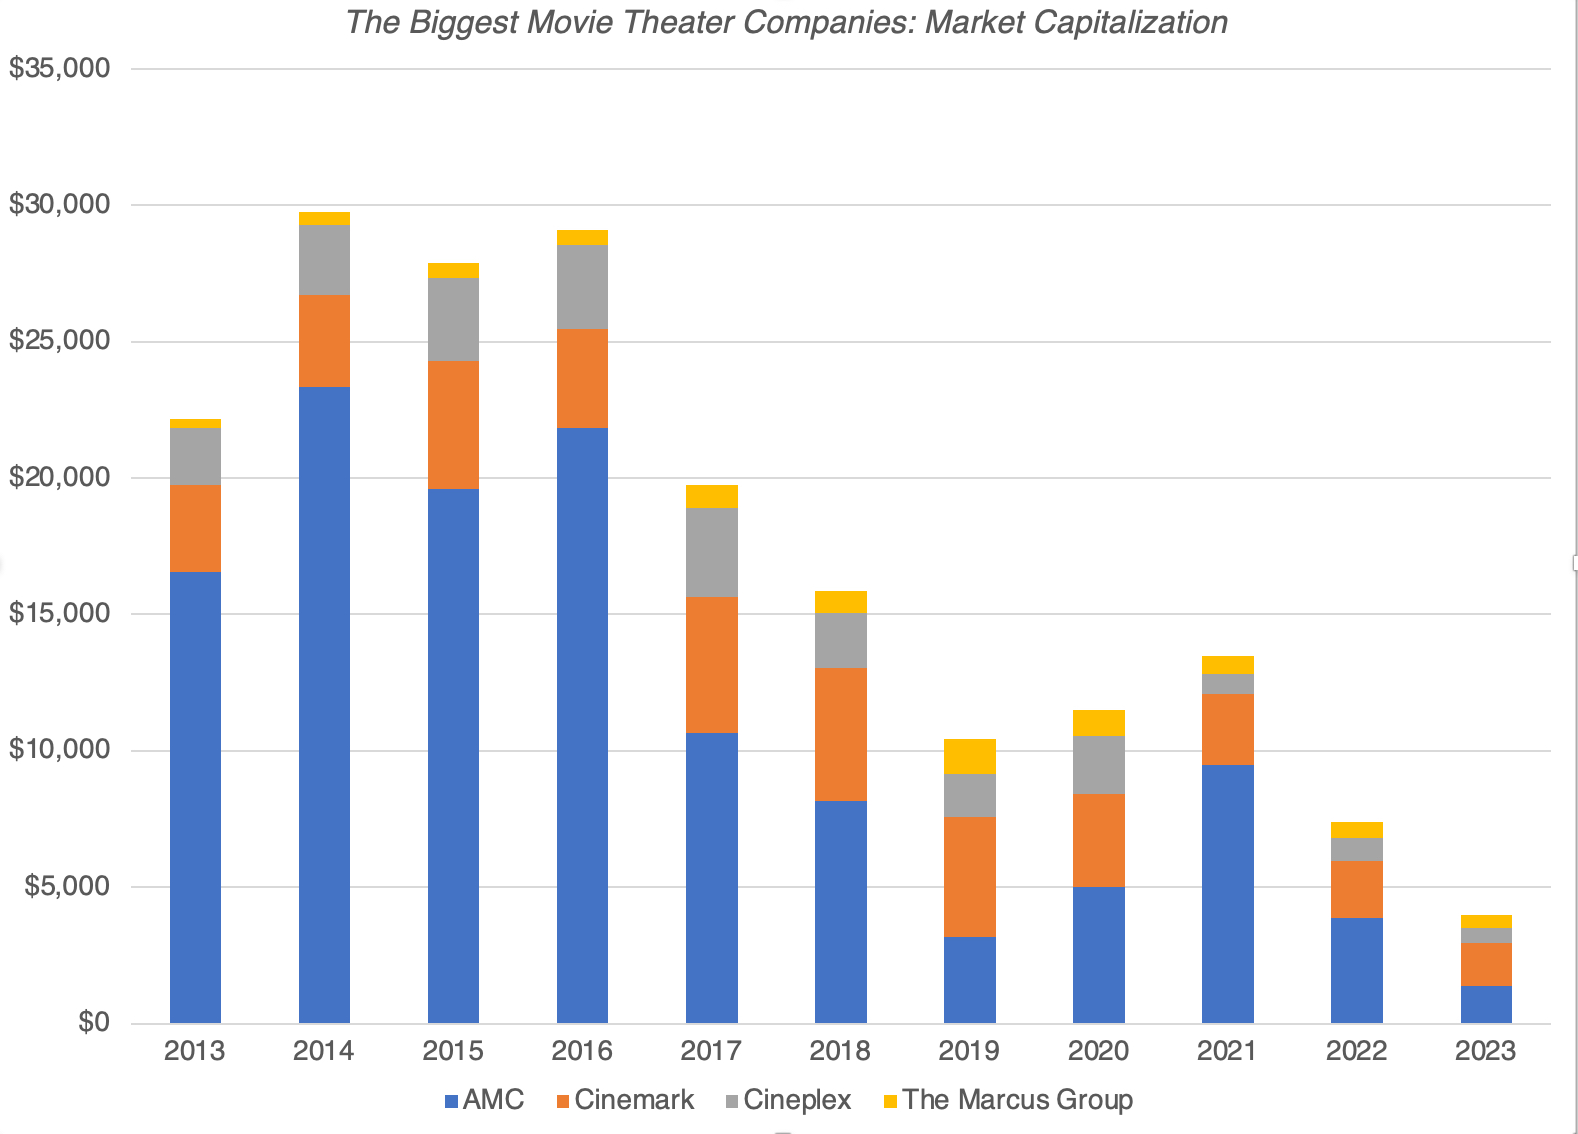 While the COVID shut down clearly impacted the 2020 numbers, note that the market decline in these companies started in 2017, and has picked up steam since.
Corporate Governance
Corporate governance at companies rarely draws attention during the good times, where managerial mistakes are overlooked, and rising revenues and earnings can hide corporate flaws. However, in challenging times, and disruption clearly has created challenges for entertainment companies, it is not surprising that we are seeing more investor angst at these companies.
CEO Turnover: There has been drama in the top ranks of Disney in the last few years, as Bob Iger first turned over the reins in the company to Bob Chapek in 2020, and then reclaimed it two years later. Some of that blowback can be traced to an expensive bet made by the latter on streaming, reorganizing the company around Disney+, and investing billions into streaming content, trying to attract new customers. While there are factors specific to Disney that can shed light on that company's CEO wars, I expect CEO turnover and turmoil to increase at entertainment companies, as investors look to replace management at companies that are struggling, in a sometimes futile effort to change their fortunes.Activist Presence: It is no surprise that activist investors are drawn to industries in turmoil, pushing companies to spend less on reinventing themselves and returning more cash to shareholders. Here again, the Disney experience is instructive, where Nelson Peltz's opposition to Chapek's plans clearly played a role in the CEO change this year. While Iger has been given some breathing room to fix problems after his return, the clock is ticking before activist investors return to the company. In fact, I expect the companies in the entertainment group to be prime targets for activist investors in the next few years.Spin-offs, Divestitures and Break-ups: In response to streaming challenges, entertainment companies have started exploring whether splitting up or spinning of businesses will improve their chances of survival and success in the streaming age. Warner Bros. was spun off by AT&T and merged with Discovery in 2022, precisely for this reason, and the push for Disney to spin off or divest ESPN is similarly motivated.Bankruptcy: For the companies whose financials have imploded as a result of streaming, and all have debt, you should expect to see dire news stories not just about layoffs and shrinkage, but about potential bankruptcy. In the theater business, this has become reality as Cineworld (owner of Regal, the second largest theater chain in North America) issued a bankruptcy warning in early 2023, and AMC (owner or both the largest theater chain and a streaming service) had to do a reverse stock split to keep itself from careening towards penny stock status.There are three final notes that I would like to add to this (long) post. First, I know that this post has been US-centric in its examination of the streaming effects on entertainment, but I do believe that much of it applies to the rest of the world, with a caveat. The status quo may be better protected in other parts of the world, either because of explicit limits on or implicit barriers to entry. Thus, streaming may be less of an immediate threat to Bollywood, India's immense homegrown movie-making business, than it is to Hollywood, but change is coming nevertheless. Second, as I noted before, the line between content made by professionals (movie makers, broadcasting studios) and individuals (on platforms like YouTube and TikTok) is getting fuzzier, and they are all competing for limited viewer minutes. Third, for those in this business who are naive enough to think that artificial intelligence will rescue their companies from oblivion, I would offer the same caution that I did to the active money management business, a few months ago. If everyone has it, no one does, and with AI, content makers may very well find themselves competing with computer power and technology companies, and that is not a fight where they have the upper hand.What the future holds… The consequential and unresolved question is what the movie and broadcasting business will look like a decade from now, since the answer will determine how stakeholders in the business will be affected. To frame the answer, I start by looking at the most malignant and benign ways in which this could play out:

At one extreme, you may see the movie and broadcasting business follow the music business and see a collapse of revenues, a destruction of the status quo and a resetting of the competitive landscape. If this happens, some of the biggest names in movies and broadcasting will disappear as independent entities, either absorbed as pieces of much larger companies or cease to exist. The disruptors, including Netflix and Live Nation, will face different challenges, as they now become the status quo, and they will have to figure out how to make their business models profitable and sustainable, even as they themselves will become targets of new disruptors.At the other exhibit, you will see entertainment continue to grow as a business, but with status quo players (content makers and exhibitors) bringing their strengths into play to outflank the disruptors. In this scenario, the big names in the movie and broadcasting business will modify how they make and exhibit content, and come back, bigger, stronger and more profitable than they were in the pre-streaming era. There is a middle-ground, where success will require that you draw on the strengths of both the status quo and new technologies. The players in the status quo who are adaptable and willing to change will absorb those players who are not, and there will be a similar shake up among disruptors, with those disruptors who combine entertainment business wisdom with technological knowhow will win at the expense of disruptors who do not. As investors in this industry group, your task is simple, if you believe in either extreme. If you believe that disruption will be absolute and upend the movie and broadcasting businesses, you should, at the minimum, avoid the status quo entertainment companies, and if you are more of a risk taker, sell short on these companies. If you believe that after all is said and done, disruption will expand entertainment business revenues, but will leave the status quo on top, you should buy Disney, Warner and perhaps even AMC, and sell short on the highest-flying newcomers in the business. If, like me, you go for the middle ground, your success will depend on how good you are at assessing adaptability in entertainment companies, buying status quo companies with speedy learning curves on streaming and new technologies and disruptors that acquire content-making skills to pair with technological prowess. That would make both Disney and Netflix works-in-progress, with the former still wrestling with the challenge of making its streaming platform a money-maker and the latter working on a content model that is more disciplined and less costly. At current pricing, I believe that the odds favor me more with Disney than Netflix, but that is just me!
YouTube Video
August 25, 2023
Toys for Billionaires: Sports Franchises as Trophy Assets!
I have always loved sports, playing tennis and cricket when I was growing up, before transitioning to fan status, cheering for my favored teams from the sidelines. I also like finance, perhaps not as much as sports, but there are winners and losers in the investment game as well. Thus, it should come as no surprise that when the two connect, as is the case when teams are bought and sold, or players are signed, I am doubly interested. The time is ripe now to talk about how professional sports, in its many variations around the world, has blown a financial gasket, as you see teams sold for prices that seem out of sync with their financial fundamentals and players signed on contracts that equate to the GDP of a small country. In this post, that is my objective, and if get sidetracked, as a sports fans, I apologize in advance.
The Lead In
In its idealistic form, sports is about competition and the human spirit, and is divorced from money. That was the ideal behind not just the Olympic ban on athletes from being paid for performing, but also behind major tennis tournaments being restricted to just amateurs until 1968 and the entire collegiate sports scene. Both restrictions eventually fell, weighted down by hypocrisy, since the same entities that preached the importance of keeping money out of sports, and insisted that the players on the field could not make a living from playing it, engorged themselves on its monetary spoils. At this point, it seems undeniable that sports and money are entwined, and that trying to separate the two is pointless.
The Story Lines
As the walls between sports and money have crumbled, we have become used to seeing mind-boggling numbers on sports transactions, whether it be in the form on broadcasting networks paying for the rights to carry sporting events or player contracts pushing into the hundreds of millions. Even by those standards, though, the last few months have delivered surprises that have staggered even the most jaded sports-watchers:
Player contracts: While player contracts have become bigger over time, the $776 million offer by Al-Hilal, a Saudi team, to Kylian Mbappe, the French superstar on contract with PSG, for a one-year contract to play with the team was eye-popping in magnitude. While Mbappe turned down the offer and is considering a ten-year deal with PSG, the numbers involved in the Al-Hilal deal are almost impossible to justify on purely economic terms. In parallel, as the 2023 baseball season winds down, questions about which team would sign Shohei Ohtani, its best player, and for how much were widely debated in the media.Sports franchise transactions: In 2023, the Washington Commanders, an NFL team with a decidedly mixed record on the field and a history of controversy around its name and owner, was sold for over $6 billion to a consortium, making it the highest priced sports franchise transaction in history. It followed a decade or more of ever-rising prices for sports franchises around the world, from the Premier League (soccer) in the UK, to the IPL (cricket) and across professional sports in the US. Sport disruptions: The last year has also brought threats to sports franchises, striking at their very existence. The Saudi team bid for Mbappe reflected a broader attempt by the country to disrupt professional sports, with professional golf, in particular, in the cross hairs. When LIV made its bid by signing up some of the best-known golf players in the world to play in its tournaments, few gave it a chance of success against the PGA, but in 2023, it was the PGA that conceded the fight in the money game.Broadcasting upheaval: As the revenues from sports has shifted from the playing fields to media, it is the size of the media contracts that determine how lucrative a sport is. In 2021, we saw the NFL, the richest franchise in the world, enter into new media contracts to cover the next decade of broadcasting rights for the sport. These contracts are not only expected to bring in a staggering $114 billion in revenues to the NFL in the next decade, but in a reflection of the times, they are split among four different broadcasters (ESPN, CBS, NBC and Fox), with Amazon Prime picking up the slack. The increasing importance of streaming in the media business was illustrated when the IPL, India’s cricket league, sold its media rights for the next five years for television broadcasting to Star India, a Disney-owned subsidiary, for roughly $3 billion, and the streaming rights for the same period to Viacom18, a Reliance-controlled joint venture, for about the same amount.While these stories cover disparate parts of sports, and the only thing they share in common is the explosively large financial numbers, I will argue, in this post, that they represent an acceleration in a phenomenon that will change how these sports will get played and watched.Rising Franchise Prices
Even a casual follower of the news on sports franchises changing hands, no matter what the sport, must have noticed the surge in the pricing of sports franchises, with little or no obvious connection to team success on the field; the Washington Commanders, the target of $6 billion acquisition, have won 63 games, while losing 97, in the last decade. In fact, the five highest prices paid for sports teams have all be paid in the last two years, as can be seen in the list of ten most expensive sports franchise transactions in history:
table.tableizer-table { font-size: 12px; border: 1px solid #CCC; font-family: Arial, Helvetica, sans-serif; } .tableizer-table td { padding: 4px; margin: 3px; border: 1px solid #CCC; } .tableizer-table th { background-color: #104E8B; color: #FFF; font-weight: bold; }
Team
League
Year
Price (in $ billions)
Washington Commanders
NFL
2023
$6.05
Chelsea
Premier League
2022
$5.30
Denver Broncos
NFL
2022
$4.70
Phoenix Suns
NBA
2023
$4.00
Milwaukee Bucks
NBA
2023
$3.50
New York Mets
MLB
2020
$2.40
Brooklyn Nets
NBA
2019
$2.40
Carolina Panthers
NFL
2018
$2.20
Houston Rockets
NBA
2017
$2.20
Los Angeles Dodgers
MLB
2012
$2.00
These high prices, though, represent the continuation of a trend that we have seen over the last few decades in franchise pricing, with the graph below looking at every major sports transaction between 1998 and 2023:
As you can see, transaction prices for sports franchises have been marching upwards for the last two decades, with NBA and NFL teams registering the biggest increases, but have seen breakaway surges in the last few years.
Some of you may be familiar with the Forbes annual listings of the most valuable teams in the world, and you may have wondered how they value sports teams. The truth, and I will clarify what I mean shortly, is that Forbes does not value sports franchises, but prices them. Since Forbes gets draws on actual transaction prices as guidance in their estimates, the pricing that Forbes attaches to teams has risen with transaction prices. In the graph below, for instance, I report the cumulative pricing of all NFL teams, as estimated by Forbes, from 2012 to 2022:

The collective pricing of all NFL teams, according to Forbes, has risen from $37.6 billion in 2012 to $132.5 billion in 2022. In fact, I will be willing to predict that given the Washington Commanders transaction, the pricing of every NFL team on the Forbes list will be higher in 2023.
With the pricing process in mind, it is instructive to look at the collective pricing, in millions of US dollars, of global sports franchises, as of the most recent updates from 2022 and 2023:
Cumulative Pricing (in $ mil) Highest Priced Lowest Priced NFL (US Football)$132,500$7,640$4,140 NBA (Basketball) $85,910$7,000$1,600 MLB (Baseball)$69,550$7,100$1,000 NHL (Hockey)$32,350$2,200$450 MLS (US Soccer)$16,200$1,000$350 Premier League (To 20) $30,255$5,950$145 IPL (Indian Cricket)$10,430$1,300$850The NFL is the most valuable franchise in the world, in terms of collective pricing of all of its teams, followed by basketball and baseball. The collective pricing of all soccer teams around the world may actually be close to or even exceed the pricing of baseball or basketball teams, but just the top 20 Premier League teams have a pricing of about $30 billion. The ten teams that comprise the IPL, the Indian cricket league, have a collective pricing in excess of $10 billion. One interesting difference across franchises is the differences between the highest and lowest priced franchises, with the NFL having the smallest difference, and we will talk about how the way broadcasting revenue are shared can explain this divergence across sports franchises.
Finally, there is a subset of sports franchises that are publicly traded, but it is a very small one. Among US sports franchises, the one that comes closes is Madison Square Garden Sports, which in addition to owning the arena (Madison Square Garden) also owns the New York Knicks (NBA) and the New York Rangers (hockey), but it is closely held, with the Dolan family firmly in control. Outside of the US, Manchester United is the highest-profile example of a publicly traded company, but it too is closely held, with control in the hands of the Glazer family. There are a few European soccer teams that are publicly traded, but they all tend to be closely held, with light liquidity.
Price vs Value
If you find me finicky, when I label the Forbes estimates for franchises as prices, rather than values, it is best understood by contrasting price and value, two words that, at least to me, mean very different things and require different mindsets:

As you can see from the picture, while value is driven by familiar fundamentals (cash flows, growth and risk), price is determined by demand and supply, which, in turn, are driven by mood and momentum, behavioral factors that don’t play a key role in determining value. I used this contrast, a few years ago, to classify investments and talk about price and value with each one:

As you can see, collectibles and currencies can only be priced, and while commodities may have an aggregate fundamental value, they are more likely to be priced than valued. It is only with assets that are expected to generate cashflows in the future that value even comes into play. A company or a business can be valued, and that value will reflect its capacity to generate cash flows in the future, but it can also be priced, based upon what others are paying for similar companies. In fact, almost every investment philosophy can be framed in terms of whether you believe that there can be a gap between value and price, and when there is a gap, how quickly it will cause, as well as catalyst that cause that closing.
There is a sub-grouping of assets, though, that is worth carving out and considering differently, and I will call these trophy assets. A trophy asset has expected cash flows, and can be valued like any other asset, but the people who buy it often do so, less for its asset status and more as a collectible. Powered by emotional factors, the prices of trophy assets can rise above values and stay higher, since, unlike other assets, there is no catalyst that will cause the gap between price and value to close. So, what is it that makes it for a "trophy assets"?
Emotional appeal overwhelms financial characteristics: The key to a trophy asset is that the core of its attraction, to potential buyers or investors, lies less in business models and cash flows, and more in the emotional appeal it has to buyers. That appeal may be only to a subset of individuals, but these buyers want to own the asset more for the emotional dividends, not the cashflows.It is unique: Trophy assets pack a punch because they are unique, insofar as they cannot be replicated by someone, even if that someone has substantial financial resources.It is scarce: For trophy assets to command a pricing that is significantly higher than value, they have to be scarce.It is bought and held for non-financial reasons: If trophy assets are opened up for bidding, the winning bidder will almost always be an individual or entity that is buying the asset more for its history or provenance, not its financial characteristics.Examples of trophy assets can range the spectrum from legendary real estate properties, such as the Ritz Carlton in London, to publications like the Economist or the Financial Times. Once an asset crosses the threshold to trophy status, you can expect the following to occur. First, it will look over priced, relative to financial fundamentals (earnings, revenues, cash flows), and relative to peer group assets that do not enjoy the same trophy status. Second, and this is critical, even as price increases relative to value, the mechanism that causes the gap to close, often stemming from a recognition that the you have paid too much for something, given its capacity to generate earnings and cash flows, will stop working. After all, if buyers price trophy assets based upon their emotional connections, they are entering the transaction, knowing that they have paid too much, and do not care. Third, and this follows from the firs point, the forces that cause the prices of trophy assets to change from period to period will have a weak or no relationship to the fundamentals that would normally drive value.There is an interesting question of whether a publicly traded company can acquire trophy status, and while my answer, ten or twenty years ago, would have been a quick no, I have to pause before I answer it now. As many of you know, I have tried to value Tesla, based upon my story for the company, and the expected cash flows that emerge from that story, many times over the last decade. While some of the pushback has come from those who disagree with the contours of my story, and my expectations, some of it has come from people who have not only invested a large proportion of their wealth in the company, but have done so because they want to be part of what they see as a historical disruptor, one that will upend the way we not only drive, but live. The implication then is that Tesla will trade at prices that are difficult to justify, given the company's financials, that it will attract a subset of investors who receive emotional dividends from owning the stock and that short selling the stock, on the expectation that the gap will close, will be a perilous exercise.
Sports Franchises as Trophy Assets
When the Rooney family bought the Pittsburg Steelers, now a storied franchise in the most highly priced sports league (NFL) is 1932 for $2,500, it was very likely that they were buying it as a business, hoping to generate enough in ticket sales to cover their costs and earn a profit. After all, football (at least the American version) was a nascent sport, not widely followed, and with just a few teams and no organized structure. In fact, you can still view the Steelers as a business, and value them as such, but as we will argue in this section, that number will bear little resemblance to the $4 billion pricing that Forbes attached to the team. In fact, sports franchises across the world have already become, or are increasingly on the pathway to becoming trophy assets.
1. Prices disconnect from Fundamentals
To value a sports franchise as a business, it is worth examining how the revenues for franchises have evolved over time. Until the last 50 years, almost all of the revenues for sports franchises came from gate receipts collected from fans coming in to watch games, and the food and merchandise that these fans bought, usually at the games they attended. With television entering the picture, and streaming augmenting it, the portion of revenues that sports franchises get from media has become a larger and larger slice of the pie, as can be seen in the graph below, where we look at gate receipts, media revenue and other (merchandizing and sponsorship) revenues for all US sports franchises between 2006 and 2022:

As you can see, the overall revenues for sports franchises has grown between 2006 and 2022, with 2020 being the COVID outlier, but much of that growth has come from the media slice of revenues, as gate receipts have flatlined. This is clearly not just a US phenomenon, and you are seeing the same process play out in Europe (with soccer the big beneficiary) and in India (with cricket the winner).
To value a sports franchise, you not only have to consider how much of a draw the team is at the stadium, but how much revenues the team gets from its media contracts, as well as merchandising and sponsorship revenues. While the gate receipts and merchandising revenues are significant, they are relatively easy to forecast, given history and ticket sales. Media revenues, though, are tricky, since they are determined partly by the size of the media market that the team operates in, and partly by how the sports franchise that the team belongs to shares its media revenues. In the US, for example, baseball teams get a significant portion of their broadcasting revenues from local TV rights, and as a consequence, teams in the biggest media markets (Yankees and Mets in New York, Dodgers in Los Angeles) have higher revenues than teams in smaller media market (Mariners in Seattle). In contrast, the media revenues for football (NFL) are mostly national, and those revenues are equally divided across the teams, resulting in more equitable media revenues across NFL teams. That difference explains why the divergence between the highest and lowest priced teams is greater in baseball than the NFL. The table below provides a comparison of how media revenues are shared across teams, by franchise:

While all of the franchises pay lip service to the need for balance, with large media-market teams subsidizing small media-market teams, there is wide variation across franchises in how they follow through on fixing that imbalance. Only the NFL has a strong enough system in place to create full balance, and that is partly because of the fact that almost all of its broadcasting revenues are national (rather than local) and partly because it is a league with a strong commissioner. While revenues have risen, aided by richer broadcasting contracts, sports franchises have been faced with rising player costs; in almost every major sports franchise in the United States, player expenses account to 50% of revenues, or more, and they have risen over time. Once the other expenses associated with a team are netted out, the operating profits at sports franchises are, for the most part, moderate. Looking across sports franchises, you can see that the cumulated revenue and operating income numbers, in conjunction with the collective pricing of teams (as estimated by Forbes) in the most recent year:
 While team financials tend to be opaque, Forbes estimated that the NFL, the richest sports franchise in the world, generated about $4.7 billion in operating profit on revenues of approximately $16 billion, in 2022. The NBA is the next-most profitable franchise, whereas baseball collectively struggles to make money. More to the point, if you use the Forbes pricing estimates for teams, note that four of the seven franchises (NFL, NBA, MLS and IPL) trade at 8-10 times revenues and at high multiples of operating income. It is true that there are tech companies in the market that trade at similar multiples, but those companies have extraordinary growth potential ahead of them and new markets to conquer. Even if you believe that media rights will continue to the the goose that lays the golden eggs for sports franchises, it is difficult to see how you justify these pricing multiples. To show that the disconnect between what buyers are paying for franchises, and what they are getting back in return, has been growing over time, I look at the pricing of NFL teams over time, relative to revenues at these teams (which include the richer media contracts) from 2012 to 2022:

Over the last decade, you can see that the pricing of NFL teams has risen from just over four times revenues in 2012 to more than seven times revenues in 2022. In short, NFL franchise prices are rising at rates that cannot be explained by revenue growth, richer media contracts notwithstanding, or higher profitability.
If you want to see how intrinsic valuation would work at a sports franchise, you are welcome to check out my intrinsic valuation of the Los Angeles Clippers, when Steve Ballmer offered $2 billion for that franchise in 2014. Looking at four scenarios, ranging from an extrapolation of the Clipper's 2012 financials to a best case scenario, where I modeled out a much larger media revenue stream, I got the following:
 Download spreadsheet
I used the same framework to value the Washington Commanders today, and my values range from $2.5 billion, with current profitability, $2.7 billion, if you give them the median operating margin of an NFL team and a value of $4.5 billion, if you give them Dallas Cowboy level margins (the highest in the NFL). In short, getting to the $6.05 billion pricing with an intrinsic valuation is beyond reach.
2. A new breed of owners
At the start of this section, I mentioned the Rooneys buying the Pittsburg Steelers in 1932 for $2,500, and they continue to own the Steelers. While it is conceivable that they think of the Steelers as a business they own that has to continue to deliver earnings for them, much of the rest of the NFL has seen a changing of the guard, with new owners replacing the older holdouts. Many of these new owners are already wealthy, with their wealth accumulated in a different setting (real estate, private equity, venture capital), when they buy professional sports teams, and from the outset, it seems clear that they are less interested in turning a profit , and more in playing the role of team owner. To illustrate, I focus on the NBA, where there has been much turnover in the ownership ranks, with close to two-thirds of the teams acquiring new owners in the last two decades:
 Source
As you browse this list, you will note that while many of the owners are billionaires, not counting their NBA team ownership, there are a few owners, towards the bottom of the list, whose wealth is primarily in their team ownership. Looking for trends, the more recent a sports franchise transaction, the more likely it is that the buyer is not just wealthy, but immensely so, and this pattern is playing out across the world.
So, why would these wealthy, and presumably financially savvy, individuals put their money into sports teams? In keeping with the saying that a picture is worth a thousand words, take a look at this picture of Steve Ballmer on the sidelines of a Clippers game:

To my untrained eye, it seems to me that the Clippers are not just another investment in Ballmer's portfolio. In 2014, at the end of my post on the Clippers, and after attempting in every conceivable way to find a financial justification why Ballmer would pay $2 billion for an NBA team that was a distant second to the other NBA team that played in the same city, I threw up my hands and concluded that Ballmer was buying a toy. By my estimated, it was an expensive toy that I estimated to cost about a billion (my estimate of the difference between the price he paid and my estimated value), but one that he could well afford, given his wealth.
In many ways, sports franchises are the ultimate trophy assets, since they are scarce and owning them not only allows you to live out your childhood dreams, but also gives you a chance to indulge your friends and family, with front-row seats and player introductions. In fact, it also explains the entry of sovereign wealth funds, especially from the Middle East, into the ownership ranks, especially in the Premier League. If you couple this reality with the fact that winner-take-all economies of the twenty-first century deliver more billionaires in our midst, you can see why there is no imminent correction on the horizon for sports franchise pricing. As long as the number of billionaires exceeds the number of sports franchises on the face of the earth, you should expect to see fewer and fewer owners like the Rooneys and more and more like the Steves (Cohen and Ballmer).
Consequences of Trophy Asset Status
If you are a sports fan, you may be wondering why any of this matters to you, since you are not a billionaire and are not planning to buy any teams, either as businesses or as trophy assts. I think that you should care because the trophy asset phenomenon is already reshaping how teams are structured, sports get played and perhaps what your favorite team will look like next year, when it takes the field.
In sum, if your concern has been that sports has become too business-like and driven by data, the entry of owners who are less interested in the business of sports and more interested in acquiring trophies may very well change the game, but at a cost, where sports becomes entertainment, where players and teams chase social media status, and what happens on the field itself becomes secondary to what happens off the pitch.
YouTube Video
Data
Professional Sports Data (Pricing)SpreadsheetsValuation of the Clippers in 2014Valuation of Washington Commanders in 2023August 15, 2023
In Search of Safe Havens: The Trust Deficit and Risk-free Investments!
In every introductory finance class, you begin with the notion of a risk-free investment, and the rate on that investment becomes the base on which you build, to get to expected returns on risky assets and investments. In fact, the standard practice that most analysts and investors follow to estimate the risk free rate is to use the government bond rate, with the only variants being whether they use a short term or a long term rate. I took this estimation process for granted until 2008, when during that crisis, I woke up to the realization that no matter what the text books say about risk-free investments, there are times when finding an investment with a guaranteed return can become an impossible task. In the aftermath of that crisis, I wrote a series of what I called my nightmare papers, starting with one titled, "What if nothing is risk free?", where I looked at the possibility that we live in a world where nothing is truly risk free. I was reminded of that paper a few weeks ago, when Fitch downgraded the US, from AAA to AA+, a relatively minor shift, but one with significant psychological consequences for investors in the largest economy in the world, whose currency still dominates global transactions. After the rating downgrade, my mailbox was inundated with questions of what this action meant for investing, in general, and for corporate finance and valuation practice, in particular, and this post is my attempt to answer them all with one post.
Risk Free Investments: Definition, Role and Measures
The place to start a discussion of risk-free rates is by answering the question of what you need for an investment to be risk-free, following up by seeing why that risk-free rate plays a central role in corporate finance and investing and then looking at the determinants of that risk-free rate.
What is a risk free investment?
For an investment to be risk-free, you have feel certain about the return you will make on it. With this definition in place, you can already see that to estimate a risk free rate, you need to be specific about your time horizon, as an investor.
An investment that is risk free over a six month time period will not be risk free, if you have a ten year time horizon. That is because you have reinvestment risk, i.e., the proceeds from the six-month investment will have to be reinvested back at the prevailing interest rate six months from now, a year from now and so on, until year 10, and those rates are not known at the time you take the first investment.By the same token, an investment that delivers a guaranteed return over ten years will not be risk free to an investor with a six month time horizon. With this investment, you face price risk, since even though you know what you will receive as a coupon or cash flow in future periods, since the present value of these cash flows, will change as rates change. During 2022, the US treasury did not default, but an investor in a 10-year US treasury bond would have earned a return of -18% on his or her investment, as bond prices dropped.For an investment to be risk free then, it has to meet two conditions. The first is that there is no risk that the issuer of the security will default on their contractual commitments. The second is that the investment generates a cash flow only at your specified duration, and with no intermediate cash flows prior to that duration, since those cash flows will then have to be reinvested at future, uncertain rates. For a five-year time horizon, then, you would need the rate on a five-year zero default-free zero coupons bond as your risk-free rate.
You can also draw a contrast between a nominal risk-free rate, where you are guaranteed a return in nominal terms, but with inflation being uncertain, the returns you are left with after inflation are no longer guaranteed, and a real risk-free rate, where you are guaranteed a return in real terms, with the investment is designed to protect you against volatile inflation. While there is an appeal to using real risk-free rates and returns, we live in a world of nominal returns, making nominal risk-free rates the dominant choice, in most investment analysis.
Why does the risk-free rate matter?
By itself, a risk-free investment may seem unexceptional, and perhaps even boring, but it is a central component of investing and corporate finance:
Asset Allocation: Investors vary on risk aversion, with some more willing to take risk than others. While there are numerous mechanisms that they use to reflect their differences on risk tolerance, the simplest and the most powerful is in their choice on how much to invest in risky assets (stocks, corporate bonds, collectibles etc.) and how much to hold in investments with guaranteed returns over their time horizon (cash, treasury bill and treasury bonds).Expected returns for Risky Investments: The risk-free rate becomes the base on which you build to estimate expected returns on all other investments. For instance, if you read my last post on equity risk premiums, I described the equity risk premium as the additional return you would demand, over and above the risk free rate. As the risk-free rate rises, expected returns on equities will be pushed up, and holding all else constant, stock prices will go down., and the reverse will occur, when risk-free rates drop.Hurdle rates for companies: Using the same reasoning, higher risk-free rates push up the costs of equity and debt for all companies, and by doing so, raise the hurdle rates for new investments. As you increase hurdle rates, new investments will have to earn higher returns to be acceptable, and existing investments can cross from being value-creating (earning more than the hurdle rate) to value-destroying (earning less). Arbitrage pricing: Arbitrage refers to the possibility that you can create risk-free positions by combining holdings in different securities, and the benchmark used to judge whether these positions are value-creating becomes the risk-free rate. If you do assume that markets will price away this excess profit, you then have the basis for the models that are used to value options and other derivative assets. That is why the risk-free rate becomes an input into option pricing and forward pricing models, and its absence leaves a vacuum.Determinants
So, why do risk-free rates vary across time and across currencies? If your answer is the Fed or central banks, you have lost the script, since the rates that central banks set tend to be short-term, and inaccessible, for most investors. In the US, the Fed sets the Fed Funds rate, an overnight intra-bank borrowing rate, but US treasury rates, from the 3-month to 30-year, are set at auctions, and by demand and supply. To understand the fundamentals that determine these rates, put yourself in the shoes of a buyer of these securities, and consider the following:
Inflation: If you expect inflation to be 3% in the next year, it makes little sense to buy a bond, even if it is default free, that offers only 2%. As expected inflation rises, you should expect risk-free rates to rise, with or without central bank actions. Real Interest Rate: When you buy a note or a bond, you are giving up current consumption for future consumption, and it is fitting that you earn a return for this sacrifice. This is a real risk-free rate, and in the aggregate, it will be determined by the supply of savings in an economy and the demand for those savings from businesses and individuals making real investments. Put simply, economies with a surplus of growth investments, i.e., with more real growth, should see higher real interest rates, in steady state, than stagnant or declining economies.The recognition of these fundamentals is what gives rise to the Fisher equation for interest rates or the risk free rate:
Nominal Risk-free Rate = (1 + Expected Inflation) / (1+ Real Interest Rate) -1 (or)
= Expected Inflation + Expected Real Interest Rate (as an approximation)
If you are wondering where central banks enter this equation, they can do so in three ways. The first is that central banking actions can affect expected inflation, at least in the long term, with more money-printing leading to higher inflation. The second is central banking actions can, at least at the margin, push rates above their fundamentals (expected inflation and real interest rates), by tightening monetary policy, and below their fundamentals by easing monetary policy. Since this is often achieved by raising or lowering the very short term rates set by the central bank, the central banking effect is likely to be greater at the shorter duration risk-free rates. The third is that central banks, by tightening or easing monetary policy, may affect real growth in the near term, and by doing so, affect real rates.
Having been fed the mythology that the Fed (or another central bank) set interest rates by investors and the media, you may be unconvinced, but there is no better way to show the emptiness of "the Fed did it" argument than to plot out the US treasury bond rate each year against a crude version of the fundamental risk-free rate, computed by adding the actual inflation in a year to the real GDP growth rate that year:

As you can see, the primary reasons why we saw historically low rates in the 2008-2021 time period was a combination of very low inflation and anemic real growth, and the main reason that we have seen rates rise in 2022 and 2023 is rising inflation. It is true that nominal rates follow a smoother path than the intrinsic risk free rates, but that is to be expected since the ten-year rates represent expected values for inflation and real growth over the next decade, whereas my estimates of the intrinsic rates represent one-year numbers. Thus, while inflation jumped in 2021 and 2022 to 6.98%, and investors are expecting higher inflation in the future, they are not expecting inflation to stay at those levels for the next decade.
Risk Free Rate: Measurement
Now that we have established what a risk-free rate is, why it matters and its determinants, let us look at how best to measure that risk-free rate. We will begin by looking at the standard practice of using government bond rates as riskfree rates, and why it collides with reality, move on to examine why governments default and end with an assessment of how to adjust government bond rates for that default risk.
Government Bond Rates as Risk Free
I took my first finance class a long, long time ago, and during the risk-free rate discussion, which lasted all of 90 seconds, I was told to use the US treasury rate as a risk-free rate. Not only was this an indication of how dollar-centric much of finance education used to be, but also of how much faith there was that the US treasury was default-free. Since then, as finance has globalized, that lesson has been carried, almost unchanged, into other currencies, where we are now being taught to use government bond rates in those currencies as risk-free rates. While that is convenient, it is worth emphasizing two implicit assumptions that underlie why government bond rates are viewed as risk-free:

If you are wondering why a government that has a choice of not defaulting would choose to default, it is worth remembering that printing more money to pay off local currency debt has a cost of its own, since it debases the currency, pushing up inflation. Inflation, especially when it becomes stratospheric, causes investors and consumers to lose trust in the currency, and given a choice between default and debasement, many governments choose the latter. Once you open the door to the possibility of sovereign default in a local currency, it stands to reason that a government bond rate in the local currency may not always yield a risk-free rate for that currency. It is also worth noting that until 2008, investors had that door firmly shut for some currencies, believing that some governments were so trustworthy that they would not even consider default. Thus, the notion that the US or UK governments would default on their debt would have been unthinkable, but the 2008 crisis, in addition to the financial damage it created, also opened up a trust deficit, which has made the unthinkable a reality. In fact, you would be hard pressed to find any government that is trusted the way it was prior to this crisis, and that loss of trust also implies that the clock is ticking towards expiration, for the "government bonds are risk free" argument.
When and Why Governments Default
Now that we have established that governments can default, let’s look at why they default. The most obvious reason is economic, where a crisis and collapse in government revenues, from taxes and other sources, causes a government to be unable meet its obligations. The likelihood of this happening should be affected by the following factors:
 Source: UNCTAD
As you can see, much of Africa, Latin America, the Middle East and Asia are commodity dependent, effectively making them more exposed to default, with a downturn in commodity prices.Degree of Indebtedness: As with companies, countries that borrow too much are more exposed to default risk than countries that borrow less. That said, the question of what to scale borrowing to is an open question. One widely-used measure of country indebtedness is the total debt owed by the country, as a percent of its GDP. Based on that statistic, the most indebted countries are listed below:
 As you can see, this table contains a mix of countries, with some (Venezuela, Greece and El Salvador) at high risk of default and others (Japan, US, UK, Canada and France) viewed as being at low risk of default. Tax Efficiency: It is worth remembering that governments do not cover debt obligations with gross domestic product or country wealth, but with their revenues, which come primarily from collecting taxes. Holding all else constant, governments with more efficient tax systems, where most taxpayers comply and pay their share, are less likely to default than governments with more porous tax systems, where tax evasion is more the rule than the exception, and corruption puts revenues into the hands of private players rather than the government.
There is a second force at play, in sovereign defaults. Ultimately, a government that chooses to default is making a political choice, as much as it is an economic one. When politics is functional, and parties across the spectrum share in the belief that default should be a last resort, with significant economic costs, there will be shared incentive in avoiding default. However, when politics becomes dysfunctional, and default is perceived as partisan, with one side of the political divide perceived as losing more from default than the other, governments may default even though they have the resources to cover their obligations.
As a lender to a government, you may not care about why a government defaults, but economic defaults generally represent more intractable problems than defaults caused by political dysfunction, which tend to be solved once the partisan pounds of flesh are extracted. In my view, the ratings downgrades of the US government fall into the latter category, since they are triggered by a uniquely US phenomenon, which is a debt limit that has to be reset each time the total debt of the US approaches that value. Since that reset has to be approved by the legislature, it becomes a mechanism for political standoffs, especially when there is a split in executive and legislative power. In fact, the first downgrade of the US occurred more than a decade ago, when S&P lowered its sovereign rating for the US from AAA to AA+ in 2011, after a debt-limit standoff at the time. The Fitch downgrade of the US, this year, was triggered by a stand-off between the administration and Congress a few months ago on the debt-limit, and one that may be revisited in a few weeks again.
Measuring Government Default Risk
With that lead-in on sovereign default risk, let us look at how sovereign default risk gets measured, again with the US as the focus. The first and most widely used measure of default risk is sovereign ratings, where ratings agencies rate countries, just as they do companies, with a rating scale that goes from AAA (Aaa) down to D(default). Fitch, Moody's and S&P all provide sovereign ratings for countries, with separate ratings for foreign currency and local currency debt. With sovereign ratings, the implicit assumption is that AAA (Aaa) rated countries have negligible or no default risk, and the ratings agencies back this up with the statistic that no AAA rated country has ever defaulted on its debt within 15 years of getting a AAA rating. That said, the number of AAA (Aaa) rated countries has dropped over time, and there are only nine countries left that have the top rating from all three ratings agencies: Germany, Denmark, Netherlands, Sweden, Norway, Switzerland, Luxembourg, Singapore and Australia. Canada is rated AAA by two of the ratings agencies, and after the Fitch downgrade, the US is rated Aaa only by Moody's, whereas the UK is AAA rated only by S&P.
In a reflection of the times, there have been two developments. The first is that the number of countries with the highest rating has dropped over time, as can be seen in the graph below of countries with Aaa ratings from Moody's:

If you recognize that default risk falls on a continuum, rather than in the discrete classes that ratings assign, the sovereign CDS market gives you not only more nuanced estimates of default risk, but ones that are reflect, on an updated basis, what investors think about a country's default risk. The graph below contains the sovereign CDS spreads for the US going back to 2008, and reflect the market's reactions to events (including the 2011 and 2023 debt-limit standoffs) over time:

As you can see, the debt-limit and tax law standoffs created spikes in 2011 and 2012, and, to a lesser extent, in early 2023, and that these spikes preceded the ratings changes, and were not caused by them, and that the market very quickly recovered from them. In fact, the Fitch ratings downgrade has barely registered on the US CDS spread, in the market, indicating that investors are neither surprised nor spooked by the ratings downgrades (so far).
Dealing with Government Default Risk
No matter what you think about the Fitch downgrade of US government debt, the big-picture perspective is that we are closer to the scenario where no entity is viewed as default-free than we were fifteen years ago, and it may be only a matter of time before we have to retire the notion that government bonds are default-free entirely. The questions for investors and analysts, if this occurs, becomes practical ones, including how best to estimate risk-free rates in currencies, when governments have default risk, and what the consequences are for equity risk premiums and default spreads.
1. Clean up government bond rate
Consider the two requirements that have to be met for a local-currency government bond rate to be used as a risk-free rate in that currency. The first is that the government bond has to be widely traded, making the interest rate on the bond a rate set by demand and supply in the market, rather than government edict. The second is that the government be perceived as default-free. The Swiss 10-year government bond rate, in July 2023, of 1.02% meets both criteria, making it the risk-free rate in Swiss Francs. Using a similar rationale, the German 10-year bund rate (in Euros) of 2.47% becomes the risk-free rate in Euros. With the British pound, if you stay with the Moody's ratings, things get trickier. The government bond rate of 4.42% is no longer risk-free, because it has default risk embedded in it. To clean up that default risk, we estimated a default spread of 0.64%, based upon UK's rating of Aa3, and netted this spread out from the government bond rate:
Risk-free Rate in British Pounds
= Government Bond Rate in Pounds - Default Spread for UK = 4.42% - 0.64% = 3.78%
Extending this approach to all currencies, where there is a government bond rate present, we get the riskfree rates in about 30 currencies:
 Since the US still preserves a bond rating of Aaa (for the moment), with Moody's, the US treasury rate of 3.77% on July 1, 2023, was used as the riskfree rate in US dollars. As you look at these rates, especially in some emerging market currencies, you should be cautious about the numbers you get, especially since the liquidity is light or non-existent in government bonds in these markets. Thus, it is possible that the Vietnamese Dong has the lowest risk-free rate in the world in mid-2023, among all currencies, or it may reflect distortions in the Vietnamese government bond. One way to check these riskier rates for reasonableness is to extend on the insight that the key driver of the risk free rate is inflation, and that in a world where capital moves to equalize real returns, the differences in risk-free rates across currencies come from differential inflation In my post on country risk, In fact, as I argued in my post on country risk, you can convert a riskfree rate in any currency into a risk-free rate in another currency by adjusting for the differential inflation between the currencies:
 Thus, using the IMF's forecasted inflation rates for the US (3%) and Vietnam (5.08%), in conjunction with the US dollar risk-free rate of 3.77% on July 1, 2023, yields a Vietnamese Dong risk-free rate of 5.87% (or 5.85% with the approximation). If you believe that S&P and Fitch are right on their default risk assessments for the US, and that it should get a rating lower than Aaa (say Aa1), from Moody's, the path to getting a US risk-free rate has an added step. You have to net out the default spread for the US treasury bond rate to get to a risk-free rate:
Riskfree Rate in US dollars = US Treasury Bond Rate - Default spread on US T.BondUsing the sovereign CDS market's estimate of 0.30% in August 2023, for instance, when the US treasury bond rate hit 4.10%, would have yielded a risk-free rate of 3.80% for the US dollar.
2. Risk Premia
If you focus just on risk-free rates, you may find it counter intuitive that an increase in default risk for a country lowers the risk free rate in its currency, but looking at the big picture should explain why it is necessary. An increase in sovereign default risk is usually triggered by events that also increase risk premia in markets, pushing up government bond rates, equity risk premiums and default spreads. In fact, if you go back to my post on country risk, it becomes the key driver of the additional risk premiums that you demand in countries:

You will notice that in my July 2023 update, I used the implied equity risk premium for the US of 5.00% as my estimate of a premium for a mature market, and assumed that any country with a Aaa rating (from Moody's) would have the same premium.
Since Moody's remains the lone holdout on downgrading the US, I would use the same approach today, but assuming that Moody's downgrades the US from Aaa to Aa1, the approach will have to be modified. The implied equity risk premium for the US will still be my starting point, but countries with Aaa ratings will then be assigned equity risk premiums lower than the US, and that lower equity risk premium will become the mature market premium, to be used to get equity risk premiums for the rest of the world. Using the sovereign CDS spread of 0.30% as the basis, just for illustration, the mature market premium would drop from 5.00%, in my July 2023 update, to 4.58% (5.00% -1.42*.30%).
When safe havens become scarce...
During crises, investors seeks out safety, but that pre-supposes that there is a safe place to put your money, where you know what you will make with certainty. The Fitch downgrade of the US, by itself, is not a market-shaking event, but in conjunction with a minus 18% return on the ten-year US treasury bond in 2022, these events undercut the notion that there is a safe haven for investors. When there is no safe haven, market corrections when they happen will not follow predictable patterns. Historically, when stock prices have plunged, investors have sought out US treasuries, pushing down yields and prices. But what if government securities are viewed as risky? Is it any surprise that the loss of trust in governments that has undercut the perception that they are default-free has also given rise to a host of other investment options, each claiming to be the next safe haven. While my skepticism about crypto currencies and NFTs is well documented, a portion of their rise over the last 15 years has been driven by the erosion of trust in institutions.
Conclusion
I started this post by noting that we pay little attention to risk-free rates in theory and in practice, taking it as a given that it is easy to estimate. As you can see from this post, that casual acceptance of what comprises a risk-free investment can be a recipe for disaster. In closing, here are a few general propositions about risk-free rates that are worth keeping in mind:
Risk-free rates go with currencies, not countries or governments: You estimate a risk-free rate in Euros or dollars, not one for the Euro-zone or the United States. Thus, if you choose to analyze a Brazilian company in US dollars, the risk-free rate you should use is the US dollar risk free rate, not the rate on Brazilian US-dollar denominated bond. It follows, therefore, that the notion of a global risk-free rate, touted by some, is fantasy, and using the lowest government bond rate, ignoring currencies, as an estimate of this rate, is nonsensical.Investment returns should be currency-explicit and time-specific: Would you be okay with a 12% return on a stock, in the long term? That question is unanswerable, until you specify the currency in which you are denominating returns, and the time you are making the assessment. An investment that earns 12%, in Zambian Kwacha, may be making less than the risk-free rate in Kwachas, but one that earns that same return in Swiss Francs should be a slam-dunk as an investment. In the same vein, an investment that earns 12% in US dollars in 2023 may well pass muster as a good investment, but an investment that earned 12% in US dollars in 1980 would not (since the US treasury bond rate would have yielded more than 10% at the time).Currencies are measurement mechanisms, not value-enhancer or destroyers: A good financial analysis or valuation should be currency-invariant, with whatever conclusion you draw when you do your analysis in one currency carrying over into the same analysis, done in different currencies. Thus, switching from a currency with a high risk-free rate to one with a much lower risk-free rate will lower your discount rate, but the inflation differential that causes this to happen will also lower your cash flows by a proportional amount, leaving your value unchanged.No one (including central banks) cannot fight fundamentals: Central banks and governments that think that they have the power to raise or lower interest rates by edict, and the investors who invest on that basis, are being delusional. While they can nudge rates at the margin, they cannot fight fundamentals (inflation and real growth), and when they do, the fundamentals will win.YouTube Video
August 5, 2023
The Price of Risk: With Equity Risk Premiums, Caveat Emptor!
If you have been reading my posts, you know that I have an obsession with equity risk premiums, which I believe lie at the center of almost every substantive debate in markets and investing. As part of that obsession, since September 2008, I have estimated an equity risk premium for the S&P 500 at the start of each month, and not only used that premium, when valuing companies during that month, but shared my estimate on my webpage and on social media. In my last post, on country risk premiums, I used the equity risk premium of 5.00% that I estimated for the US at the start of July 2023, for the S&P 500. That said, I don't blame you, if are confused not only about how I estimate this premium, but what it measures. In fact, an article in MarketWatch earlier this year referred to the equity risk premium as an esoteric concept, a phrasing that suggested that it had little relevance to the average investor. Adding to the confusion are the proliferation of very different numbers that you may have seen attached to the current equity risk premium, each usually quoting an expert in the field, but providing little context. Just in the last few weeks, I have seen a Wall Street Journal article put the equity risk premium at 1.1%, a Reuters report put it at 2.2%, and a bearish (and widely followed) money manager estimate the equity risk premium to be negative. How, you may ask, can equity risk premiums be that divergent, and does that imply that anything goes? In this post, I will not try to argue that my estimate is better than others, since that would be hubris, but instead focus on explaining why these ERP differences exist, and let you make your own judgment on which one you should use in your investing decisions.
ERP: Definition and Determinants
The place to start this discussion is with an explanation of what an equity risk premium is, the determinants of that number and why it matters for investors. I will try to steer away from models and economic jargon in this section, simply because they do little to advance understanding and much to muddy the waters.
What is it?
Investors are risk averse, at least in the aggregate, and while that risk aversion can wax and wane, they need at least the expectation of a higher return to be induced to invest in riskier investments. In short, the expected return on a risky investment can be constructed as the sum of the returns you can expect on a guaranteed investment, i.e., a riskfree rate, and a risk premium, which will scale up as risk increases.
Expected Return = Risk free Rate + Risk Premium
Note that this proposition holds even if you believe that there is nothing out there that is truly risk free, which is the case when you worry about governments defaulting, though it does imply that you have cleaning up to do to get to a riskfree rate. Note also that expectations do not always pan out, and the actual returns on a risky investment can be much lower than the risk free rate, and sometimes sharply negative.
The risk premium that you demand has different names in different markets. In the corporate bond market, it is a default spread, an augmentation to the interest rate that you demand on a bond with more default risk. In the real estate market, it is embedded in a capitalization rate, an expected return used by real estate investors to convert the income on a real estate property into a value for that property. In the equity market, it is the equity risk premium, the price of risk for investing in equities as a class.

As you can see, every asset class has a risk premium, and while those risk premiums are set by investors within each asset class, these premiums tend to move together much of the time.
Determinants
Since the equity risk premium is a price for risk, set by demand and supply, it stands to reason that it is driven not only by economic fundamentals, but also by market mood. Equities represent the residual claim on the businesses in an economy, and it should come as no surprise that the fundamentals that determine it span the spectrum:
 My equity risk premium paper
Even a cursory examination of these fundamentals should lead you to conclude that not only will equity risk premiums vary across markets, providing an underpinning for the divergence in country risk premiums in my last post, but should also vary across time, since the fundamentals themselves change over time.
Market prices are also driven by mood and momentum, and not surprisingly, equity risk premiums can change, as these moods shift. In particular, equity risk premiums can become too low (too high) if investors are excessively upbeat (depressed) about the future, and thus become the ultimate receptacles for market hope and fear. In fact, one symptom of a market bubble is an equity risk premium that becomes so low that it is disconnected from fundamentals, setting up for an inevitable collision with reality and a market correction.
Why it matters
If you are a trader, an investor or a market-timer, and you are wondering why you should care about this discussion, it is worth recognizing that the equity risk premium is a central component of what you do, even if you have never explicitly estimated or used it.
Market Timing: When you time markets, you are making a judgment on how an entire asset class (equities, bonds, real estate) is priced, and reallocating your money accordingly. In particular, if you believe that stocks are over priced, you will either have less of your portfolio invested in equities or, if you are aggressive, sell short on equities. Any statement about market pricing can be rephrased as a statement about equity risk premiums; if you believe that the equity risk premium, as priced in by the market, has become too low (relative to what you believe is justified, given history and fundamentals), you are arguing that stocks are over priced (and due for a correction). Conversely, if you believe that the equity risk premium has become too high, relative again to what you think is a reasonable value, you are contending that stocks are cheap, in the aggregate. Stock Picker: When you invest in an individual stock, you are doing so because you believe that stock is trading at a price that is lower than your estimate of its value. However, to make this judgment, you have to assess value in the first place, and while we can debate growth potential and profitability, the equity risk premium becomes an input into the process, determining what you should earn as an expected return on a stock. Put simply, if you are using an equity risk premium in your company valuation that is much lower (higher) than the market-set equity risk premium, you are biasing yourself to find the company to be under (over) valued. A market-neutral valuation of a company, i.e., a valuation of the company given where the market is today, requires you to at least to try to estimate a premium that is close to what the market is pricing into equities.Corporate Finance: The role of the equity risk premium in determining the expected return on a stock makes it a key input in corporate finance, as well, because that expected return becomes the company's cost of equity. That cost of equity is then embedded in a cost of capital, and as equity risk premiums rise, all companies will see their costs of capital rise. In a post from the start of this year, I noted how the surge in equity risk premiums in 2022, combined with rising treasury bond rates, caused the cost of capital to increase dramatically during the course of the year.Put simply, the equity risk premiums that we estimate for markets have consequences for investors and businesses, and in the next section, I will look at ways of estimating it.Measurement
If the equity risk premium is a market-set number for the price of risk in equity markets, how do we go about estimating it? Unlike the bond market, where interest rates on bonds can be used to back out default spreads, equity investors are not explicit about what they are demanding as expected returns when they buy stocks. As a consequence, a range of approaches have been used to estimate the equity risk premium, and in this section, I will look at the pluses and minuses of each approach.
1. Historical Risk Premium
While we cannot explicitly observe what investors are demanding as equity risk premiums, we can observe what they have earned historically, investing in stocks instead of something risk free (or close). In the US, that data is available for long periods, with the most widely used datasets going back to the 1920s, and that data has been sliced and diced to the point of diminishing returns. At the start of every year, I update the data to bring in the most recent year's returns on stocks, treasury bonds and treasury bills, and the start of 2023 included one of the most jarring updates in my memory:
 Spreadsheet with historical data
It was an unusual year, not just because stocks were down significantly, but also because the ten-year treasury bond, a much touted safe investment, lost 18% of its value. Relative to treasury bills, stocks delivered a negative risk premium in 2022 (-20%), but it would be nonsensical to extrapolate from a single year of data. In fact, even if you stretch the time periods out to ten, fifty or close to hundred years, you will notice that your estimates of expected returns come with significant error (as can be seen in the standard errors). In much of valuation, especially in the appraisal community, historical risk premiums remain the prevalent standard for measuring equity risk premiums, and there are a few reasons. Perhaps, the fact that you can compute averages precisely gets translated into the delusion that these averages are facts, when, in fact, they are not just estimates, but very noisy ones. For instance, even if you use the entire 94-year time period (from 1928-2022), your estimate for the equity risk premium for stocks over ten-year treasury bonds is that it falls somewhere between 2.34% to 10.94%, with 95% confidence (6.64% ± 2* 2.15%). It is also true that the menu of choices that you have for historical equity risk premiums, from a low of 4.12% to a high of 13.08%, depending on then time period you look at, and what you use as a riskfree rate, gives analysts a chance to let their biases play out. After all, if your job is to come up with a low value, all you have to do is latch on to a high number in this table, claim that it is a historical risk premium and deliver on your promise. When using historical equity risk premiums, you are assuming mean reversion, i.e., that returns revert to historic norms over time, though, as you can see, those norms can be different, using different time periods. You are also assuming that the economic and market structure has not changed significantly over the estimation period, i.e., that the fundamentals that determine the risk premium have remained stable. For much of the twentieth century, historical equity risk premiums worked well as risk premium predictors in the United States, precisely because these assumptions held up. With China's rise, increased globalization and the crisis of 2008 as precipitating factors, I would argue that the case for using historical risk premiums has become much weaker.
2. Historical Returns-Based Forecasts
The second approach to using historical returns to estimate equity risk premiums starts with the same data as the first approach, but rather than just use the averages to make the estimates, it looks for time series patterns in historical returns that can be used to forecast expected returns. Put simply, this approach brings into the estimate the correlation across time in returns:

If the correlations across time in stock returns were zero, this approach would yield results similar to just using the averages (historical risk premiums), but it they are not, it will lead to different predictions. Looking at historical returns, the correlations start off close to zero for one-year returns but they do become slightly more negative as you lengthen your time periods; the correlation in returns over 5-year time periods is -0.15, but it is not statistically significant. However, with 10-year time horizon, even that mild correlation disappears. In short, while it may be possible to coax a predictive model using only historical stock returns, that model is unlikely to yield much in actionable predictions. There are sub-periods where the correlation is higher, but I remain skeptical of any ERP prediction model built around just the time series of stock returns.
In an extension of this approach, you could bring in a measure of the cheapness of stocks (PE ratios or earnings yields are the most common ones) into the historical return data and exploit the relationship (if any) between the two. If there is a relationship, positive or negative, between PE ratios and subsequent returns, a regression of returns against PE (or EP) ratios can be used to generate predictions of expected annual returns in the next year, next 5 years or the next decade. The figure below is the scatter plot of earnings to price ratios against stock returns in the subsequent ten years, using data from 1960 to 2022:

A regression using this data yields some of the lowest estimates of the ERP, especially for longer time horizons, because of the elevated levels of PE ratios today. In fact, at the current EP ratio of about 4%, and using the historical statistical link with long-term returns, the estimated expected annual return on stocks, over the next 10 years and based on this regression is:
Expected Return on Stocks, conditional on EP = .00254 + 1.4543 (.04) = .0607 or 6.07%ERP based on EP-based Expected Return = 6.07% - 3.97% = 2.10%It is worth remembering that the expected return predictions come with error, and the more appropriate use of this regression is to get a range for the expected annual return, which yields predictions ranging from 4% to 8%. Extending the regression back to 1928 increases the R-squared and results in some regressions that yield predicted stock returns that are lower than the treasury-bond rate, i.e., a negative equity risk premium, given the EP ratio today.
Note that the results from this regression just reinforce rules of thumb for market timing, based upon PE ratios, where investors are directed to sell (buy) stocks if PE ratios move above (below) a “fair value” band. Since those rules of thumb have yielded questionable results, it pays to be skeptical about these regressions as well, and there are three limitations that those who use it have to keep in mind.
First, with the longer time-period predictions, where the predictive power is strongest, the same data is counted multiple times in the regression. Thus, with 5-year returns, you match the EP ratio at the end of 1960 with returns from 1961 to 1965, and then the EP ratio at the end of 1961 with returns from 1962 to 1966, and so on. While this does not imply that you cannot run these regression, it does indicate that the statistical significance (R squared and t statistics) are overstated for the longer time horizons. In addition, the longer your time horizon, the more data you lose. With a 10-year time horizon, for instance, the last year that you can use for predictions is 2012, with the EP ratio in that year matched up to the returns from 2013-2022. Second, as is the case with the first approach (historical risk premiums), you are assuming that the structural model is stable and that there will be mean reversion. In fact, within this time period (1928 - 2022), the predictive power is far greater between 1928 and 1960 than it is betweeen 196 and 2022.Third, while these models tout high R-squared, the number that matters is the standard error of the predictions. Predicting that your annual return will be 6.07% for the next decade with a standard error of 2% yields a range that leaves you, as an investor, in suspended animation, since you face daunting questions about follow through: Does a low expected return on stocks over the next decade mean that you should pull all of your money out of equities? If yes, where should you invest that cash? And when would you get back into equities again?Proponents of this approach are among the most bearish investors in the market today, but it is worth noting that this approach would have yielded “low return” predictions and kept you out of stocks for much of the last decade.3. The Fed Model: Earnings Yield and ERP
The problem with historical returns approaches is that they are backward-looking, when equity risk premiums should be about what investors expect to earn in the future. To the extent that value is driven by expected future cash flows, you can back out an equity risk premium from current stock prices, if you are willing to make assumptions about earnings growth and cash flows in the future. In the simplest version of this approach, you start with a stable-growth dividend discount model, where the value of equity can be written as the present value of dividends, growing at a constant rate forever:

If you assume that earnings will stagnate at current levels, i.e., no earnings growth, and that companies pay out their entire earnings as dividends (payout ratio = 100%), the cost of equity can be approximated by the earnings to price ratio:

Alternatively, you can assume that there is earnings growth and that companies earn returns on equity equal to their costs of equity, you arrive at the same result:

In short, the earnings to price ratio becomes a rough proxy for what you can expect to earn as a return on stocks, if you are willing to assume no earnings growth or that firms generate no excess returns.
This is the basis for the widely used Fed model, where the earnings yield is compared to the treasury bond rate, and the equity risk premium is the difference between the two. In the figure below, you can see the equity risk premiums over time that emerge from this comparison, on a quarterly basis, from 1988 to 2023:
 Download quarterly data
As you can see, this approach yields some "strange" numbers, with negative equity risk premiums for much of the 1990s, one of the best decades for investing in stocks over the last century. It is true that the equity risk premiums have been much more positive in this century, but that is largely because the treasury bond rate dropped to historic lows, after 2008. As interest rates have risen over the last year and a half, with stock prices surging over the same period, the equity risk premium based on this approach has dropped, standing at 0.41% at the start of August 2023. Since this is the approach used in the Wall Street Journal article, it explains the ERP being at a two-decade low, but I do find it odd that there is no mention that this approach yielded negative premiums in the 1980s and 1990s. In a variant, the Wall Street Journal article also looks at the difference between the earnings yield and the inflation-protected treasury rate, which yields a higher value for the ERP, of about 3%, but suffers from many of the same issues as the standard approach.
My problem with the earnings yield approach to estimating equity risk premiums is that the assumptions that you need to make to justify its use are are at war with the data. First, while earnings growth for US stocks has been negative in some years, it has been positive every decade for the last century, and there are no analysts (that I am aware of) expecting it be zero (in nominal terms) in the future. Second, assuming that the return on equity is equal to the cost of equity may be easy on paper, but the actual return on equity for companies in the S&P 500 was 19.73% in 2022, 17.04% over the last decade and has been higher than the cost of equity even in the worst year in this century (9.35% in 2008). If you allow for growth in earnings and excess returns, it is clear that earnings yield will yield too low a value for the ERP, because of these omissions, and will yield negative values in many periods, making it useless as an ERP estimator for valuation.
4. Implied ERP
I start with the same general model for value that the earnings yield approach does, which is the dividend discount model but change three components

In August 2023, this model would have yielded an equity risk premium of 4.44% for the S&P 500, using trailing cash flows from the last twelve months as a starting point, estimating aggregate earnings for the companies from analyst estimates, for the next three years, and then scaling that growth down to the risk free rate, as a proxy for nominal growth in the economy, after year 5:
 Download implied ERP spreadsheet
To reconcile my estimate of the equity risk premium with the earnings yield approach, you can set the earnings growth rate to zero and the cash payout to 100%, in this model, and you will find that the equity risk premium you get converges on the 0.41% that you get with the earnings yield approach. Adding growth and excess returns to the equation is what brings it up to 4.44%, and I believe that the data is on my side, in this debate. To the critique that my approach requires estimates of earnings growth and excess returns that may be wrong, I agree, but I am willing to wager that whatever mistakes I make on either input will be smaller than the input mistakes made by assuming no growth and no excess returns, as is the case with the earnings yield approach.
Picking an Approach I prefer the implied equity risk premium approach that I just described, as the best estimate of ERP, but that may just reflect my comfort with it, developed over time. Ultimately, the test of which approach is the best one for estimating equity risk premium is not theoretical, but pragmatic, since your estimate of the equity risk premium is used to obtain predictions of returns in subsequent periods. In the figure below, I highlight three estimates of equity risk premiums - the historical risk premium through the start of that year and the EP-based ERP (EP Ratio minus the T.Bond Rate) and the implied equity risk premiums, at the start of the year:

The historical risk premium is stable, but that stability is a reflection of a having a long tail of historical data that keeps it from changing, even after the worst of years. The implied and EP-based ERP approaches move in the same direction much of the time (as evidenced in the positive correlation between the two estimates), but the latter yields negative values for the equity risk premium in a large number of periods.
Ultimately, the test of whether an equity risk premium measure works lies in how well it predicts future returns on stocks, and in the table below, I try to capture that in a correlation matrix, where I look at the correlation of each ERP measure with returns in the next year, in the next 5 years and in the next 10 years:
 Download data
None of the approaches yield correlations that are statistically significant, for stock returns in the next year, but the implied ERP and historical ERP are strongly correlated with returns over longer time periods, with a key difference; the former moves with stock returns in the next ten years, while the latter moves inversely. While that correlation lies at the heart of why I use implied ERP in my valuations as my estimate of the price of risk in equity markets, I am averse to using it as a basis for market timing, for the same reasons that I cautioned you on using the EP ratio regression: the predictions are noisy and there is no clear pathway to converting them into investment actions. To see why, I have summarized the results of a regression of stock returns over the next decade against the implied ERP at the start of the period, using data from 1960 to 2022:
 Download data
You can see, from the scatter plot, that implied ERPs move with stock returns over the subsequent decades, but that movement is accompanied by significant noise, and that noise translates into a wide range around the predicted returns for stocks. If you are a market timer, you are probably disappointed, but this type of noise and prediction errors is what you should expect to see with almost any fundamental, including EP ratios.
Conclusion I hope that this post has helped to convince you that the equity risk premium is central to investing, and that even if you have never used the term, your investing actions have been driven by its gyrations. I also hope that it has given you perspective on why you see the differences in equity risk premium numbers from different sources. With that said, here are some thoughts for the road that can help you in future encounters with the ERP:There is a true, albeit unobservable, ERP: The fact that the the true equity risk premium is unobservable does not mean that it does not exist. In other words, the notion that you can get away using any equity risk premium you want, as long as you have a justification and are consistent, is absurd. So, whatever qualms you may have about the estimation approaches that I have described in this post, please keep working on your own variant to get a better estimate of the ERP, since giving up is no an option.Not all estimation approaches are created equal: While there are many approaches to estimating the equity risk premium, and they yield very different numbers, some of these approaches have more heft, because they offer better predictive power. Picking an approach, such as the historical risk premium, because its stability over time gives you a sense of control, or because everyone else uses it, makes little sense to me.Your end game matters: As I noted at the start of this post, the equity risk premium can be used in a multitude of investment settings, and you have to decide, for yourself, how you will use the ERP, and then pick an approach that works for you. I am not a market timer and estimate an equity risk premium primarily because I need it as an input in valuation and corporate finance. That requires an approach that yields positive values (ruling out the EP-based ERP) and moves with with stock returns in subsequent periods (eliminating historical ERP). Market timers face a more acid test: If you are using equity risk premiums or even earnings yield for market timing, recognize that having a high R-squared or correlation in past returns will not easily translate into market-timing profits, for two reasons. First, the past is not always prologue, and market and economic structures can shift, undercutting a key basis for using historical data to make predictions. Second, even if the correlations and regressions hold, you may still find it hard to profit from them, since you (and your clients, if you are a portfolio manager) may be bankrupt, before your predictions play out. Statistical noise (the standard errors on your regression predictions) can create havoc in your portfolios, even if it eventually gets averaged out.
YouTube Video
Data LinksHistorical returns on Stocks, Bonds and Real Estate: 1928 - 2022Earnings to Price Ratios and Dividend Yields, by Quarter: 1988 Q4- 2023 Q2Implied ERP from 1960 to 2022: Annual DataERP and Stock Returns: 1960 to 2022
Spreadsheet
Implied ERP Spreadsheet for August 2023PapersEquity Risk Premiums (ERP): Determinants, Estimation and Implications- The 2023 EditionJuly 25, 2023
Country Risk: A July 2023 Update!
I have looked at country risk, in all its dimensions, towards the middle of each year, for the last decade, for many reasons. One is curiosity, as political and economic crises roll through regions of the world, roiling long-held beliefs about safe and risky countries. The other is pragmatic, since it is almost impossible to value a company or business, without a clear sense of how risk exposure varies across the world, since for many companies, either the inputs to or their production processes are in foreign markets or the output is outside domestic markets. Coca Cola is a US company, in terms of history and incorporation, but it generates a significant portion of its revenues from the rest of the world. Royal Dutch may be a UK (or Dutch) company, in terms of incorporation and trading location, but it extracts its oil and gas from some of the riskiest parts of the world. Since country risk is multidimensional and dynamic, my annual country risk update runs to more than a hundred (boring) pages, but I will try to summarize what the last year has brought in this post.
Drivers of Country Risk
What makes some countries riskier than others to operate a business in? The answer is complicated, because everything has an effect on risk, starting with the political governance system (democracy, dictatorship or something in between), the extent of corruption in the system, the legal system (and its protection for property rights) and the presence or absence of violence in the country (from wars within or without). The table below, which I have used in prior updates, captures the mail drivers of country risk:

Things get even more complicated when you recognize that these drivers are often correlated with, and drive, each other. Thus, a country that is ravaged by war and violence is more likely to have a weak legal system and be corrupt. Furthermore, all of these risk exposures are dynamic, and change over time, as governments change, violence from internal or external forces flares up. As you assess these factors, you can see very quickly that country risk is a continuum, with some countries exposed less to it than others. It is for that reason that we should be cautious about discrete divides between countries, as is the case when we categorize countries into developed and emerging markets, with the implicit assumption that the former are safe and the latter are risky. To the extent that divide is not just descriptive, but also drives real world investment, both companies and investors may be misallocating their capital, and I will argue for finer delineations of risk.
1. Democracy across the Globe
If your focus stays on economic risk, the question of whether democracies or authoritarian regimes are less risky for businesses to operate in depends in large part on whether these businesses are more unsettled by day-to-day continuous risk, which is often the case with democracies, where the rules can change when new governments gets elected, or by discontinuous risk, which can lie dormant for long periods, but when it does occur, it is larger and sometimes catastrophic, in an authoritarian government. Assessing freedom and democracy in countries is a fraught exercise, with both political and regional biases playing out, and that should be kept in mind when you look at the heat map that shows the results of the Economist's measures of democracy, by country and region, in 2022, as well as trend lines across time:
 Source: Economist Intelligence Unit (EIU)
While the global aggregate value for 2022 is very similar to the value in 2021, there has been a significant drop off since 2016, at least according to this measure. In 2022, North America and Western Europe scored highest on the democracy index, and Middle East and Africa scored the lowest.
In my view, the question of whether businesses prefer the continuous change (or, in some cases, chaos) that characterizes democracies or the potential for discontinuous and sometimes jarring change in authoritarian regimes has driven the debate of whether a business should feel more comfortable investing in India, a sometimes chaotic democracy where the rules keep changing, or in China, where Beijing is better positioned to promise continuity. For three decades, China has won this battle, but in 2023, the battleground seems to be shifting in favor of India, but it is still too early to make a judgment on whether this is a long term change, or just a hiccup.
2. Violence across the Globe
When a country is exposed to violence, either from the outside or from within, it not only exposes its citizens to physical risk (of assault or death), but also makes it more difficult to run businesses within its borders. That risk can show up as costs (of buying protection or insurance) or as uninsurable risks that drive up the rates of return investors and businesses need to make, in order to operate. Again, there are subjective judgments at play in these measures, but the map below gives you 2023 scores for peace scores, with lower (higher) scores indicating less (more) exposure to violence.
 Source: Vision of Humanity
Iceland and Denmark top the list of most peaceful countries, but in a sign that geography is not destiny, Singapore makes an appearance on that list as well. On the lease peaceful list, it should come as no surprise that Russia and Ukraine are on the list, but Sub-Saharan Africa is disproportionately represented.
3. Corruption across the Globe
Corruption is a social ill that manifests itself as a cost to every business that is exposed to it. As anyone who has ever tried to get anything done in a corrupt setting will attest, corruption adds layers of costs to routine operations, thus become an implicit tax that companies pay, where the payment instead of going to the public exchequer, finds its way into the pockets of intermediaries. Transparency International measures corruption scores, by country, across the world and their 2022 measures are in the map below:
 Transparency International
Much of Western Europe, Australia & New Zealand and Canada/United States fall into the least corrupt category, but corruption remains a significant concern in much of the rest of the world. While it easy to attribute the corruption problem to politicians and governments, it is worth noting that once corruption becomes embedded in a system, it is difficult to remove, since the structure evolves to accommodate it. Put simply, a system where the rule-makers, regulators and bureaucrats get paid a pittance (on the assumption that they will be supplement their pay with side payments) to sign off on contracts that are worth billions will inevitably create corruption as a side cost.
4. Legal Protection across the Globe
To operate a business successfully, you need a legal system that enforces contractual obligations and protects property rights, and does so in a timely manner. When a legal system allows contracts and legal agreements to be breached, and property rights to be violated, with no or extremely delayed consequences, the only businesses that survive will be the ones run by lawbreakers, and not surprisingly, violence and corruption become part of the package. The Property Rights Alliance measures the protection offered for property rights (intellectual, physical), with higher (lower) scores going with better (worse) protection, and their most recent update (from 2022) is captured in the picture below:
 Source: Property Rights Alliance
By now, you can see the point about the correlation across the various dimensions of country risk, with the parts of the world (North America, Europe, Australia and Japan) that have the most democratic systems and the least corruption scoring highest on the legal protection scores. Conversely, the regions (Africa, large portions of Asia and Latin America) that are least democratic, with the most violence and corruption, have the most porous legal systems.
Measures of Country Risk
With the long lead in on the dimensions of country risk, we can now turn to the more practical question of how to convert these different components of risk into country risk measures. We will start with a limited measure of the risk of default on the part of governments, i.e., sovereign default risk, before expanding that measure to consider other country risks, in political risk scores.
1. Default Risk
Businesses and individuals that borrow money sometimes find themselves unable to meet their contractual obligations, and default, and so too can governments. The difference is that government or sovereign default has much greater spillover effects on all entities that operate within its borders, thus creating business risks. We start with an assessment of sovereign ratings, a widely accessible and hotly contested, of government default risk and then move on to market-based measures of this risk in the form of sovereign default spreads.
a. Sovereign Ratings
The most widely used measures of sovereign default risk come from a familiar source for default risk measures, the ratings agencies. S&P, Moody's and Fitch, in addition to rating companies for default risk, also rate governments, and they rate them both on local currency debt, as well as foreign currency debt. The reason for the differentiation is simple, since countries should be less likely to default, when they borrow in their domestic currencies, than when they borrow in a foreign currency. The table below summaries the sovereign local currency ratings for countries in June 2023, from S&P and Moody's:
 Local Currency Ratings for countries (Some UAE emirates have ratings that are independent of the ratings for the UAE, because they issue their own sovereign debt)
The ratings scheme mirrors the one used to rate companies, with the key difference being at the Aaa (AAA) rating, with a sovereign getting that rating viewed as having no default risk, whereas a corporate with that rating still has some. If you are wondering why there should be any default risk when governments borrow in a domestic currency, since these governments should be able to print money to pay off debt, the answer is that money-printing debases a currency and given a choice between currency debasement and default, many countries choose to default. The figure backs up this proposition:
Local Currency Ratings for countries (Some UAE emirates have ratings that are independent of the ratings for the UAE, because they issue their own sovereign debt)
The ratings scheme mirrors the one used to rate companies, with the key difference being at the Aaa (AAA) rating, with a sovereign getting that rating viewed as having no default risk, whereas a corporate with that rating still has some. If you are wondering why there should be any default risk when governments borrow in a domestic currency, since these governments should be able to print money to pay off debt, the answer is that money-printing debases a currency and given a choice between currency debasement and default, many countries choose to default. The figure backs up this proposition:

Note that while countries are less likely to default on local currency than foreign currency bonds, the default rates in the former remain substantial. In addition, the good news, if you are a user of sovereign ratings, is that they clearly are correlated strongly with ratings, with higher default rates for lower-rated sovereigns. I know that there are many who have issues with the ratings agencies, but I do think that the conflict of interest story, where ratings agencies attach higher ratings to entities, because they get paid to rate them, is overdone, and especially so with sovereign ratings (where the revenue streams are paltry). In my view, the biggest problem with ratings agencies is not that they are biased, but that they take too long to adjust ratings to changes in a country and that they sometimes underrate or overrate regions of the world, because of their histories. Consequently, Latin American countries have to work harder to improve their ratings, or sustain current ratings, than the US or European countries, which get a bye, because they do not have a history of default.
b. Sovereign CDS Spreads
One of the advantages of a market-based measure is that the market price reflects investor perceptions of risk at the moment. Sovereign Credit Default Swaps (CDS) offer a market-based measure of default risk, since investors buy these swaps as protection against default on government bonds. When the sovereign CDS market came into being a few decades ago, there were only a handful of countries that were traded, but the market has expanded, and there are traded credit default swaps on almost 80 countries in June 2023. The graph below shows the sovereign CDS levels, by country:
 Source: Bloomberg (July 2023 data)
There are three things to note, as you browse these numbers. The first is that these are dollar spreads (though a Euro CDS market exists as well), and thus are most suited for use with dollar-denominated government bonds. The second is that what comprises default in the sovereign CDS market may not coincide with investor definitions of default , though there are approaches that can be used to back out the likelihood of default from a CDS value. The third is that there are no countries with traded CDS that have zero risk of default, at least according to the sovereign CDS market. Consequently, I have also computed a version of the sovereign CDS spread that is net of the US CDS (on the assumption that default risk is zero in the US, a debatable proposition after the recent debt ceiling debate). Is a sovereign CDS spread a better measure of default risk than a sovereign rating? The answer is mixed. It is true that a sovereign CDS spread gives you a more updated measure of default risk, since it is market-set, but as with all market-based measures, it comes with far more volatility and overshooting than a ratings-based spread, and it is available for only a subset of countries. My suggestion is that for countries where recent political or economic events would lead you to believe that sovereign rating is dated, you should switch to using sovereign CDS spreads.
2. Risk Scores
The advantage of default spreads is that they provide an observable measure of risk that can be easily incorporated into discount rates or financial analysis. The disadvantage is that they are focused on just default risk, and do not explicitly factor in the other risks that we enumerated in the last section. Since these other risks are so highly correlated with each other, for most counties, it is true that default risk becomes an reasonable proxy for overall country risk, but there are some countries where this is not the case. Consider portions of the Middle East, and especially Saudi Arabia, where default risk is not significant, since the country borrows very little and has a huge cash cushion from its oil reserves. Investors in Saudi Arabia are still exposed to significant risks from political upheaval or unrest, and may prefer a more comprehensive measure of country risk.
There are many services, including the World Bank and the Economist, who offer comprehensive country risk scores, and the map below includes composite country risk scores from Political Risk Services in June 2023:
 The pluses and minuses of comprehensive risk scores are visible in this table. In addition to capturing risks that go beyond default, Political Risk Services also measures risk scores for frontier markets (like Syria, Sudan and North Korea), which have no sovereign ratings. The minuses are that the scores are not standardized; for instance, PRS gives its highest scores to the safest countries, whereas the Economist gives the lowest scores to the safest countries. In addition, the fact that the country risk is measured with scores may lead some to believe that they are objective measures of country risk, when, in fact, they are subjective judgments reflecting what each service factors into the scores, and the weights on these factors. Just to illustrate the contradictions that can result, PRS gives Libya a country risk score that is higher (safer) than the scores it gives United States or France, putting them at odds with most other services that rank Libya among the riskiest countries in the world.
Equity Risk across Countries
Default risk measures how much risk investors are exposed to, when investing in bonds issued by a government, but when you own a business, or the equity in that business, your risk exposure is not just magnified, but also broader. For three decades, I have wrestled with measuring this additional risk exposure and converting that measurement into an equity risk premium, but it remains a work in progress.
To estimate the equity risk premium, for most countries I start with default spreads, either based on the sovereign ratings assigned by the ratings agencies, or from the market, in the form of sovereign CDS spreads. To account for the fact that equities are riskier than bonds, I scale the standard deviation of an emerging market equity index (S&P Emerging BMI) to an emerging market government bond ETF ), and use this ratio (1.42 in my July 2023 update) and apply this scalar to the default spread, to arrive at a country risk premium. Adding that country risk premium on to the premium that I estimate for the S&P 500 (which was 5.00% at the start of July 2023, and is my measure of a mature market premium), yields the total equity risk premium for a country:
 To provide an example, consider India, which with a sovereign rating of Baa3, has a default spread of 2.35% in July 2023. Multiplying this default spread by the scalar (1.42) and adding to the equity risk premium for the S&P 500 results in an equity risk premium of 8.33% for India. India ERP = Implied ERP for S&P 500 + Default spread for India * Scalar for Equity Risk = 5.00% + 2.35% (1.42) = 8.33%It is worth noting that using the sovereign CDS spread for India of 1.42% would have resulted in a lower equity risk premium for India, at 7.02%. Using the ratings-based default spreads as starting points, I estimate the equity risk premiums for all countries rated by either S&P and Moody's in the picture below. (For the many people who will point to their country's geographical boundaries being misrepresented on this map, please cut me some slack. This map is purely a device to summarize equity risk premiums, by countries, not arbitrate on where borders should go. Suffice to say that if you are operating a business in a part of the world that is contested by two countries, your risk levels are in the danger zone, no matter where in the world you are.)
 Download spreadsheet with data
You will notice that there are countries that are not rated (NR) that have equity risk premiums attached to them. For these frontier markets, I used the PRS score for the country as a starting point, found other (rated) countries with similar PRS scores, and extrapolated an equity risk premium. The caveat, though, is that these equity risk premiums are only as good as the PRS scores that goes into them, and you can see the effect in Libya, which if PRS is right, is a green (low risk) standout in a region (North Africa) of red.
Caveats and Questions
I started publishing equity risk premiums about 30 years ago, and while data sources have become richer and more complete, the core approach that I use for the estimation has remaining stable. That said, there is no intellectual firepower or research behind these numbers, since I am letting the default ratings agencies and risk measurement services carry that weight. I am not a country risk researcher, and I try not to let my personal views alter the numbers that emerge from the analysis, since that would open the door to my biases. I will use three countries in the latest update to illustrate my point:
Saudi Arabia: As I noted earlier, using default spreads as my starting point can result in understating the risk premium for countries like Saudi Arabia, which score low on default risk but high on other risks. Libya: As indicated in the last section, the equity risk premium for Libya, an unrated country, is entirely based upon the country risk score from PRS. That country risk score is surprisingly high (indicating low risk) and it results in an equity risk premium that is low, relative to other countries in the region. China: China has a high sovereign rating and a low sovereign CDS spread, indicating that investors in Chinese government bonds don't see much default risk in the country. In the aftermath of a Beijing crackdown on Chinese tech giants and talk of a trade war between China and the US, the perception seems to be that China has become a riskier place to invest. That may or may not be true, but looking at how Chinese equities are priced, trading still at some of the highest multiples of earnings in the world, investors in equity markets don't seem to share that view.With all three of these countries, I chose not to change the numbers that emerged from the data, but if you have strong views on these countries or others, nothing is stopping you from replacing my numbers with yours.Company Hurdle Rates
This post has already become much longer than I intended it to be, but I want to end by bringing these equity risk premiums down to the company level, and examining how they play out in hurdle rates, to be used in investment analysis by companies and valuation by investors.
The Currency Question
In my discussion so far, you will notice that I have stayed away from talking about currency risk in my equity risk premium discussion and from currency choices in investment analysis. I have my reasons.
I know that the currency choice is the source of angst for many analysts, and I think unnecessarily so. Your choice of currency will affect your cash flows and your discount rates, but only because each currency brings it's own expectations of inflation, with higher inflation currencies leading to higher growth rates for cash flows and higher discount rates.
The mechanism that allows for the discount rate adjustment to reflect currency is the risk free rate, with currencies with higher expected inflation carrying higher risk free rates. In a downloadable dataset linked at the end of this post, I estimate riskfree rates in global currencies, based upon the US T.Bond rate as the riskfree rate in US dollars) and differential inflation. To provide an example, using the IMF's estimate of expected inflation for 2023-28 of 3% for the US and 13.50% for Egypt, and building on the US treasury bond rate of 3.80%. the riskfree rate in Egyptian pounds is 14.38%. Riskfree Rate in EGP = (1+ US T.Bond Rate) (1 + Exp Infl in Egypt) (1+ Exp Infl in US) -1
To the extent that currency risk adds to the operating risk of a company, it is, in my view, already embedded in the equity risk premiums that I have computed in the last section. After all, countries with unstable governments, plagued by war and corruption, also have the most unstable currencies. The other reason to tread lightly with currency risk is that for investors with global portfolios, it becomes diversifiable risk, as some companies benefit as a currency strengthens or weakened more than expected and others lose for exactly the same reason.My advice to you when you make a currency choice for your analysis is that you pick a currency that you are comfortable working with, but then make sure that you stay consistent with that currency in all of your estimates. Thus, if you choose to value a Russian company in Euros, rather than rubles, make sure that your growth rates reflect inflation in the Euro zone, but that you risk premiums and real growth reflect its Russian operations.= (1.038)* (1.135/1.03) -1 = .1438 or 14.38%)
Exposure to Country Risk
For much of my valuation journey, the status quo in valuation has been to look at where a company is incorporated to determine its risk exposure (and the equity risk premium to use in assessing a hurdle rate). While I understand that where you are incorporated and traded can have an effect on your risk exposure, I think it is dwarfed by the risk exposure from where you operate. A company that is incorporated in Germany that gets all of its revenues in Turkey, is far more exposed to the country risk of Turkey than that of Germany. In the picture below, I contrast the traditional country-of-incorporation based risk measure with my alternative, where equity risk premiums come from where you operate:
 We can debate how best to measure operating risk exposure, since it can come from both where you sell your products and services (revenues) as well as where you produce those products and services.
 There are implications not just for investors, but for companies. For investors, an operating-risk perspective will mean that there are some emerging market companies that others may perceive as risky, simply because of their country of incorporation, but are much safer, because they get their revenues from much safer parts of the world. Embraer, the Brazilian aerospace company, and Tata Consulting Services, an Indian software company, would be good examples. Conversely, there are developed market companies that are significantly exposed to country risk, either because of where they produce (Royal Dutch) or where they sell their products and services (Coca Cola). For multinational companies, an operating risk perspective will imply that there can be no one hurdle rate across geographies, since a project in Turkey should require a higher equity risk premium (and hurdle rate) than an otherwise similar project in Germany.
Conclusion
It is ironic that a post that was meant to shorten and summarize a long paper has itself stretched to become the equivalent of a long paper, and I apologize. I do hope that you get a chance to read the paper or at least review my country risk measures in this post, since there is significant room for improvement. I don't have all the answers, and I probably never will, but progress is incremental, and each year, I hope that I can add a tweak or a component that will move me in the right direction. Also, please don’t take any of these numbers personally. In short, if you feel that I have overestimated the risk in your country and given it an equity risk premium that you believe is undeservedly high, it is not because I do not like you and your country. It is entirely Moody’s fault for giving your country too low a rating, and you should take it up with them!
YouTube Video
Country Risk Paper
Country Risk: Determinants, Measures and Implications - The 2023 EditionCountry Risk Data
Democracy, Violence, Corruption and Legal System Scores, by Country, in July 2023Sovereign Ratings and CDS Spreads for Countries in July 2023Equity Risk Premiums, by Country, in July 2023Currency DataExpected Inflation and Riskfree RatesAswath Damodaran's Blog

- Aswath Damodaran's profile
- 725 followers

