
Aswath Damodaran's Blog, page 7
January 26, 2023
Tesla in 2023: A Return to Reality, The Start of the End or Time to Buy?
I am not much of a car person and view cars primarily as a mode of transportation. I drive a 2010 Honda Civic, a perfectly serviceable vehicle that is never going to get oohs and ahas from onlookers, but I feel no urge to value Honda. I don't own a Tesla, and have only driven someone else's Tesla, but as readers of this blog know, I valued Tesla for the first time in 2014, and I keep returning to the scene of the crime. One reason is that no matter what you think of Elon Musk and Tesla, they are never boring, and interesting companies are much more fun to value than boring ones. Another is that when valuing companies, I am, in addition to valuing a company to see if it is fairly priced, interested into the broader insights about business and valuation that emerge from the company. Thus, almost everything I know and practice, when valuing young and start-up companies, I learned in the process of valuing Amazon in the 1990s. In the same vein, I have learned a great about the power of disruption and the capacity of a young company (and its founder) to change the way a large, inertia-bound business is run, in the process of valuing Tesla. As I will note in more detail in the post, I have been wrong, and sometimes hopelessly so, in some of my earlier valuations of Tesla, but that does not stop me from trying anew. It is also true that Tesla is a company that attracts strong and very divergent views, and consequently, I get more pushback on my valuations of Tesla than on any other company, but as in last few attempts with this company, I have structured my valuation to allow you to incorporate your disagreement. My last valuation of Tesla was in November 2021, towards its market peak, and given its steep fall from grace, in conjunction with Elon Musk's Twitter experiment, it is time for a revisit.
Tesla: A Revolution Unfolds
In evaluating Tesla's climb to domination, at least in market value terms, of the automobile business, it is worth remembering how impervious this business was to disruption in the decades leading up to Tesla's arrival. In the United States and Europe, domestic competitors to the established players did not get far, largely brought down by requirements of large capital investments and a distribution system built to favor established players. When Tesla was founded in 2006, with a stated intent of building electric cars, the traditional auto companies were quick to dismiss it as a potential competitor. Tesla's rise is summarized in the graph below, where we look at the company's revenues and earnings over time, with earnings measured in gross and operating terms, and EBITDA capturing operating cash flows:
 2022 numbers updated to reflect 4th quarter earnings call on 1/25/23
Between 2010 and 2020, Tesla grew revenues from $117 million to $31.5 billion, a remarkable achievement by itself, but COVID gave the company a boost, as revenue have increased about 250% in the 2020-22 time-period. Just as impressively, the company finally started delivering on its promise of profitability, going from barely making money in 2019 to an operating margin of 16.57% in 2022. While the company still has skeptics, it is no longer a niche player in a big market, and has moved the sector closer to its vision than the other way around.
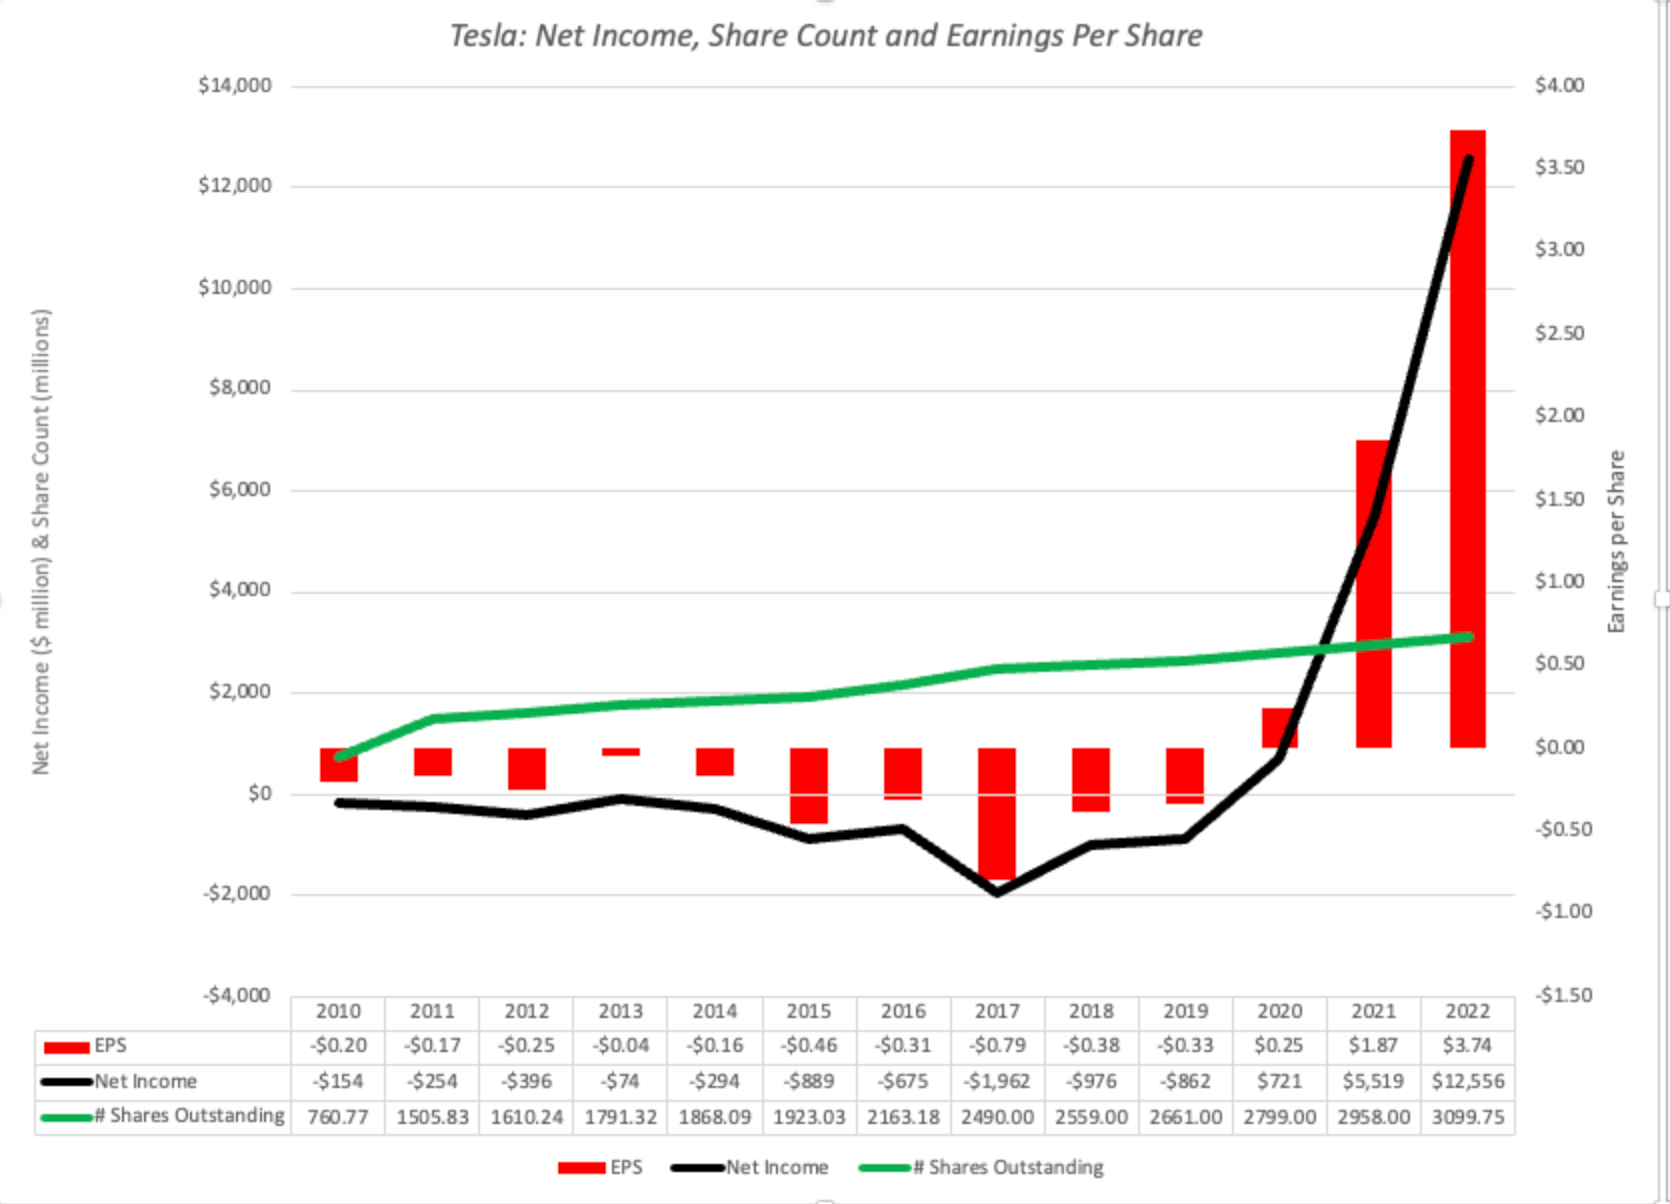
In its early years, Tesla was dependent on equity issuances for funding growth investments, and its liberal use of options to reward management (and especially Elon Musk) opened it up to criticism. Since both affect share count, I look at the company's net income and earnings per share over its public life:
 2022 numbers updated to reflect 4th quarter earnings call on 1/25/23
It is true that the number of shares outstanding has quadrupled over the company's lifetime, but the good news is that the net income increases in recent years have outstripped the share count increase, with earnings per share increasing from 25 cents per share in 2020 to $3.74 per share in 2022.
My Tesla History
I have valued Tesla multiple times over the last decade, and while I have been wrong at each turn, I have tried to learn from my mistakes. In this section, I will begin by looking at the evolution of my Tesla value from 2013 to 2021, and then present my updated valuation of the company.
My Tesla Valuations over Time
My first valuation of Tesla was in 2013, and I found the company significantly overvalued then, and in hindsight, there were three errors that I made in that valuation that I systematically found myself repeating in my early valuations.
 With the 3:1 stock split since, his value per share has to be divided by three to make it comparable to today's priceI argued that I could see almost no plausible pathway to get to Tesla's market cap then and that I believed that the company was over valued.
A Valuation Update
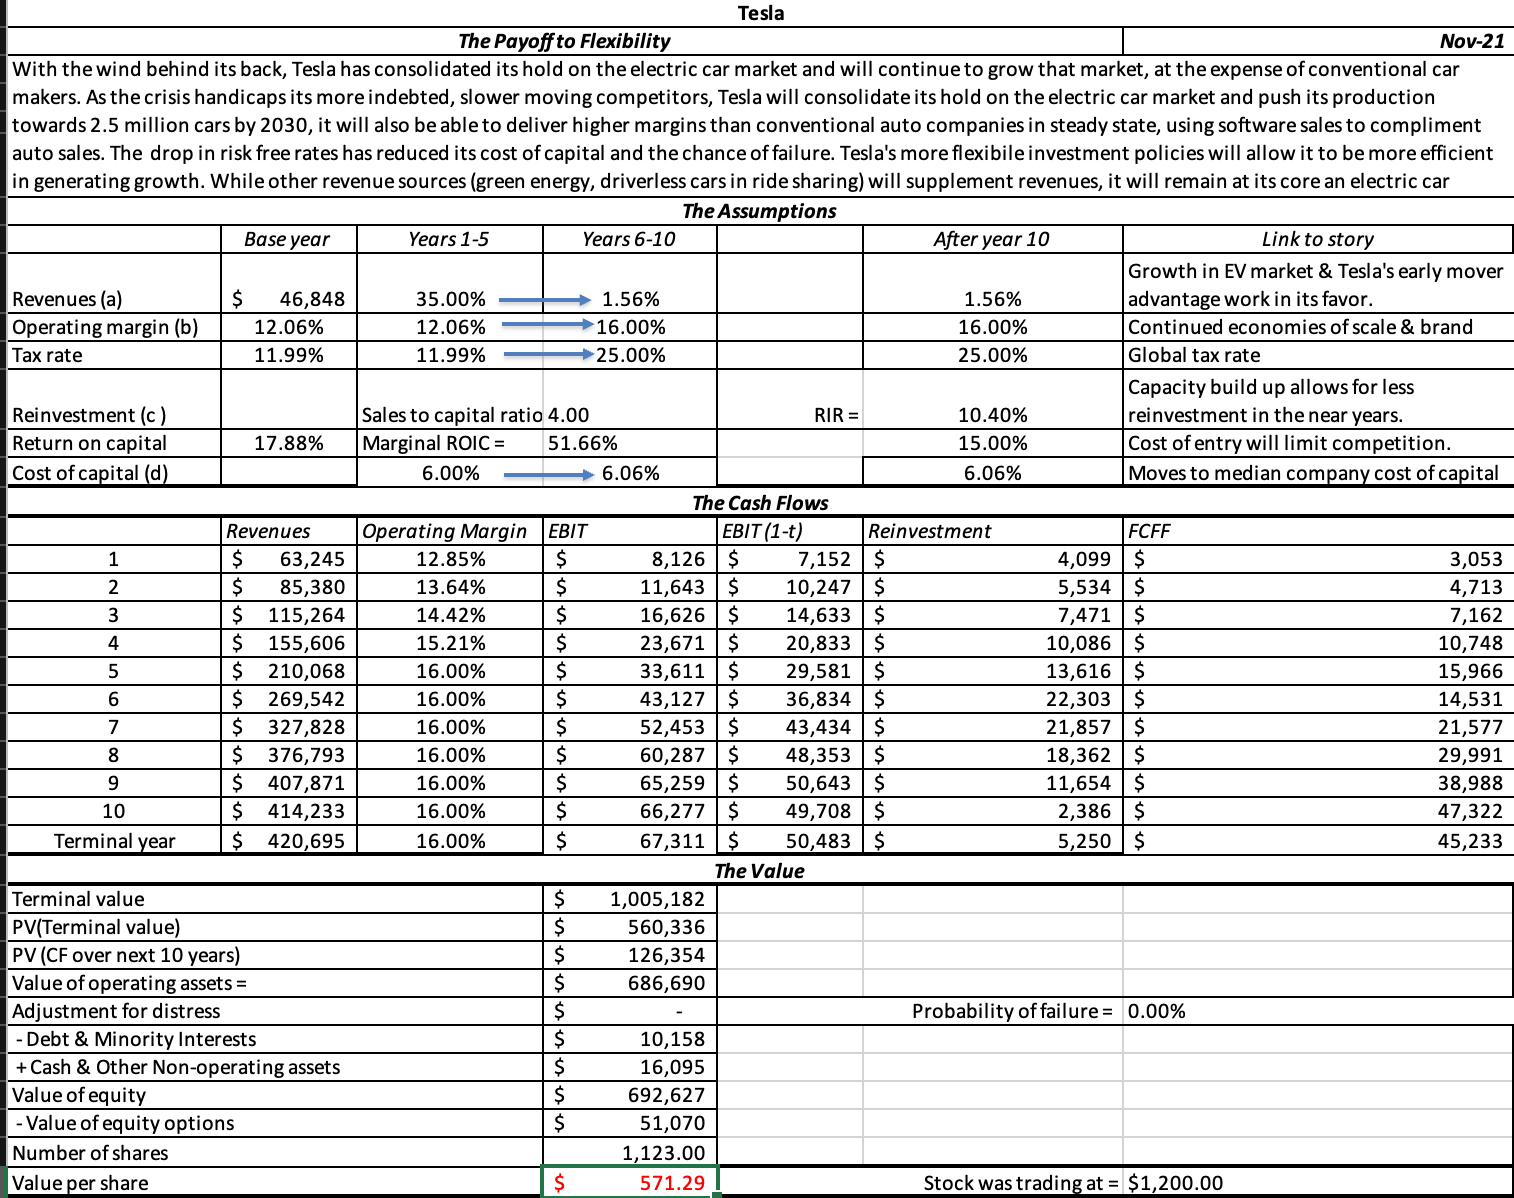
It is a year and two months since my last valuation of Tesla, and it has been an eventful period for the company, Elon Musk, its founder/CEO and the overall market:
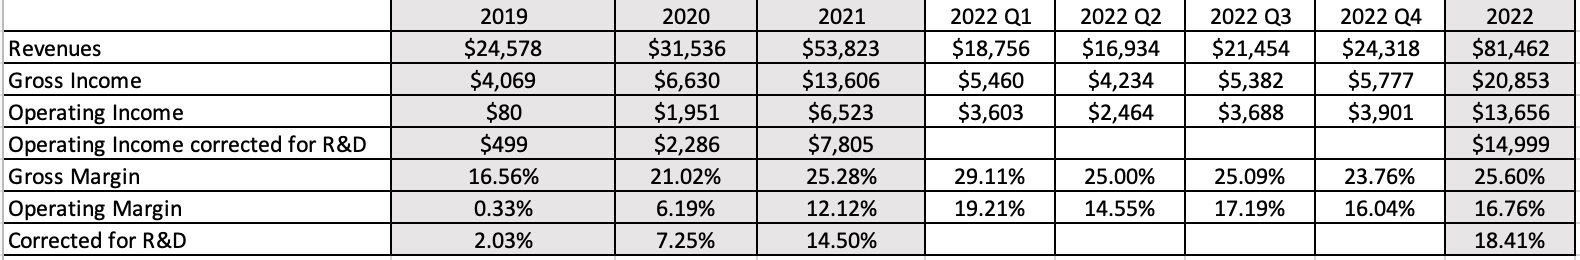
 Until recently, even Tesla critics would have conceded that Musk, in spite of his numerous faults, was a net positive to the company. In the last year, even Tesla advocates have starting questioning that belief, partly because Musk's Twitter adventures seem to be taking up much of his time, leaving a perceived vacuum at the helm of the company. That may be an overreaction, and I am not quite ready to come to the conclusion that he is net negative for the company, but it is undeniable that the net Musk effect being negative is not being dismissed. There is also the question of whether Musk will come under pressure to sell Tesla shares to meet demands from Twitter lenders, and how that will play out in markets.The Market: The US equity market in January 2023 looks very different from the market at the start of 2022. As I noted in my last post, rising risk free rates and equity risk premiums have pushed up the costs of equity for all companies, and Tesla is not only no exception but is perhaps even more exposed as an above-average risk company. In short, the cost of capital of 6% that I used in November 2021, higher than the median cost of capital of 5.6% for US companies then, no longer is defensible, as the median cost of capital has climbed toward 9.6%.With these changes in mind, I revisited my valuation of Tesla from November 2021 and made the following changes: First, I left my end revenues for Tesla back to $400 billion, still a reflection of my view that electric cars will become the dominant part of the auto market, and that Tesla still has not only a lead in that market, but will have a significant market share. In fact, Tesla's revenues of $81 billion in 2022 makes this assumption more plausible, not less so Note that this will still give Tesla more revenues than the largest automobile companies in the world, and will require that they make a transition, at least on core models, to a mass market product (with prices to match). I know that Tesla does and can sell more than just cars (energy solutions and software), but these are businesses that, at best, can add tens of billions of dollars to the mix, not hundreds.In my November 2021 valuation, I had chosen a target operating margin of 16%, higher than the then-prevailing margin of 12.06%. In 2022, Tesla delivered an operating margin of 16.76% before correcting for R&D, and 18.41% after the correction, though its performance varied widely across the four quarters:
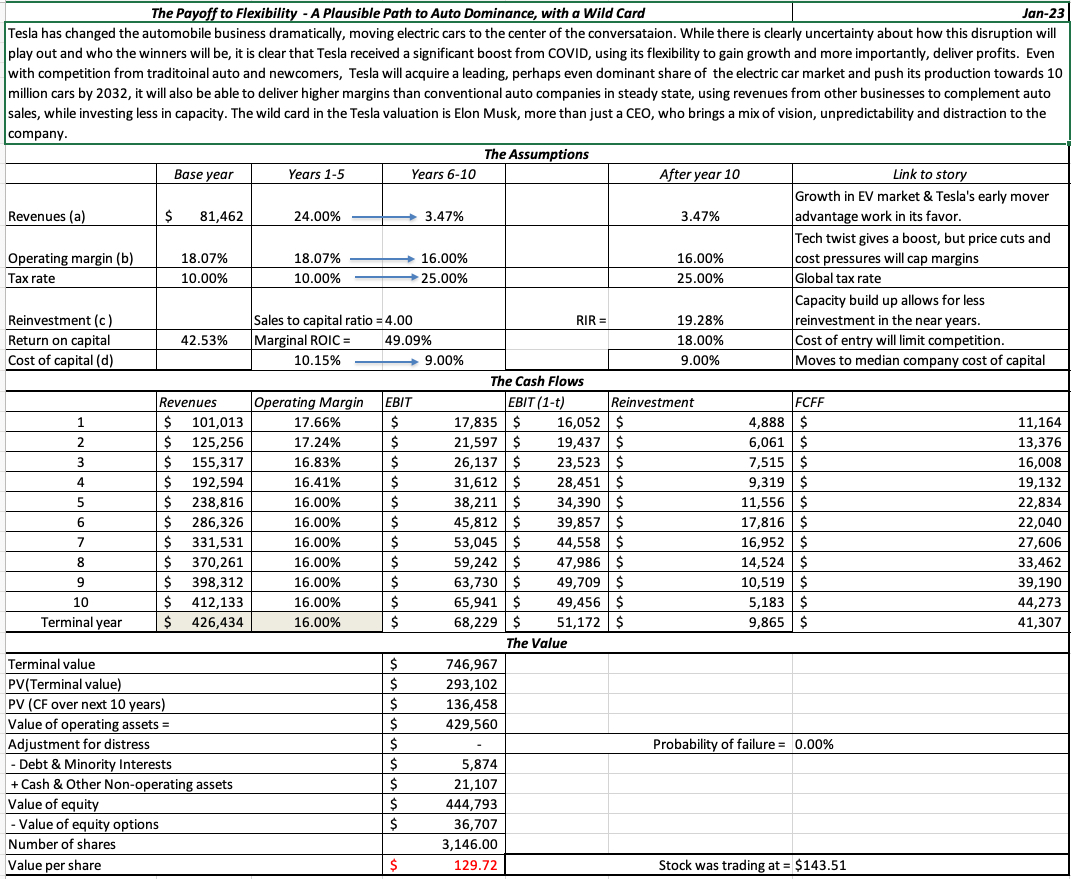
While Tesla's profitability in 2022 has been a pleasant surprise, I have left the target margin at 16% because the forces that pushed the operating margin back down to 16% in the last quarter of 2022, which include price cuts and increasing production costs at their plants, will only intensify as Tesla seeks out market share. There is a niche market story that can be used to justify higher operating margins at Tesla, but that story would be incompatible with it having revenues of $400 billion.Third, my cost of capital for Tesla has jumped to 10.15%, reflecting a world of higher interest rates and risk premiums:
 Download spreadsheet
This is still an upbeat story, but the value per share that I get with these updated inputs is about $130, a mark down from my November 2021 valuation, and about 10% below the stock price ($143 on January 25, 2023)
As with my previous valuations of Tesla, I am open about the fact that my Tesla story and inputs come with uncertainties, significant and potentially value-changing. Rather than wring my hands about these mistakes or be defensive about them, I chose to run a simulation, replacing my point estimates for revenue growth, operating margins and cost of capital, with distributions to arrive at the following value distribution

Note that my median value is slightly lower than my base case value, mostly because there are more potential upside values than downside value. The bottom line, though, is that the median value, at $120, confirms that the stock is overvalued, at least based on my estimates, at least at its stock price of $143. However, unlike November 2021 or at other points in Tesla's life, the stock is very much in play, and anyone who bought the stock on 12/27/22, when the price hit $109, would have got a reasonable bargain. I am writing this post, in the aftermath of Tesla's earnings report, and the stock is up in the after market, perhaps in reaction to the fact that the company beat its earnings per share forecast, the least meaningful part of any earnings report. To be honest, there is nothing that I see in that report, which is still barebones, that would lead to fundamentally reassess Tesla's value, but clearly the earnings per share beat and the "news is not as bad as it could have been" effect is clearly playing out in Tesla's pricing.
Lessons for Investing
When valuing companies, it is important that you focus on the task at hand, which is to value a company and make an investment judgment on whether you should buy or sell the company, but it is also productive to look for general lessons that you can use in valuing other companies in the future. The Tesla valuation offers me a chance to examine bigger questions including how much a personality (Musk in the case of Tesla) can affect value, when the laws of business catch up with even the most successful disruptors and finally, and most depressingly, how politics has entered investing and business decisions in ways that we will come to regret.
1. Personality-driven Companies
In entertainment, sports, politics and business, we live in a personality-driven world, where individuals are given more attention than institutions. This is not a new phenomenon, but social media has furthered this trend, by giving influential people platforms and megaphones to reach tens of millions of followers. Some of the highest profile corporations in the last decade have tied their business stories to their founders, making it difficult to separate one from the other. In many cases, this has helped, not hurt, these companies, as Jack Ma drew investors and customers to Alibaba with his enthusiasm and energy, and no one sold Tesla to customers and investors better than Elon Musk. In both cases, though, we are discovering that there is a downside to personality-driven companies, since as human beings, these personalities come with good and bad qualities. There is no doubt in my mind that Elon Musk has enough vision to power a dozen companies, but he is also easily distracted and sometimes eccentric, but that is the package that drew people to the company a dozen years ago, when the company was started, that engineered its ascent to trillion-dollar market cap status, just a couple of years ago, and is now, at least in the eyes of some, weighing down the company.
Good founders find ways to build businesses that outlast them, as Bill Gates did at Microsoft and Jeff Bezos at Amazon, but that required them to set aside egos and to overcome their desire for control. With Tesla, I still believe that Musk's vision is critical, but it is essential for Tesla's long term success that he takes two actions. The first is to stop being the spokesperson for the company on all things small and large, and allow others in the company to find their voices. The second is to either build a management team that can run the company without him, if that team does not exist, or if it does, to give more visibility and front-stage status to the members of that team. I will wager that many investors in Tesla would be hard pressed to name its CFO or others in its top ranks, and that is an indication of how completely Musk has dominated the Tesla conversation.
2. The Universal Laws of Business and Economics
When looking at businesses, it is worth remembering the business rules that have always governed success and failure, and recognize that while there are some companies that can deviate from these rules for a period of time, they eventually find themselves subject to them. I capture these business rules in what I call my valuation triangle, shown below:

Put simply, most businesses that want to grow faster have to accept that this higher growth will come with more risk (because it will require entering riskier geographies or marks segments), will need more investment in capacity (to be able to deliver on that growth) and often require accepting lower operating margins (because you may have to cut prices to sell more). For most of the last decade, Tesla has seemed to be impervious to these rules, showing a capacity to deliver revenue growth with rapidly rising margins in a competitive electric car business, and doing so with far less reinvestment than other automobile companies.
That said, though, there are indications that the company, while still delivered wondrous results, is finding itself coming back to earth. The recent report that the company plans to cut prices for its cars in the United States may be a transitory change in policy, but it is more likely a reflection of the reality that customers, for whatever reasons, are now willing to at least look at other carmaker's offerings, if the price is right. In the same vein, the challenges that Tesla is facing in its manufacturing plants and with supply chains are familiar problems that all manufacturing companies face, and reflect the fact that it it Tesla no longer a niche company with absolute pricing power, selling to a fanatically loyal customer base. My guess is that the stories, while more negative than positive, will even out over time, and that Tesla will be able to stay ahead of its competitors, but for those investors and analysts who are used to Tesla posting super normal performance, it may take time to stop treating normal performance as a negative surprise.
3. Everything is political
In a world where where you shop, to where you eat and even which sports teams you cheer on depend on which side of the political divide you fall on, is it any surprise that politics is now affecting business and investing choices as well? It is one reason why I have argued against bringing ESG into companies and investing, because there is almost no social issue that an ESG-measuring service can defensibly bring into a score, without a backlash. In the case of Tesla, the politics of the moment are undeniably an issue, and I would argue that where your political views will have more of an effect on whether you think Tesla is under or over valued than any of its operating numbers. It is amusing to see Tesla advocates become adversaries overnight, mostly because their politics have diverged from Musk's, and Tesla opponents become its defenders, because they are in political agreement with Musk. As should be clear from my many posts on Tesla, I fall in the muddled middle when it comes to Musk. I believe that he is a visionary, not so much because Tesla is at the cutting edge of technology, but because he has changed the automobile business and our driving choices fundamentally. There are qualities that I admire in him, and qualities that I do not, but I think that as a society, we are better off with him than without him. That said, I would like to think that my decisions on whether to buy or sell Tesla will be unaffected by my personal views on Musk, but that may be just my delusion speaking.
YouTube Video
Spreadsheet links
Valuation (DIY) of Tesla in November 2021Valuation (DIY) of Tesla in January 2023

January 21, 2023
Data Update 2 for 2023: A Rocky Year for Equities!
It is the nature of stocks that you have good years and bad ones, and much as we like to forget about the latter during market booms, they recur at regular intervals, if for no other reason than to remind us that risk is not an abstraction, and that stocks don't always win, even in the long term. In 2022, we needed that reminder more than ever before, especially after markets came roaring back from the COVID drop in 2020 and 2021. While there are many events during 2022, some political and some economic, that one can point to as the reason for poor stock returns, it is undeniable that inflation was the driving force behind the market correction. In this post, I will begin by chronicling the damage done to equities during 2022, before putting the year in historical context, and then examine how developments during the year have affected expectations for the future. I will follow up by looking at the mechanics that connect stock prices to inflation, and examine why the damage from higher inflation can vary across companies and sectors.
Stocks: The What?
We invest in equities expecting to earn more than we can make on risk free or guaranteed investments, but the risk in equities is that actual returns can deviate from expectations. In some years, those deviations work to our benefit and in others, it can hurt us, and 2022, unfortunately, fell into the latter column. In this section, I will begin with a deconstruction of stock returns in 2022 and the year's place in stock market history. I will then provide a template for estimating expected returns on equities, and examine how expected returns changed during the course of the year.
Actual Returns
Your returns on equities come in one of two forms. The first is the dividends you receive, while you hold stocks, a cash flow stream that provides a measure of stability to investors who seek it. The other, and less predictable component, is the price change, which in good years adds to the return as a price appreciation, and in bad years, often overwhelms dividends to deliver negative returns.
The Year in Review
At the start of 2022, the S&P 500 was at 4766.18, up from 3756.07 at the start of that year. During the course of 2022, the index was staggered by political events, with Russia's invasion of Ukraine upending global economies, and by inflation, which entered the year high, and continued on that path through the course of the year. The graph below shows the S&P 500 at the end of each month, from December 31, 2021 to December 31, 2022, and the resulting monthly returns:

Aggregating over the entire year, the index declined 19.42% in 2022, and while the dividends during the course of the year rose, the dividend yield of 1.41% provided only a minor offset, resulting in total returns of -18.01% on the S&P 500 for the year:
 I know that this is US-centric and large-cap oriented and I will cover returns in other geographies and across broader classes of stocks in my next few posts, but suffice to say, that in this year, there were no sectors or geographies that were spared.
And in historical context
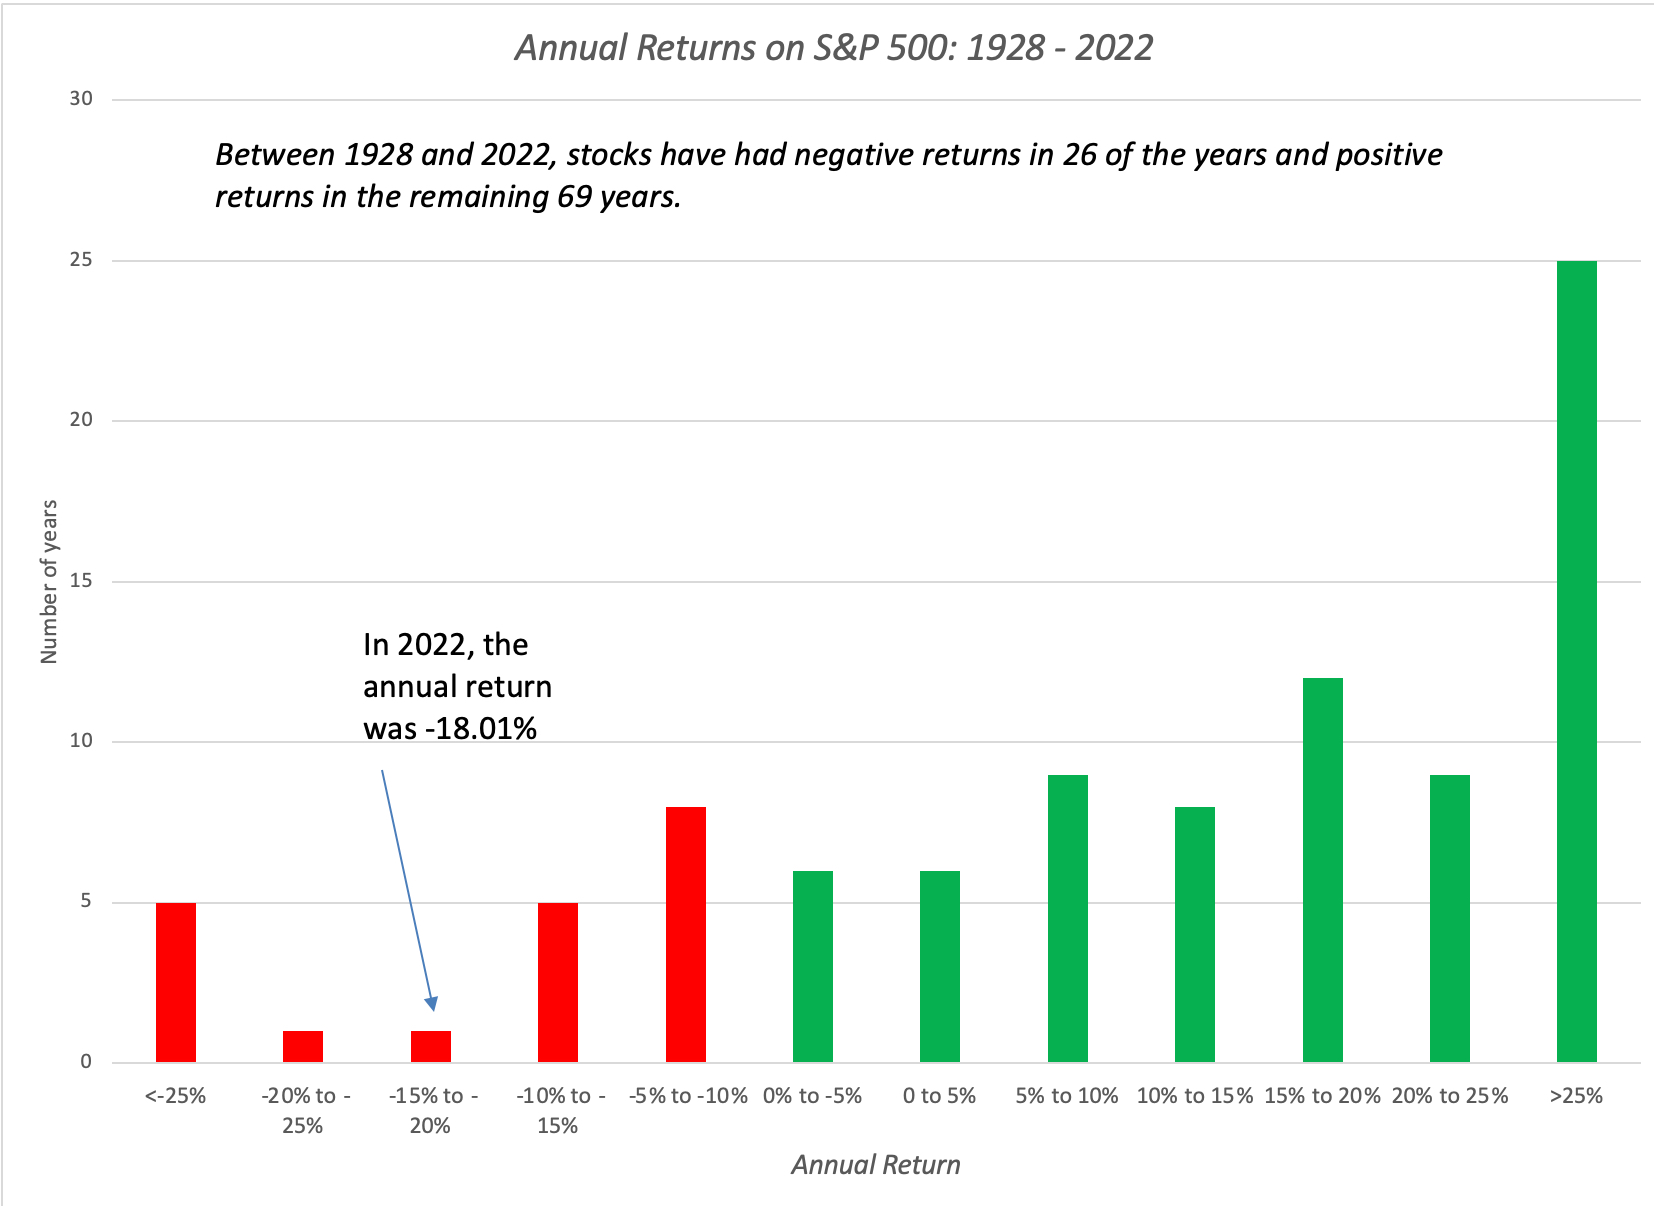
It is undeniable that 2022 was a bad year for stocks, but in historical context, how bad a year was it? I maintain a database of historical returns on stocks, bonds, bills and other asset classes on my webpage, and I looked at the annual returns, by year, starting in 1928 through 2022 for US stocks. In the graph below, I look at the distribution of annual returns over those 95 years, paying special attention to the negative years:
 S&P 500 officially came into existence in 1957, but we filled in earlier years using stock return data
As you can see, it is not uncommon for stocks to have negative years, but the returns in 2022 of -18.01% put them at the tail end of the historical distribution. In the table below, I look at how 2022 ranks in terms of bad years over the 1928 - 2022 time period:
 In nominal terms, i.e., before taking into account inflation, 2022 ranks as the seventh worst year, over the 95-year time period, and in real terms, it moves up to being the sixth worst year, with real returns of -23.48%. No matter how you slice it, there is no denying that 2022 was the worst year for US equity investors since 2008, and the magnitude of the damage is even more staggering, if you consider it in market value terms. During the course of 2022, US equities collectively lost $11.6 trillion in market capitalization, but for balance, it is also worth noting that US equities are still holding on to a gain of $6.9 trillion on their market capitalization at the end of 2019. Given that we endured a pandemic, multiple political crises and wars in the three years since, that is almost a miracle.
Expected Returns
Markets are driven by expectations, and while expectations for the future can be affected by what has happened in the past, they are still worth exploring. After a year of being pummeled by markets, what are investors pricing stocks to make in 2023 and beyond? And will they be disappointed or delighted by what the year delivers? Those are the questions that investors have to answer today and I will try to provide my perspective in this section.
Actual vs Expected Returns
As you saw in the previous section, actual returns on stocks can be negative, and significantly negative, in some periods, and those negative returns can sometimes extend into decades. Those who invested in the Nikkei at its peak on December 29, 1989, have spent the decades since trying to get back to that level. The notion that stocks always win in the long term is a dangerous one, and while those pushing it claim to have the data on their side, it is worth remembering that the use of US data to make this case is statistically flawed. The US was one of the most successful of global equity markets of the twentieth century, and to use its historical record as the basis for all equity investment in the future strikes me as wrong headed.
That said, when investors buy equities, it would be both irrational and illogical to settle for expected returns that are less than what you can earn on risk free or guaranteed investments, though behavioral finance suggests that both irrationality and illogic are persistent human traits. The premium that investors demand over and above the risk free rate is the equity risk premium, and practitioners in finance have wrestled with how best to estimate that number, since it is not easily observable (unlike the expected return on a bond which manifests as a current market interest rate).
a. Historical Equity Risk Premium
The conventional wisdom, at least as taught in business schools and practiced by appraisers, is that the only practice way to estimate equity risk premiums for the future is to use equity risk premiums earned in the past. Thus, historical risk premiums are viewed as the best estimates for the future, though analysts disagree not only about how far back in time they should go, whether to compare stock returns to T.Bill or T.Bond returns and even on how to compute the historical average return (arithmetic versus geometric averages). The graph and table below provide my estimates of the historical equity risk premiums in the US market:
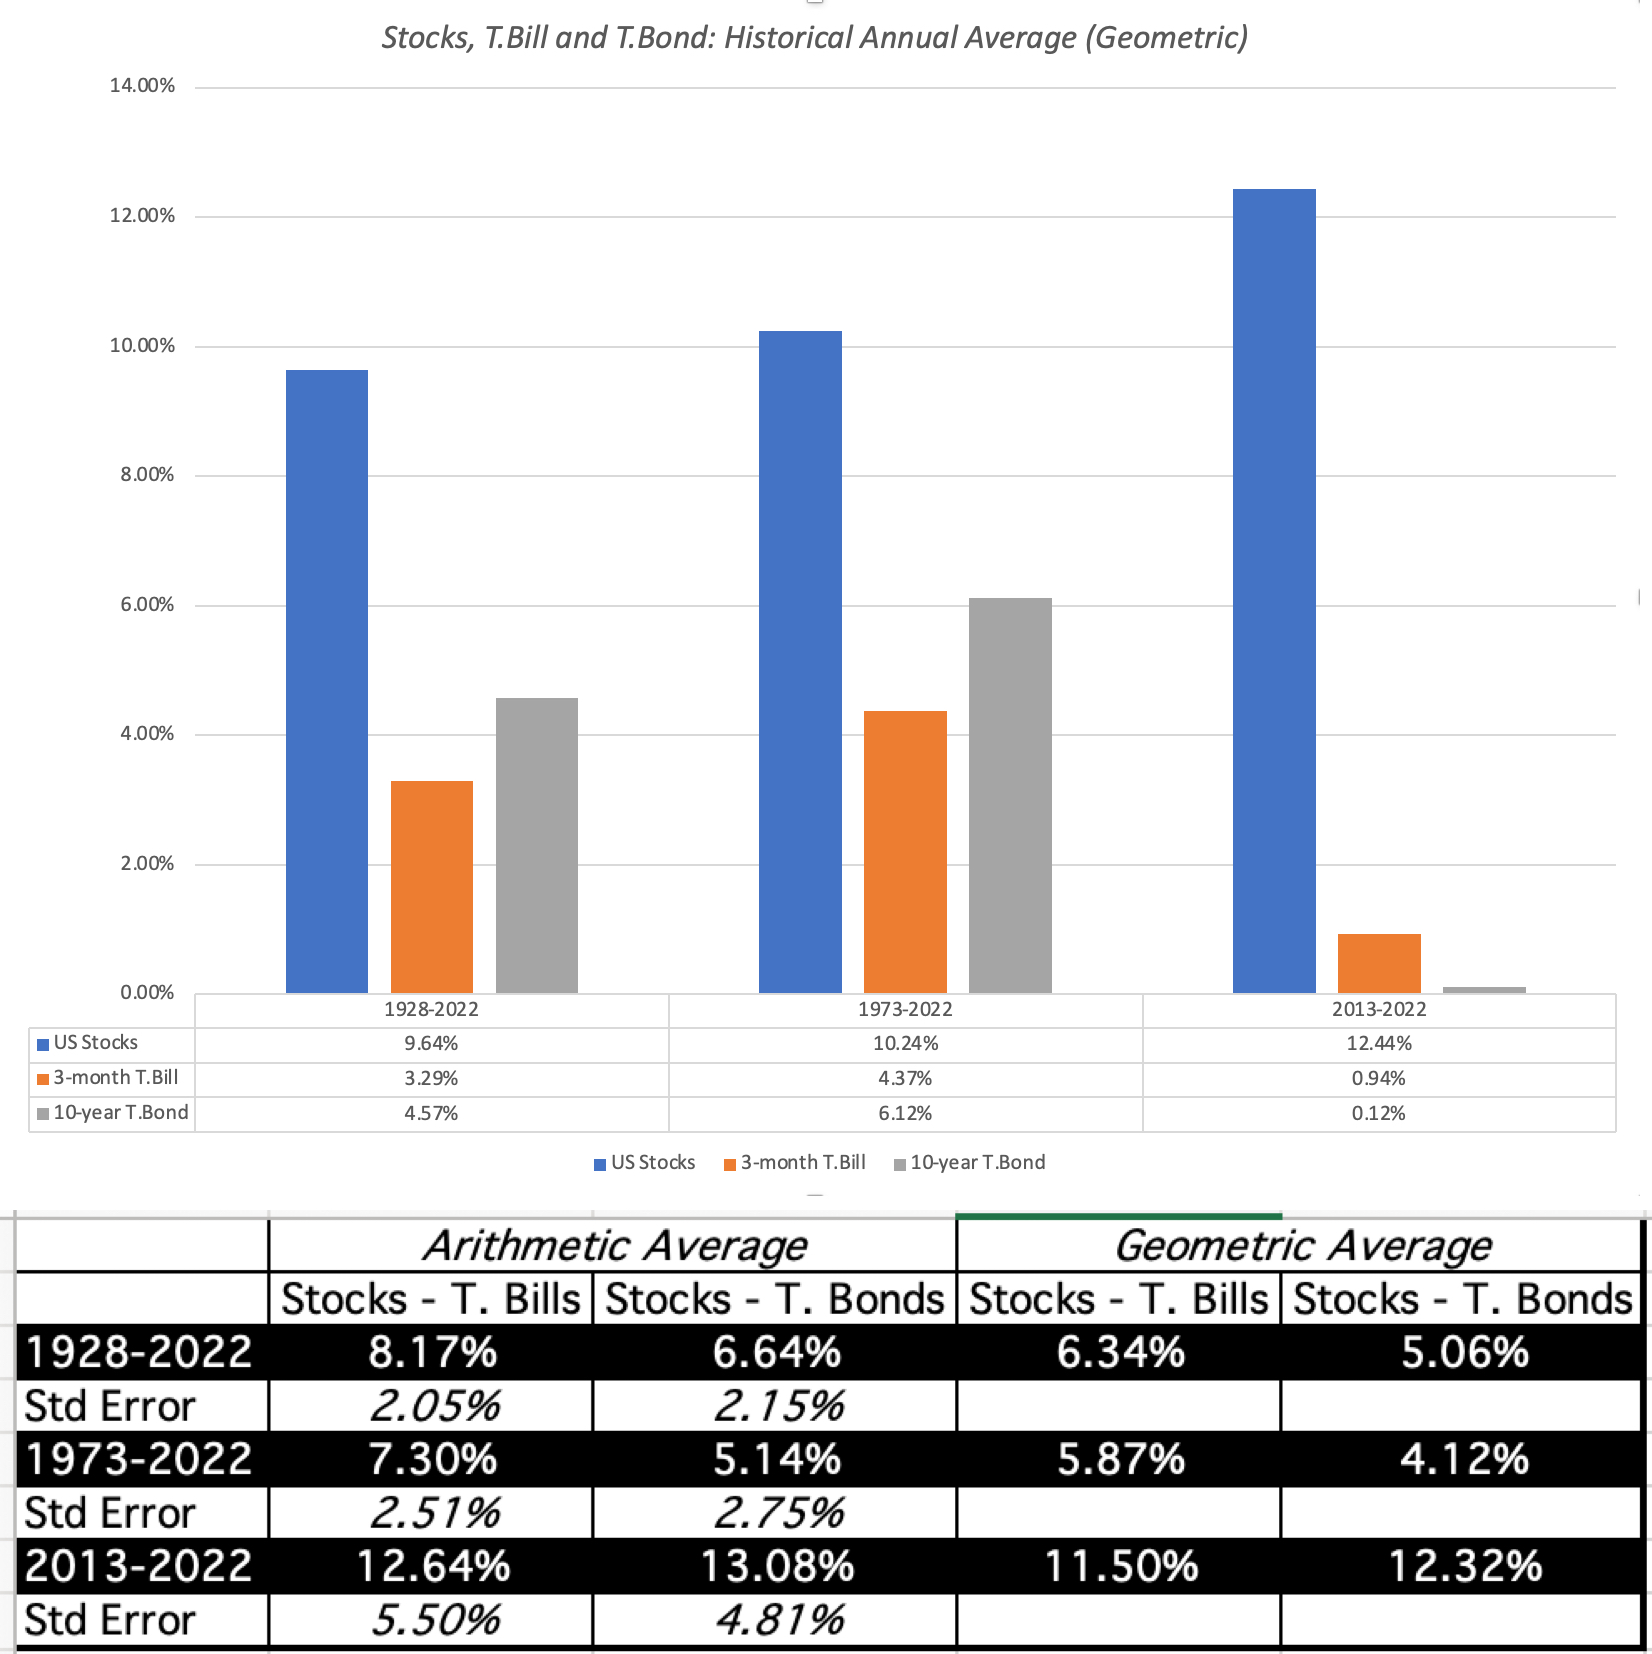 As you can see, I arrive at premiums ranging from 4.12% to 13.08%, depending upon my estimation choices on time period, treasury rate used and averaging approach, but I don't use any of these numbers as my estimate for the future for two reasons. The first is that the use of historical risk premiums is predicated on the belief that the future will look like the past, and the world, in all its dimensions, has changed dramatically over the last few decades. The second is that even if you are comfortable with assuming mean reversion, the estimates from the past are extremely noisy (have large standard errors), with the premium from 1928 to 2022 having a standard error of 2.15%. In effect, even with that long period, the best I can offer, if you are looking for an equity risk premium for stocks over T.Bonds is a range so wide (2.34% - 10.94%, i.e., the average plus or minus two standard errors) that it is not useful
Implied Expected Returns
There is another approach to estimating expected returns on stocks, and equity risk premiums, and it is forward-looking. It too requires estimate for inputs, but the range of error is magnitudes smaller than with historical premiums. In this approach, I draw on a technique used to compute the yield to maturity on a bond, the discount rate that makes the present value of cash flows on the bond (coupons and face value) equal to the price of the bond, and extend it to equities. To illustrate, I estimate this implied equity risk premium for the S&P 500 at the start of 2023, using the index level as the price that I pay on the index and using market estimates of earnings and dividends/buybacks on the index for the next five years and beyond.

As with the yield to maturity for a bond, I solve for the discount rate (IRR) that makes the present value of cashflows on the index equal to the level of the index. At the start of 2023, by my calculations and with analyst estimates of earnings, I estimate an expected return of 9.82%. which when you net out the T.Bond rate that day results in an implied equity risk premium of 5.94%. There are clearly input estimates that you can take issue with, especially on earnings and cashflows. Thus, if you assume that analysts are over estimating earnings and/or that companies will return less of these earnings to investors in the form of dividends and buybacks, the estimated equity risk premium will decrease, and if you assume that growth will be stronger than forecast, the equity risk premium will rise. In this spreadsheet, you can see that making different assumptions on these fronts yields equity risk premiums ranging from 4.83% to about 6%, a much narrower range than from historical risk premiums.
In historical context
In my first data post, I noted the increase in equity risk premiums during 2022 from 4.24% at the start of 2022 to 5.94% at the start of 2023. I posited that any debate about whether the market, as it stands now, is fairly, under or over valued is really one about whether the equity risk premium at the start of 2023 is too high (in which case, the market is under valued) or too low (in which case, it is overvalued). To answer that question, and address the question of where the expected return of 9.82% stands in historical context, I report the expected returns and equity risk premiums for the S&P 500 from 1960 to 2022:
 At 5.94%, the implied equity risk premium is closer to top of the range of historical risk premiums, but the most striking feature of 2022 is that the expected return on stocks, at 9.82%, is now at its highest level since 1995.
 Stocks: The So What?
It is worth noting that in valuation, demanding a higher expected return depresses value today, and the increase in expected returns over 2022 is therefore consistent with the decline in stock prices during the year. In fact, the drop in stock prices of 20% is mild, given the surge in expected returns during the course of the year. There is another reading of this expected return that ties into investment and growth, where the expected return on stocks is the cost of equity that companies need to clear to make investments. In short, an average-risk project with a return on equity of 7%, which would have passed the investment test at the start of 2022, because it was greater than the cost of equity of 5.75%, prevailing at the time, would not pass muster at the start of 2023.
The effects of a higher equity risk premium are also not uniform across all stocks, with higher risk stocks seeing much greater rises in their costs of equity than lower risk stocks. The table below provides the cost of equity distribution across US companies at the start of 2023:
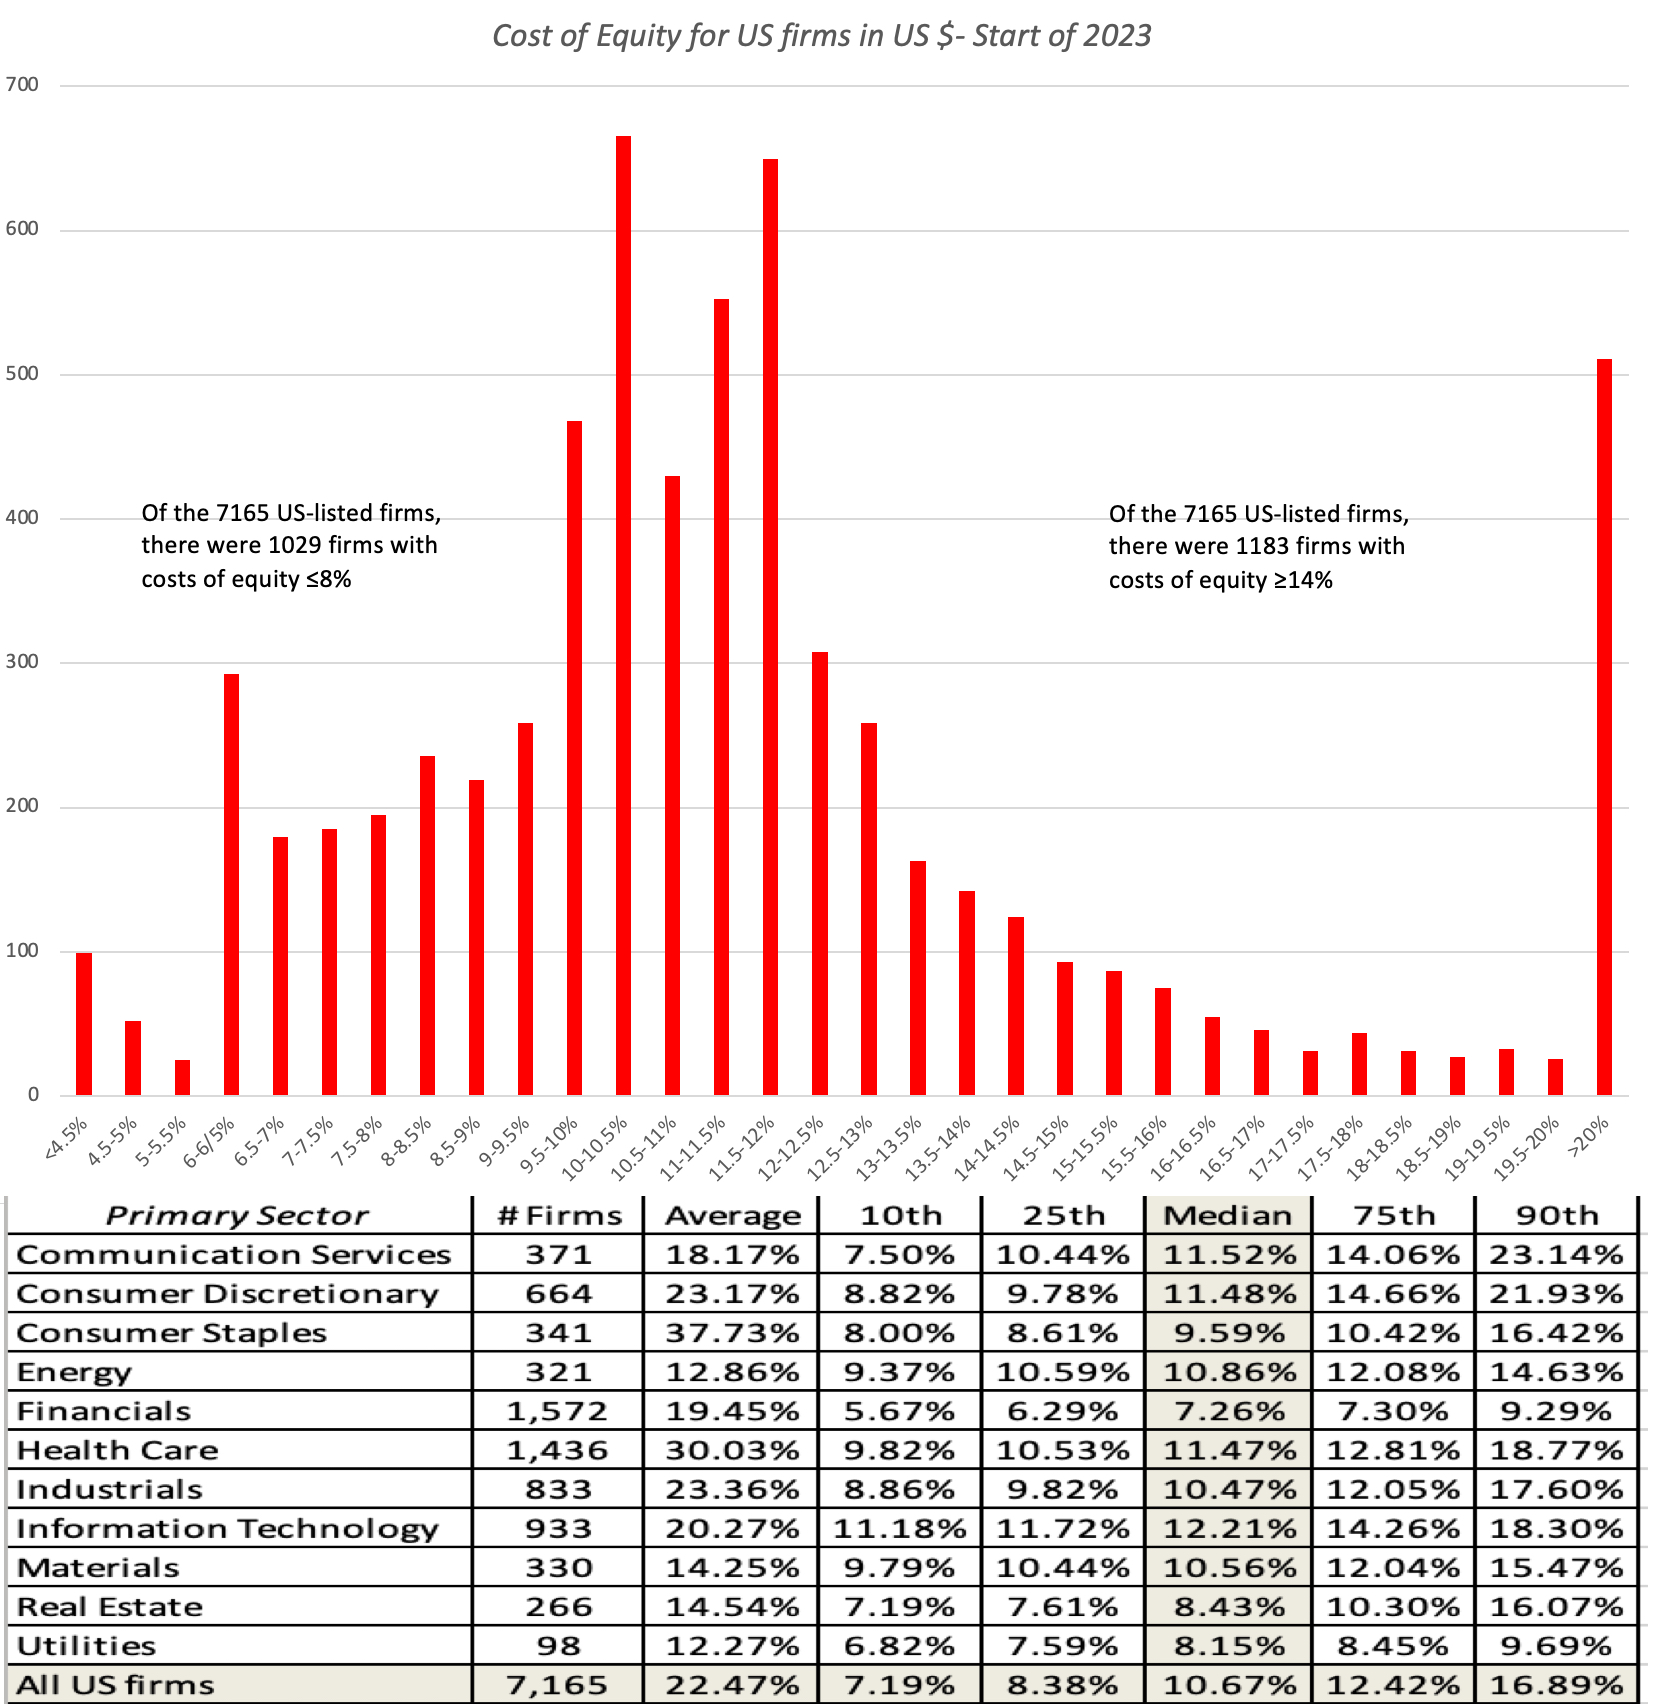
Note that, for the first time in a decade, more US firms have double digit costs of equity than single digit values, and while that may seem shocking to younger analysts, it is a return to what used to be normal in the pre-2008 market.
Stocks: The What Next?
To close this post, I revisited my valuation of the S&P 500 on September 23, 2022, and since much of last year's changes to the risk free rate, earnings expectations and the equity risk premium had happened by then, my value of the index has not changed much. In fact, if you view the current treasury bond rate as reflective of the market consensus on future inflation and rates, and assume that analyst estimates of earning already incorporate the effects of an economic slowdown in 2023 and 2024, the index value comes in at almost the current index level:
 Download spreadsheet
In sum, with analyst estimates of earnings for the next two years powering earnings expectations, and an desired equity risk premium of 5% (close to the average premium in the post-2008 time period), stocks started the new year closer to fair value than being under or over valued.
The market consensus can be wrong, and as the last year has shown, markets can change their minds, and especially so on two variables. The first is inflation, and whether it will recede to pre-pandemic levels or stay elevated, with consequences for both interest rates, nominal earnings growth in the long term and reinvestment. The second is the economy, where talk of recession fills the air but where a whole range of outcomes is possible from no recession to a steep drop off in economic indicators.
 Download spreadsheets: Low inflation & no recession, Low inflation & steep recession, High inflation & no recession, High inflation & steep recessionAs you can see, the most favorable scenario for the market is one where inflation subsides quickly to pre-pandemic levels (1-2%), bringing down the treasury bond rate, and the economy escapes a recession, leaving corporate earnings unscathed; in this scenario, the index value is 4311, about 10% higher than the current level (in January 2023). In the least favorable scenario, inflation stays high, pushing interest rates further up, and the economy enters a steep recession, with earnings dropping 20% (10%) from analyst estimates for 2023 and 2024; in this scenario, the index value is 3212, leaving the market over valued by almost 20%. Note that I am not calling it the worst case scenario, because that depends on how high inflation gets, with the higher the inflation, the more dire the outcomes for stocks, as well as how bad a recession is, with worse economic outcomes lowering value more.
Summing up One of the rituals that start the market year is for market strategists at investment banks to make their best predictions for where they see markets going over the course of the year. While this exercise has zero predictive power, and perhaps even a perverse relationship with actual returns, it does offer some insights into how much strategists are in agreement or disagreement about the year to come. At the start of 2023, here are the predictions from strategists for the year:

What should you do with these forecasts? Absolutely nothing, but the wide divergence in forecasts comes from different expectations of how the inflation/real economy story will play out. Rather than adopt one of their outlooks, or mine, you should, as an investor, find your point of view and let it drive your investment actions for the year. The first step in being a good investor is to take ownership of your investment decisions, and I hope that my framework/spreadsheet helps you on that path.
YouTube Videos
Datasets (If you have download trouble, switch browsers)Historical Returns on Stocks, Bonds, Bills and Other Assets- 1928-2022Implied Equity Risk Premiums on US stocks- 1960 - 2022SpreadsheetsImplied Equity Risk Premium Calculation (Jan 1, 2023)Valuation of the S&P 500 on January 1, 2023
January 6, 2023
Data Update 1 for 2023: Setting the table!
Data: Trickle to a Flood! It is perhaps a reflection of my age that I remember when getting data to do corporate financial analysis or valuation was a chore. To obtain company-level information, you needed to find its annual reports in physical form and for industry-level data, you were dependent on services that computed and reported industry averages, such as Value Line and S&P. The times have changed, and if there is a problem now, it is that we have too much data, rather than too little. As I noted in my posts on data disclosure last year, this has led to at least three unhealthy developments. Data distractions: Faced with massive amounts of data, quantitative as well as qualitative, many investors and analysts find themselves distracted by immaterial, irrelevant and sometimes misleading data points along the way. Data as a crutch: At the other extreme, there are some who believe that they answer to every question lies in the data, and that when seeking an input for valuation and corporate financial analysis, the data will provide it. Rather than make their best judgments or reason their way, when faced with estimation challenges, these investors and analysts embark on a search for more data, and if they do not find that data, they give up.Data bias: There is the canard that data is objective, as opposed to estimates or judgments, which are considered subjective. That is not true! In my experience, data is malleable, and if there is enough of it at your disposal, you can screen it and selectively choose the data to support whatever viewpoint you want to advance.During the course of my corporate finance and valuation journey, I have been guilty of all three of these sins, and it is to counter these pre-dispositions that I started spending the first week of every year looking at data with four objectives:Get perspective: One of the challenges that anyone doing business analysis, investing or valuation faces is getting a measure of what comprises a reasonable value for a business metric. Thus, without a sense of what comprises a high or low profit margin for a firm, or what the cost of capital is for the typical company, it is easy to create "fairy tale" valuations and analyses. By the same token, it is impossible to use a pricing metric (PE or EV to EBITDA), without a sense of the cross sectional distribution of that metric at the time.Mean reversion: I am not a knee-jerk believer in mean reversion, but the tendency for numbers to move back towards averages is a strong one. That said, to use mean reversion in analysis or investing, you need to know what these averages are, either over time or across companies, and data can help in that pursuit. Counter made-up numbers: It remains true that people (analysts, market experts, politicians) often make assertions based upon either incomplete or flawed data, or no data at all. For instance, is it true, as some assert, that inflation was high last year because companies raised prices to increase profits? Or, do US companies pay far less in taxes than companies incorporated in the rest of the world? Rather than indulge in endless debates, where each side provides anecdotal evidence, data can prove to be the tie-breaker.Check rules of thumb: Investing and corporate finance are full of rules of thumb, many of long standing. For example, I have seen it asserted that a stock that trades at less than book value is cheap or that a stock that trades at more than twenty times EBITDA is expensive. These assertions may very well be true, but cheap and expensive, at least in pricing terms, is relative, and looking at the data can help you detect rules of thumb that work from those that do not.When valuing or analyzing a company, I find myself looking for and using macro data (risk premiums, default spreads, tax rates) and industry-level data on profitability, risk and leverage. Rather than collecting this data each time I do an analysis, I realized that having these numbers computed and ready to go ahead of the analysis not only saves me time, but also allows me to focus more on the company that I am valuing and analyzing. I also realized that while these numbers are useful to me, they could be useful to others doing analysis as well, and I could not think of a single reason not to share what I had on hand.
Data: Sources and Description My first attempt at sharing data was in 1997, and it was limited to about a dozen data sets, all related to US companies, and I never expected very many people to use my data. That has changed, and this year, I am posting two hundred data sets, including more than a thousand data items, and extended the coverage to global companies. While I hope that you find this data useful, I also hope that you will spend a few minutes reading what I have to say about the companies that comprise my data universe, the data items I report on, the timing of the data and caveats.
Data Universe and Grouping At first sight, computing an industry average seems like a simple computation, where you take individual company numbers in an industry group and average them out. However, embedded in this statement are multiple estimation choices that you have to make that affect the reported numbers, and it behooves me to describe my choices:
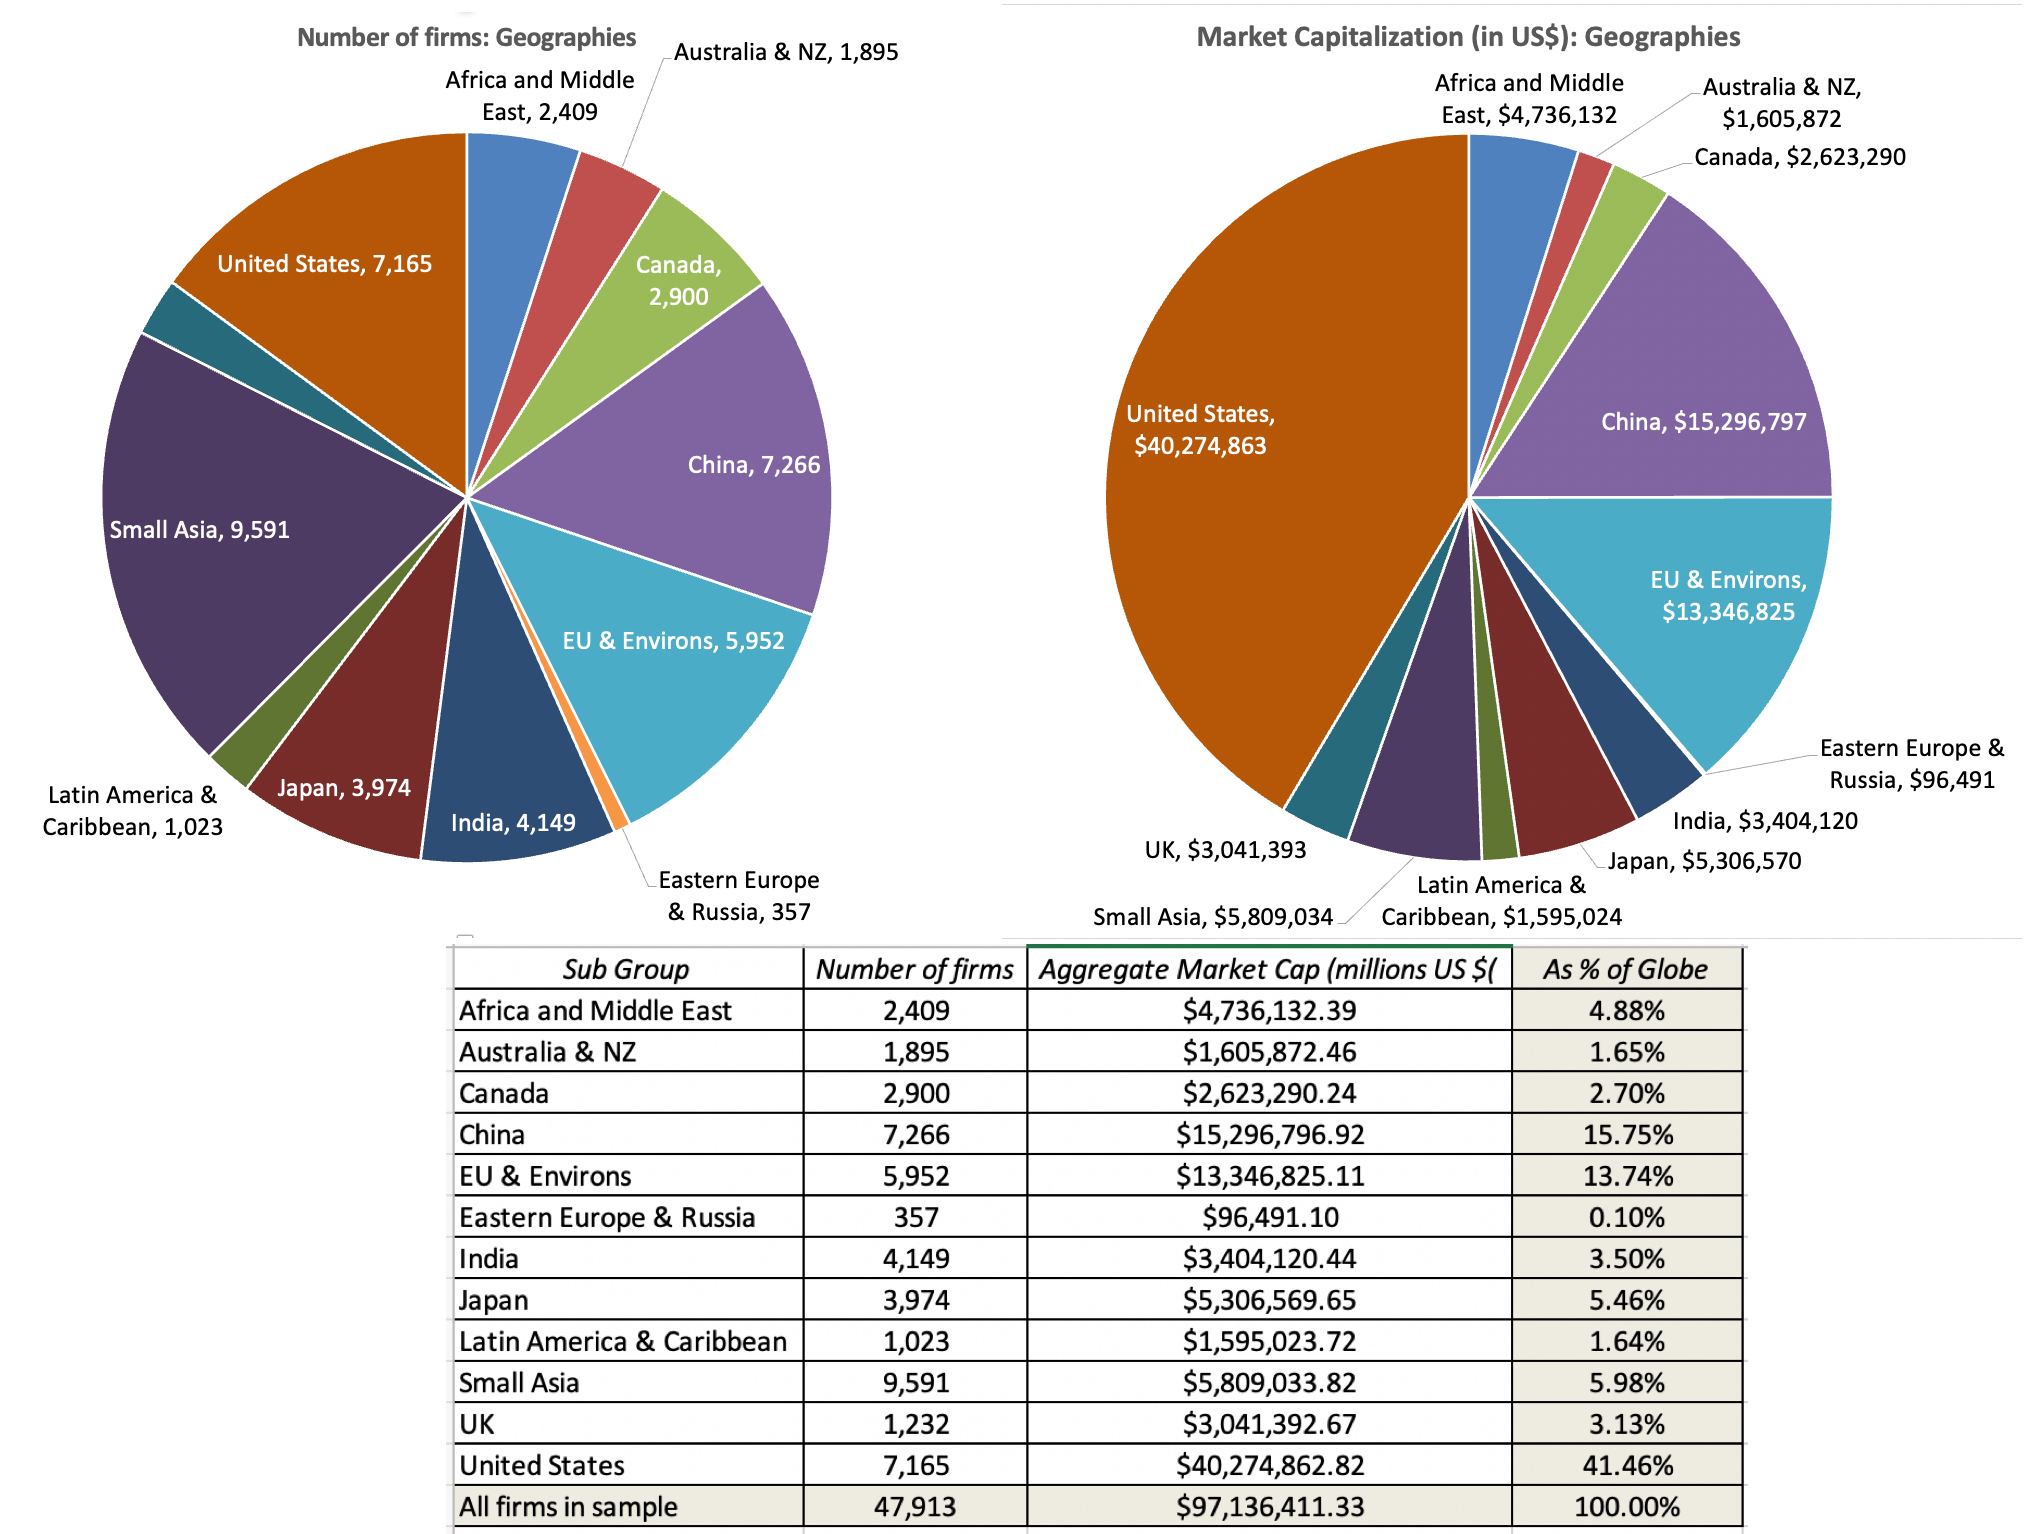
1. Data universe: In my sample, I include all publicly traded firms with market capitalizations that exceed zero, traded anywhere in the world. While there are risks bringing in very small and lightly-traded companies, with shaky data, into the sample, I include them to avoid the biases that will be created in industry averages by looking at just larger publicly traded companies, or just US-listed companies. In January 2023, I ended up with 47,913 publicly traded firms in my sample, with the pie chart below providing a geographic breakdown.
Speaking of biases, I do exclude privately owned (non-listed) companies for two reasons. The first is that in much of the world, these companies are not required to make their financial statements public, thus making it impossible to get the data. The second is that for data items that require market prices, including all the pricing metrics, private businesses cannot be included, since they have no market values.
2. Sectors and Industries: To make data useful for corporate financial analysis and valuation, I break the companies down into groupings, based upon the sectors and industries that they operate in. For the former, I use S&P's sector categorization and for the latter, I create 95 industry groups, built to allow users of my data to compare statistics over time. The sector breakdown of my overall sample is reported below:

My industry groupings are open to questioning for many reasons. First, for multi-business companies, I use the company's primary business (in terms of revenues) for categorization. Second, for some companies, it is not clear what industry group best fits the company. Thus, for Apple, it is unclear whether to put the company into company hardware, reflecting its history as a computer maker, or telecommunication equipment, reflecting its current dependence on the iPhone.
Data Items Much of my focus, when it comes to data, is on company-specific variables, rather than macro economic data, for two reasons. The first is that there are other and much better sources for raw macroeconomic data than mine, and my favorite remains. Federal Reserve Economic Data (FRED): This is hands down, in my view, the best site for macroeconomic data in the world. While its focus is naturally on the US economy, inflation and rates, there is data for the rest of the world as well. I do report on a few market-wide data items especially on risk premiums for both equity and debt. The second is that in my line of work, which is corporate finance and valuation, the numbers I need lie in micro or company-level data, not in the macro space. At the company-level, I provide data on risk, profitability, leverage and dividends, broken down by industry-groups, to be used in both corporate finance and valuation. I also report on pricing statistics, again broken down by industry grouping, with equity (PE, Price to Book, Price to Sales) and enterprise value (EV/EBIT, EV/EBITDA, EV/Sales, EV/Invested Capital) multiples. The table below shows a subset of the data items that I have on my website, with the links to the US versions of the data sets, in html. To get to the excel versions of this data, or the excel versions by region (Emerging Markets, Europe, Australia & Canada, Japan) as well as globally, please go the current data page of my website:
table.tableizer-table { font-size: 12px; border: 1px solid #CCC; font-family: Arial, Helvetica, sans-serif; } .tableizer-table td { padding: 4px; margin: 3px; border: 1px solid #CCC; } .tableizer-table th { background-color: #104E8B; color: #FFF; font-weight: bold; } Risk MeasuresCost of FundingPricing Multiples 1. Beta1. Cost of Equity1. PE & PEG 2. Standard deviation in stock price2. Cost of Debt2. Price to Book 3. Standard deviation in operating income3. Cost of Capital3. EV/EBIT and EV/EBITDA 4. High-Low Price Risk Measure
5. Standard deviations in equity and firm value 4. EV/Sales and Price/Sales
5. Per-employee Statistics ProfitabilityFinancial LeverageReinvestment 1. Net Profit Margin1. Debt ratios (Debt to capital, Debt to EBITDA)1. Cap Ex & Net Cap Ex ((including acquisitons) 2. Operating Margin2. Debt breakdown2.. Non-cash Working Capital 3. EBITDA, EBIT and EBITDAR&D Margins3. Goodwill & Impairment
4. Financing Flows Accounting ReturnsDividends & OwnershipRisk Premiums 1. Return on Equity1. Dividend Payout & Yield1. Historical returns on US stocks, bonds, and other asset classes 2. Return on Invested Capital2. Dividends/FCFE & (Dividends + Buybacks)/ FCFE2. Historical Implied ERP for US 3. Excess Returns (ROE minus cost of equity, ROIC minus cost of capital, EVA)3. Insider, Institutional & CEO holdings 3. Equty Risk Premiums, by Country 4. Bond Default Spreads Growth RatesAccounting Clean upTax Rates 1. Historical Growth Rate in Revenue/Earnings
1. Leases as debt: Effects1. Marginal tax rates, by country 2. Sustainable Growth Rate in Net Income & Operating Income2. R&D as cap ex: Effects2. Effective tax ratesIf you are interested in the archived data from prior years, you can get them by going to this link. For a description of the variables (and how I compute them), please try this link.
Data Timing There is one final estimation detail that needs clarification. I did my updates in the last week (January 1- January 5, 2023), and used the most updated data that I could find on each company. For market data, where the updating is continuous, that is data as of the January 1, 2023. Thus, market capitalization, interest rates and risk premiums, the data is as of that date.For accounting flow items, in income statements and statements of cash flows, such as revenues, earnings and expenses, I used the data in the most recent twelve months of reporting; for most firms, that data is from October 2021 to September 2022.For accounting stock items, from balance sheets, I use the numbers from the most recent balance sheet; again, for most firms, the numbers are from the balance sheets, as of September 30, 2022 or the most recent quarterly statements.While these timing differences may strike some as inconsistent, they do meet my timing consistency test, which is that they are the most updated numbers that decision-makers (CFOs and investors) would have as of January 1, 2023.
Data Caveats I have no qualms about sharing my data, since there is nothing particularly original or unique about what I do, and I am glad that there are some to whom the data is proving useful. If I save analysts and investors time in their decision making, I consider the time spent on my data analysis to have earned its required returns and more. Given the wide range of uses to which my data is put, I do have some caveats on its usage.
Mistakes and Errors: I am a team of one, reflecting more my desire for control that unwillingness on the part of others to help. That said, working with a data sheet with 47,913 companies and hundreds of data items can get daunting, as is updating individual excel sheets, by variable and region. If you find a mistake or mistakes, please bring it to my attention and I will fix it.Judgment calls: I have made judgment calls starting with my creation of industry groups (which you may not like) and my assignment of companies into groups. Some take issue with my regional classifications, arguing that Mexico should be North America (geographically, you are absolutely right) rather than in Latin America (which is where I put it).Company-level data: I do not provide company-level data for two reasons. One is that it would violate agreements that I (or NYU) have with my raw data providers and the other is that getting company-level data has become trivial. I know that most of you cannot afford a Bloomberg terminal or S&P Capital IQ, but you can get the data not just from Yahoo! Finance but also from a variety of online data services that are affordable and very well done. Agenda: If you are using my data to advance a point of view that you hold, you are welcome to do so, but please be clear that this is your reading of my data, not mine. If you are in a fight (legal or online) and using my data as ammunition, you are entirely on your own, and I will not enter the fight on either side, unless you have a clarification question. Staleness: I update my data once a year, and I will not return to do an update until January 2024; the equity risk premiums for the US will get updated every month and the equity risk premiums for other countries will get a mid-year update. While I have no compunctions continuing to use industry averages for risk, profitability and leverage over the course of the year, the pricing metrics (PE, EV/EBITDA etc.) will become dated as the year goes on, and especially so if the market moves up or down significantly.You owe nothing to me for the data, and if it does get you into trouble, feel free to blame me. If you really want to offer something in return, the best favor you can do for me is to help someone else out there.
The Posts to come In the posts to come, I will talk about what the numbers tell us about the state of the market and the companies that inhabit them, as of the start of 2023. It is undeniable that 2022 was a tumultuous year, with inflation taking center stage, and driving markets. In my next three posts, I will look at inflation's effects on equity markets (in post 2), government and corporate bond markets (in post 3) and other asset classes (real estate, collectibles and cryptos). For those who had become somnolent about country risk, the year provided a reminder of how quickly country risk can flare up and change, with Russia's invasion of Ukraine a precipitating factor, and in my fifth post, I will look at the evolution of country risk during the year. In the three posts that follow, I will look at the shifts in corporate hurdle rates (in post 6), debt loads and worries (in post 7) and dividends/cash returned in post 8. In the ninth post, I will look at how market pricing changed during 2022, across sectors/industries (with technology taking the biggest hit) as well as across growth and corporate life cycles. There is always the chance that I will get distracted along the way, since I want to value Tesla later this month and return to my FANGAM valuations in February!
YouTube Video
LinksCurrent data from January 2023 (on my webpage)Archived data (on my webpage)Variable definitions
December 21, 2022
A Return to Teaching: The Spring 2023 Edition
If, as you read this post, it feels like you have read it or a close variant before, it is because you have. Each year, ahead of teaching my classes at NYU's Stern School of Business in the spring, I invite readers to accompany me on my journey, and this year is no different. Starting in late January 2023, I will be back in the classroom, teaching valuation and corporate finance to the MBAs and valuation to the undergraduates, and these classes will continue through May 2023. If you are curious about the content of these classes, and may want to partake, I will use this post to lay out my teaching philosophy, to describe the classes that I teach and provide options that you may be able to use to take them.
Teaching Philosophy
I have heard the old saying that "those who can do, and those who cannot teach", and I won't get defensive in response, because it may be true. I would like to believe that I am capable of both doing and teaching valuation and corporate finance, but I will leave that judgment for you to make, since my valuations and corporate finance assessments are in the public domain (on my blog and in my lecture notes). If your query is why I would continue to teach rather than seek out more lucrative careers in investing or banking, my answer is a simple one. I love teaching and if you follow my classes, I hope it shows, and my teaching philosophy can be summarized in six precepts:
Preparation is key: Paraphrasing Edison, teaching is 90% perspiration and 10% inspiration. If you are prepared for your class, you are well on your way to being a good teacher.Respect your students: I believe that anyone who sits on my classroom is as capable as I am, though perhaps not as experienced, and is passionate about learning.Be fair: I don't believe that students dislike or punish tough teachers, but I do believe that they dislike and punish teachers who are unfair, either in the way they test students or in the way they grade them. I know that I will make mistakes, but as long as I keep an open door and correct my mistakes, I think that students will cut me some slack. Have empathy: It has been a long time since I was a student in a classroom, but I try to keep my memory fresh by remembering the things I disliked in my classes and trying not to repeat them.Teaching is not just in the classroom: My impact on students does not come just from what what I do in the classroom. It is affected just as much but what I do outside the classroom, in my office hours and in my interactions (online and in person) with my students.Have fun: If you look at the joy that young children show when they learn something new, it is obvious that human beings enjoy learning (though our education systems are often designed to stamp out that joy). I want my classes to be meaningful, impactful and profound, but I also want them to be fun. For that to happen, I have to have fun teaching and I will!Older, though not wiser, as I start my 37th year teaching at NYU, I am looking forward to class just as much as I did the very first year that taught, as a visiting lecturer at the University of California at Berkeley in the fall of 1984.
Course Offerings
I am a dabbler, someone who knows a little bit about a whole host of subjects, without being close to an expert on any one of them. In a world where specialization is the norm, this does put me at a bit of a disadvantage, since there are many who know a great deal more about almost any topic that I choose to talk about, but I do think that it gives me a big-picture perspective that helps me find answers. As you will see in this section, I teach a range of courses, and I hope that my teaching of each course is informed by thinking about and teaching of the other courses.
1. Pre-game Prep
If there is a lesson be learnt from the last few years of market mayhem, it is that far too many investors, professional as well as retail, seem to have lost their moorings (or never had them in the first place), when it comes to the basics of accounting, finance and statistics. In the last few years, I have created my own versions of each of these disciplines, reflecting the tools and skills that I draw upon in my valuation and corporate finance classes.
a. Accounting
Much of the raw data that you use in corporate finance and valuation comes from accounting statements, and if you do not understand the difference between operating and net income, you are fatally handicapped. If your accounting basics are strong, you can move right along, but if they are shaky, I have an abbreviated online accounting class, with twelve sessions that around built around using the financial statements (income statement, balance sheet and statement of cash flows) to assess a firm’s financial standing, as a prelude to analyzing or valuing it.
 Link to accounting class
Just as a note of warning, this is my quirky version of accounting, and I don’t follow the accounting script in this class. I challenge what I see as indefensible practices in accounting, including the expensing of R&D (a capital expense) and inconsistencies in accounting ratios.
b. Foundations of Finance
I also have a 12-session foundations of finance class, where I introduce two structures that I draw on all through my classes - the financial balance sheet (as opposed to an accounting balance sheet) and a corporate life cycle. I provide an introduction to cash flows and risk, and how they play out in the time value of money, and the basics of valuing contractual cash flows (bonds), residual cash flows (equity) and contingent cash flows (options). Finally, I carve out simple (even simplistic) sessions on inflation, interest rates and exchange rate, three macro variables that we are exposed to in almost all financial analysis and valuations.
 Link to Foundations class
 Again, if your finance basics are solid, and you understand the link between expected inflation, interest rates and exchange rates, you can skip this class.
c. Statistics
The most recent addition to my class list is one on statistics, and it was motivated by the wanton misuse and misunderstanding of data that I see not only in investing, but in the rest of life. It is ironic, and perhaps telling, that our understanding of statistics seems to have hit rock bottom in the age of big data. In this class, I start by looking at data collection and data descriptives, before moving on to distributions and data relationships (correlations, covariances and regressions) and closing with probabilities and probabilistic tools.
 Link to Statistics class
If you find yourself inundated by data in financial analysis, I hope this class helps you convert data to information, and data that matters from data that distracts.
2. Corporate Finance
If the introductory classes in accounting, finance and foundations don’t exhaust you, you are welcome to my corporate finance class, which covers the first principles that govern how to run a business. The class starts with a question of what the end game should be for a business (profitability, value, social good?), and uses that endgame to cast light on the investing, financing and dividend decisions that all businesses, small or large, private or public, have to make.
 This is a big picture class, designed not for bankers and consultants, but for a much broader audience of business owners, entrepreneurs and investors. If you have struggled with why debt helps some companies and hinders others, or how stock buybacks affect shareholders, I hope that you will give this class a try. It is also a relentlessly applied class, where every concept that is introduced in class is applied on companies that range the spectrum: a multinational entertainment company facing leadership challenges (Disney), a family-group automobile company (Tata Motors), a bank with a storied past and a troubled present (Deutsche Bank), an emerging-market mining company (Vale), a Chinese search engine (Baidu) and a small privately owned bookstore in New York City. Along the way, I will use the corporate life cycle to illustrate how the corporate finance focus of a business changes as it ages, from investing (in young companies) to financing (in mature businesses) to dividends (in declining businesses):
 It will help make my case that companies that act in age-inappropriate ways (a young company that borrows large amounts, a mature company that relentlessly chases growth or a declining firm looking for reincarnation) destroy value, while making their bankers and consultants wealthy.
3. Valuation
In 1986, when I taught the first semester-long valuation class at NYU, I was told that there was not enough material for a class that long. I persevered, and thirty seven years later, I think I can say, with some confidence, that I have enough material to fill a semester-long class. This is a class in search of pragmatic solutions, not purity or theory, and it is my intent is to value assets, companies and investments, not just talk about valuing them.

I have argued that valuation books and courses do a disservice by focusing all their attention on money-making publicly-traded companies, with long histories and mostly in developed markets, leaving readers and students with the false impression that you cannot value young companies., firms in emerging markets or private businesses. I claim, perhaps boastfully, in my first session of this class that this is a class about valuing or pricing just about anything, including private business, assets, collectibles and even cryptos. I use the corporate life cycle to talk about how the challenges in valuing and pricing companies shift as you move from start-ups to companies in decline:

As with the corporate finance class, I cast my net wide, when it comes to my audience, and while the class will help prepare you for a valuation career, as an equity research analyst or appraiser, the class is designed for anyone who has ever struggled with understanding valuation and market pricing. This may surprise you, but we spend a significant amount of time in this class talking about telling business stories that pass the “fairy tale” test and tying stories to valuation inputs, and almost no time opening and closing spreadsheets. So, whether you are a number cruncher or story teller, I think you will find something to take away from the class.
4. Investment Philosophy
The last class that I teach, albeit only online, is one on investment philosophies, and it was born from two observing two investing realities.
The first is that notwithstanding the hundreds of books on how to beat the market and the thousands of cannot-miss trading strategies that exist on paper, there are only a handful of investors and traders who have consistently beaten the market over long periods. The second is that these consistent winners have very little in common, in terms of market beliefs and strategies, with value investors, market timers and traders in the mix. My reading of these two realities is that there is no one best investment philosophy, that works for everyone, but there is one best philosophy for you, given your personal make up and investable capital. Consequently, this class lays out a menu of investment philosophies, from short-term (day) trading to long-term value investing, from passive to active to activist investing and from stock picking to market timing, with the intent of letting you find the investment philosophy that is right for you.
As with my corporate finance and valuation classes, I argue that your choice of investment philosophy will determine where in the corporate life cycle, you will find your investments.
 If you believe that markets make mistakes in valuing assets-in-place, i.e., you are a value investor, your portfolio will be composed of mature companies. In contrast, if your view is that markets make mistakes in valuing growth assets, i.e., you are a growth investor, your investments will be primarily from growth companies.
 Choices, choices, choices...
You have lives to live, work to do and families to be with, and it is unrealistic and arrogant of me to expect you to spend a large portion of your time, taking my classes. I will settle for what I can get, and offer my classes in multiple formats, tailored to different time constraints and diverse tastes.
Formats
There are three formats in which I offer my classes, though not all of the classes are available in every format.
Regular classes (Free): My corporate finance and valuation classes are taught, as semester-long classes, meeting twice a week for 80-minute sessions. While you need to be registered in the classes, as Stern students, to be able to sit in the classrooms, the sessions will be recorded and accessible by the end of the class day. You can take the class this upcoming semester, when the classes start late January 2023 and continue through May 2023, or watch the archived versions from spring 2022.
table.tableizer-table { font-size: 12px; border: 1px solid #CCC; font-family: Arial, Helvetica, sans-serif; } .tableizer-table td { padding: 4px; margin: 3px; border: 1px solid #CCC; } .tableizer-table th { background-color: #104E8B; color: #FFF; font-weight: bold; } ClassWebpage for classSpring 2023 (Real time)Spring 2022 (Archived) Corporate FinanceLinkLinkLink Valuation (MBA)LinkLinkLink Valuation (Undergraduate)LinkLinkLinkNote that the MBA and undergraduate valuation classes are identical in content, and you can take one or the other. If you decide to take the class, you will have access to everything that my students will have, from the slides that I use in the class, to the tests and exams that I give, with solutions that you can use to grade yourself, to the emails that I send my students on an almost daily basis. You can even do the projects (a corporate financial analysis in the corporate finance class or valuing & pricing a company in the valuation class) that are required for the classes. The downside is that this is the most time consuming of the choices, and much as I try, my 80-minute sessions cannot compete with The White Lotus for entertainment value.
Online classes (Free): If you find yourself unable to invest the time needed to take my regular classes or find the long sessions unwatchable (I don't blame you..), I have online versions of these classes that compress the 80-minute sessions into 12-15 minutes. It is a testimonial to the bloat in MBA programs that I can do this without compromising much on content, and these sessions also come with supporting material.
table.tableizer-table { font-size: 12px; border: 1px solid #CCC; font-family: Arial, Helvetica, sans-serif; } .tableizer-table td { padding: 4px; margin: 3px; border: 1px solid #CCC; } .tableizer-table th { background-color: #104E8B; color: #FFF; font-weight: bold; }
Online ClassWebpage for classYouTube Playlist AccountingLinkLink Foundations of FinanceLinkLink StatisticsLinkLink Corporate FinanceLinkLink ValuationLinkLink Investment PhilosophyLinkLinkOne downside is that many of these online sessions were recorded a few years ago, and you may find no mention of valuation challenges of today, from how the COVID crisis upended value and the steep fall in FANGAM stocks this year. Another is that even if you watch every video, take every post-class test and feel that you have mastered the material, I cannot offer you any official affirmation or certification for taking the class, but on the flip side, the courses are free!
Certificate classes (Not free): If certification is what you seek, New York University offers my three main courses as certificate classes. The content is similar to that in my online classes, but the videos are more polished, the classes follow a calendar and I do have an online meetup on zoom every two weeks:
table.tableizer-table { font-size: 12px; border: 1px solid #CCC; font-family: Arial, Helvetica, sans-serif; } .tableizer-table td { padding: 4px; margin: 3px; border: 1px solid #CCC; } .tableizer-table th { background-color: #104E8B; color: #FFF; font-weight: bold; } Certificate ClassNYU Exec Ed LinkSemesters taught Corporate FinanceLinkFall Semester ValuationLinkFall & Spring Semesters Investment PhilosophyLinkSpring SemesterIn keeping with the adage that there is no free lunch, you will have to pay for the certification privilege, and if the price gives you sticker shock, please remember that I have no role in that pricing decision and offer a free version, with the same content.
Sequencing
If you are interested but are unclear about where to start, I am reproducing a flow chart I created last year to guide you through my classes.
 As you can see, the sequencing of classes depends upon your background, as well as your interests. Specifically, if you are mostly interested in running or helping to run a business, the only class that you may need is a corporate finance class, supplemented by, if necessary, one or more of the three prep classes (accounting, basic finance and statistics). If your interests lie in learning the craft of valuation, perhaps because your job requires it or because you are curious, my recommendation is that you take both the corporate finance and valuation classes. If investing is what rings your bell, the valuation class twinned with an investment philosophy class should get you to wherever you want to go.
 Supporting Cast
Watching a video of a class is just the first step in learning. To help, I try to provide as much supporting material as I can. As you look down the list, please do not be intimidated by its length, since you may find a use for only a portion of what I offer:
Lecture Notes: The only material that I require for the students in my class are the lecture note slides that I use in the class, and the only reason I require it is to reduce the amount of note-taking during class. The slides are available as full packets for my regular classes, on the webpages for the classes (see above), but they are also available with each session as links. As you review these slides, you will note that I break every rule in creating slides, cramming in way too much information on each slide. I am sorry for doing so, but my intent is to allow these slides to be the equivalent of class notes.Post-class test: Every session of each class comes with a post-class test. These tests take about 15 minutes to do, and are a review of the material covered during the class. If you have the time, it is worth taking these tests to reaffirm what you are learning.Data: The data that I reference during the class are available in their most updated formats on my webpage, under current data, with the next update due at the start of 2023. Spreadsheets: I almost never open an excel spreadsheet during my classes and spend little time on financial modeling, but I do use my limited Excel skills, when valuing companies and doing corporate financial analysis. To save you the trouble of building spreadsheets from scratch, I leave my spreadsheets online for you to access, adapt and change.Tools videos: As I noted earlier, my classes are applied, and to provide guidance on applying what I teach to real life, I have YouTube videos on almost every application, from how to read an annual report all the way to a full company valuation.Blog Posts: If you find the material in my classes of interest, you can read my blog on Google Blogger and Substack. I don't post often, but when I do, my posts tend to focus on valuation, corporate finance and investment philosophy topics. Books: I have books on each of the topics that I teach, but you do not need any of them to get through these classes. Some of these books are obscenely over-priced, and I don't require them for any of my classes.table.tableizer-table { font-size: 12px; border: 1px solid #CCC; font-family: Arial, Helvetica, sans-serif; } .tableizer-table td { padding: 4px; margin: 3px; border: 1px solid #CCC; } .tableizer-table th { background-color: #104E8B; color: #FFF; font-weight: bold; }
Book
Publisher link
Webpage for book
Valuation
Damodaran on Valuation
Link
Link
Investment Valuation
Link
Link
The Dark Side of Valuation
Link
Link
The Little Book of Valuation
Link
Link
Narrative and Numbers
Link
Link
Corporate Finance
Corporate Finance
Link
Link
Applied Corporate Finance
Link
Link
Strategic Risk Taking
Link
Link
Investment Philosophies
Investment Philosophies
Link
Link
Investment Fables
Link
Link
All Classes
The Corporate Life Cycle
Forthcoming in 2023
Forthcoming in 2023
Group Work and Interaction
Starting on an online class is easy, but finishing the class is difficult. One obvious reason is time and commitment, and I will have to leave it to you to figure that one out, but another is that a class is more than a collection of lectures. There is a peer-group component to learning that includes class discussions and group interactions that is often absent in big online classes, leaving you not only with unanswered questions, but also missing the critical part of learning that comes from explaining concepts to, and bouncing ideas off, others in the class.
I do not have the bandwidth to be able to provide direct support to everyone taking my classes, but a few months ago, I was approached by Sebastian Marambio, who has set up a neat site called We are six, allowing people to set up groups to work with, for online classes, with apps available for Android and iOS. Once you register on the site, you can enter the class code for the class that you then proceed to create a group with others with similar time frames and compatible time zones for taking the class. Sebastian has been kind enough to set up free versions for my online classes and the links to them are below:
ClassCourse Code (for We are Six groups) Corporate Finance (Online)ADCorp Valuation (Online)ADValu Investment Philosophies (Online)ADPhilIf you are taking the regular versions of my corporate finance and valuation classes, please hold off, and we may create versions for those classes. I am looking forward to seeing how this experiment unfolds, since it will fill a gap in all online classes for organized group interactions.YouTube Video
Class List
table.tableizer-table { font-size: 12px; border: 1px solid #CCC; font-family: Arial, Helvetica, sans-serif; } .tableizer-table td { padding: 4px; margin: 3px; border: 1px solid #CCC; } .tableizer-table th { background-color: #104E8B; color: #FFF; font-weight: bold; }
SubjectOnline (Free) Certificate (Not free) Regular Class (Free to follow) AccountingLinkNA NA Foundations of FinanceLinkNANA StatisticsLinkNA NA Corporate FinanceLinkLinkLink ValuationLinkLinkLink Investment PhilosophiesLinkLinkNA
November 15, 2022
META Lesson 3: Tell me a story!
In my first two posts on Facebook, I noted that its most recent earnings report, and the market reaction to it, offers an opportunity for us to talk about bigger issues. I started by examining corporate governance, or its absence, and argued that some of the frustration that investors in Facebook feel about their views being ignored can be traced to a choice that they made early to give up the power to change management, by acquiescing to dual class shares. Facebook, I argued, is a corporate autocracy, with Mark Zuckerberg at its helm. In the second post, I pointed to inconsistencies in how accountants classify operating, capital and financing expenses, and the consequences for reported accounting numbers. Some of the bad news in Facebook's earnings report, especially relating to lower profitability, reflected accounting mis-categorization of R&D and expenses at Reality Labs (Facebook's Metaverse entree) as operating, rather than capital expenses. In fact, I concluded the post by arguing that investors in Facebook were pricing in their belief that the billions of dollars the company had invested in the Metaverse would be wasted, and argued that Facebook faced some of the blame, for not telling a compelling story to back the investment. In this post, I want to focus on that point, starting with a discussion of why stories matter to investors and traders and the story that propelled the company to a trillion-dollar market capitalization not that long ago. I will close with a look at why business stories can break, change and shift, focusing in particular on the forces pushing Facebook to expand or perhaps even change its story, and whether the odds favor them in that endeavor.
Narrative and Value
As someone who has spent the last four decades talking, teaching and doing valuation that we have lost our way in valuation. Even as data has become more accessible and our tools have become more powerful, it is my belief that the quality of valuations has degraded over time. One reason is that valuation, at least as practiced, has become financial modeling, where Excel ninjas pull numbers from financial statements, put them into spreadsheets and extrapolate based upon past trends. Along the way, we have lost a key component of valuation, which is that every valuation tells a business story, and understanding what the story is and its weakest links is key to good valuation,
The Connection
In the first session of my valuation class, I pose a question, "What comes more naturally to you, telling a story or working with numbers?", and I very quickly add that there is no right answer that I am looking for. That is because the answer will vary across people, with some exhibiting a more natural tendency towards story-telling and others towards working with numbers. In my valuation classes, the selection bias that leads people to come back to business school, and then to pick the valuation class as an elective, also results in the majority picking the "numbers" side, though I am glad to say that I have enough history majors and literature buffs to create a sizable "story" contingent. In the immediate aftermath, I then put forth what I believe is one of the biggest hidden secrets in valuation, which is that a good valuation is not just numbers on a spreadsheet, which is the number-crunching vision, or a big business story, which is the story-tellers' variant, but a bridge between stories and numbers:
 To explain what I mean by "a bridge", in a good valuation, every number you have in your valuation, from growth to margins to risk measures, should be backed up by a story about that number, and every story you tell about a company, including its great management, brand name or technological edge, has be reflected in a number in your valuation. If making this connection comes naturally to you, you are lucky and definitely the exception, because it is hard work for the rest of us. As someone who is more naturally drawn to numbers, I came to the recognition of the need for stories late to the game, and I had not only to teach myself how to tell stories but also create a process where I stayed disciplined about incorporating them into valuations. In case you are interested, I did write a book on the process that I use to convert stories to numbers, but if you are budget-constrained, many of the ideas in the book are captured in posts that I have done over time on valuation.
Stories + Numbers: The Symbiosis
The challenge in valuation, and it has only become worse in time, is that the divide between story tellers and number crunchers has only become wider over time, and has reached a point where each side not only does not understand the other, but also views it with contempt. Venture capitalist, raised on a diet of big stories and total addressable markets has little in common with bankers, trained to think in terms of EV to EBITDA multiples and accounting ROIC, and when put in a room together, it should come as no surprise that they find each other's language indecipherable. At the risk of being shunned by both groups, I will argue int his section that each side will benefit, from learning to understand and use the tools of the other side.
1. Why stories matter in a numbers world
If you are a numbers valuation, you start with some advantages. Not only will you find financial statements easier to disentangle, but you will also be able to develop a framework for converting these numbers to forecasts fairly easily. In other words, you will have no trouble creating something that looks like a legitimate valuation, with numbers details and an end value, even if that value is nonsensical. With a just-the-numbers valuation, there are four dangers that you face:
Play with numbers: When a valuation is all about the numbers, it is easy to start playing with the numbers, unconstrained by any business sense, and change the value. It is not uncommon to see analysts, when they estimate a value that they think is "too low", to increase the revenue growth rate for a company, holding all else constant, and increase the value to what they would "like it to be".False precision: Number crunchers love precision, and the pathways they adopt to get to more precise valuations are often counter-productive, in terms of delivering more accurate valuations. From estimating the cost of capital to the fourth decimal point to forecasting all three accounting statements (income statements, balance sheet and statement of cashflows), in excruciating detail, for the next 20 years, analysts lose the forest for the trees, and produce valuations that look precise, but are not even close to being estimates of true value.Drown in data: If the complaint that analysts in the 1970s and even the 1980s might have had is that there was not enough data, the complaint today, when they value companies, is that there is too much data. That data is not only quantitative, with company disclosures running to hundreds of pages and databases that cover thousands of companies, but also qualitative, as you can access every news story about a company over its history, and in real time. Without guard rails, it is easy to see why this data overload can overwhelm investors and analysts, and lead them, ironically, to ignore most of it.Denial of biases: It is almost impossible to value a business without bias, with some bias coming from what you know about the business and some coming from whether you are getting paid to do the valuation, and how much. In a valuation driven entirely with numbers, analysts can fool themselves into believing that since they work with numbers, they cannot be biased, when, in fact, bias permeates every step in the process, implicitly or explicitly. Put simply, there are very facts in valuation and lots of estimates, and if you are making those estimates, you are bringing your biases If you are a number-cruncher, at heart, and have run into these or other problems when valuing companies, bringing numbers into your valuation can not just alleviate these problems, but also help you in convincing not just other people, but yourself, about your valuation.Stories are memorable, numbers less so: Even the most-skilled number cruncher, aided and abetted with charts and diagrams, will have a difficult time creating a valuation that is even close to being as good a compelling business story, in hooking investors and being memorable. I believe that long after my students have forgotten what growth rates and margins I assumed in the valuation of Amazon that I showed them in 2012, they will remember my characterization of Amazon as my "field of dreams company", built on the premise that if they build it (revenues), they (profits) will come. Stories allow for consistency-tests: When your valuation numbers come from a story, it becomes almost impossible to change one input to your valuation without thinking through how that change affects your story. An increase in revenue growth, in a company in a niche market with high margins, may require a recalibration of the story to make it a more mass-market story, albeit with lower margins. Stories allow you to screen and manage data: Having a valuation story that binds your numbers together and yields a value also allows you a framework for separating the data that matters (information) from the data that does not (distractions), and for organizing that data. Stories lead to business follow-through: If you are a business-owner, valuing your own business, understanding the story that you are telling in that valuation is extraordinarily useful in how you run the business. Thus, if you want to follow Amazon's path to the Field of Dreams, your business strategy should be built around expanding your market and increasing revenues, while also mapping out a pathway to eventually monetizing those markets and gaining access to enough capital to be able to do so.If you are a number cruncher like me, you will find that adding a story to your valuation will only augment your number skills and improve your valuations.2. Why numbers matter in a story world
I am not a story-telling natural, but I have tried to look at valuation, through the eyes of story tellers, over the last few years. Again, you start with some advantages, as a skilled story teller, especially if you also have the added benefit of charisma. You can use your story telling skills to draw investors, employees and the rest of the world into your story, and if you frame it well, you may very well be able to evade the type of scrutiny that comes with numbers. There are dangers, though, including the following:
Fairy tales: Without the constraint of business first principles or explicit numbers about key inputs, you can tell stories of unstoppable growth and incredible profits for your company that are alluring, but impossible. If you are a con man, that is your end game, but even if you are not a con man, it is easy to start believing your own tall stories about businesses. As you watch the unraveling of FTX, you have to wonder whether Sam Bankman-Fried (SBF) set out to create a crypto-based Ponzi scheme, or whether this is the end result of a business story that was unchecked by any of the big name investors who participated into its growth.Anecdotal evidence: Story tellers tend to gravitate towards anecdotal data that supports their valuation stories. Rather than drown in the data overflow world we live in, story tellers pick and choose the data that best fits their stories, and use them to good effect, often fooling themselves about viability and profitability along the way.Unconstrained biases: If number crunchers are in denial about their biases, story tellers often revel in their biases, presenting them as evidence of the conviction that they have in their stories. Using the FTX example again, SBF was open about his belief that the future belonged to crypto, and that his entire business was built on that belief, and to his audience, composed of other true crypto-believers, this was a plus, not a minus.In every market boom, you see the rise of story tellers, and while many crash and burn like SBF, as reality bites, there are a few that succeed, building some of our greatest business successes. One reason is that they find a way to bring numbers into their stories, with the following benefits:Numbers give credibility to stories: As we noted in the last section, stories are hooks that draw others to a business idea, but it may not be enough to get them to invest their money in it. For that to happen, you may have to use numbers to augment and back up your business story to give it credibility and create enough confidence that you have the business sense to make it succeed. Numbers allow for plausibility checks: If you are on the other side of a valuation pitch, especially one built almost entirely around a story, the absence of numbers can make it difficult to take the story through the 3P test, where you evaluate whether it is possible, plausible and probable. It is your obligation as an investor to push for specificity, often in terms of the market that the business is targeting and the market share and profitability numbers that will determine its profitability. Again, business owners and analysts who can respond to this demand for specifics and numbers are more likely to get the capital that they seek. Number create accountability: For business owners and managers, the use of numbers allows for accountability, where your actual numbers on total market size, market share and profitability can be compared to your forecasts. While that lead to uncomfortable findings, i.e., that you delivered below your expectations, it is an integral part of building a successful business over time, since what you learn from the feedback can allow you to alter, modify and sometimes replace business models that are not working well.Just as great number crunchers can benefit from bring stories into their valuations, great story tellers will benefit by bringing in numbers to add discipline to their story telling.The Facebook Narrative
In the last few months, as Facebook has collapsed, investors seem to have forgotten about its astonishing climb in the decade prior, with market capitalization increasing from $100 billion at its IPO in 2012 to its trillion-dollar capitalization in July 2021. In my view, a key factor behind the stratospheric rise was the valuation story told by and about the company, and the story's appeal to investors.
The Facebook Story
The core of the Facebook story is its mammoth user base, especially if you include Instagram and WhatsApp as part of the Facebook ecosystem, but if that is all you focused on, you would be missing large parts of its appeal. In fact, the Facebook story has the following constituent parts:
Billions of intense users: If there is one lesson that we should have learned from our experiences with user-based and subscriber-based companies over the last decade, it is that not all users or subscribers are created equal. With Facebook, it is not just the roughly three billion people who are in its ecosystem that should draw your attention, but the amount of time they spend in it. Until TikTok recently supplanted it at the top, Facebook had the most intense user base of any social media platform, with users staying on the platform roughly an hour a day in 2019.Sharing personal data in their postings: As a platform that encourages users to share everything with their "friends", it is undeniable that Facebook has accumulated immense amounts of data about its users. If you are a privacy purist, and you find this unconscionable, it is worth noting that these users were not dragged on to a platform and forced to share their deeply personal thoughts and feelings, against their wishes. Which could be utilized to focus advertising at them: In 2018, at the peak of the Cambridge Analytica scandals, when people were piling on Facebook for its invasion of privacy, I noted invading user privacy, albeit with their tacit approval, lies at the core of Facebook's success in online advertising. In short, Facebook uses what it has learnt about the people inhabiting its platform to focus advertising to them.In a world where online ads were consuming the advertising business: Facebook also benefited from a macro shift in the advertising business, where advertisers were shifting from traditional advertising modes (newspapers, television, billboards etc.) to online advertising; online advertising increased from less than 10% of total advertising in 2005 to close to 60% of total adverting in 2020.In sum, the story that took Facebook to the heights that it reached in July 2021 was that of an online advertising juggernaut, whose success came from using the data that it had acquired on the billions of users who spent a chunk of their days on on its platform, to deliver focused advertising.And its appeal
Every business, especially in its youth, markets itself with a story and it is worth asking why investors took to Facebook's story so quickly and attached so much value to it.
 With revenues growing from less than $4 billion in 2011 to $118 billion in 2021, and operating margins of more than 40%,through almost the entire period, it is easy to see why both value and growth investors gravitated to this stock.
With value consequences I have valued Facebook many times over the last decade, and have bought and sold based upon my valuations. For those of you who have been following these valuations, I am sure that you are well aware that my most recent valuation of Facebook, at the end of February 2022, was $346 per share, well above the stock price then of $220/share:

Having bought shares in the company at $133/share after the Cambridge Analytica scandal in 2018, I stayed invested in the company. Obviously, at today's price of just over $100/share, it should be time for regrets, but I have none. There are clearly aspects of my valuation, where I overreached, including revenue growth of 8% a year that I would reset to a lower number, with the recognition that online advertising is seeing growth level off, faster than I thought it would, and is more cyclical than I assumed it would be. As for profitability, my estimated target operating margin of 40% looks hopelessly optimistic, given that the operating margins in the last twelve months is closer to 20%, but as I noted in my last post, that drop is less a reflection of a collapse in the online advertising business model and more the result of Facebook's big bet of Metaverse, and the expenses emanating from that bet.
Narrative Changes and Resets
The value of a business is, in large part, driven by your story for the business, but that story will change over time, as the business, the market it is in and the macro environment change. In some cases, the story can get bigger, leading to higher value, and in some, it can get smaller, and we will begin by looking at why business stories change, and classify those changes, before looking at the Facebook story.
Narrative Breaks, Changes and Shifts
If business stores change over time, what form will that change take? To answer the question, I broke down business story changes into three groups, with the proviso that there are some business changes that fall into more than one group:
Story breaks: The most consequential value change comes from a story break, where a key component of a business story breaks, sometimes due to external factors and sometimes due to miscalculations and missteps on the part of the management of the company. In the former group, we would include acts of God (terrorism, a hurricane or COVID) and regulatory or legal events (failure to get regulatory approval for a drug, for a pharmaceutical company) that put an end to a business model. In the latter, we would count companies where management pushed the limits of the law to breaking point and beyond, damaging its reputation to the point that it cannot continue in business. Story shifts: At the other end of the spectrum are story shifts, where the core business model remains intact, but its contours (in terms of growth, profitability and risk) change, as the result of market changes (market growth surges, slows or stalls), competitive dynamics (a competitor introduces a new product or withdraws an existing one) or technology (working in favor of the story or against it). Note the resulting changes in value can be substantial, and in either direction, depending on how and how much the valuation inputs change as a result of the story shift. Story changes: Finally, there are story changes, where a company augments an existing business story by investing in or acquiring a new business, shrinks its existing business by withdrawing or divesting an existing business or product or attempts a story reset or rebirth, by replacing an existing business story with a new one.I summarize these possible story alterations in the picture below:
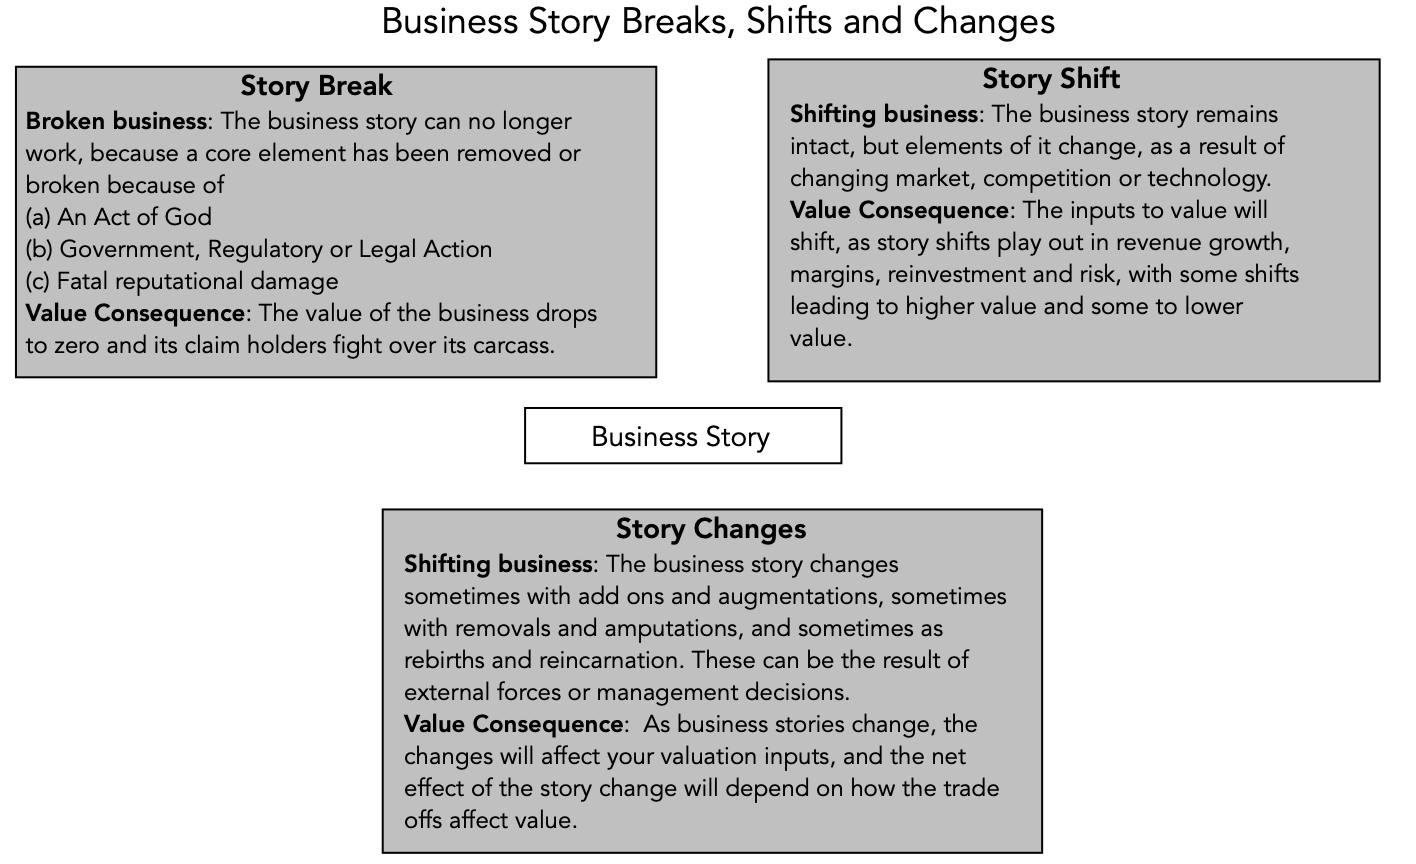
As you can see from the types of changes that can occur, some business story changes are triggered by external forces, and can be traced to changes in macroeconomic conditions, country risk or regulatory/legal structures, some business story changes are the result of management actions, at the company or at its competitors and some business story changes are the consequence of a company scaling up and/or aging. It is worth noting that disruption, at its core, creates changes to a sector or industry that can break some status-quo businesses, while creating new ones with significant value.
Facebook: A Narrative Reset?
In the last section, we looked at the incredible success that Facebook had between 2012 and 2021 with its user-driven, online advertising business model, both in terms of market capitalization (rising from $100 billion to $ 1 trillion) and in terms of operating results. You may wonder why a company that has had this much success with its story would need to change, but the last year and a half is an indication of how quickly business conditions can change.
Forces driving a reset
Facebook's original business story was built on two premises, with the first being the use of data that it obtained on its customers to deliver more focused advertisements and the second being the rapid growth in the online advertising business, largely at the expense of traditional advertising. Both premises are being challenged by developments on the ground, and as they weaken, so is the pull of the Facebook story.
Choices for the company
Faced with slower revenue growth and concerned about the effect that privacy regulations in the EU and the US will alter its business model, Facebook has been struggling with a way forward. As I see it, there were three choices that Facebook could have made (though we know, in hindsight, which one they picked):

Facebook has also telegraphed its commitment to be a leading player in this space, planning to invest close to $100 billion, over the next decade. The big question, as I noted in my last post, that hangs over the company is whether this investment can create enough in additional earnings and cash flows to cover these huge upfront costs.
What's the story?
Facebook’s plans to invest tens of billions in the Metaverse makes it an expensive venture, by any standards, and there are some who suggest that it is unprecedented, especially in technology, which many view as a capital-light business. That perception, though, collides with reality, especially when you look at how much big tech companies have been willing to invest to enter new businesses, albeit with mixed results.
Microsoft invested $15 billion for its entry in 2015 into Azure, its cloud business, and it has invested tens of billions in data centers since, expanding its reach. That investment has paid off both quickly and lucratively, and has played a role in Microsoft's rise in market capitalization.Google, renamed itself Alphabet in 2015, in a well-publicized effort to rebrand itself as more than just a search engine, and has invested tens of billions of dollars in its other businesses since, but with a payoff primarily in its cloud business, which generated $19.2 billion in revenues in 2021. Just to provide a measure of how its other bets are still lagging, Google generated only $753 million in revenues from its other businesses in 2021, almost unchanged from its revenues in 2019 and 2020.Amazon has also invested tens of billions in its other businesses, with its biggest payoff coming in the cloud business (notice a pattern here). It has much less to show for its investments in Alexa and entertainment, and it is estimated to have lost $5 billion on its Alexa division in 2021 and spent $13 billion on new content for Amazon video.Facebook, Microsoft and Google have all used the cash flows from their core businesses (Online advertising for Facebook and Google, Windows and Office for Microsoft) to fund their entry into new businesses, but at Amazon, it is the AWS (its cloud business) that has provided the profits and cash flows to cover its growth plans in other businesses. Facebook's investment plans for the Metaverse represent a big bet, but it is not an unprecedented one, which raises the question of why investors have been less willing to cut it slack than they have for its large tech competitors. One reason is timing, since markets are much more receptive to big growth investments, when times are good, as they were for much of the last decade, than in bad times, as much of 2022 has been. The other is the story line that backs the investment. Fairly or otherwise, the big cloud investments that Microsoft, Google and Amazon made came with story lines of growth and profitability that investors bought into, and for the most part, the results have justified that view. The more opaque investments, including Google's bets and Amazon's Alexa and prime video spending have been viewed more skeptically. The problem that most investors have with Facebook's Metaverse investment is that it is not just that the payoff is uncertain, but it is unclear what business the payoff will come from. After all, the Metaverse is a space (virtual), not a business, and to make money in that space, you need a business model, which Facebook has not provided much guidance on. In fact, the most detailed document that I was able to find anything on Facebook's Metaverse plans were from 2015, where Zuckerberg described his vision for the business, and from 2018, in a 50-page presentation that Facebook, where the company talks about revenues coming from advertising and hardware, but only in very general terms. It is true that Facebook has laid out its Connect 2021 vision online, but the document is heavy on hype and technology, and light on business details. As I see it, the combination of market conditions and opacity about business plans is creating the worst of all combinations for Facebook, in financial markets. The market has clarity about how much Facebook plans to spend on the Metaverse and is not just skeptical, but extremely confused, about how exactly Facebook will make money in the Metaverse. To give you a sense of how negative investors are about Facebook's future prospects, I created the most conservative estimate of value, which I call my Doomsday valuation, for the company based upon the following assumptions:I used the company's actual operating income from its online advertising business from the last twelve months, weighed down as they are from a slowing economy and a stronger economy, and assumed no growth and a remaining life of 20 years for the business, with a zero liquidation value at the end of year 20.I assumed that the company will continue to spend R&D at the same scorching rate that it set in the last twelve months, where it spent just over $32 billion on R&D, for the next 20 years.I also assumed that not only will Facebook to lose $10 billion a year on the Metaverse, but also that this will continue for the next decade and beyond, with no payoff in terms of increased revenues or earnings from this spending.I assume that Facebook is a risky company, falling at the 75th percentile of all US companies in terms of risk, and give it a cost of capital of 9%.The table below shows the value that I estimate with this combination of assumptions, and compares it to the value that I would obtain, if I removed the Metaverse numbers from the valuation:
 Download spreadsheet
Note that in Doomsday scenario, where Facebook continues to spend money on R&D and invest heavily in the Metaverse, with no payoff in higher growth or longer business life from those investments, the value of equity that I obtain is $258.6 billion. Doing the valuation with the Metaverse revenues and expenses removed from the mix yields $330 billion, suggesting that treating the entire Metaverse investment as wasted expenditure reduces Facebook's value by approximately $71 billion.
Download spreadsheet
Note that in Doomsday scenario, where Facebook continues to spend money on R&D and invest heavily in the Metaverse, with no payoff in higher growth or longer business life from those investments, the value of equity that I obtain is $258.6 billion. Doing the valuation with the Metaverse revenues and expenses removed from the mix yields $330 billion, suggesting that treating the entire Metaverse investment as wasted expenditure reduces Facebook's value by approximately $71 billion. The market capitalization of Facebook on October 29, 2022 was $247 billion, below the Doomsday scenario value, indicating that investors were, in fact, treating the $100 billion to be invested in the Metaverse as a wasted expense, a remarkably cynical and pessimistic take on a company that has had a history of delivering profits. The market capitalization has risen to $311 billion as of November 15, 2022, and while that suggests a more positive perspective, that value still reflects a presumption that the Metaverse investment will destroy about $18.9 billion of Facebook's value. In truth, using a more realistic growth rate (rather than zero) or lowering the cost of capital (from 9% to 8%, the median cost of capital for a US company) or extending the life of the company (from 20 years to a longer period) can only add value to Facebook, and you can experiment with these inputs in the attached spreadsheet.
Turning the Trust Corner It is undeniable that Facebook has lost the trust of investors, and that it is being priced on assumptions that reflect that mistrust. In my experience, trying to jawbone investors to trust you does not work, but there is a plan of action that Facebook can follow, that will start the process of rebuilding trust :
Tell with a business story for the Metaverse: Investors do not have a clear sense of what the Metaverse is, and more importantly, the business opportunities that exist in that space. Facebook needs to fill in that gap with a business story for its investments, laying out what is sees as a pathway to making money in that virtual world, as well as the strengths it will bring to delivering value on this path. I am sure that Facebook is much more qualified than I am to frame this story, but just in case they could use some guidance, here are a few possible Metaverse business models:

Of these choices, advertising clearly is the most logical extension of their existing business, but it also offers the least upside, since the company is already a dominant player in the online ad business. The acquisition of Oculus and the VR headsets that Facebook sells give it a foothold in the hardware business, but hardware is a business with lower margins and limited market size. The most lucrative story, in my view, is a ecosystem story, where Facebook gains a dominant share of the virtual world, and takes a slice of any business (transactions, gaming, subscriptions) done in that world, mirroring what Apple has done in its iPhone ecosystem. It is worth remembering that the audience that you are trying to sell this business story to is not the audience that you will be seeking out in the Metaverse, which would imply that your story should be less about technology and more about business. (I may be old and cranky. I have zero interest in the virtual world, but as a Facebook investor, I would be interested to learn its business model for this world.) Build in specifics into your investment story: Facebook has been clear about its plans to invest billions in its new businesses, but rather than just emphasizing the total amount that it plans to make, it would be better served connecting its investment plans with the business story being told. If nothing else, it would be useful to know how much of the $12 billion spent in Reality Labs was spent on people, on technology, on software and in making better VR glasses and why all of this spending is bringing the company closer to a money-making business model.With markers on operating payoffs: I know that there are huge uncertainties overhanging these investments, but it would still make sense to give rough estimates of how Facebook expects revenues and operating margins to evolve on its Metaverse investment, over time. That will give investors and managers targets to track, as the company delivers results, and use the results (positive or negative) to make changes in the way future investments are made.And escape hatches, if things don't work out: While many companies refuse to talk about what their plans are, if a business does not pan out, viewing it as a sign of weakness or lack of conviction, I believe that Facebook will be best served if they are open about what can go wrong with their Metaverse bet, and not only about what they are doing to protect themselves, if it happens, but also exit plans, if they decide to walk away. After all, if the market is already assuming the worst, as it was just a couple of weeks ago, how can any scenario you present, no matter how negative, worsen your market standing?As I mentioned in my first post on Facebook a couple of weeks ago, I made an exception to my rule of not doubling down and doubled my holding of Facebook on November 4, 2022, because its valuation looks compelling. I did so with the acceptance that I will have little influence over the management of the company, in general, and Mark Zuckerberg, in particular, and it is entirely possible that I will come to regret it. If I do so, I am sure that many of you will remind me, and I okay with that as well!
YouTube Video
Switch browsers if you have download problems
Spreadsheet Metaverse Value EffectFacebook 2022 Earnings Report PostsFacebook (Meta) Lesson 1: Corporate GovernanceFacebook (Meta) Lesson 2: Accounting inconsistencies and consequencesFacebook (Meta) Lesson 3: Tell me a story!
November 10, 2022
META Lesson 2: Accounting Inconsistencies and Consequences
In my last post, I used Facebook's recent troubles to talk about the importance of corporate governance, and how we, as investors, have abandoned the power to change management at many younger tech companies in return for being able to invest in young tech companies, with growth potential and well-regarded founders. In this post, I will revisit Facebook's most recent earnings report, and argue that while it contained disappointing news on growth and profitability, the bad news was exaggerated by systematic inconsistencies in how accountants categorize expenses, skewing earnings and invested capital down in firms that don't fit the accounting prototype. That skewing can affect valuation and pricing judgments about these firms, and correcting accounting inconsistencies is a key step towards leveling the playing field.
Accounting 101
I am not an accountant, and have no desire to be one, but I have used their output (accounting statements) as raw material in valuation and corporate finance. As I look at accounting from the outside, I see the primary role of accounting as recording and reporting, in a consistent and standardized form, the answers to three basic questions:
What does a business own? List out the assets that a business has invested in, and how much it spent on those investments and perhaps what these assets are worth today.What does the business owe? Specify the contractual commitments that a business has to meet, to stay in business. Simply put, this should include all borrowings, but is not restricted to thoseHow much money did the business make? Measure the profitability of the business, both with accounting judgments on expenses, and based upon cash in and cash out, over the period of measurement (quarter, year).It is in pursuit of answering these questions that accountants generate financial statements, and the three most basic are:
The balance sheet, which summarizes what a firm owns and owes at a point in time, as well as an estimate of what equity is worth (through accounting eyes).The income statement, which reports on how much a business earned in the period of analysis, while providing detail on revenues and expenses.The statement of cash flows, which reports on cash inflows and outflows to the firm during the period of analysis and allows for a measure of cash earnings (as opposed to accounting earnings) and cash flows.In recording transactions, most businesses are required to follow an accrual method, where transactions are recorded as they occur, rather than cash accounting, where you record items as you pay for them or get paid. In accrual accounting, accountants categorize expenses into operating, capital and financing expenses, with the distinction, at least in theory, being as follows:Operating expenses are expenses associated with generating the revenues reported by a business during a period. Thus, it includes not only the direct costs of producing the product or service the firm sells, but also other expenses associated with operations, including S, G & A expenses and marketing costs.Financing expenses are expenses associated with the use of non-equity financing, and in most firms, it takes the form of interest expenses on debt, short term and long term. Capital expenses are expenses that provide benefits over many years. For a manufacturing company, these can take the form of plant and equipment. For non-manufacturing companies, they can take on less conventional and tangible forms (and as well argue in the next section, accounting has never been good at dealing with these).This classification plays out across the financial statements and plays a key role in accounting assessments of profitability, capital invested and even cash flows. In the figure below, I trace out where operating, capital and financing expenses show up in the three financial statements: Operating expenses become part of cost of good sold or other operating expenses (like SG&A and adverting costs) in an income statement, and are key inputs in determining operating income. Capital expenses create assets on the balance sheet, in the year in which they are made, and when amortized or depreciated, in subsequent years, the resulting amortization or depreciation becomes part of operating expenses in those years. Financing expenses are expenses associated with the use of non-equity financing, with interest expenses on borrowing (short and long term) being the most common items, with the non-equity financing showing up as debt on the balance sheet, with interest expenses reducing your taxable and net income. The statement of cash flows is explicitly broken down into operating, investing and financing categories, with the distinction being that it looks at cash flows, not accounting expensing.
Accounting Inconsistencies and Pricing Consequences
In my introductory accounting class, I was told that accountants were scrupulous about expense classification, and that misclassifying financing expenses or capital expenses as operating expenses occurred rarely. In the years since, I have concluded that this is not true and that expense mis-categorization is not only common, but that it varies widely across sectors, making it difficult to compare accounting numbers or ratios across firms.
1. Financing Expenses treated as Operating Expenses
When a financing expense is treated as an operating expense, that mistake plays out across the financial statements. In the income statement, this classification error moves an expense that should be below the operating income line, to above it, reducing operating income. The misclassification also means that the balance sheet recording of debt will not include the financing that gave rise to the mis-categorized expense:

As you can see, treating a financing expense as an operating expense has no effect on net income, but its effects will ripple through elsewhere affecting operating income (usually lowering it) and understating the borrowing on the balance sheet. To the extent that these numbers are used in computing financial ratios, it will affect your measures of operating income and return on invested capital. Until accountants came to their senses in 2019, they routinely treated a large segment of leases as debt, with questionable reasons, and skewed operating margins, returns on capital and debt ratios in lease-heavy sectors like retailing and restaurants. However, leases are only one of many other contractual commitments that meet the "debt" criteria, and require similar corrections. Thus, the content commitments at Netflix, representing contractual commitments on content that Netflix has obtained rights to, from other studios, as well as some purchase commitments at companies may require the same corrective treatment as leases.
2. Capital Expenses treated as Operating Expenses
Treating a capital expense as an operating expense also plays out across the financial statements, and we will use R&D, which is the most widely mis-categorized cap ex, to illustrate. When R&D is expensed, it pushes down both operating and net income for companies with growing R&D expenses over time; in the rarer case of declining companies where R&D has been dropping over time, it will have the opposite effect. In addition, the mistreatment of R&D as an operating expense will mean that the expense will not create an asset on the balance sheet, as capital expenses should, with consequences for your measures of book equity and capital invested:
 The capitalization of R&D requires making an assumption about how long it will take for R&D, on average, to generate commercial products, with longer R&D lives for pharmaceutical companies and much shorter ones for technology and software companies. In general, correcting the accounting mistake will increase operating and net profits, at most firms, as well as book equity and invested capital, and for most firms that spend money on R&D, capitalizing R&D will lower accounting returns (return on equity and return on invested capital).
The arguments that we used for treating R&D as a capital expense, i.e., that the expense is intended to create benefits over many years and not in the current one, can also be used on other items that accountants routinely treat as operating expenses, such asExploration costs at natural resource companies, since even if successful, the reserves found will not add to revenues or income until years into the future.Advertising expenses to build brand name at consumer product companies, and especially so at companies (like Coca Cola) that are dependent on brand name for both growth and pricing power. Note that not all business advertising is for building brand name, and capitalizing brand-name advertising will require separating advertising expenses into portions intended to sustain and increase current sales (operating expense) and for building brand name (capital expense).Use/Subscriber acquisition costs at user or subscriber based firms, at companies that have built their value propositions around user or subscriber numbers. Note that the capitalization effect will depend on how long an acquired subscriber or user will stay with the business, with longer customer lives creating a bigger impact, from correction.Employee recruiting and training expenses at consulting and human-capital driven firms, since their growth depends, in large part, on their employee quality and retention. Here again, the effect of capitalizing employee-related expenses will depend on employee tenure, with longer tenure creating a bigger effect, when the correction is made.In making these corrections, you will face push back. Accountants will use the argument that the benefits are uncertain, true for some of these expenses, like R&D, but also true for many investments in fixed assets (factories, capacity etc) that are currently treated as capital expenses. Uncertainty about future benefits should never be the litmus test for whether to treat an expense as a capital or operating expense; instead, the focus should be on when you can expect to generate those uncertain benefits. Some may push back, arguing that making this correction will push up earnings at these companies, to which your response should be that this is exactly what you should be doing, if it reflects reality. The truth is that accounting has a legacy problem, where almost all of the rules that underlie accounting reflect the fact that they were written for the manufacturing companies that dominated the twentieth century. As technology companies, in particular, have taken an increasing share of the economy and the market, accounting has tried to catch up, with new rules on expensing and valuing intangible assets, but it remains decades behind reality.
3. Pricing and Investing Consequences Even if you agree with me on the logic of correcting for accounting inconsistencies, you may wonder whether the effort of making these corrections is worth the effort. I believe it is, since failure to do so can have both valuation and pricing consequences. In the table below, I capture the effects of moving an item from operating to financing (as we do in the lease correction) and from operating to capital (as is the case when we capitalize R&D):
 I believe that correcting for accounting inconsistencies is worth the trouble, given the value and pricing consequences. That is the reason I employ both corrections, albeit with a bludgeon, to reestimate company numbers, when I do my data updates for industry averages (for debt ratios, accounting returns, profit margins and reinvestment) at the start of every year.
Facebook: Cleaning up the Accounting
As you take a look at the most recent quarterly earnings report from Facebook, it is worth drawing on the discussion about accounting inconsistencies. Without contesting the basic conclusion that Facebook had a bad operating quarter, after its earnings report for the third quarter of 2022, let's review the accounting numbers to see how bad it truly was, and why.
The R&D Effect
As a technology company with billions of users on its platform, and increasing calls for respecting data privacy, Facebook needs to spend on R&D, and it has done so heavily all of its corporate life. In the chart below, I report on Facebook's R&D spending each year from 2011 to the last twelve months (ending September 2022):

In the last twelve months, Facebook spent $32.6 billion on R&D, making it one of the largest corporate spenders on research and development in the world; seven of the top ten companies, in R&D spending, are technology companies with two pharmaceutical companies and one automobile company (Volkswagen) rounding out the list. From the graph, you can also see that Facebook's spending on R&D has only accelerated in the last five years, even as it scales up, and that R&D growth will determine the impact of capitalizing it. Using a 3-year life for R&D, I estimate the capital invested in R&D to be $53.1 billion (which adds to book equity in 2022) in September 2022, and the R&D amortization for the most recent twelve months to be $18.9 billion. (In R&D capitalization, I use a range of 2-10 years, depending on the sector, with 3 years for most technology and software companies).
To correct earnings (net and operating income) each year, I add back that year's R&D expense and net out the amortization of R&D in that year, and I report this restated income from 2011 to 2022 in the graph below:
 As you can see, the adjusted pre-tax operating income numbers are significantly higher every year, because of the adjustment, with the pre-tax operating income increasing from $35.5 billion to $49.3 billion in the last twelve months (ending September 2022). Since net income increases by the same magnitude, the company generated $42.5 billion in net income in the last twelve months, if you correct for R&D, rather than $28.8 billion, as reported.
Since R&D capitalization also pushes up the book value of equity, and by extension, the invested capital in the firm, I looked at the effect of capitalizing R&D on invested capital and return on invested capital, over time:
 For the most part, capitalizing R&D lowers the return on invested capital, with the pre-tax return on invested capital dropping from 38.91% to 34.10%, in the most recent twelve months, after the correction. While these are returns that most companies in the world would gladly exchange for their own, the trend downwards over time is a reflection of the challenges of scaling up as well as competition within the business. The online advertising business is not just seeing slower growth, but increased competition and regulatory pressures (over privacy) are lowering the returns that can be made in the business.
The Metaverse Investment
In the last few years, Facebook has been supplementing its R&D investments with substantive investments in the Metaverse, and it has been open about its plans to invest huge amounts in the future. The extent of Facebook's Metaverse bet, and its effects on the bottom line, are visible in this excerpt from the most recent quarterly report filed by the company:
 Facebook 10Q, 2022 Third Quarter
In the last twelve months, Reality Labs, which comprises a big portion of the company's investment in the Metaverse and houses its VR glasses (acquired originally from Oculus), generated revenues of $2,310 million (add the revenues in the first nine months of 2022 to the last quarter numbers from 2021), while adding $12,741 million to operating expenses. We are certain that while some of these reality-lab related expenses are operating, a large portion represent capital expenses that are being expensed. The effect of Reality Labs on Facebook's income numbers can be seen below:

Without the expense drag created by Reality Labs, Facebook's operating margin would have been almost 12% higher, at 53.54%, instead of the 41.7% that we obtained, after correcting for R&D. While it is true that Facebook has spent this money, no matter how you categorize it, it is also true that if accounting stayed consistent in its capital expenditure treatment, much of this money should have been treated as a capital expense.
Consequences My intent, when I started this post, was not to promote or to discount Facebook as an investment, but to provide some light on where Facebook stands right now (in terms of growth, profitability and risk), given the most recent quarter's earnings report:
Profitability: There is no denying that Facebook's revenues have flattened out, though a stronger dollar and slowing economic growth are partially responsible. However, the drop in operating and net margins that you saw in the most recent earnings report should not be taken as a sign that the profitability of the company's online has imploded. In fact, correcting for R&D and the Reality Lab investment, you can see that the online advertising business remains a money machine, generating sky-high margins. In fact, almost all of the drop in profitability is coming from Facebook's R&D and Metaverse investments, and if a large portion of that expenditure were treated as capital expense, that drop would have been far smaller. Pricing: As Facebook's market cap has declined to approximately $250 billion, some have noted that the company now trades at about 8 times earnings, if you use the net income of $28.8 billion assessed by accountants. However, if you are comparing Facebook's PE ratio to the PE ratios of non-tech companies, for consistent comparisons, you should be using the adjusted net income of $42.5 billion, which results in an adjusted PE ratio of about 6. I don't use PE or EV to EBITDA multiples as my primary stock picking tool, but if you do, Facebook looks far cheaper, relative to other companies, after you have adjusted for its misclassified capital expenditures (R&D and Metaverse).Valuation: From a valuation perspective, you care about cash flows, and since R&D and the Metaverse investments are cash outflows, Facebook's investments in these will lower cash flows. The value effect, though, will depend upon whether you think these investments will pay off in future revenue growth and higher cash flows in the future, and investors, at least at the moment, are not only not giving Facebook the benefit of the doubt, but seem to be actively building in the presumption that this is essentially wasted money, with no payoffs at all. As I will argue more extensively in my next post, I assign a great deal of blame for this investor mistrust to Facebook, because the company seems to have made almost no effort to explain its business model for generating revenues and profits from the Metaverse. In short, the only thing that Facebook has been clear about is that they will invest tens of billions of dollars in the Metaverse, while being opaque about how it plans to make money in that space. Remember that even if we all buy Facebook VR glasses and spend half our lives in the virtual world, for Facebook to make money, it has to either collect money from us (subscriptions or transactions) or show us advertising.In sum, though, capitalizing R&D and the Metaverse investments is a good idea, whether you are an optimist or pessimist about the company. If you are bullish on Facebook, you will have convince others and, more importantly, yourself, that you expect Facebook (and Zuckerberg) to deliver a payoff on the Metaverse investment that justifies its scale. If you are in the pessimist group, it is important that your reasoning for why Facebook is a poor investment, at a PE ratio of 6, is not based upon the false premise that its prime operating business (online advertising) has becoming less profitable (it has not) but upon a judgment that you have made that Zuckerberg's ego has overridden his business sense, and that without the safety rails of corporate governance, he will continue to throw good money into a bad idea for the foreseeable future.
YouTube Video
Lessons from FacebookMETA Lesson 1: Corporate GovernanceMETA Lesson 2: Accounting Inconsistencies and ConsequencesMETA Lesson 3: The Importance of NarrativeSupplemental MaterialMy Online Accounting Class (Quirky, but free)Lease Capitalization SpreadsheetR&D Capitalization Spreadsheet
November 4, 2022
META Lesson 1: Corporate Governance
As we get deeper into earnings season for the third quarter of 2022, the biggest negative surprises are coming from technology companies, with the tech giants leading the way. Investors, used to a decade of better-than-expected earnings and rising stock prices at these companies, have been blindsided by unexpected bad news in earnings reports, and have knocked down the market capitalization of these companies by hundreds of billions of dollars in the last few weeks. Facebook (or Meta, if you prefer its new name), in particular, has been in the eye of the storm, down more than 75% from the trillion-dollar market capitalization that it enjoyed just over a year ago. In its last earnings report, the company managed to disappoint almost every segment of the market, shocking growth investors with a drop in quarterly revenues, and value investors with a sharp decline in earnings and cash flows. In the days after the report, the reaction has predictably fallen into the extremes, with one group arguing that this is the beginning of the end for the company's business and the other suggesting that this is the time to buy the stock, as it prepares for a new growth spurt.
Having valued and invested in Facebook multiple times in the last decade, I will throw my two cents in, but rather than make the earnings report the center of attention, I will use the company's recent travails to talk about three issues that I think are big issues not only at Facebook, but for the entire market. In this first post, I will use the investor debate about Facebook to talk about corporate governance, what it is, why it matters and how I think governance disclosure research, rules and scoring services have lost the script in the last two decades. In the next post, I will use Facebook's most recent earnings surprise to talk about inconsistencies in how accountants categorize corporate spending, and why these inconsistencies can skew investors perceptions of corporate profitability and financial health. In the third and final post, I will argue that Facebook's troubles with the market have as much to do with a failure of narrative, as they are about disappointing numbers, and present a template for what the company needs to do, to reclaim the high ground.
Facebook: Filling in the Background
It is worth noting that in good times, when earnings are rising and stock prices are upward bound, investors do not seem to have much interest in corporate governance, and it is only when the numbers start to move against them, that they rediscover the importance of the topic. To understand why talk about corporate governance at Facebook has been muted for much of its corporate life, and why it is a prime topic of conversation now, let's retrace Facebook's journey, over the last decade, from a young VC-backed private company to a high-profile public company.
The Market Journey
Facebook is a young company, at least in chronological time, having been public for just over a decade. I have written about the firm many times, over that period, starting with a valuation that I did of the company in 2012, just ahead of it going public. On May 12, 2012, Facebook's debuted in financial markets, with a capitalization of $104 billion, making it one of the most valuable IPOs of all time. After a rough start, with its stock price halving by August 2012, the company embarked on an extraordinary run in markets, adding almost $900 billion to its market capitalization to briefly breach a trillion dollars in July 2021. In a post in 2020, I highlighted how much of the increase in US equity values in the 2010-2019 decade was because of the FANGAM stocks (Facebook, Amazon, Netflix, Google, Apple and Microsoft):

Since July 2021, Facebook's market standing has fallen precipitously, with its market capitalization down to less than $250 billion (down more than 75% from its high) on October 27, after its most recent earnings report. As Facebook's market capitalization has collapsed, it is worth stepping back and gaining perspective about its market performance in the long term.
Buy and hold returns: If you had bought shares in Facebook on its first trading day, you would have paid $38.12, and if you had held the stock through October 27, 2022, when it was trading at $93/share, that would have translated into a cumulative return of 144%. That would have left you lagging the 181% price appreciation that you would have earned on the S&P 500 during the period, and even more so, if you consider the fact that you would have earned no dividends on Facebook, while generating about a 2% dividend yield, every year on the index.Current standing: At a roughly $250 billion market capitalization, Facebook is a large market-cap company, but it has lost its standing among the largest market cap companies in the world that if occupied for an extended period during the last decade. Trader's game: Along the way, Facebook has had its ups and downs, and a savvy trader who was able to time entry and exit into the stock at the right times, would have made a killing on the stock. I know that can be said of any stock, but the swings in fortune are much greater at companies like Facebook, making them them the preferred habitat for traders of all stripes.In sum, the investor experience with Facebook over the last decade should be a cautionary note on passing judgment on companies after short periods, where the stock soars or sinks, sometimes for no good reasons.The Operating Journey
The drop in Facebook's stock price that has occurred in 2022 is part of a larger story of a decline in tech companies during the year. For many value investors, the tech stock drop has been vindication that no sector, no matter how favored, can fight gravity in the long term, but they would be making a mistake if they bundle Facebook in with younger tech companies, many of which have unformed business models and an inability to be profitable. Through its entire life, one of Facebook's most impressive features has been its capacity not only to generate profits but very large profits, as you can see in the chart below:

Note that Facebook, then it went public, had revenues of only $3.7 billion, but it generated an operating margin of 47.3%, with its online advertising model. In the decade since, its has been able to scale up revenues dramatically, with revenues reach $118 billion in 2021, while preserving sky-high margins, close to 40% in 2021. In short, Facebook has been a profit and cash machine for its entire public market life, and there is more to this company than traders pushing up stock prices on momentum.
It is this historical context of high growth, albeit slowing as the company scales up, and consistently high operating margins, that should explain investor reactions to last week's earnings report. There were at least two negative surprises in the report that led to investor reassessment:
Flat revenues: While revenue growth has been slowing in recent quarters, and investors would perhaps have lived with single digit growth, especially with advertising spending slowing, they were blindsided when the company reported its second consecutive year-on-year quarterly revenue decline . The company's contention was that the decline was driven by a slowing down in online advertising revenues at the firm, mirroring similar slowdowns at other online advertising platforms.
That said, there is clearly more to it than an industry-wide slowdown, since the drop in revenues at Facebook has been larger than the drops seen across the sector; Google, for instance, reported a third quarter year-on-year revenue growth rate of 6% in October 2022.Drop in operating margins: The bigger shock in the most recent earnings report, in my view, was the collapse in operating margins.
While the decline in operating income in the first two quarters of 2022 mirror drops in revenues in those quarters, the decline in the third quarter cannot be explained by lower revenues in that quarter. The company attributed the decline in operating income to its Reality Labs unit, which houses its VR headsets, with reported revenues of $285 million and an operating loss of $3.67 billion in the third quarter of 2022. It is undeniable that the third quarter numbers for Facebook were disappointing, but again taking a longer term perspective, most companies would gladly switch places with Facebook, with revenues of more than $100 billion, and operating margins of 20%-30%. The question that we face now, as prospective investors, is whether the market has overreacted to a quarter's bad numbers or whether this is the beginning of the end for the company's core business model.
The Troubles
While 2022 has been a particularly difficult year for Facebook, the troubles at the company date back to 2018, when it was revealed that Cambridge Analytica, a UK-based data service with political clients, had acquired and utilized Facebook data on tens of millions of users. In the aftermath, Facebook faced both political and investing backlash, with its stock price dropping by more than 10% and there were some doomsayers who argued that its business model was irretrievably broken, because of the privacy challenges. At the time, I pointed to the hypocrisy of critics complaining about Facebook's privacy lapses on their Facebook pages, and argued that the company would weather the scandal, albeit with scars. In the months after, that view was vindicated as Facebook spent billions on tightening security, while continuing to grow revenues and report sky-high margins, and the market responded by pushing up its stock price once again.
While Facebook was able to deal with the privacy challenge, relatively unscathed in economic terms, there are three other problems that the company is facing that will not be as easily overcome:
Online Ad Market Leveling off: Facebook is an online advertising company, and for much of its early years, it benefited from growth in the online advertising market, largely at the expense of traditional advertising (newspapers, television etc.). As online advertising approaches two-thirds of all advertising, that growth is now leveling off, and as one of the two largest players (and beneficiaries) of the market, Facebook is facing a growth crunch.Online advertising is cyclical: As online advertising has grown over the last decade, one of the questions has been whether it, like all advertising historically, is cyclical. Prior to this year, there were some who argued that online advertising would be more resilient than traditional advertising, in the face of economic shocks, but this year's developments have shown otherwise. As economic growth has slowed and concerns about a recession have risen, revenue growth has dropped at all of the companies in this space has declined. The conclusion is that online advertising is cyclical, and if we are in the midst of an economic slowdown, the companies in this space will feel the pain.Reputation effects: While Facebook made it through the privacy challenges with revenue growth and profitability intact, it is undeniable that the company's reputation took a beating. In my view, this toxicity, as much as the desire to enter a new market in the Metaverse, explains to Meta in November 2021.In fact, it is this trifecta of developments (a maturing online ad market, exposure to economic cyclicality and reputation damage), in conjunction with Facebook's disappointing operating numbers that has led investors to reassess its worth, and mark down its price.
Corporate Governance
As stock prices have dropped this year, not only is there an increased focus on earnings and cash flows, as I noted in my last post, but there seems to also be an reawakening among investors about the importance of corporate governance, as can be seen in this article about Facebook. Having seen these awakenings many times over the last 30 years, I am cynical that anything productive will come out of these discussions, since we seem to have lost sight of what corporate governance is and why it matters to investors.
The Stakeholders
To set the stage for understanding corporate governance, it is best to start with a recognition of the different stakeholders in a publicly traded company:

While all of these claim holders have stakes in the company, their interests will diverge, raising a key question of whose interests should be served by the managers of the company, when making business decisions, small or large. It is true that conventional corporate finance (and the Delaware courts) give primacy to shareholders, and it is not because shareholders are a special or protected group, but It is because they are the only claim holders that do not have a contractual claim on the firm; as shareholders you get what's left over after contractual claims (wages, interest expenses) have been met. Lenders can negotiate interest and principal payments and insert covenants to protect themselves, employees have employment contracts and sometimes unions to negotiate wages and benefits, and customers can choose to buy or not buy a company's products and services.
There is of course a notion that managers should be accountable to all stakeholders, not just stockholders, an idea that was born and nurtured in law schools, before finding a footing in business. In a 2019 post, I presented my arguments for why stakeholder wealth maximization is fanciful in its belief that it is management's job to juggle the divergent interests of different stakeholders and dangerous insofar as it makes managers accountable to everyone, and by extension, to no one. (Note that the G in ESG is about stakeholder governance, not shareholder governance, which may explain why CEOs have been so quick to jump on its bandwagon.)
Conflicts of Interests and Consequences If you are looking at a privately owned business, with a sole owner who also runs the business, the interests of owners and managers converge, but this is the exception, not the rule. Even in a family-owned business, where one family member runs the business, you can have other family members disagree about how it is run, leading to frictions and legal battles. (If you are a fan of Succession on HBO, you know exactly what I am talking about). As businesses seek external capital to grow, either from private hands (venture capitalists) or public equity, the divergence between the interests of those running businesses and the owners of these businesses will increase. That is the core challenge in corporate governance, and any discussion of the topic has to begin with answers to three questions:In what types of firms is this conflict of interest greatest? If the conflict of interest that is at the heart of corporate governance is that between the owners of a business and those who manage that business, it will begin when private businesses seek out capital from external sources, as founder and venture capital interests can diverge. These conflicts will expand, as companies go first go public, and the interests of insiders and founders, who run the firm, can be at odds with the interests of outside shareholders. As companies age, founders will move on and get replaced by professional managers, and these managerial interests can clearly be at odds with those of shareholders, with boards of directors, in theory, watching out for the latter. In short, conflicts of interest exist at almost all businesses, though the nature of the conflict will change as companies go from private to public, and as they age.When the interests of shareholders and corporate decision-makers diverge, what are the consequences for the company? When the interests of decision makers or managers at a business diverge from those of its owners, it is inevitable that there will be decisions made that advance the interests of the former at the expense of the latter. With private business that access venture capital, founders may make decisions (on product design, business models, marketing) that venture capitalists may not find to their liking. With public companies that are run by founders/insiders, the decisions made by inside shareholders to advance their interests may not align with the interests of outside shareholders. In older public companies, the investing, financing and dividend decisions that managers make may by in direct opposition to what shareholders would like them to do.What are the checks on these conflicts of interest? In each of the scenarios described above, it is true that there are mechanisms that exist to keep these conflicts in check. In private firms with venture capital investors, VC investors are often actively involved in management, and, if they have the power, have few compunctions about pushing out founder/managers who don’t serve their interests. In public companies, with insiders and founders in charge, the only recourse that outside shareholders often have, if they feel their interests are being ignored, is to sell and move on, hoping that the resulting drop in stock prices causes a change in course. In theory, the boards of directors at these companies are supposed to protect shareholder interests, but that protection is sporadic and often ineffective.In short, while corporate governance is often framed as being entirely about the conflicts of interests between managers and shareholders at companies with dispersed shareholdings, its reach is much broader, and it is relevant at almost every business.
The Essence of Corporate Governance
After five decades of research in corporate governance, my sense is that we have lost the forest for the trees, with the composition of boards of directors and rules on proxy voting receiving disproportionate attention, from both legislators and regulators, often at the expense of bigger and more consequential issues. In the aftermath of the Enron and Tyco scandals in the United States, where insider-dominated boards were negligent in their oversight responsibilities, the Sarbanes-Oxley Act was passed in 2002, with improved corporate governance as one of its objectives. At about the same time, you saw the advent of services that used the disclosures that companies were required to make on governance to estimate corporate governance scores. We were told at the time that the combination of independent boards, increased disclosure and governance scores would create a revolution in corporate governance, where managers would act to advance shareholder interests. It is clear that twenty years later that all that Sarbanes Oxley has accomplished is replacing ineffective insider-dominated boards with ineffective independent boards, while creating hundreds of pages of disclosure that no one reads and giving rise to scores that are close to useless in judging governance. With the push towards diversity in board composition now taking precedence, this process is hurtling even more into irrelevance, with the only positive being that the ineffective boards of the future will meet all our diversity criteria.
I believe that for a true shift in corporate governance to happen, we have to reframe the meaning of good corporate governance, shifting away from a board-centered, check-box driven view to one that is centered on giving shareholders the power to change company management, if they choose to. In fact, good corporate governance is like a good democracy, where shareholders (voters) get the power to change management (governments), when they believe that their interests are not being served. As in a democracy, there is no guarantee that shareholders will make the right or even informed choices, sometimes choosing not to make changes, even when change is required, and sometimes deciding to replace good managers with bad ones. Good corporate governance is sometimes chaotic and often unsettling, and it is no surprise that there are many who are drawn to the benevolent dictatorship model, where "qualified, well-intentioned managers" are given lifetime tenure, with shareholders stripped of the power to challenge them. That latter model was the default for publicly traded companies in much of the world, for the twentieth century, and even in the US, you had managerial apologists like Marty Lipton and corporate strategists arguing that corporate management would be more effective, without shareholder oversight.
The "Right" Management: A Corporate Life Cycle Perspective
If corporate governance is about giving more power to business owners to change management at the companies that they are invested in, if they choose to, to understand it, we have to begin by looking at why management change may be needed in the first place. I will use the corporate life cycle, a structure that I have used in many other contexts, to set the stage for this discussion, by noting that the qualities that you will look for in "good" management will change as companies move through the life cycle, from start-up to growth to mature and then on to final decline. In the figure below, I have highlighted the role that top management play at a business, and how that role will change as companies age.
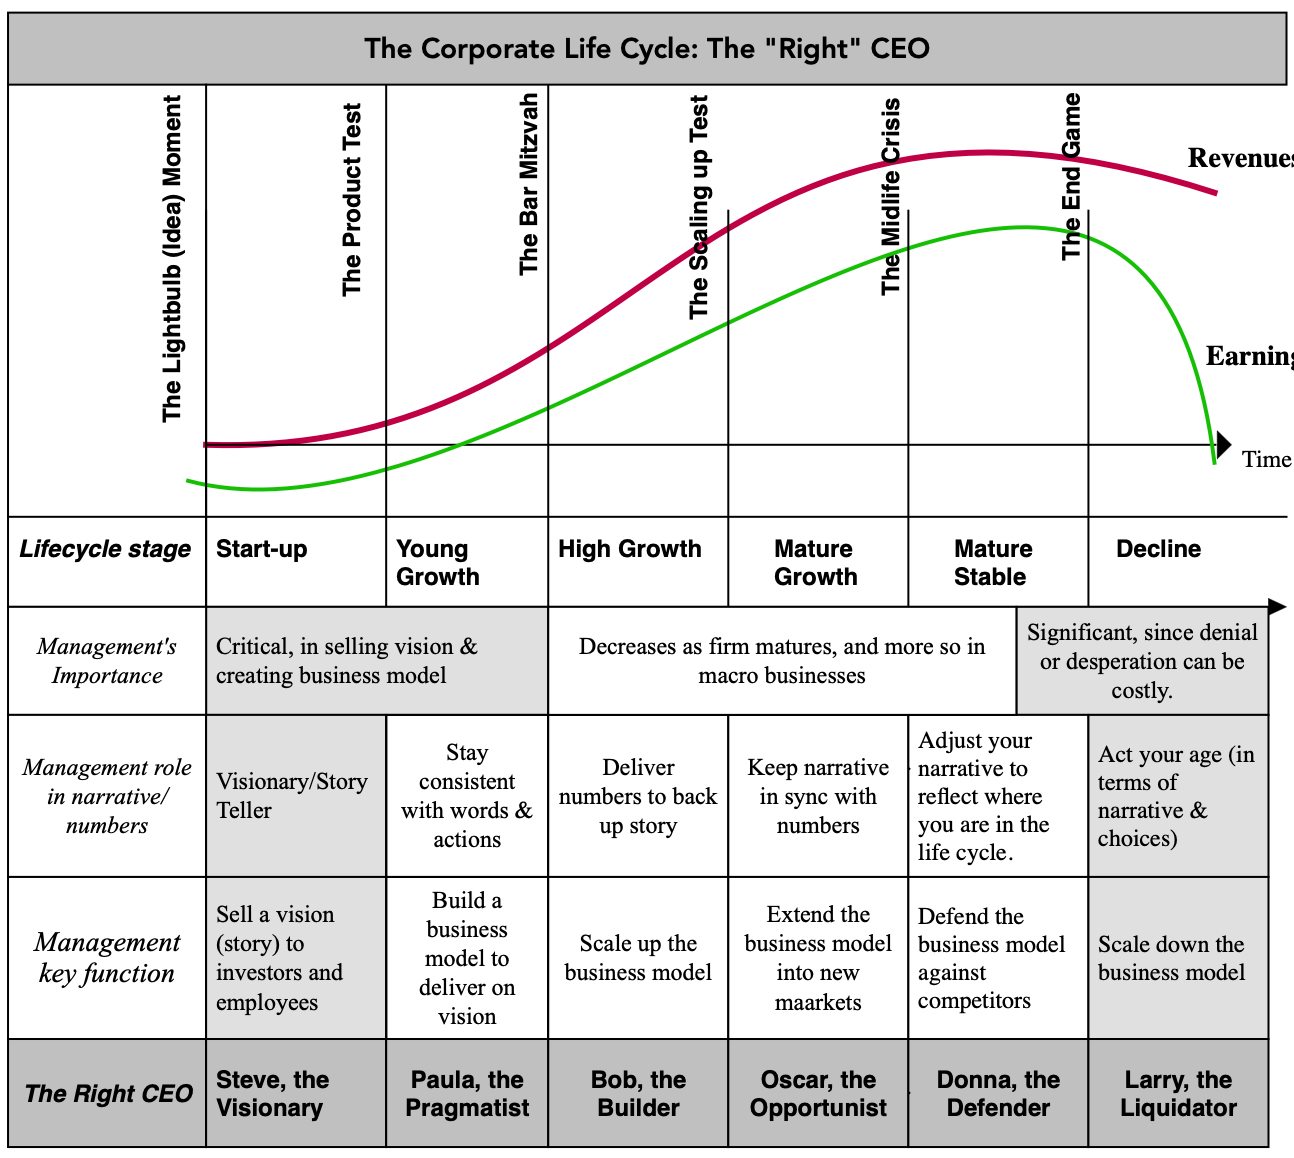
Early in the life cycle, as a start-up, the quality that you value most in your top management (and especially in your CEO) is vision, the capacity to tell the story of the business, and get investors and employees on board. As you move from idea to product, you still need vision, but it has been paired with pragmatism, and you would like the business to be run by someone who is willing to make compromises on design and strategy, to create a market for the product. The trash can of failed businesses is filled with purist founders who insisted on having their way, and refused to bend their dreams to meet reality. In the next phase, you need a CEO who is willing to do the work needed to build a business, an often unexciting job that requires attention to supply chains, marketing campaigns and product manufacturing. As businesses look to scale up, they are best led by opportunists who can seek out new markets that allow small businesses to become bigger, and once mature, you want an executive at the top who can play defense against competitors and disruptors. In decline, you need a realist who takes what the business has to offer, and does not try to overreach, in many ways the polar opposite of the visionary you sought out as a start-up.
Management Mismatches across the Life Cycle
Understanding how the qualities that you look for in good management change, as the company changes, provides a framework for assessing why you can end up with management mismatches, where the managers running the firm are unsuited to running it. In some cases, it can happen because the business changes (from start up to young growth or from high growth to mature), but the person running it does not, will not or cannot change. In other cases, it can represent a hiring mistake, as is the case when the board of directors at a high growth firm seek out the CEO of a mature company, competent but risk-averse, to run their business. In still others, it can just be hopeful thinking, where the board of directors at a declining firm seek out a visionary CEO, hoping that this hire can reverse aging and become young again. In the figure below, I have listed CEO/Company mismatches across the life cycle:
 I also highlight the catalysts for management change at each stage. In very young firms, it is disgruntled venture capitalists who pressure founders who, they believe, are not paying enough attention to business-building, to change their ways or even leave their positions. In publicly traded firms, the catalysts can be activist investors, who pressure businesses to change the way they are run or even who runs them, hostile acquirers, hoping for revamps, or private equity funds, with plans for liquidating or breaking up the firm.
Management Mismatch Consequences In most firms, even in the countries that are viewed as strong on corporate governance, there are barriers to change that are daunting, which explains why forced management changes are infrequent. Thus, venture capitalists may be stymied, when trying to replace founders, by the founders' controlling stakes. With high-growth firms that are publicly traded, insiders and founders holding large stakes can make it difficult for outside shareholders to push for charge, and as firms mature and age, it is the passivity of institutional investors that is the biggest impediment to change.
When a management mismatch persists, the consequences can range from the benign to very damaging:
 In the most benign case, the mismatched manager recognizes his or her limitations and hires help to remedy them. In my view, the biggest difference between Steve Jobs in his first iteration at Apple, when his stubbornness damaged the company, and his legendary second stint at the company, was the presence of Tim Cook, as his chief operating officer. In an intermediate scenario, the board of directors eventually faces up to the reality of the mismatch, often because of poor stock price performance, and replaces the management, but not before serious damage has been done. In the most malignant scenario, the mismatched manager stays in place, destroying value and running the business into the ground, and perhaps into bankruptcy.
Corporate Governance at Technology Companies With that long lead-in on corporate governance, let's look at technology companies, partly because they are the largest sector in terms of market capitalization, and partly because this post is on Facebook, a large technology company. I will argue, using the life cycle structure, that tech companies age much faster than non-tech businesses, and are thus more exposed to management mismatches. Troublingly, it is precisely in these companies, where the need for corporate governance is greatest, that we (as investors) seem to have acquiesced to structures that give us the least power to push for change.
The Compressed Life Cycle
A corporate life cycle resembles the human life cycle, in terms of its sequence, but there are two significant differences. The first is that the mortality rate is far higher in the corporate life cycle, as more than two thirds of businesses do not make it through the early stages, than it is for human beings, at least in the twenty first century. The second is that unlike the human life, the corporate life cycle does not follow chronological time. Kongo Gumi, a family-owned Japanese company in the business of constructing temples and shrines, lasted for almost 1500 years, before being acquired in 2006. In contrast, there are businesses that are shooting stars that survive for only 15 or 20 years, before liquidating or selling themselves. In the figure below, I look at the variables that determine how quickly a business grows, how long it stays at the top and the speed of its decline:
 Companies in businesses with low capital intensity and ease of access to the market and capital will grow much more quickly than businesses without these characteristics, but those same features will make it difficult for them to stay at the top for very long and accelerate their decline. That is the basis for a post that I wrote about why technology companies have compressed life cycles, relative to manufacturing or infrastructure companies:

Just to illustrate, the great companies of the twentieth century, such as Exxon Mobil, GE and Ford, might be looking at the declining phases of their life cycles now, but they have had extraordinarily long lives (Exxon was founded in 1859, GE in 1892 and Ford in 1903). In contrast, a company like Yahoo! was able to get from its founding in 1994 to a hundred-billion dollar market capitalization five years later, but its glory days lasted until 2004, when Google entered the game, and decline, once it started, was unstoppable, leading to its demise in 2017. (Marissa Mayer tried, but she never had a chance...)
We believe that this compressed life cycle has consequences for management mismatches. With the long life-cycle companies that characterizes the twentieth century, companies and managers both aged over time, allowing for transitions to occur more naturally. To see, why consider how corporate governance played out at Ford, a twentieth century corporate success story. Henry Ford, undoubtedly a visionary, but a crank on some dimensions, was Ford's CEO from 1906 to 1945. His vision of making automobiles affordable to the masses, with the Model T (but only in black), was a catalyst in Ford's success, but by the end of his tenure in 1945, his management style was already out of sync with the company. With Ford, time and mortality solved the problem, and his grandson, Henry Ford II, was a better custodian for the firms in the decades that followed. Put simply, when a company lasts for a century, the progression of time naturally takes care of mismatches and succession. In contrast, consider how quickly Blackberry, as a company, soared, how short its stay at the top was, and how steep its descent was, as other companies entered the smartphone business. Mike Lazaridis, one of the co-founders of the company, and Jim Balsillie, the CEO he hired in 1992 to guide the company, presided over both its soaring success, gaining accolades for their management skills for doing so, as well as its collapse, drawing jeers from the same crowd. By the time, the change in top management happened in 2012, it was viewed as too little, too late. Put simply, if the companies that dominate the market today have compressed life cycles, relative to the companies of the last century, we should ready ourselves for far more cases of management mismatches.
The Investor Surrender
If you accept my thesis that shorter corporate life cycles increase the likelihood of management mismatches at companies, it follows that we, as investors, need tools and processes that increase our power to change management at these firms. It is in this context that we have look back, with dismay at how willingly we have given away the power to create change at companies, and especially so at technology companies. While corporate governance measurement services and academics were obsessing over board composition and management compensation, companies have been changing the rules of the governance game, tilting power decisively away from shareholders, with little or no pushback. In the last two decades, US companies, have increasingly turned to dual-class shares, with one class having significantly more voting rights than the other, and with founders/insiders holding these voting shares. You can see this phenomenon play out in the chart below, where I graph out the percentage of companies, going public with dual-class shares, each year from 1980 to 2021:
 By 2021, almost a third of all companies going public had two classes of shares, with different voting rights, and that trend was even stronger at tech companies, where close to half of all companies, going public, had shares with different voting rights in 2021.
 Facebook, which went public in 2012, followed this path when it issued class A shares to the public, with one voting right per share, while Zuckerberg and a few insiders kept class B shares, with ten voting rights per share. In the figure below, you see the breakdown of share holding in both class A and class B shares at Facebook:

Cutting to the chase, Zuckerberg controls 57% of the voting rights in the company, while owning only 13.52% of all outstanding shares, largely because he holds the bulk of the voting shares. Rather Han a corporate democracy, Facebook’s elections resemble those in authoritarian regimes, where you can vote for whoever you want, but the winner is pre-determined. (Just as an aside, I found a Facebook proposal to the SEC, thankfully stillborn, to create Class C shares with no voting rights, in 2017. That would have added insult to injury!)
In short, shareholders have been disempowered at some of our largest and most valuable companies, and they have, for the most part, gone along. There is plenty of blame to go around, but the following culprits stand out:
Market-share seeking Stock Exchanges: For much of the last century, starting with a de facto ban in 1926 and a rule in 1940, the New York Stock Exchange barred companies listed on the exchange from from issuing shares with different voting rights, and with its dominance over US equity markets, that became the rule followed by most US companies. The American Stock Exchange adopted slightly looser rules, hoping to get market share from the NYSE, but it was the NASDAQ that threw caution to the winds entirely and removed all restrictions on voting and non-voting shares. That proved to be a great business decision, since the largest tech companies of this century have not only listed on the NASDAQ, but chosen to stay there, but it came at the expense of shareholder powers.Founder Worshippers: For the last few decades, we have glorified the founders of technology companies, and while there is much to admire in their accomplishments, there is a danger in putting them on pedestals and attributing to them heroic or superhuman qualities. In the case of companies like Google and Facebook, and especially so at the time of their public offerings, there were many investors, including some of the largest institutional players, that were willing to make the trade off of giving up power to change management in return for being invested in companies run by "young, tech geniuses". In fact, there are some researchers who were willing to argue that removing the threat of shareholder power made founder-run companies more valuable, because founders are smarter and think more long-term than investors. Lazy Investors: Much as we would like to blame others for our misfortunes, the truth is that get the corporate governance we deserve. Most of us, as investors, chose to give away our voting rights willingly because we wanted shares of the "next big thing", and at the time we did so, we rationalized it by arguing it that we would not need that voting power any time soon. I have little sympathy for the hand wringing and complaints from investors, institutional or retail, in Facebook that management is not listening to them. Investing in Facebook and complaining that Mark Zuckerberg will not listen to you is like getting married to one of the Kardashians and complaining that your privacy is being invaded.Lax Regulators: For some of you reading this post, the villain is going to be the SEC and regulators, with the argument being that they could have protected you by banning dual class shares. I see your point, but remember that the inertia, laziness or me-tooism that led you to buy dual-class shares, will outlast the regulatory ban. Regulators cannot protect us from our own worst instincts!There may not be much you can do about companies that have already adopted dual-class shares, but marking their prices down will make them pay attention. Who knows? Losing a chunk of their wealth may lead the founders who run some of these companies to reassess their positions on differential voting rights.The Consequences
If the essence of corporate governance is the giving shareholders the power to change management at companies, where there is a mismatch, and if those mismatches are more likely to occur at tech companies, where shareholders have unilaterally disarmed, there are predictable consequences:
Chaotic Management Transitions: It is true that we have made it more difficult to change management at tech companies, even when that change is overdue. That said, there will be tech companies where change will occur, but my prediction is that this change will often be forced by either insider in-fighting (where co-founders and insiders turn on each other) or precipitated by a pricing collapse. While Elon Musk’s acquisition of Twitter is one of a kind, the chaos that you are observing at the company is a precursor to changes that you will see at other tech companies in the years to come.Locked-in Mismatches: There are other tech companies where the game has been so thoroughly tilted in favor of insiders and incumbent management that change is impossible. In these companies, as an outside investor, you have to build that reality into your valuations, leading to discounts to your value that reflect how much you trust management. In short, if management has adopted policies that are value-destructive, in the long term, there will be a much smaller chance of reversal at companies with locked-in management than at companies where change remains possible. In the case of Facebook, the company has clearly made a huge bet on the Metaverse, investing $15 billion in the most recent year and planning almost $100 billion in additional investments in the coming years. It is too early to pass judgment on whether these investments will pay off, but assume that the data that comes in over the next two years indicates that Facebook should scale back its investments and slow down. I would like to believe that Zuckerberg is too smart a businessman not to do the right thing, but the qualities that made him a successful founder (over confidence, stubbornness in the face of failure, arrogance) may very well keep him on his pre-determined path, and without checks and balances, Facebook will lose a lot more money over a longer period, before he gives in. Voting Share/Non-voting Shares: In a paper on valuing control from a few years ago, I argued that the differential in prices between voting and non-voting shares will reflect the value of expected control in a company, and will be higher at companies where management change is plausible than in firms where it is unlikely. When tech companies go public, it is entirely possible that there will be a honeymoon period, perhaps even an extended one, where investors are dazzled by scaling successes and are willing to overlook shortcoming, when shares with different voting rights trade at the similar prices. As disillusionment sets in, I would expect voting share premiums to rise, and to rise more at those firms where investors trust managers the least.As investors, should you avoid investing in tech companies with dual-voting right shares? If I said yes, I would be violating one of my own precepts, which is that I will buy any company, no matter what its faults, at the right price. You should avoid investing in these companies when they are priced on the presumption that their founder-managers can do no wrong, but as fear overcomes greed in markets, investors in these companies will start pricing in the worst-case scenarios, where founders continue with dysfunctional behavior in perpetuity, and at those prices, you may be getting bargains. That is what I see happening, in 2022, at Facebook, in particular, and large tech companies, in general. It is the reason that having lost money on Facebook, since buying it in April, I will continue to hold it and I did add to my holdings, when the stock hit $100/share. I know that my Facebook investment will ride and fall with Mark Zuckerberg's ego, and while I have no delusions about being able to influence him, I think that at today's prices, the odds are in my favor. Time will tell!YouTube Video
October 25, 2022
Earnings and Cash Flows: A Primer on Free Cash Flow
It is never pleasant to be in the midst of a market correction, but a market correction does operate as a cleanser for excesses that enter into even the most disciplined investors' playbooks in the good times. This correction has been no exception, as the threat of losing investment capital has focused the minds of investors, and led many to reexamine practices adopted during the last decade. In particular, there has been more talk of earnings than of revenue or user growth this year, and the notion of cashflows driving value seems to be back in vogue. As someone who believes that intrinsic value comes from expected cash flows, I find that development welcome, but I do find myself doing double takes when I see concoctions of free cash flow that violate first financial principles. While I understand that there is no one overriding definition of cash flow that trumps others, it is essential that we define what we mean when we talk about free cash flows, and get perspective on what companies look like, on these cash flow measures.
Free Cash Flows: The What and The Why!
Free cash flow is one of the most dangerous terms in finance, and I am astonished by how it can be bent to mean whatever investors or managers want it to, and used to advance their sales pitches. I have seen analysts and managers argue that adding back depreciation to earnings gives you free cash flow, an intermediate stop, at best, if you truly are intent on computing free cash flow. In the last two decades, I have seen free cash flow measures stretched to cover adjusted EBITDA, where stock-based compensation is added back to EBITDA, and with WeWork, to community-adjusted EBITDA, where almost all expenses get added back to get to the adjusted value. I will use this section to clarify what free cash flows are trying to measure, how they get used in investing and valuation, and the measurement questions that can cause measurement divergences.
What is Free cash flow (FCF)?
I believe that any measurement of free cash flow has to begin with a definition of to whom those cash flows accrue. Since a business can raise capital from owners (equity) and lenders (debt), the free cash flows that you compute can be to just the equity investors in the business, in which case it is free cash flow to equity, or to all capital providers in the business, as free cash flow to the firm.
 In short, the free cash flow to equity is the cash flow that a business generates after taxes, reinvestment and debt payments (interest and principal). The free cash flow to the firm is a pre-debt cash flow, before interest payments and debt repayments or issuances, but still after taxes and reinvestment. An alternate way of describing free cash flow to the firm is that it measures the cash flows that would have been available for equity investors, if there were no debt in the firm, and it is for this reason that some call it an unlevered cash flow.
To measure free cash flows for equity, you have to define reinvestment and debt cash flows, and we do that below on the left. Note that we start with net income, earnings that is already after interest expenses and taxes, and that we consider reinvestment in both short term assets (change in non-cash working capital) as well in long term assets (as the difference between capital expenditures and depreciation). To complete the calculation, we incorporate the cash inflows that equity investors receive when they issue new debt and the cash outflows from repaying debt.
 Since FCFF is a pre-debt cashflow, starting with net income which is after interest expenses would be inconsistent. Thus, we start with operating income or earnings before interest and taxes (EBIT) replacing net income. (I know that you can start with net income and add back after-tax interest expenses, but it leaves embedded other items that can create distortions in FCFF). The taxes that are netted out from operating income are not actual taxes paid (accrued or cash) but hypothetical taxes, on the assumption that all of operating income would be taxed, in the absence of interest expenses (since you are working as if you have no debt), but the reinvestment in long term and short term assets is identical to the calculation used for FCFE.
 Estimation of FCFE
If you have to compute the FCFE for a firm, you can see that every item that you need for the calculation should be accessible in its statement of cash flows, and there seems to be little room for disagreement. However, you will wrestle with what items to include and which ones to exclude, when computing the FCFE for a firm. To illustrate, we have used the statement of cash flows for Microsoft for the 2021 fiscal year (from July 2020- June 2021) as the basis for computing its FCFE in the figure below:
 Source: Microsoft Annual Report for FY 2021 (Year ended June 2021)
To estimate the FCFE, I start with net income and add back depreciation & amortization and non-cash gains reported during the year. I do not add back stock-based compensation, and will provide a rationale for why in the next section, but I do subtract out the changes in non-cash working capital (provided in broken down form in the cash flow statement, but consolidated in my FCFE calculation). I net out capital expenditures and cash acquisitions, as reported, to get to FCFE prior to debt of $41,901 million. Since Microsoft did not raise any new debt, while repaying $5,504 million in existing debt, the FCFE after debt cash flows is $36,397 million. Another way of presenting this FCFE is to consolidate the working capital, capital expenditure and depreciation items into a reinvestment number ($19,370 million) and net this reinvestment out of net income to estimate FCFE. Estimating the free cash flow to the firm will require leaving the confines of the statement of cash flows and obtaining two numbers from the income statement - the operating income for the company and its effective tax rate, computed as taxes paid divided by taxable income. For Microsoft, this would yield values of $69,916 million for operating income and an effective tax rate of 13.83% in 2021, resulting in a FCFF of $40,879 million in 2021.
 As you can see, the FCFE and FCFF share a common foundation, insofar that they are both after taxes and reinvestment, but FCFE adds a layer of cash flows to and from debt that can sometimes make it higher than FCFF and sometimes lower.
Using Free Cash Flows
While there are facile reasons that you can give for computing free cash flows, including the usual “we don’t trust accounting earnings” and “cash is king”, calculating it does involve added computations and there are three contexts where free cash flows get used. The first is that is that computing free cash flows for a past period helps in explaining what happened at a business during that period, in operating, investing and financing terms. The second is that it is that the free cash flows that you compute for a past period can be used as the basis for forecasting expected free cash flows in the future, a key ingredient if you are doing intrinsic valuation. The third is to compute the free cash flow as a base to be used to compare pricing across companies, where the market price is scaled to free cash flow, rather than to earnings. Since each of these missions has a different end game, there can be consequences for how we estimate free cash flows in each one; put simply, the free cash flow you compute, if you just want to explain what a firm did last year, can be different from the free cash flow you compute as the base year number for intrinsic valuation, which, in turn, can be different from the free cash flow that you estimate, if you are computing a pricing multiple.
1. Explain the past
It is true that when investing in a company, it is what happens in the future that will determine whether you make money, but it is also true that to make these future assessments, a good place to start is by understanding what that company has done in the past. Notwithstanding the mission bloat that has bedeviled accounting in the last few decades, where the notion of fair value has distracted accountants, explaining what a company has done in the past, and where it stands now remains the core mission that should animate financial statements. As a believer in cash flows, I have always gravitated to the statement of cash flows as the accounting disclosure that is least contaminated by accounting overreach and the one that best reflects the true operations of a business.

Note that the statement of cash flows looks at cash flows through the eyes of equity investors, starting as it does with net income and working its way down through investing and financing cash flows, before concluding with an explanation of the change in the company’s cash balance. As you can see in my earlier computation of FCFE for Microsoft, every item that you need for the calculation is in the FCFE, with your key decisions becoming which items not to count (any cash flows to equity, investments in securities etc.) and which ones to include (cash acquisitions, foreign exchange gains or losses etc.)
An intuitive reading of the FCFE is that it is cash available to be returned to equity investors, either in the form of dividends or as cash buybacks. It is the rare firm that follows a residual cash policy, returning its FCFE every year as dividends and/or buybacks. Some firms hold back and return less than they can, for good reasons (buffer against future bad years, set aside to cover investment opportunities) as well as bad ones (managers/insiders control the cash, over priced acquisitions); when they do hold back, the difference adds to their cash balances. Others choose to return more cash than they should be, and funding the difference from cash balances accumulated in the past and in some cases, fresh equity issuances, again for good reasons (a cyclical or commodity company riding out a down phase of a cycle) and for bad ones (inertia, an unwillingness to cut dividends, me-tooism on dividend policy or buybacks).

Companies with negative FCFE start in a hole, and even if they do not return any cash, they will find themselves with declining cash balances and/or new equity issuances, and if they do choose to pay dividends or buy back stock, they will make the cash deficits bigger. This approach of computing FCFE and comparing it actual cash return can be a device that can explain how some companies end up with huge cash balances and why other companies, especially young and money losing, will be dependent on equity infusions to stay alive.
One of the limitations of focusing of free cash flows to equity is that you can get tunnel vision, since borrowing money operates as a cash inflow, inflating free cash flow to equity. That can explain why a firm with moderate or even below-average profitability can use debt to fund large dividends and buybacks, and to the extent that the firm is borrowing too much, it can dig a hole for itself. Estimating free cash flows to the firm can alert you to this occurrence, since it is a pre-debt cash flow and new debt issuances or repayments cannot alter it. In fact, the free cash flows to the firm, while less intuitive, are the source of cash flows to all claim holders (lenders as well as equity investors):

Mapping out these cash flows can provide a big picture perspective on where a firm’s cash flows are coming from and going, as well as a better assessment of the operating health of its business. It can also provide advance warning of the company’s exposure to downside risk, since the cash flows to lenders (interest and debt payments) are contractually set.
2. Intrinsic Valuation
In intrinsic value, the value of an asset, business or equity stake in a business is the present value of the expected cash flows on it. Thus, in intrinsic valuation, the free cash flows (to equity or the firm) that you compute for the most recent year or time period is never part of value, but is useful only because it provides a base for forecasting the future. The question of whether you should be estimating free cash flows to equity or to the firm cannot be answered until you decide whether you are valuing just the equity in a business or the entire operating assets of the business.
If you are valuing just the equity, you’ll be estimate the free cash flows to equity in future years, and discounting back at the cost of equity, i.e., the rate of return that equity investors can make on other investments in the public market, of equivalent risk.If you are valuing all operating assets in a business, you will estimate free flows the entire firm or business, and discount these cash flows back to today at a weighted average of the costs of equity and debt, with the weights reflecting the proportions of each funding type.The picture below provides the contrasting uses of FCFE and FCFF in valuation:
With either estimate of free cash flow, the end game is estimating the free cash flows in the future, and the way we compute free cash flows can be different from when we computed free cash flow for explaining the past. Here are a few reasons why:Unusual or Extraordinary items: When explaining last year’s cash flows, you should consider all items, even if they are one-time or extraordinary, since they are cash flows. However, if you are computing cash flows as a base for forecasting the future, you should eliminate any items that you don’t expect to recur in the future. Thus, a cash inflow from a one-time divestiture of a division or a cash outflow due to a loss in a lawsuit, though part of free cash flows last year, will be excluded, if you are computing a base-year free cash flow for estimating future cash flows.Normalized vs Actual numbers: For items that are recurring, but volatile, there is a good case to be made that while you will use the actual values, if computing free cash flows for the most recent year, you should be normalizing them, though the methods you use for normalization can vary across items. With the change in non-cash working capital, a notoriously volatile item on a year-to-year basis, I have found that looking at non-cash working capital as a percent of revenues, and using that statistic to reestimate the change in non-cash working capital in the most recent year provides a better base year foundation. In the Microsoft FCFE calculation, shown in the earlier section, using the historical average of non-cash working as percent of revenues of -10.18% (average from 2012-21), would have yielded a change in non-cash working capital of -$2,552 million in the base year, making it a cash inflow, rather than the outflow of $1,086 million that we attributed to working capital that year. With cash acquisitions, where a company may do only one big acquisition every three or four years, taking a long time series and averaging acquistions over that period will yield a better recurring value.Stock-based Compensation and Acquisitions: The most hotly discussed item in cash flow estimation is stock-based compensation, in the form of restricted stock or options. A simplistic reading is to argue that is non-cash and add it back, just as you depreciation and amortization, but stock-based compensation is not comparable. While depreciation and amortization are truly non-cash, stock-based compensation is more of an in-kind expense, where you give away shares of equity in the company instead of paying cash. If you are estimate free cash flows (to the firm or to equity), with the intent of valuing that firm, adding back stock-based compensation is equivalent to arguing that you can either stop paying employees in the future (and still hold on to them) or that you can keep giving away equity stakes in your company with no consequences for value per share. In short, there is no justification for adding back stock-based compensation to get to cash flows, and none of the numerous variants of adjusted EBITDA that you see populating annual reports or prospectuses holds up to scrutiny. Using the logic that paying for something with shares, instead of cash, still has an effect on free cash flows, we would argue that a company that plans to grow through acquisitions, using its own stock as currency, is reinvesting, and that this reinvestment should reduce expected free cash flows to equity, to existing shareholders. During the 2021 fiscal year, Microsoft bought Nuance Communications for $19.76 billion in all stock transaction, and that amount should be treated as reinvestment for the year, even though it is technically non-cash.Taxes: With free cash flows to equity, you start with net income but that net income can be skewed up if the company had a low effective tax rate that year, either because of write offs or losses carried forward into that year, or down, if it faced an unusually high tax rate that year. With free cash flows to the firm, the effective tax rate plays an even more direct role in determining cash flows, when you use it compute your after-tax operating income. In both cases, it makes sense to leave the effective tax rate at its actual level, when computing free cash flows for the past, but to rethink that when your objective is to forecast future free cash flows. I would suggest looking at an average effective tax rate over a longer period, in computing the base year free cash flow, and then also targeting the marginal tax rate, as you forecast taxes for the future. In the Microsoft FCFF calculation, this would imply replacing the effective tax rate of 13.83% with an average effective tax rate of 22%, using the 2017-2021 time period, which would lower free cash flows to the firm.Accounting Inconsistencies: I have written about the inconsistency in how accountants calculate capital expenditure at firms with significant investments in intangible assets and R&D, and that inconsistency can play out in your FCFE computation. While R&D remains a cash outflow, whether you treat it as an operating or a capital expenditure, moving it from operating to capital expenditures can alter your perception of a company's operations. In the case of Microsoft, for instance, capitalizing the $20,716 million that the company spent on R&D in 2021, will increase the net income for the company, while also raising the reinvestment by an equivalent amount. Put simply, Microsoft is much more profitable than the accounting statements lead you to believe, while reinvesting more than you thought it was, and both of those conclusions will have implications for valuationIn short, in intrinsic valuation, where your objective is get the best estimates that you can for the future, you have a great deal more flexibility and discretion in which items you include (and exclude) in computing free cash flows, and how you estimate values for those items. If you are wondering whether it makes enough of a difference to bother, consider what Microsoft's FCFE look like with all five adjustments made to them below:

The capitalization of R&D adds about $3.7 billion to net income, about $17 billion to depreciation and amortization and about $20.7 billion to cap ex, netting out to no effect on FCFE but with significant changes to profits and reinvestment. Incorporating the stock-based acquisition pushed up total reinvestment substantially, though the question of whether this should be built in as a recurrent component will depend on the story you tell about Microsoft.
Pricing The final arena where free cash flows can be used is in pricing, and more specifically, in scaling market price. Again, the question of which variants (FCFE or FCFF) can be used depends on whether you are using an equity pricing multiple (where the market cap or share price is in the numerator) or an enterprise value multiple (where it is the market value of operating assets in the numerator):With equity multiples, you can scale the market value of equity (or market capitalization) of a company to its free cash flow to equity, to estimate a Price to FCFE multiple, and offer it as an alternative to the much more widely used PE ratio, where market capitalization is scaled to net income. With enterprise value multiples, you can scale enterprise value to FCFF, instead of using EBITDA or revenues as your scalar. Again, you could argue for the benefits of a more complete measure of cash flow, but as with FCFE, FCFF will be more volatile than revenues or EBITDA, making it difficult to pass pricing judgment. The logic that analysts use for the use of free cash flows is simple and seems compelling. If the value of a business is the present value of its expected cash flows, as we argue in intrinsic valuation, it seems reasonable to also argue that the free cash flow that a business generates is a better measure of its value than the accounting earnings. In sum, there is nothing inherently better about using free cash flows instead of earnings in a pricing setting, and you can argue that the additional volatility and loss of perspective that comes with free cash flow numbers yields worse pricing. I agree, with one caveat. Even if you choose to stay with PE ratios, as your pricing multiple, knowing how much of earnings gets reinvested back into the firm is a useful input in making your pricing judgments.
Free Cash Flows: Perspective
With that long lead in on free cash flows, let us talk about why free cash flows vary across companies and across time. To make the connection, I am going to fall back on a structure that I have used before, the corporate life cycle, to look at the evolution of FCFE, as companies age, and use that structure to also examine how these FCFE play out as cash returned to shareholders, over time.
The Life Cycle Effect
In a corporate life cycle structure, you trace a business from start-up (birth) to the toddler years (very young businesses) through their teenage years into middle and old age. I have found it useful in explaining why the focus of a business changes from finding investment opportunities, when young, to finessing capital structure, as middle age companies, to deciding how best to return cash to investors, in old age, as well as why the challenges you face in valuation are different for young companies than more mature businesses. The corporate life cycle also provides a framework for explaining how free cash flows evolve, as companies move through the life cycle:

Focusing on free cash flows to equity, you should expect to see negative values, early in the life cycle, as businesses struggle to make money and have to reinvest to deliver on their growth potential at the same time, and a resultant dependence on raising fresh equity capital (from VCs and public market investors) to keep going. As their business models take form, and they turn the corner on profitability, you should continue to see negative cash flows because of the need to reinvest to grow; in general, you should expect to see positive cash flows lag positive earnings. At mature businesses, you should expect to see free cash flows to equity to not only stay positive, but also to grow faster than earnings, and in decline, while earnings will follow revenues on their path down, divestitures and asset sales can allow FCFE to be higher than earnings. To see how net income and FCFE evolve, as a company ages, I computed the net income and FCFE for Tesla every year from 2006 to 2021:
 Source: Capital IQ
For much of its existence, Tesla has been a money-losing company, reflecting its young, high growth status. It turned the profitability corner in 2020, though FCFE stayed mildly negative that year, and in 2021, the FCFE also turned positive. In corporate life cycle terms, Tesla is growing up, which is good news in terms of profitability and cash flows but bad news, if growth is what rings your bell.
To see if the corporate life cycle has relevance in explaining differences in free cash flows to equity across companies, I looked at US companies, broken down by age, into ten deciles, from youngest to oldest, and computed each component of the FCFE, by decile:

As you can see in the table, among the youngest companies (in the lowest decile), more than 73% are money-losing and more than three quarters of these companies have negative free cash flows to equity. As companies age, the proportion of companies that are money making increasing, as does the percent that has positive FCFE. In relative terms, the companies in the middle of the corporate life cycle, deliver the highest FCFE as a percent of market capitalization
Dividends and Buybacks You can critique FCFE as an abstraction, since shareholders cannot lay claim on them, and argue that it is only cash flows that are paid out to equity investors that count. You could focus just on dividends, but by doing so, you are missing a large proportion of cash returned by companies; in 2021, more than two thirds of all cash flows returned to shareholders were in the form of buybacks. Staying with the corporate life cycle construct, we looked at dividends and stock buybacks by companies in each age decile:
Consistent with what we unearthed in the FCFE table, where younger companies are more likely to be money losing and have negative FCFE, we see that the a much higher percent of older companies pay dividends and buy back stock than younger companies. In the aggregate, this table suggests that it is the presence or absence of FCFE that drives dividend policy, with most firms that have negative FCFE choosing not to return cash and many that have positive FCFE deciding to return cash.
Pricing Earlier, we noted that there are some analysts who use free cash flows, as a basis for pricing, than for intrinsic valuation, with price to FCFE replacing price earnings ratios in equity pricing, and EV to FCFF taking the place of EV to EBITDA multiples, in enterprise valuation. While there are some cash flow purists who prefer cash flow multiples to earnings multiples, they will never be widely used for two reasons. First, the reason that investors like to price companies, using multiples, is because they have frames of reference on these multiples, i.e., a sense of what a typical number should like like in a sector. With PE ratios, their long history of usage has left investors with frames of reference that they can use, rightfully or wrongfully, in pricing stocks, but with Price to FCFE ratios, there is no such reference frame. Second, as you can see from how FCFE is computed, with the netting out of reinvestment and incorporating debt cash flows, it will always be a more volatile number than earnings, with much of the additional volatility telling you little about current earnings power. If one problem with using a price to FCFE ratio to judge whether a stock is cheap and expensive is a lack of perspective on what comprises a high, low or typical value, we can counter this problem by estimating the price to FCFE ratio for every publicly traded company globally and compare the distribution of the ratio to distribution for PE ratios.
 Source: S&P Capital IQ
The good news is that the distribution for price to FCFE resembles the distribution for PE ratios, but the bad news is that you are replacing a multiple where you lose almost half the firms in your sample, with PE ratios, with an even more flawed multiple in Price to FCFE, which cannot be calculated in more than 63% of publicly traded companies. Put simply, if you start with a peer group of 25 firms, you may end up with a final sample of 10 firms or less, if you are pricing with a price to FCFE multiple. Moreover, price to FCFE ratios show more divergence than PE ratios, as can be seen in the spread between the first and third quartiles of each one. I did the same assessment for EV to FCFF, with the contrast drawn to EV to EBITDA, both to see contrasts and get perspective:
 Source: S&P Capital IQNot surprisingly, the multiple of EBITDA, a pre-tax and pre-reinvestment cash flows, is lower than the multiple of FCFF, which is post-tax and after reinvestment. While you lose about 42% of firms with EV to EBITDA multiples, where EBITDA is negative, you lose close to 55% of global firms, because of negative FCFF. As a cash flow advocate, it pains me to say this, but if your game is pricing stocks, I see little benefit from replacing traditional multiples (like PE and EV to EBITDA) with free cash flow scaled pricing measures. That is because a single year’s free cash flow (to equity or the firm) actually has more noise in it, and is less informative about a company’s operating health, than a single year’s earnings (net income or EBITDA).
 YouTube Video
September 26, 2022
Reaping the Whirlwind: A September 2022 Inflation Update!
In my early 2021 posts on inflation, I argued that while the higher inflation that we were just starting to see could be explained by COVID and supply chain issues, prudence on the part of policy makers required that it be taken as a long term threat and dealt with quickly. Not only did they not do so, but the fiscal and monetary actions they took in 2021 exacerbated inflationary pressures. By the start of 2022, the window for early action had closed and for much of this year, inflation has been the elephant in the room, driving markets and forcing central banks to be reactive, and its presence has already induced me to write three posts on its impact. In my first on May 6, 2022, I put the surge in inflation, in 2022, in historical context and argued that it is unexpected inflation that shakes up the economy and caused damage to financial assets, and that until we reached a steady state, where expectations and actual inflation converge, markets would continue to be unsettled. In a follow-up post on May 20, I looked at the disparate effects of inflation on individual companies, positing that safer companies with pricing power are more protected against inflation than riskier companies in competitive businesses. In a third post on July 1, 2022, I pointed to inflation as a key culprit in the retreat of risk capital, i.e., capital invested in the riskiest segments of every market, and presented evidence of the impact on risk premiums (bond default spreads and equity risk premiums) in markets. In terms of content, I am afraid this post will contain nothing new, but the fresh uncertainties about inflation, and its impact, that have opened up this summer require at least an updating of the numbers.
Inflation: Actual and Expected
In September 2022, there is no denying that inflation is back, and with a vengeance, though we can still debate how quickly it will fade, and to what level. The happy talk of 2021, where many policy makers and investors were dismissive of its emergence, attributing it almost entirely to the COVID recover and supply chain problems, has largely faded and a grim acceptance has set in that we have an inflation problem, the solution to which may be perhaps as painful as the problem. One reason investors and businesses are struggling with this latest bout of inflation is that they have been spoiled by a decade of low and stable inflation, and as a consequence, have neither planned for high and unstable inflation, in their business models, nor developed analytical tools to deal with that inflation. To see the inflation break in 2022, relative to history, I report on four widely used measures of inflation in the US - the consumer price index (CPI ), with & without seasonal adjustments, the producer price index (PPI) and the GDP Price Deflator below:

Source: Federal Reserve, St. Louis (FRED)On every measure, inflation exploded in the first half of 2022, with a leveling off, albeit at high rates in the summer. The table below the graph also backs up my point about the 2011-2020 time period being an outlier, in terms of inflation being low (with the average at 1.73%) and stable (with the standard deviation across the years of 0.81%). The graph above is one of actual inflation, but as I have emphasized all through this year, it is expected inflation that drives markets, and it is on measures that try to capture inflation expectations that you see the turn in 2022. While spending the bulk of 2021 in denial, investors seem to have woken up, and expected inflation numbers are reflecting that. In the charts below, I graph out the inflation that consumers are expecting in two different surveys, one from the University of Michigan and the other from the NY Fed that show the rise in expected inflation:
 As you can see, in both surveys, the expected inflation number has risen, to 5.20% in the University of Michigan survey and to 5.7% in the NY Fed survey. This rise in expected inflation also shows up in a different survey of expectations, from the Fed (St. Louis), measuring the probabilities of expected inflation in consumer expenditures:
 Fed Reserve, St. LouisAfter a decade where most expected inflation to be less than 1.5%, with a small percentage even expecting deflation, more than 80% now expect inflation to be higher than 2.5%, in the future and none expect deflation. The problem with survey-based expectations is that they are volatile and often are responses to recent experiences with inflation. There is a market-based estimate of inflation that comes from the US treasury market, where a comparison of yields on a treasury bond with that on a inflation-protected treasury bond of equivalent maturity provides a measure of expected inflation. This measure is reported, for the 10-year US Treasuries, from 2003 through September 2022, in the graph below:

On September 23, 2022, the market-imputed inflation number stood at 2.37%, the difference between the 10-year T.Bond rate of 3.69% and the 10-year TIPs rate of 1.32% on that day. It is lower than the survey-based inflation expectations, but it a long term expected inflation rate, and you can use the term structure of Treasury and TIPs rate to extract an expected inflation term structure:
 Put simply, investors are expecting inflation to peak over the next year and subside in the long term, close to the levels that we saw in the last decade. That may be hopeful thinking, and the returns on stocks and bonds over the rest of the decade will be determined by the correctness of this assessment; if investors are under estimating expected inflation in the long term, as they did in the 1970s, we are in for an extended period of malaise in markets.
Inflation’s First Order Effects: Interest Rates and Exchange Rates
Since 2008, it has become fashionable to attribute all movements in interest rates to Fed action or inaction, and as a consequence, we have lost sight of the fundamentals that determine interest rates. The most critical fundamental, and the one that best explains big movements in rates, over time, is expected inflation. For the last decade, it was not quantitative easing or Fed alchemy that kept interest rates low, but low inflation, in conjunction with anemic real growth.

As investor expectations of inflation have risen in 2022, treasury rates have risen inexorably, across the term structure:
 In keeping with our earlier assessment of investors expecting higher inflation in the near term, than the long term, rates have risen across the term structure, but short term treasuries have risen more than long term treasuries. To get a measure of the damage done to bond prices as a consequence, note that the increase in the 10-year treasury rate from 1.51% to 3.69%, in 2022, has resulted in a return of -16.45% on a constant maturity bond.
As rates have risen at different rates in the short and the long term, the US treasury yield curve, which started the year with a steep upward slope has become distorted, and on September 23, 2022, the 2-year rate, at 4.20%, was higher than the 10-year rate, at 3.69%, with a relatively flat curve beyond 10 years:
 Source: US TreasuryWhile I am remain a skeptic on inverted yield curves as cannot-fail predictors of recessions, the message in the distortions in the yield curve on September 23, 2022, is not a positive one about the future of the economy.
 The other first order effect from inflation, and the Fed's reaction to it, has also been in the currency market, where the US dollar has soared against almost every currency, with the Euro and the British pound trading at or close to historic lows.

At one level, this is interest rate parity at play, as US interest rate rise faster than rates in other countries. At another, it is a flight to safety, as worries about the global economy and markets take hold. At every level, though, exchange rate movements that are this strong create chaos and disruption in the economies of both the strengthening and weakening currencies.
Second Order Effects: Risk Capital and Risk Premia
If the only consequence of higher expected inflation was higher interest rates, the damage from it would be contained and perhaps even neutralized by earnings and cash flows growing at higher rates, aided by inflation. However, higher inflation almost always seems to be accompanied with more uncertainty about inflation, and it is this second order impact that does real damage, in terms of how it impacts risk capital. In my July 2022 post, I defined risk capital broadly as capital invested in the riskiest segments of each asset class, and used the picture below to illustrate its reach:

Note the contrast between risk capital and safety capital, and in a healthy market, you need a balance between the two, with the excess of safety capital leading to stagnant economies and markets, and an excess of risk capital creating bubbles in markets and distortions in the economy. The last decade, for better or worse, has seen an explosion of risk capital, aided and abetted by central banks and policy makers. Inflation’s return to the center stage has, at least for the moment, broken the spell, and risk capital has withdrawn significantly from markets.
Venture capital: The VC focus on start-ups and young companies makes it a focal point of any measure of risk capital, and it has ebbed and flowed over time, with sharp pullbacks in the aftermath of the dot-com bust in 2001 and the banking crisis in 2008. The graph below updates venture capital investments, by quarter, from the first quarter of 2020 to July/August 2022: Source: Crunchbase
Note the drop off in venture capital in the first quarter of 2022, and the even steeper decline in the second quarter suggests that this may not be a temporary retreat.Initial Public Offerings: The exit path for the most successful of the ventures backed by VCs is an initial public offering, and the number and dollar value of initial public offerings operates as a proxy for the availability of and access to risk capital. In the graph below, we look at the this statistic across time, updated again through 2022:
 Source: Jay Ritter for historical and Pitchbook for recent IPO dataHere again, the drop off in initial public offerings, both in number and value in 2022 has been dramatic, and if history is any guide, there will not be a quick comeback.High Yield Bonds: High yield debt has always been part of the landscape of corporate bond markets, but for much of the last century, it was composed of investment grade debt that had been downgraded, as a consequence of corporate distress. Since the 1980s, companies with low ratings have been able to make issuances of their debt, with the demand for this original issuance high yield debt coming from bond buyers willing to take on additional risk. In the graph below, I track the issuance of high yield bonds over time, with a focus on the most recent quarters:
 Source: SIFMA
As with VC capital and IPOs, note the drop off in high yield debt issuances in 2022, both in dollar value terms, and as a percent of total bond issuance.
As risk capital has moved to the sidelines, the price of risk, i.e., the premium that investors demand for taking on risk has surged. You can see this in rising default spreads in corporate and sovereign bond markets, where spreads, which started 2022 at close to historic lows have risen, and more so for the lowest ratings.
 Source: FRED
In the equity market, the only immediate weapon that equity investors have for adjusting their price of risk assessment, i.e., the equity risk premium, is the stock price, pushing stock prices down, if they want higher equity risk premiums. It is for that reason that my assessments of equity risk premiums are model-agnostic and are based upon stock prices today and expected cash flows in the future being used to back out an expected return on stocks. Those assessments in the long term (1960-2021) and in the last two years (from January 2022 to September 23, 2022) are shown below:
 There are two things that stand out about equity markets in 2022. The first is the surge in the equity risk premium from from 4.24% on January 1, 2022, to 6.05%, on September 23, 2022, an increase on par with what we have seen during market crises (2001, 2008 and 2020) in the past. The second is that as equity risk premiums have jumped, the treasury bond rate has more than doubled, from 1.51% on January 1, 2022, to 3.69% on September 23, 2022. In contrast to the afore-mentioned crises, where the treasury bond rate dropped, offsetting some of the impact of the rise in equity risk premiums, this inflation-induced market reaction has caused the expected return on stocks to rise from 5.75% on January 1, 2022, to 9.75%, on September 23, 2022; that increase of 4% dwarfs the increases in expected returns that we witnessed in the last quarter of 2008 or the first quarter of 2020.
Third Order Effects: The Economy and Psyches
The first and second order effects of inflation have been significant and damaging, but the question that remains unanswered is about the long term effects on the economy, and more importantly, on investor and consumer psyches. As you have probably noticed, perceptions of where the economy is headed have worsened, as we have gone through 2022, even in the face of relatively good news on unemployment. Much of the blame for the darkening forecasts has been directed toward Jerome Powell and the Federal Reserve, and while there is much that you can critique about how the Fed has played its cards during this crisis, it is inflation that is in the driver’s seat, not the Fed. Interest rates have risen this year because of inflation expectations rising, and it is these higher rates (and expected inflation) that are leading the Fed to act. In short, the Fed has two choices, neither of which is appealing. It can do nothing, which is the path that some of its critics would rather have it take, and interest rates will continue to rise, perhaps at an even faster rate, as inflation expectations surge. Alternatively, it can try to reclaim the narrative, by acting to slow the economy down, perhaps even putting it into a recession, with length and severity still to be determined. Rock, meet hard place!
As investors, our assessments of how inflation and the economy will evolve in the coming years will determine how much we should pay for stocks and bonds today. Having chronicled how inflation has changed the level of interest rates and the price of risk, let us bring in the remaining questions on earnings, cash flows and growth that we need to address to evaluate whether the market has under or over reacted to inflation:
 In the sections below, I will focus on how I see inflation playing out in assessments of earning and growth, for the S&P 500 companies, as well as in their cash returns (dividends and buybacks).Earnings: At the start of 2022, optimism was pervasive among analysts that the economy would continue to show strength and that earnings at US companies, up almost 47% in 2021, would grow strongly in 2022 and 2023. That optimism about the economy has faded, but there has not been a concurrent drop in estimated earnings, as you can see in the table below:
 Source: Factset, Ed YardeniThe earnings estimate for 2023, for S&P 500 companies, stood at 243.46, down only 0.6% from what it was on January 1. There are some subtle signs that forecasts of a recession are finding their way into earnings estimates. First, as you can see in the table, analyst estimates for what companies would generate as earnings in 2023 rose every month from January to June, but have dropped, albeit only slightly, during the summer. Second, the percentage of companies that are offering negative guidance about future earnings stood at 54%% in September 2022, suggesting that they see stormy weather ahead.
 Source: Factset
Cash Flows: Investors in public equities have no direct claim on earnings, and are reliant on companies returning cash to them in dividends, and increasingly over the last few decades, in stock buybacks. The dividends paid change relatively little from period to period, making them sticky, but stock buybacks are more volatile, with sharp cutbacks during crises or when companies become more concerned about their economic futures. The table below graphs dividends and buybacks, by year, going back to 2001, and also the dividends and buybacks, by quarter, just for the last four years:

Note the rising proportion of cash returned in buybacks, over the last 20 years, and the pullbacks in 2008/2009 and the first two quarters of 2020, in response to crises. That buyback number has largely recovered from its COVID swoon, and hit an all time high in 2021, with $734 billion in stock buybacks, across the S&P 500 companies. After rising again in the first quarter of 2022, we did see a pullback, albeit a small one, in the second quarter of 2022, with the possibility that there will be more coming in the third and fourth quarters of the year.Long term inflation and interest rates: Having spent all of 2022 trying to hit a moving target on expected inflation, and the resulting interest rate, the one guarantee for the future is that there is more change coming. To make a judgment of direction, we have no choice but to take a stand on where inflation will settle in after supply chains are fixed, COVID is in the past and perhaps after the economy has cooled down. If we will revert back to inflation of 1-2%, as the market seems to believe we will, we will face a very different end game than if we revert back to 1980s levels of 3-4%. With the caveat that I have absolutely no new insights or information into this process, I did make my estimates for the S&P 500, with the resulting valuation shown below:
 Download spreadsheet
I think that the given market pricing today, and my expectations of expected earnings and cash flows, stocks are very mildly over valued on September 23, 2022. I trust my judgments enough that I will leave my existing equity holdings intact, but I am not quite ready to jump in and make bets on market direction now. Clearly, your assumptions for the future will be different from mine, and I have a Do-It-Yourself (DIY) valuation of the S&P 500 that you can use to make your own judgment. In the table below, I list out the valuations that I get for the index with various combinations of 10-year treasury bond rates, equity risk premiums and assumptions about earnings in the future, relative to analyst forecasts:S&P 500 Intrinsic Value Scenarios
 If you are bullish, the assumption that makes the biggest difference is where you see equity risk premiums converging, with premiums closer to 4% yielding undervaluation on the index, even with significant earnings shocks built in. At the other end of the spectrum, if the equity risk premium stays at 6% or higher, the only scenario where you arrive at a value close to the index is if the 10-year T.Bond rate drops to 2% and earnings estimates come in as expected, with significant corrections to come, in scenarios where rates stay higher and/or earnings come in below estimates.
 Given a choice between allowing inflation to play itself out and initiating polices that trigger a recession, there are some who are pushing for the former, arguing that trading off the certain pain that comes with a recession for the uncertain benefits of lower inflation is not good policy. I sympathize, but the dangers of letting inflation play out is that if it does so in unpleasant ways, where it stays high and volatile, its effects are going to be far more long term and more damaging. High and volatile inflation corrodes economies and markets from the inside out, destroying faith in currencies and making investors and businesses behave in dysfunctional ways.
YouTube Video
SpreadsheetsIntrinsic Valuation of the S&P 500 on September 23, 2022DatasetsInflation: Historical (US)Inflation: Expected (US)US Treasury Rates in 2022Default Spreads in 2022Exchange Rates in 2022
July 27, 2022
A Zomato 2022 Update: Value, Pricing and the Gap
On July 21, 2021, I valued Zomato just ahead of its initial public offering at about ₹41 per share. The market clearly had a very different view, as the stock premiered at ₹74 per share and soared into the stratosphere, peaking at ₹169 per share in late 2021. The last few months have been rocky, as the price has been marked down, partly in response to disappointing results from the company, and partly because of macro developments. At close of trading on July 26, 2022, the stock was trading at ₹41.65 per share, and the mood and momentum that worked in its favor for most of 2021 had turned against the company. In this post, I will begin with a quick review of my 2021 valuation, then move on to the price action in 2021 and 2022 and then update my valuation to reflect the company's current numbers.
My IPO Valuation
I valued Zomato, soon after it filed its prospectus for its initial public offering, in July 2021. The details of that valuation are in this post, but to cut a long story short, I argued that an investment on Zomato was a joint bet on India (that economic growth would bring more discretionary income to its people), on Indian eating habits (that Indians would eat out at restaurants more than they have in the past) and on the company (that its business model and first move advantages would give it a dominant market share of the food delivery market). I summarized my valuation in a picture:

I valued the company at close to ₹41, and note that this valuation incorporates the proceeds from the IPO and adjusts the share count for the offering. I argued then that notwithstanding the potential growth in the market, and Zomato's advantageous positioning, it was being over priced for its IPO, at ₹76 per share.
In response to the pushback that I got from those who disagreed with my valuation, with half arguing that I was being way too optimistic about the future and the other half that I was ignoring the potential for growth overseas and in new businesses, I followed up with a second post, where I let readers choose their own story line for Zomato, and came up with a table that linked stories to values:

Using my test of whether a valuation story is possible (the weakest test), plausible (a stronger test) and probable (the acid test), I posited that you could justify a value per share for Zomato of ₹40 - ₹50, per share, with plausible stories, but that valuations that were much higher required pushing the limits of plausible narratives.
The Pricing Game
One reason that I enjoy valuing a company just ahead of its market debut is that there is no market price to bias your analysis; in my experience, the market price operates as magnet, drawing intrinsic valuations towards it. The downside is that without a market price acting as an anchor, your valuations can easily come unmoored from reality. No matter what, having a valuation in hand makes the first day of trading much more interesting, as you wait for the market to pass its own judgment on the stock’s pricing, though that judgment reflects more a pricing game than a value estimate.
Staying with the theme that it is demand and supply, mood and momentum that determine what happens to a company’s stock in first few months of trading, the buzz that accompanied Zomato’s listing and its standing as one of the first new age Indian companies to go public, spilled over into the first day of trading, as the stock soared 51% over its offering price of ₹76, and rose as high as ₹137 during the trading day. That opening day glow lasted for the rest of 2021, abetted by easy access to risk capital, and the stock maintained its lofty pricing. If you are tempted to attribute the price performance to good news from the company, its earnings reports continued to report escalating losses and one of its co-founders quit in September 2021.
In 2022, though, the company's stock rediscovered the laws of gravity, and news stories that would have elicited positive responses in 2021 are having the opposite effect. The most recent plunge in the stock price seems to have been precipitated by Zomato’s acquisition of Blinkit, a grocery delivery company, for $570 million (₹4400 crores), on June 24, 2022 and the expiration of the lock-in period, allowing insiders to sell shares in the company. At close of trading on July 26, Zomato’s stock price was at ₹41.65 per share.
Updating the fundamentals
Though some have suggested that price dropping to my value is vindication of my valuation, I am not part of that group for three reasons. First, it seems skewed to celebrate only your successes and not your failures, and it behooves me to let you know that I also valued Paytm at close to ₹2000 per share, and the stock is currently trading at ₹713. Second, even if nothing in my valuation has changed, the value per share of ₹41 per share was as of July 2021, and if it is a fair assessment, the expected intrinsic value per share in July 2022 should be roughly 11.5% higher (i.e., grow at the cost of equity), yielding about ₹46 in July 2022. Finally, the company and the market have changed in the year since I last valued it, and to make a fair judgment today, the company will have to be revalued.
Company Fundamentals
In the year since my IPO valuation, there have been four quarterly reports from the company, in addition to news stories about governance and the company's legal challenges, and there is a mix of good and bad news in them.
On the good news front, the food delivery market in India has continued to grow over the last year, and Zomato has been able to maintain its market share. In fact, there are signs that the market is consolidating with Zomato and Swiggy controlling 90% of the market share of restaurant deliveries. As a consequence, Zomato's gross order value and revenues have both jumped over the course of the last year:

In addition, the substantial cash that Zomato raised on its IPO is providing it with a cash and liquidity cushion, with cash and short term investments jumping from ₹15,000 in March 2021 to ₹68746 (including short term investments) in March 2022. Since Zomato is a young, money-losing company, and the likelihood of failure acts as a drag on value, this will benefit the company, since it provides not only a cushion for the firm but also eliminates dependence on external capital for the next few years.
On the bad news front, the take rate, i.e., the slice of gross order value (GOV) that Zomato keeps has dropped substantially over the last year, reflecting increased competition in the market, higher delivery costs and Zomato's entry into newer markets (like grocery delivery) with lower revenue sharing. In addition, the growth has come in fits and starts, and given Zomato's active acquisition strategy, it is not clear how much of the revenue growth is organic and how much is acquired. Not surprisingly, the company's losses have ballooned over the last year:
 While there was a management narrative of economies of scale and improved contribution margins, the end numbers don't back up either contention, with cost of goods sold rising much faster than revenues and operating and net margins both becoming more negative over the last year. (And no, you cannot add back stock based compensation and come up with an adjusted EBITDA to claim otherwise....) In addition, the Indian government put both Swiggy and Zomato on notice that they may be facing anti-trust action in the future, perhaps opening the door to more competition. On the still-to-be-decided front, Zomato has continued on a strategy of acquiring small companies to advance its growth agenda, and while many of these acquisitions have been small, its most recent acquisition of Blinkit has raised questions about whether this growth is coming at a reasonable cost. (Again, the contention from management that this is a capital-light company that growth with little investment is not true, since these acquisitions are its true cap ex, making it a capital intensive firm.) The potential conflicts of interest in this acquisition, with a Zomato co-founder's spouse operating as the CEO of Blinkit, also add to the questions. Even if the Blinkit acquisition pans out, it is an open question whether Zomato can continue to deliver growth effectively and efficiently through this acquisition-driven strategy, using its own shares as currency, especially as it scales up. In addition, Zomato is also building a portfolio of equity positions, which do not show up as part of operating assets, and the founders rationalize this behavior by arguing that these are "the building blocks for a robust quick-commerce business in India, and will accelerate digitisation and growth of the food and restaurant industry which accelerates our core food business " (from the 2022 Q4 shareholder discussion). Even if we accept this argument for minority holdings, it will add to the complexity in the firm and make investors and traders more wary, especially in periods of uncertainty.
The Macro Factors
When I valued Zomato in July 2021, the markets (in India and globally) were in the midst of a boom, with abundant supply of risk capital and optimism about economic growth, pushing up the prices of tech companies, generally, and the youngest, most money-losing tech companies, specifically. Those circumstances no longer hold, with two big developments in global markets, both of which I have talked about in previous posts
Inflation returns: Inflation is back in almost every part of the globe, and has unsettled markets. In this post, from May 2022, I noted that financial assets (stocks, bonds) lose value when inflation is higher than expected, and that a decade of low and stable inflation has left investors exposed and vulnerable. The effects of inflation show up first as higher risk free rates, across currencies, and next in higher risk premiums, with both equity risk premiums and default spreads rising. In a follow-up post a couple of weeks later, I looked inflation's effects on individual companies and argued that less-risky companies with pricing power and high gross margins would be less exposed than riskier, money-losing companies. (I will leave it to you to judge where Zomato falls on this continuum.)Risk Capital flees: In a post at the start of this month, I looked at how the retreat of risk capital, i.e., capital invested in the riskiest assets (from venture capital invested in start ups to investments in the riskiest collectibles) was playing out in higher equity risk premiums in mature markets, and in a later post a few days later, even bigger increases in equity risk premiums in emerging markets. As a company with the bulk of its business in India, Zomato again is more exposed to these developments.A higher equity risk premium for India (9.08% in July 2022, compared to 6.85% in July 2021) and a higher riskfree rate in rupees (4.78% in July 2022, compared to 4.25% in July 2021) conspire to push up the cost of capital for Zomato (and other Indian companies) by about 1.5-2% from my IPO valuation.A Zomato RevaluationIncorporating the updated financials for Zomato (with the doubling of revenues in conjunction with larger operating losses) and the higher cost of capital, from macro developments, I revalued Zomato on July 26, 2022:
 Download spreadsheet with valuation (and DIY)
Note that my core story for the company has not changed, but its Blinkit acquisition suggests that Zomato is planning a substantial foray into the grocery delivery business (pushing up the total market size currently and in the future), albeit at the expense of a smaller slice of revenues and a smaller market share. The value per share has dropped from ₹40.79 to ₹35.32 per share, with much of the value change from last year is coming from macroeconomic developments, manifested in a higher cost of capital. For this value to be generated, the company will need to stop paying lip service to contribution margins and adjusted EBITDA, and work on reducing growth in its cost of goods sold.
An Action Plan
So, what now? As with my valuation last year, let me emphasize that this is not the valuation of Zomato, but is my valuation and it will inform my decisions on the company. I have a story for Zomato, and valuation inputs that reflect that story, but I could be wrong on both fronts, and as I did last year, I tried to capture these uncertainties in a Monte Carlo simulation:
 Oracle Crystal Ball used for simulationsAllowing for the wide ranges of estimates that you can have on the total market for food (restaurant and grocery) delivery in India in 2032 and the uncertainties about Zomato's share of that market and its operating margins, you get a range of values. The median value of ₹34.12 is close to the base case value of ₹35.32, not surprising since the input distributions were centered on my base case input values, and at its current stock price (₹41.65 on July 26), the stock is still at the 70th percentile. That said a few more weeks like the last two will push the price below my median value, and if it does, I would buy Zomato, as part of a diversified portfolio (and not as a stand alone investment).
If you are a trader, you are playing a different game entirely, and Zomato's value is not part of that game. You are gauging mood and momentum, which at the moment are extremely negative for the stock, and trying to get ahead of a shift back to the positive. To make that judgment, you will be better served poring over charts, looking at price and volume movements, consulting with an astrologer, or even visiting your favored temple, church or mosque.
Conclusion I know that some of you did buy Zomato shares in their glory days in 2021 and are either continuing to hold, hoping for a come back, or have sold, and are licking your wounds. I am sorry for your loss, but please don't attribute to conspiracies (where insiders, founders and backers play the role of villains) what can be better explained by greed, and its capacity to cloud judgment. No matter how tempted you are to blame the financial news, journalists, equity research analysts and others for your decision to buy Zomato at its heights, that decision was ultimate yours and the first step in becoming a good investor is taking ownership of your decisions. Put bluntly, if you live by momentum, you die by it. Your consolation prize is that you have lots of company in this market (from Cathie Wood at Ark to the thousands of investors who put their money in Bitcoin, NFTs and other cryptos), and this too shall pass!
YouTube video
Blog Posts on ZomatoThe Zomato IPO: A Bet on Big Markets and Platforms! (July 22, 2021)A DIY (Do-itYourself) Valuation of Zomato! (August 2, 2021)SpreadsheetsDIY Valuation of Zomato in July 2021DIY Valuation of Zomato in July 2022
Aswath Damodaran's Blog

- Aswath Damodaran's profile
- 725 followers

