
Aswath Damodaran's Blog, page 22
July 20, 2017
Online Teaching: Promise, Pitfalls and Potential!
I am a teacher. That is how I describe myself to anyone who chooses to ask me what I do for a living. I am not a professor (sounds pedantic and pompous), definitely not an academic (how boring is that..) and don't consider myself anything more than a dilettante on almost every topic that I hold forth on. It is in pursuit of my teaching mission that I have put my regular classes online for most of the last two decades, though technology has made that sharing easier. For those of you who have read my postings before, I usually announce a few weeks ahead of every semester, the classes that I will be teaching at Stern, what each class is about and how you can access it, as I did in January with my Spring 2017 valuation and corporate finance classes. As September 2018 approaches, I was going to skip that ritual, since I will be on sabbatical next year (and if you have no idea what a sabbatical is, more on that later..) but I will be teaching, nevertheless, during the year.
Online Education
I still remember the first semester that I shared a class with an online audience was in the 1990s, when the internet was still in its infancy, we were still using dial-up modems and phones were connected to landlines. I recorded my regular classes using a VHS camcorder onto tapes, and then converted the tapes into videos of woeful quality, but with passable audio. I posted these online, but with only minimal additional material, since sharing was both time consuming and difficult to do. Needless to say, the internet has grown up and made sharing much easier, with class recordings now being made with built-in cameras in classrooms and converted to high quality videos quickly, to be watched on tablets on smart phones. Here, for instance, is my entire Spring 2017 valuation class, with links to the videos as well as almost every scrap of material that I provide for the class and even the emails I sent to the class.
I have long believed that the traditional university model not only is ripe for, but is deserving of , disruption, saddled with legacy costs and a muddled mission. That said, the attempts by online education to upend the university model have, for the most part, had only marginal success and it is in trying to answer why that I started thinking about how we teach, and learn online. In particular, online classes have proved a imperfect substitutes for regular classes due to three shortcomings:No personal touch: This may be a reflection of my age, but there is a difference between being in a live and watching a video of the same class, no matter how well it is recorded and presented. No interaction: We forget how much of the learning in a classroom comes, not from lectures, but from interaction, not just between the teacher and students but between students, often in informal and serendipitous exchanges. With online education, the interaction, if it exists, is highly formalized and there is less learning.Tough to stay disciplined: When you were in college, and enrolled for an 8.30 am class, did you feel like not going to class? I certainly did, but what kept me going was the fact that my absence would be noticed, not just by the professor, but by other students in the class. In fact, it is that group pressure and class structure that keeps us focused on project deadlines and exam dates, with regular classes. With online classes, that discipline has to come from within, and it should be therefore no surprised that most people who start online classes never finish them. It is perhaps easiest to see the challenges and limits of online teaching by looking at what it is that makes for a good class, in person or online. In my view, the measure of good teaching is that students don't get just content (tools, techniques, models) but that they learn how to create their own content, i.e., the capacity to devise their own tools to meet their needs. In the context of a regular class, you use readings, problem sets, quizzes and exams to deliver the former (content) but the latter (learning) requires a more complex mix of classroom and informal interaction, real life projects and intellectual curiosity (and I believe that it is partly a teacher's responsibility to evoke that). The time schedule of a regular class also puts limits on how much students can procrastinate, and peer pressure, from others taking the class or working with you on assignments, serves to keep most on task.
With this framework, the challenges of teaching online become clear. You have to find ways to keep students engaged, disciplined and interactive, and you have to do it online. While there are technical solutions to each one of these challenges (great videos for engagement, a time schedule and online exams for discipline, and discussion boards for interaction), and we have come a long way in the last few years, there is still a great deal of work to be done.
Online Classes: My learning curve
My search for a better way of delivering what I teach online started about five years ago, with a simple first step. I decided to try to take each of my regular lectures, which go for 80 minutes, and see if I could compress it into a 10-12 minute slot and the results were both revealing and humbling. It was not that difficult to compress my classes, a testimonial to how much buffer I build into my regular classes to ramble and pontificate. (If you have been in one of my regular classes or watched one, you probably know that there is nothing I enjoy more than going off on a riff on a topic or news story and I think you need a few of these in a 80-minute class to keep your class engaged.) I also started developing short post-session quizzes with solutions that someone watching the class could take, to check on whether they were "getting" the session material. I organized and sequenced the sessions and you can click to see the online versions of my corporate finance, valuation and investment philosophy classes.
I was under no illusions that I had unlocked the key to online learning with these classes, and these classes had significant limitations. First, packing material densely into 10-12 minute chunks can make watching even these short sessions taxing. Second, the videos that I made (with the help of a friend who was a camera man) were lacking in bells and whistles, basic talking-head videos with slides in the background. Third, there is no personal touch or interaction, since the videos are recorded. Finally, given the number of people in each of these classes, there was no way for me to give and grade exams, look over valuations or corporate financial analysis (a key ingredients of my regular classes) or provide certification that someone had taken the class.
Valuation Certificate ClassJust over a year ago, the Stern School of Business, which is where I teach, asked me whether I would be willing to teach an online certificate class. My initial response was to say no for two reasons. First, universities always seem to operate at deficits, no matter how much revenue they collect from tuition, and I knew that Stern would extract its pound of flesh from those who took the certificate. Second, I was concerned that if I did do a certificate class, and it became a money generator, that I would be asked to remove my free online classes. Stern must have wanted to do this certificate really badly since they offered to leave my online material untouched, if I agreed to work on the certificate course. It was this assurance, in conjunction with the opportunity to have videos shot in a studio, a platform that would allow me to offer exams and quizzes and discussion boards that finally led me to yes.
So, what makes the valuation certificate class different from the free online version? It is certainly not the content, since everything I teach in the certificate class is available on my website in multiple forms, but here are a few of the primary differences:Studio-shot videos: A studio, with professionals manning cameras, sound and lights, does allow for much better videos. With the help of a talented group that knows a lot more about editing and animation than I ever will, the final versions of the online classes are better than my online videos. There are, in all, 28 video sessions, with two sessions each week, over a 14 week time period. Supporting material: In addition to the post class tests and the supporting slides, I have links to papers, spreadsheets, data, YouTube videos and blog posts that go with each session. While I am a realist and know that much of this additional material will go untouched, having it accessible will make it easier for you to use it, if you feel the urge.Live Webex sessions: Every two weeks, through the semester, we will have a live webex session, where you (if you are enrolled in the class) can ask questions, not just about material covered in the previous week's sessions but news stories and happenings. I know it is not much, but it is a step in the right direction.Announcements and outreach: I contact the students in my regular classes about once a day, but I will spare you that level of harassment. You will hear from me a couple of times every week, checking in on how you are doing and keeping you updated on the course. Exams/Quizzes: There will be three quizzes and a final exam for the class. While they will be scheduled on specific dates, you can take them any time during a 24-hour time period and if you miss a quiz, the points will be moved to the remaining quizzes. So, if life gets in the way and you are unable to take a quiz, it is not the end of the world.Valuation Project: Each person in the class can pick any company he or she want to value and value it, over the course of the class. Midway through the semester, I will offer feedback, if you want, to allow you to tweak your valuation, and at the end of the semester, it will become a significant part of your overall grade.Certificate: After the final exam and valuation are graded, you will receive a certificate for the class, if you complete the requirements. If you do exceptionally well (and you will have to leave that judgment to me), your certificate will come "with honors".There were 66 people who signed up for the pilot version of the class, which started in January 2017 and 39 completed the class in May 2017. I learned as much from my students as I hope they learned from me, and here are a few lessons. First, I discovered that the discussion boards were effective at creative interactive discussions, among the students, if I did my job and organized the boards by topic. Second, in perhaps the most rewarding part of the class, a few students, who found the material both interesting and easy to grasp, took on the role of teachers helping others deal with mechanical and conceptual questions. Since the most effective way to learn something is to explain it to someone who does not quite "get" it, I restrained myself from jumping into the discussion boards, unless absolutely necessary. Third, I was impressed with both the work that was put into and the quality of the valuations that were turned in by those who finished the class. Of the 39 who were certified at the end of the class, about a third did well enough to get "with honors" attached to the certificate. I would have been proud with any of these students in my regular classes.
This fall, Stern will be offering the valuation certificate class to a bigger audience, with a class of several hundred. The good news is that the class will be tweaked to reflect the lessons learnt from the pilot class. I will continue to do what I did for the pilot, with my webex sessions, and provide feedback and grades not only for your exams but on the companies that you choose to value. The bad news is that Stern will charge "university level" prices for the class and I will not try to tell you that it is "worth it", since that depends on your circumstances. It is entirely possible that you will decide that the price charged is too much for a certificate, that you cannot afford it, or that you are more interested in the learning than in the certification, and if so, I hope that you give the free online version of the class a shot. If you are interested in enrolling in the class, the webpage where you can start the process is here. Incidentally, a pilot version of my corporate finance class, also offered as a certificate class, will be run in Spring 2018, and if you are interested, here is that link.
My Sabbatical
I mentioned, at the start of this post, that I would be on sabbatical, and at the risk of evoking envy, I will tell you what that involves. I am taking the 2017-18 academic year (September 2017- September 2018) off from my regular teaching, as I am allowed to do every seventh year. It is an entitlement that people in most other professions don't have and I recognize how incredibly lucky I am to be able to take a paid break from work. I do have a few odds and ends to take care off during the year, including teaching the certificate classes that I just listed and writing the third edition of The Dark Side of Valuation, but I plan to spend much of the year idling my time away, thinking about nothing in particular. That may sound wasteful, but I have discovered that my mind is most productive, when I am not trying too hard to be insightful. At least, that's my hope and if it does happen, that would be great. I But then again, if I don't have a single creative thought all year, that too was meant to be!
YouTube Video
My Free Online Classes
Corporate Finance (YouTube Playlist version)Valuation (YouTube Playlist version)Investment Philosophies (YouTube Playlist version) (New version will be out at the start of 2018)Stern Certificate ClassesValuation Certificate (Fall 2017)Corporate Finance Certificate Pilot (Spring 2018)
Online Education
I still remember the first semester that I shared a class with an online audience was in the 1990s, when the internet was still in its infancy, we were still using dial-up modems and phones were connected to landlines. I recorded my regular classes using a VHS camcorder onto tapes, and then converted the tapes into videos of woeful quality, but with passable audio. I posted these online, but with only minimal additional material, since sharing was both time consuming and difficult to do. Needless to say, the internet has grown up and made sharing much easier, with class recordings now being made with built-in cameras in classrooms and converted to high quality videos quickly, to be watched on tablets on smart phones. Here, for instance, is my entire Spring 2017 valuation class, with links to the videos as well as almost every scrap of material that I provide for the class and even the emails I sent to the class.
I have long believed that the traditional university model not only is ripe for, but is deserving of , disruption, saddled with legacy costs and a muddled mission. That said, the attempts by online education to upend the university model have, for the most part, had only marginal success and it is in trying to answer why that I started thinking about how we teach, and learn online. In particular, online classes have proved a imperfect substitutes for regular classes due to three shortcomings:No personal touch: This may be a reflection of my age, but there is a difference between being in a live and watching a video of the same class, no matter how well it is recorded and presented. No interaction: We forget how much of the learning in a classroom comes, not from lectures, but from interaction, not just between the teacher and students but between students, often in informal and serendipitous exchanges. With online education, the interaction, if it exists, is highly formalized and there is less learning.Tough to stay disciplined: When you were in college, and enrolled for an 8.30 am class, did you feel like not going to class? I certainly did, but what kept me going was the fact that my absence would be noticed, not just by the professor, but by other students in the class. In fact, it is that group pressure and class structure that keeps us focused on project deadlines and exam dates, with regular classes. With online classes, that discipline has to come from within, and it should be therefore no surprised that most people who start online classes never finish them. It is perhaps easiest to see the challenges and limits of online teaching by looking at what it is that makes for a good class, in person or online. In my view, the measure of good teaching is that students don't get just content (tools, techniques, models) but that they learn how to create their own content, i.e., the capacity to devise their own tools to meet their needs. In the context of a regular class, you use readings, problem sets, quizzes and exams to deliver the former (content) but the latter (learning) requires a more complex mix of classroom and informal interaction, real life projects and intellectual curiosity (and I believe that it is partly a teacher's responsibility to evoke that). The time schedule of a regular class also puts limits on how much students can procrastinate, and peer pressure, from others taking the class or working with you on assignments, serves to keep most on task.

With this framework, the challenges of teaching online become clear. You have to find ways to keep students engaged, disciplined and interactive, and you have to do it online. While there are technical solutions to each one of these challenges (great videos for engagement, a time schedule and online exams for discipline, and discussion boards for interaction), and we have come a long way in the last few years, there is still a great deal of work to be done.
Online Classes: My learning curve
My search for a better way of delivering what I teach online started about five years ago, with a simple first step. I decided to try to take each of my regular lectures, which go for 80 minutes, and see if I could compress it into a 10-12 minute slot and the results were both revealing and humbling. It was not that difficult to compress my classes, a testimonial to how much buffer I build into my regular classes to ramble and pontificate. (If you have been in one of my regular classes or watched one, you probably know that there is nothing I enjoy more than going off on a riff on a topic or news story and I think you need a few of these in a 80-minute class to keep your class engaged.) I also started developing short post-session quizzes with solutions that someone watching the class could take, to check on whether they were "getting" the session material. I organized and sequenced the sessions and you can click to see the online versions of my corporate finance, valuation and investment philosophy classes.
I was under no illusions that I had unlocked the key to online learning with these classes, and these classes had significant limitations. First, packing material densely into 10-12 minute chunks can make watching even these short sessions taxing. Second, the videos that I made (with the help of a friend who was a camera man) were lacking in bells and whistles, basic talking-head videos with slides in the background. Third, there is no personal touch or interaction, since the videos are recorded. Finally, given the number of people in each of these classes, there was no way for me to give and grade exams, look over valuations or corporate financial analysis (a key ingredients of my regular classes) or provide certification that someone had taken the class.
Valuation Certificate ClassJust over a year ago, the Stern School of Business, which is where I teach, asked me whether I would be willing to teach an online certificate class. My initial response was to say no for two reasons. First, universities always seem to operate at deficits, no matter how much revenue they collect from tuition, and I knew that Stern would extract its pound of flesh from those who took the certificate. Second, I was concerned that if I did do a certificate class, and it became a money generator, that I would be asked to remove my free online classes. Stern must have wanted to do this certificate really badly since they offered to leave my online material untouched, if I agreed to work on the certificate course. It was this assurance, in conjunction with the opportunity to have videos shot in a studio, a platform that would allow me to offer exams and quizzes and discussion boards that finally led me to yes.
So, what makes the valuation certificate class different from the free online version? It is certainly not the content, since everything I teach in the certificate class is available on my website in multiple forms, but here are a few of the primary differences:Studio-shot videos: A studio, with professionals manning cameras, sound and lights, does allow for much better videos. With the help of a talented group that knows a lot more about editing and animation than I ever will, the final versions of the online classes are better than my online videos. There are, in all, 28 video sessions, with two sessions each week, over a 14 week time period. Supporting material: In addition to the post class tests and the supporting slides, I have links to papers, spreadsheets, data, YouTube videos and blog posts that go with each session. While I am a realist and know that much of this additional material will go untouched, having it accessible will make it easier for you to use it, if you feel the urge.Live Webex sessions: Every two weeks, through the semester, we will have a live webex session, where you (if you are enrolled in the class) can ask questions, not just about material covered in the previous week's sessions but news stories and happenings. I know it is not much, but it is a step in the right direction.Announcements and outreach: I contact the students in my regular classes about once a day, but I will spare you that level of harassment. You will hear from me a couple of times every week, checking in on how you are doing and keeping you updated on the course. Exams/Quizzes: There will be three quizzes and a final exam for the class. While they will be scheduled on specific dates, you can take them any time during a 24-hour time period and if you miss a quiz, the points will be moved to the remaining quizzes. So, if life gets in the way and you are unable to take a quiz, it is not the end of the world.Valuation Project: Each person in the class can pick any company he or she want to value and value it, over the course of the class. Midway through the semester, I will offer feedback, if you want, to allow you to tweak your valuation, and at the end of the semester, it will become a significant part of your overall grade.Certificate: After the final exam and valuation are graded, you will receive a certificate for the class, if you complete the requirements. If you do exceptionally well (and you will have to leave that judgment to me), your certificate will come "with honors".There were 66 people who signed up for the pilot version of the class, which started in January 2017 and 39 completed the class in May 2017. I learned as much from my students as I hope they learned from me, and here are a few lessons. First, I discovered that the discussion boards were effective at creative interactive discussions, among the students, if I did my job and organized the boards by topic. Second, in perhaps the most rewarding part of the class, a few students, who found the material both interesting and easy to grasp, took on the role of teachers helping others deal with mechanical and conceptual questions. Since the most effective way to learn something is to explain it to someone who does not quite "get" it, I restrained myself from jumping into the discussion boards, unless absolutely necessary. Third, I was impressed with both the work that was put into and the quality of the valuations that were turned in by those who finished the class. Of the 39 who were certified at the end of the class, about a third did well enough to get "with honors" attached to the certificate. I would have been proud with any of these students in my regular classes.
This fall, Stern will be offering the valuation certificate class to a bigger audience, with a class of several hundred. The good news is that the class will be tweaked to reflect the lessons learnt from the pilot class. I will continue to do what I did for the pilot, with my webex sessions, and provide feedback and grades not only for your exams but on the companies that you choose to value. The bad news is that Stern will charge "university level" prices for the class and I will not try to tell you that it is "worth it", since that depends on your circumstances. It is entirely possible that you will decide that the price charged is too much for a certificate, that you cannot afford it, or that you are more interested in the learning than in the certification, and if so, I hope that you give the free online version of the class a shot. If you are interested in enrolling in the class, the webpage where you can start the process is here. Incidentally, a pilot version of my corporate finance class, also offered as a certificate class, will be run in Spring 2018, and if you are interested, here is that link.
My Sabbatical
I mentioned, at the start of this post, that I would be on sabbatical, and at the risk of evoking envy, I will tell you what that involves. I am taking the 2017-18 academic year (September 2017- September 2018) off from my regular teaching, as I am allowed to do every seventh year. It is an entitlement that people in most other professions don't have and I recognize how incredibly lucky I am to be able to take a paid break from work. I do have a few odds and ends to take care off during the year, including teaching the certificate classes that I just listed and writing the third edition of The Dark Side of Valuation, but I plan to spend much of the year idling my time away, thinking about nothing in particular. That may sound wasteful, but I have discovered that my mind is most productive, when I am not trying too hard to be insightful. At least, that's my hope and if it does happen, that would be great. I But then again, if I don't have a single creative thought all year, that too was meant to be!
YouTube Video
My Free Online Classes
Corporate Finance (YouTube Playlist version)Valuation (YouTube Playlist version)Investment Philosophies (YouTube Playlist version) (New version will be out at the start of 2018)Stern Certificate ClassesValuation Certificate (Fall 2017)Corporate Finance Certificate Pilot (Spring 2018)


July 13, 2017
The Dark Side of Globalization: An Update on Country Risk!
The inexorable push towards globalization has stalled in the last few years, but the change it has created is irreversible. The largest companies in the world are multinationals, deriving large portions of their revenues from outside domestic markets, and even the most inward looking investors are dependent upon global economies for their returns. As a consequence, measuring and incorporating country risk into decision making is a requirement in both corporate finance and valuation. It is in pursuit of that objective that I revisit the country risk issue twice every year, once at the start of the year and once mid-year, at which time I also update a paper that I have on the topic, that you are welcome to read or browse or ignore.
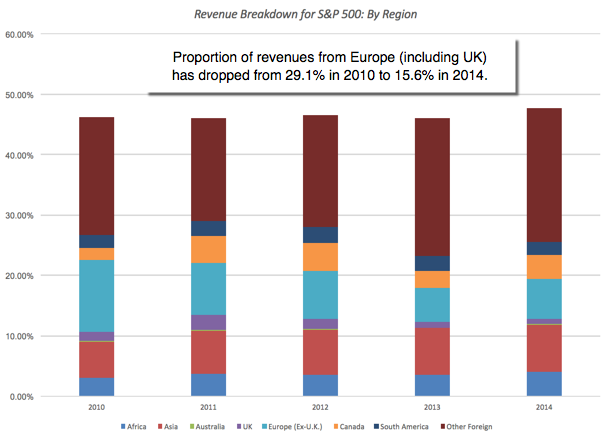
The Globalization of CompaniesThere are some investors, especially in the United States, who feel that they can avoid dealing with risk in other countries, by investing in just US stocks. That is a delusion, though, because a company that is incorporated and traded in the United States can derive a significant portion of its revenues and earnings from outside the country. In 2015, the companies in the S&P 500, the largest market cap stocks in the US, derived approximately 44% of its revenues from foreign markets, down from 48% in the prior year.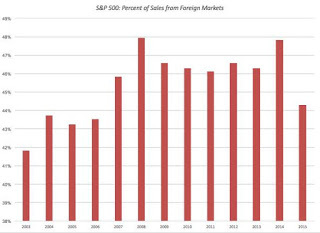 Source: S&PThe composition of foreign sales is also changing, though gradually, over time, shifting away from the UK and Europe to emerging markets, as evidenced in the graph below:
 Source: S&PLest you feel that this graph is skewed by the biggest companies in the index, 239 of the 500 companies in the index reported that foreign sales represented between 15% and 85% of their total sales and 13 companies reported that more than 85% of their sales came from outside the US. In 2014, two companies, Accenture and Seagate Technology, reported that all their sales were foreign, making them US companies only in name. This phenomenon is not restricted to US companies, as the largest companies in most markets exhibit similar characteristics. While we can debate whether these trend lines are good or bad for consumers and investors, the consequences are real:Fraying link to domestic economies: For decades, the conventional wisdom has been that the stock market in a country is closely tied to how well the economy of that country is doing. That relationship has been weakened by globalization and equity market performance around the world is disconnecting from domestic economic growth. Taking the US as an example, consider that equity markets in the US have been on a bull run, with indices up 170% to 200%, cumulatively since 2009, even as the US economy has been posting anemic growth.Central Banking power is diluted: In the decades since the great depression, we have to come to accept that central banks can use the policy levers that they have at their disposal to move long term interest rates and to strongly influence overall economic growth, but that power too has been reduced by globalization and its unpredictable flows. It should come as no surprise then that the frantic efforts of central banks\ in the US, Europe and Japan, in the last decade, to use the interest rate lever to pump up economic growth or to alter the trajectory of long term interest rates have failed.Taxing questions: When writing tax code, governments have generally assumed that companies incorporated in their domiciles have little choice but to accede to tax laws eventually and pay their share of taxes. While companies have historically played the tax game by delaying and deferring taxes due, their global reach now seems to have shifted the balance of power in their direction. In the United States, in particular, where the government has tried to tax companies on their global income, this push back has taken the form of trapped cash, as companies hold trillions of dollars of cash on foreign shores, and inversions, where some US companies have chosen to move their home base to more favorable tax locales.Declining cross-market correlations: As companies globalize, it should come as no surprise that the correlations across global equity markets have climbed, with two immediate consequences. The first is that global crises are now an almost annual occurrence rather than uncommon surprises, as pain in one market quickly spreads across the world. The second is that the salve of geographic diversification, long touted as protection against domestic market shocks, provides far less protection than it used to.The bottom line is that there is no place to hide from country risk, and as with any other type of risk, it is best to face up to it and deal with it explicitly.
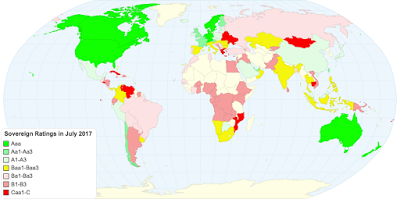
Country Risk - Default Risk MeasuresThe simplest and most easily measured country risk is the risk of sovereign default. When countries default on their obligations, it is not just the government that feels the pain but companies, consumers and investors do, as well.
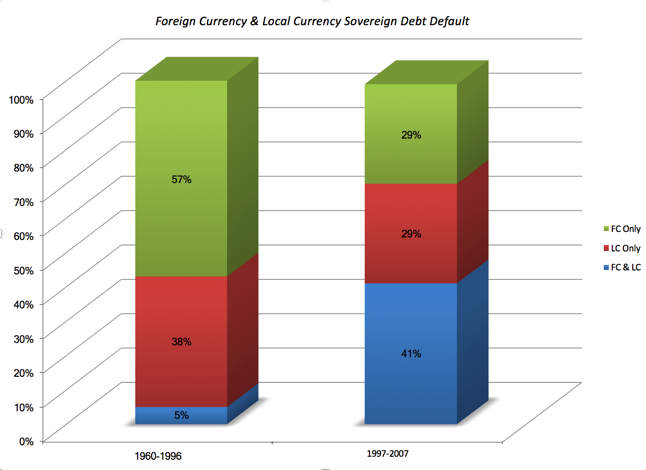
Sovereign Default: Frequency and ConsequencesGovernments borrow money, both from their own citizens and from foreign entities, and they sometimes borrow too much. Some of these government default, not only on their foreign currency debt but also on their local currency debt, with the latter having become more common over time: Source: Fitch RatingsYou may be puzzled by local currency debt defaults, since governments do have the capacity to print more of their own currency, but faced with a choice between defaulting or debasing their currencies, many governments choose the latter. When default occurs, the immediate pain is felt by the government and lenders, the former because it loses the capacity to borrow more, and the latter because they don't get paid., but there is collateral damage:Capital Market Turmoil: Liquidity dries up, as investors withdraw from equity and bond markets, making it more difficult for private enterprises in the defaulting country to raise funds for projects and resulting in sharp price drops in both bond and stock markets.Real growth: Sovereign defaults are generally followed by economic recessions, as consumers hold back on spending and firms are reluctant to commit resources to long-term investments.Political Instability: Default can also strike a blow to the national psyche, which in turn can put the leadership class at risk. The wave of defaults that swept through Europe in the 1930s, with Germany, Austria, Hungary and Italy all falling victims, allowed for the rise of the Nazis and set the stage for the Second World War. In Latin America, defaults and coups have gone hand in hand for much of the last two centuries.Sovereign RatingsThe most accessible measures of sovereign default risk are sovereign ratings, with S&P, Moody's and Fitch all providing both local currency and foreign currency ratings for most countries around the world. While there are many who mistrust these ratings, they are widely used as proxies of country risk and changes in ratings, especially down grades, are news worthy and affect markets. The process and metrics used to arrive at the ratings are described more fully here and here but the picture below summarizes the sovereign ratings assigned to countries in July 2017 and the data can be downloaded at this link:
 Link for live mapThe last decade has turned the spotlight on both the pluses and minuses of ratings. On the plus side, as the ratings agencies are quick to point out, ratings and default spreads are highly correlated. On the minus side, ratings agencies seem to have regional biases (under rating emerging markets and over rating developed markets) and are slow to change ratings.
Sovereign CDS SpreadsIn the last decade, we have seen the growth of a market-based measure of default risk in the Credit Default Swap (CDS) market, where you can buy insurance against sovereign default by buying a sovereign CDS. Since the insurance is priced on annual basis, the price of a sovereign CDS becomes a market measure of the default spread for that country. In July 2017, there were 68 countries with sovereign CDS and the picture below captures the pricing (with the data available for download at this link). One of the limitations of the CDS market is that there is still credit risk in the market and to allow for the upward bias this creates in the spreads, I compute a netted version of the spread, where I net out the US sovereign CDS spread of 0.34% from each country's CDS spread.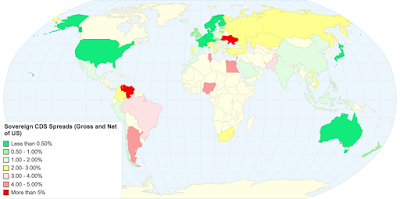 Link for live mapTo provide a comparison between the CDS and sovereign rating measures of default risk, let me offer two example. The sovereign CDS for Brazil on July 1, 2017, was 3.46%. On the same day, Moody rated Brazil at Ba2, with an estimated default spread of 3.17%, close to the CDS value. For India, the sovereign CDS spread on July 1, 2017, was 2.42%, very close to the default spread of 2.32% that would have been assigned to it based upon its Baa3 rating.
Country Risk - Institutional RiskWhen investing in a company, the sovereign default risk is just one of many risks that you have to factor into your decision making. In fact, default risk may pale in comparison to risks you face because of the institutional structure, or lack of it, in a country. At the risk of picking at scabs, here is my shot at assessing some of these risks.1. CorruptionMuch as we like to inveigh against its consequences, corruption is not just part and parcel of operating in some parts of the world, but it takes on the role of an implicit tax, one that is paid to free agents, acting in their own interests, rather than to governments. Transparency International, an entity that measures corruption risk around the world, estimates corruption scores for individual countries and heir findings for 2016 are summarized in the picture below. To see where a country falls on the corruption continuum, you can either click on the live link below the picture or download the data by country by clicking here.
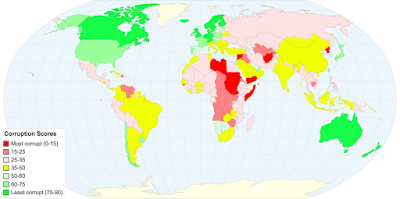 Link to live mapWhile it is easy to fall back on cultural stereotypes to explain differences across countries, there is a high correlation between economic well being and corruption. Thus, while much of Latin America scores low on the corruption, Chile and Uruguay rank much higher, as do South Korea and Japan in Asia.
2. Legal ProtectionsEven the very best investments are only as good as the legal protections that you have as an investor, against expropriation or theft, which is why the property right protections rank high on investor wish lists. To measure the strength of property rights, I turned to the International Property Rights Index (IPRI), and report the scores they assigned in their most recent update in 2016, to countries in the picture below. You can click on the live link below the picture or download the data here.
 Link to live mapEurope, North America, Japan and Australia all score high on property rights, but the hopeful sign is that index itself has seen increasing respect for property rights across time and Venezuela and Myanmar are now more the exception, than the rule.
3. Risk of violenceIt is difficult to do business, when you have bullets whizzing by and bombs going off around you. Holding all else constant, you would prefer to operate in parts of the world that are safer rather than riskier. To measure exposure to violence, I again turn to an external entity, Vision of Humanity, and reproduce their Global Peace Index in the picture below (with link to live map and to data):
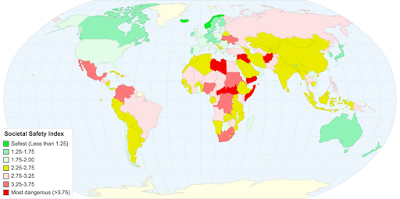 Link to live mapIn keeping with the adage that when it rains, it pours, the countries that are most susceptible to corruption and have weak property rights also seem to be most exposed to physical violence.
Country Risk - Equity RiskAs you can see, there are multiple dimensions on which you can measure country risk, leading to different scores and rankings. As an investor in the country, you are exposed to all of these risks, albeit to varying degrees, and you have to consider all these risks in making decisions. Consequently, you would like (a) a composite measure of risk that (b) you can convert into a metric that easily fits into your investment framework.
1. Country Risk ScoresThere are several services that provide composite measures of country risk, including the Economist, Euromoney and Political Risk Services (PRS). These country risk measures take the form of numerical scores, and in the heat map below, I report the change in the PRS country risk score between July 2016 and July 2017 and categorize countries based on the direction and magnitude of the change. Here, as in the prior pictures, you can see the PRS scores and the change, by country, by either clicking on the live map link below the picture or download the data by clicking here).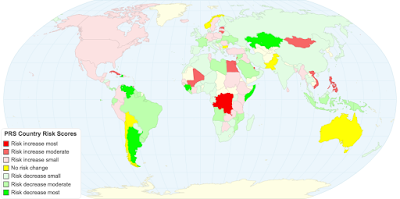 Link for live mapBased on the PRS scores, the vast majority of emerging markets became safer during the time period between July 2016 and July 2017, with the biggest improvements in Latin America and Asia. The North American countries saw risk go up, as did pockets of Africa and South East Asia. The problem with country risk scores, no matter how well they are measured, is that they do not fit a standardized framework. Just to provide an illustration, PRS scores are low for risky countries and high for safe countries, whereas the Economist risk scores are high for risky countries and low for safe countries.
3. Equity Risk PremiumsTo incorporate and adjust for country risk into investing and valuation, I try to estimate the equity risk premiums for country, with riskier countries having higher equity risk premiums. I start with the implied equity risk premium for the US, which I estimate to be 5.13% at the start of July 2017 as my mature market premium and add to it a scaled up version of the default spread (based upon the rating); the scaling factor of 1.15 is based upon the relative volatility of emerging market equities versus bonds. You can see a more detailed description of the process in the paper that is linked at the end of this post. You can look up the equity risk premium for an individual country by clicking on the live map link or download the data by clicking here.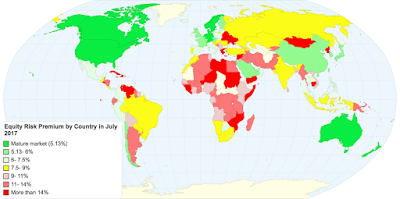 Link for live mapThese equity risk premiums are central to how I deal with country risk in valuation, as I will explain in the last section of this post.
Closing the LoopWhen valuing companies that have substantial exposure to country risk, it is easy to get overwhelmed by the variety of risks. To keep the process under your control, you should start by breaking country risk into three buckets: risk that is specific just to that country, risk that is macro/global and discrete risks that are potentially catastrophic (such as nationalization or terrorism). Each has a place in valuation, with country specific risks incorporated into expected cash flows, macro economic risks in the discount rate and discrete risks in a post-valuation adjustment.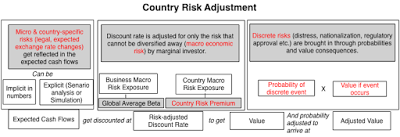
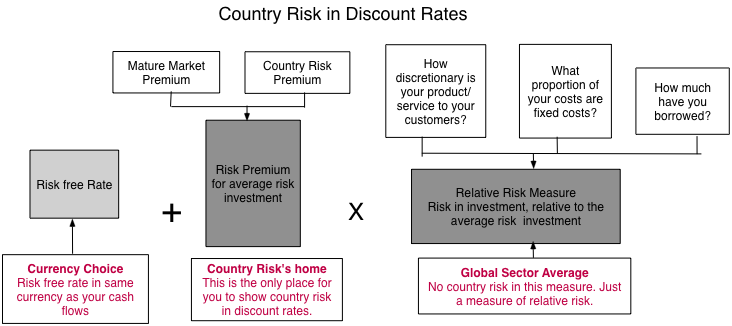
1. Adjusting discount ratesThe key to a clean country risk adjustment, when estimating discount rates, is to make sure that you do not double or even triple count it. With the cost of equity for a company, for instance, where there are only three inputs that drive the cost, it is only the equity risk premium that should be conduit for country risk (hence explaining my earlier focus on equity risk premiums, by country). The risk free rate is a function of the currency that you choose to do your valuation in and the relative risk measure (or beta, if that is how you choose to measure it) should be determined by the business or businesses that the company operates in.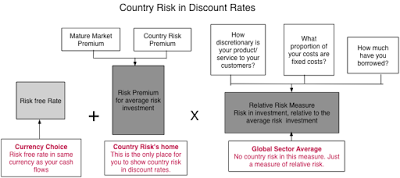
If you are discounting the composite cash flows of a multinational company, the equity risk premium should be a weighted average of the equity risk premiums of the countries that the company operates in, with the weights based on revenues or operating assets. If you are valuing just the operations in one country, you would use the equity risk premium just for that country.
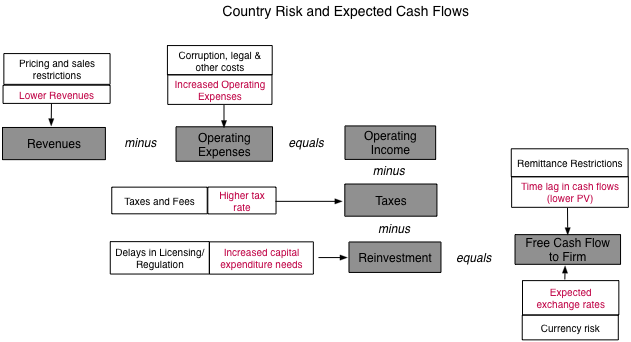
2. Expected cash flowsWith risks that are specific to a country, it is better to incorporate the risks into the expected cash flows. Thus, if a country is rife with corruption, you could treat the resulting costs as part of operating expenses, reducing profits and cash flows. When legal and regulatory delays are a feature of business in a country, you can build in the delay as lags between investing and operations. When violence (from terrorism or war) is part and parcel of operations, you may want to include a cost of insuring against the risk in your cash flows.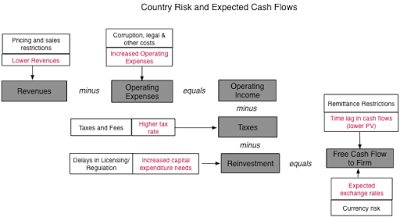
None of these adjustments are easy to make, but it is worth remembering that incorporating the risk into your cash flows is not risk adjusting the cash flow, since the latter requires replacing the expected cash flow with a certainty equivalent one. Where does currency risk play out? When converting cash flows from one currency (foreign) to another (domestic), you should bring in expected devaluation or revaluation into expected exchange rates. If you want to hedge exchange rate risk, you can incorporate the cost of heeding into your cash flows but it is not clear that you should be adjusting discount rates for that risk, since investors can diversify it away.
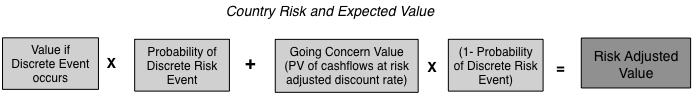
3. Post-Valuation AdjustmentThere are some risks that are rare, but if they occur, can be devastating, at least for investors in a business. Included in this grouping would be the risk of nationalization and terrorism. These risks cannot be incorporated easily into discount rates and adjusting expected cash flows in a going concern valuation (DCF) for risk that a company will be nationalized or will not survive is messy.
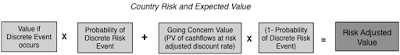
Thus, to estimate the effect that nationalization risk will have on the value of a business, you will have to assess the probability that the business will be nationalized and the value that you will receive as owners of the business, in the event of nationalization.
Danger and OpportunityOne of my favorite definitions of risk is the Chinese symbol for it, a combination of the symbols for danger and opportunity. 風險With risky emerging markets, this comes into , I am reminded that to have one (opportunity), I have to be willing to live the other (danger). Blindly ignoring these markets, as some conservative developed market companies are inclined to do, because there is danger will lead to stagnation, but blindly jumping into them, drawn by opportunity, will cause implosions. The essence of risk management is to measure the danger in markets and then gauge whether the opportunities are sufficient to compensate you for the dangers. That is what I hope that I have laid the foundations for, in this post.
YouTube Video
Attachment
Country Risk: Determinants, Measures and Implications - The 2017 EditionData LinksSovereign Ratings - July 2017Sovereign CDS Spreads - July 2017Corruption Scores - July 2017Property Rights Index - July 2017Peace/Violence Index - July 2017PRS Score Groupings - July 2017Equity Risk Premiums - July 2017
The Globalization of CompaniesThere are some investors, especially in the United States, who feel that they can avoid dealing with risk in other countries, by investing in just US stocks. That is a delusion, though, because a company that is incorporated and traded in the United States can derive a significant portion of its revenues and earnings from outside the country. In 2015, the companies in the S&P 500, the largest market cap stocks in the US, derived approximately 44% of its revenues from foreign markets, down from 48% in the prior year.
 Source: S&PThe composition of foreign sales is also changing, though gradually, over time, shifting away from the UK and Europe to emerging markets, as evidenced in the graph below:
 Source: S&PLest you feel that this graph is skewed by the biggest companies in the index, 239 of the 500 companies in the index reported that foreign sales represented between 15% and 85% of their total sales and 13 companies reported that more than 85% of their sales came from outside the US. In 2014, two companies, Accenture and Seagate Technology, reported that all their sales were foreign, making them US companies only in name. This phenomenon is not restricted to US companies, as the largest companies in most markets exhibit similar characteristics. While we can debate whether these trend lines are good or bad for consumers and investors, the consequences are real:Fraying link to domestic economies: For decades, the conventional wisdom has been that the stock market in a country is closely tied to how well the economy of that country is doing. That relationship has been weakened by globalization and equity market performance around the world is disconnecting from domestic economic growth. Taking the US as an example, consider that equity markets in the US have been on a bull run, with indices up 170% to 200%, cumulatively since 2009, even as the US economy has been posting anemic growth.Central Banking power is diluted: In the decades since the great depression, we have to come to accept that central banks can use the policy levers that they have at their disposal to move long term interest rates and to strongly influence overall economic growth, but that power too has been reduced by globalization and its unpredictable flows. It should come as no surprise then that the frantic efforts of central banks\ in the US, Europe and Japan, in the last decade, to use the interest rate lever to pump up economic growth or to alter the trajectory of long term interest rates have failed.Taxing questions: When writing tax code, governments have generally assumed that companies incorporated in their domiciles have little choice but to accede to tax laws eventually and pay their share of taxes. While companies have historically played the tax game by delaying and deferring taxes due, their global reach now seems to have shifted the balance of power in their direction. In the United States, in particular, where the government has tried to tax companies on their global income, this push back has taken the form of trapped cash, as companies hold trillions of dollars of cash on foreign shores, and inversions, where some US companies have chosen to move their home base to more favorable tax locales.Declining cross-market correlations: As companies globalize, it should come as no surprise that the correlations across global equity markets have climbed, with two immediate consequences. The first is that global crises are now an almost annual occurrence rather than uncommon surprises, as pain in one market quickly spreads across the world. The second is that the salve of geographic diversification, long touted as protection against domestic market shocks, provides far less protection than it used to.The bottom line is that there is no place to hide from country risk, and as with any other type of risk, it is best to face up to it and deal with it explicitly.
Country Risk - Default Risk MeasuresThe simplest and most easily measured country risk is the risk of sovereign default. When countries default on their obligations, it is not just the government that feels the pain but companies, consumers and investors do, as well.
Sovereign Default: Frequency and ConsequencesGovernments borrow money, both from their own citizens and from foreign entities, and they sometimes borrow too much. Some of these government default, not only on their foreign currency debt but also on their local currency debt, with the latter having become more common over time:
 Source: Fitch RatingsYou may be puzzled by local currency debt defaults, since governments do have the capacity to print more of their own currency, but faced with a choice between defaulting or debasing their currencies, many governments choose the latter. When default occurs, the immediate pain is felt by the government and lenders, the former because it loses the capacity to borrow more, and the latter because they don't get paid., but there is collateral damage:Capital Market Turmoil: Liquidity dries up, as investors withdraw from equity and bond markets, making it more difficult for private enterprises in the defaulting country to raise funds for projects and resulting in sharp price drops in both bond and stock markets.Real growth: Sovereign defaults are generally followed by economic recessions, as consumers hold back on spending and firms are reluctant to commit resources to long-term investments.Political Instability: Default can also strike a blow to the national psyche, which in turn can put the leadership class at risk. The wave of defaults that swept through Europe in the 1930s, with Germany, Austria, Hungary and Italy all falling victims, allowed for the rise of the Nazis and set the stage for the Second World War. In Latin America, defaults and coups have gone hand in hand for much of the last two centuries.Sovereign RatingsThe most accessible measures of sovereign default risk are sovereign ratings, with S&P, Moody's and Fitch all providing both local currency and foreign currency ratings for most countries around the world. While there are many who mistrust these ratings, they are widely used as proxies of country risk and changes in ratings, especially down grades, are news worthy and affect markets. The process and metrics used to arrive at the ratings are described more fully here and here but the picture below summarizes the sovereign ratings assigned to countries in July 2017 and the data can be downloaded at this link:
 Link for live mapThe last decade has turned the spotlight on both the pluses and minuses of ratings. On the plus side, as the ratings agencies are quick to point out, ratings and default spreads are highly correlated. On the minus side, ratings agencies seem to have regional biases (under rating emerging markets and over rating developed markets) and are slow to change ratings.
 Sovereign CDS SpreadsIn the last decade, we have seen the growth of a market-based measure of default risk in the Credit Default Swap (CDS) market, where you can buy insurance against sovereign default by buying a sovereign CDS. Since the insurance is priced on annual basis, the price of a sovereign CDS becomes a market measure of the default spread for that country. In July 2017, there were 68 countries with sovereign CDS and the picture below captures the pricing (with the data available for download at this link). One of the limitations of the CDS market is that there is still credit risk in the market and to allow for the upward bias this creates in the spreads, I compute a netted version of the spread, where I net out the US sovereign CDS spread of 0.34% from each country's CDS spread.
 Link for live mapTo provide a comparison between the CDS and sovereign rating measures of default risk, let me offer two example. The sovereign CDS for Brazil on July 1, 2017, was 3.46%. On the same day, Moody rated Brazil at Ba2, with an estimated default spread of 3.17%, close to the CDS value. For India, the sovereign CDS spread on July 1, 2017, was 2.42%, very close to the default spread of 2.32% that would have been assigned to it based upon its Baa3 rating.
Country Risk - Institutional RiskWhen investing in a company, the sovereign default risk is just one of many risks that you have to factor into your decision making. In fact, default risk may pale in comparison to risks you face because of the institutional structure, or lack of it, in a country. At the risk of picking at scabs, here is my shot at assessing some of these risks.1. CorruptionMuch as we like to inveigh against its consequences, corruption is not just part and parcel of operating in some parts of the world, but it takes on the role of an implicit tax, one that is paid to free agents, acting in their own interests, rather than to governments. Transparency International, an entity that measures corruption risk around the world, estimates corruption scores for individual countries and heir findings for 2016 are summarized in the picture below. To see where a country falls on the corruption continuum, you can either click on the live link below the picture or download the data by country by clicking here.
 Link to live mapWhile it is easy to fall back on cultural stereotypes to explain differences across countries, there is a high correlation between economic well being and corruption. Thus, while much of Latin America scores low on the corruption, Chile and Uruguay rank much higher, as do South Korea and Japan in Asia.
2. Legal ProtectionsEven the very best investments are only as good as the legal protections that you have as an investor, against expropriation or theft, which is why the property right protections rank high on investor wish lists. To measure the strength of property rights, I turned to the International Property Rights Index (IPRI), and report the scores they assigned in their most recent update in 2016, to countries in the picture below. You can click on the live link below the picture or download the data here.
 Link to live mapEurope, North America, Japan and Australia all score high on property rights, but the hopeful sign is that index itself has seen increasing respect for property rights across time and Venezuela and Myanmar are now more the exception, than the rule.
3. Risk of violenceIt is difficult to do business, when you have bullets whizzing by and bombs going off around you. Holding all else constant, you would prefer to operate in parts of the world that are safer rather than riskier. To measure exposure to violence, I again turn to an external entity, Vision of Humanity, and reproduce their Global Peace Index in the picture below (with link to live map and to data):
 Link to live mapIn keeping with the adage that when it rains, it pours, the countries that are most susceptible to corruption and have weak property rights also seem to be most exposed to physical violence.
Country Risk - Equity RiskAs you can see, there are multiple dimensions on which you can measure country risk, leading to different scores and rankings. As an investor in the country, you are exposed to all of these risks, albeit to varying degrees, and you have to consider all these risks in making decisions. Consequently, you would like (a) a composite measure of risk that (b) you can convert into a metric that easily fits into your investment framework.
1. Country Risk ScoresThere are several services that provide composite measures of country risk, including the Economist, Euromoney and Political Risk Services (PRS). These country risk measures take the form of numerical scores, and in the heat map below, I report the change in the PRS country risk score between July 2016 and July 2017 and categorize countries based on the direction and magnitude of the change. Here, as in the prior pictures, you can see the PRS scores and the change, by country, by either clicking on the live map link below the picture or download the data by clicking here).
 Link for live mapBased on the PRS scores, the vast majority of emerging markets became safer during the time period between July 2016 and July 2017, with the biggest improvements in Latin America and Asia. The North American countries saw risk go up, as did pockets of Africa and South East Asia. The problem with country risk scores, no matter how well they are measured, is that they do not fit a standardized framework. Just to provide an illustration, PRS scores are low for risky countries and high for safe countries, whereas the Economist risk scores are high for risky countries and low for safe countries.
3. Equity Risk PremiumsTo incorporate and adjust for country risk into investing and valuation, I try to estimate the equity risk premiums for country, with riskier countries having higher equity risk premiums. I start with the implied equity risk premium for the US, which I estimate to be 5.13% at the start of July 2017 as my mature market premium and add to it a scaled up version of the default spread (based upon the rating); the scaling factor of 1.15 is based upon the relative volatility of emerging market equities versus bonds. You can see a more detailed description of the process in the paper that is linked at the end of this post. You can look up the equity risk premium for an individual country by clicking on the live map link or download the data by clicking here.
 Link for live mapThese equity risk premiums are central to how I deal with country risk in valuation, as I will explain in the last section of this post.
Closing the LoopWhen valuing companies that have substantial exposure to country risk, it is easy to get overwhelmed by the variety of risks. To keep the process under your control, you should start by breaking country risk into three buckets: risk that is specific just to that country, risk that is macro/global and discrete risks that are potentially catastrophic (such as nationalization or terrorism). Each has a place in valuation, with country specific risks incorporated into expected cash flows, macro economic risks in the discount rate and discrete risks in a post-valuation adjustment.

1. Adjusting discount ratesThe key to a clean country risk adjustment, when estimating discount rates, is to make sure that you do not double or even triple count it. With the cost of equity for a company, for instance, where there are only three inputs that drive the cost, it is only the equity risk premium that should be conduit for country risk (hence explaining my earlier focus on equity risk premiums, by country). The risk free rate is a function of the currency that you choose to do your valuation in and the relative risk measure (or beta, if that is how you choose to measure it) should be determined by the business or businesses that the company operates in.
If you are discounting the composite cash flows of a multinational company, the equity risk premium should be a weighted average of the equity risk premiums of the countries that the company operates in, with the weights based on revenues or operating assets. If you are valuing just the operations in one country, you would use the equity risk premium just for that country.
2. Expected cash flowsWith risks that are specific to a country, it is better to incorporate the risks into the expected cash flows. Thus, if a country is rife with corruption, you could treat the resulting costs as part of operating expenses, reducing profits and cash flows. When legal and regulatory delays are a feature of business in a country, you can build in the delay as lags between investing and operations. When violence (from terrorism or war) is part and parcel of operations, you may want to include a cost of insuring against the risk in your cash flows.
None of these adjustments are easy to make, but it is worth remembering that incorporating the risk into your cash flows is not risk adjusting the cash flow, since the latter requires replacing the expected cash flow with a certainty equivalent one. Where does currency risk play out? When converting cash flows from one currency (foreign) to another (domestic), you should bring in expected devaluation or revaluation into expected exchange rates. If you want to hedge exchange rate risk, you can incorporate the cost of heeding into your cash flows but it is not clear that you should be adjusting discount rates for that risk, since investors can diversify it away.
3. Post-Valuation AdjustmentThere are some risks that are rare, but if they occur, can be devastating, at least for investors in a business. Included in this grouping would be the risk of nationalization and terrorism. These risks cannot be incorporated easily into discount rates and adjusting expected cash flows in a going concern valuation (DCF) for risk that a company will be nationalized or will not survive is messy.
Thus, to estimate the effect that nationalization risk will have on the value of a business, you will have to assess the probability that the business will be nationalized and the value that you will receive as owners of the business, in the event of nationalization.
Danger and OpportunityOne of my favorite definitions of risk is the Chinese symbol for it, a combination of the symbols for danger and opportunity. 風險With risky emerging markets, this comes into , I am reminded that to have one (opportunity), I have to be willing to live the other (danger). Blindly ignoring these markets, as some conservative developed market companies are inclined to do, because there is danger will lead to stagnation, but blindly jumping into them, drawn by opportunity, will cause implosions. The essence of risk management is to measure the danger in markets and then gauge whether the opportunities are sufficient to compensate you for the dangers. That is what I hope that I have laid the foundations for, in this post.
YouTube Video
Attachment
Country Risk: Determinants, Measures and Implications - The 2017 EditionData LinksSovereign Ratings - July 2017Sovereign CDS Spreads - July 2017Corruption Scores - July 2017Property Rights Index - July 2017Peace/Violence Index - July 2017PRS Score Groupings - July 2017Equity Risk Premiums - July 2017
July 5, 2017
User/Subscriber Economics: Value Dynamics
In my last post, I tried valuing Uber by estimating how much an existing user was worth to the company and then using that number to extrapolate to the value of all existing users and the value added by new users. As always, I got many useful comments on what I was missing, what I could do better and what could be simplified, and I thank you (really). While I could spend this entire post rehashing assumptions, I don't intend to! To me, the most useful part of valuation is not the destination, i.e., the value that you get at the end, but the journey, i.e., the process of doing valuation, since it is the process that allows us to isolate the key drivers of value, which, in turn, focuses discussions on those variables, rather than on distractions. Consequently, I decided to revisit my Uber user-based valuation to see what I could eke out as implications for user or subscriber-based businesses.
Estimation versus Economic Risk
I will start by conceding the obvious. I made a lot of assumptions to arrive at the value of a user at Uber, but I will go further. There was not a single fact in that valuation, since every number was an estimate. That said, you could say that about the valuation of any company, with the divergence really being one of the degree of uncertainty you face, not in whether it exists. At the risk of restating points that I have made in my other writing, here are three general points that I would make about uncertainty in valuation.
1. Estimation uncertainty versus Economic uncertainty
To deal with uncertainty in a sensible way, you first have to categorize it. One of the categorizations that I find useful is to break the uncertainty you face when you are trying to value a business or an asset into estimation and economic uncertainty. Estimation uncertainty comes from incomplete, missing or misleading information provided by the company that you are valuing, whereas economic uncertainty is driven by forthcoming changes in the business that the company operates in, as well as macro economic factors. Estimation uncertainty can be reduced by obtaining better and more complete information but estimation uncertainty will remain resistant, no matter how time you put in and what data analysis that you do. Using my Uber user valuation, it is true that some of the noise in the valuation comes from Uber being a private, secretive company and but most of the uncertainty comes from the ride sharing business being in a state of flux, as regulators and competitors work out how best to deal with shifting consumer tastes and changing technologies. This has two implications. The first is that even if you had access to more information, either because Uber decides to go public or you are an insider in the company, much of the uncertainty in estimated value per user will remain. The second is that your estimated value will change considerably over time, as the facts on the ground change, and that volatility in value cannot be viewed as a shortcoming of the model.
2. Uncertainty is an integral part of valuation
One critique that leaves me unmoved is that valuing a business or an asset, in the face of significant uncertainty, is pointless because you will be wrong. So what? Uncertainty is part and parcel of doing business and you cannot wish it, pray it or analyze it away. As I see it, you have two choices when it comes to uncertainty. You can deal with it frontally by making explicit assumptions or you can go into "denial" model and make implicit assumptions. When I tried to value a user at Uber, I made explicit assumptions about user life, renewal rates and a host of other variables, and I will cheerfully admit that I will be wrong on every one of them, but what is the alternative? When pricing a user by looking at what others are paying for users in similar companies, you are making assumptions about all of the variables as well, but those assumptions are implicit. In fact, they are hidden so well that you may not be aware of your own assumptions, a dangerous place to be when investing.
3. Uncertainty can (and should) be visualized
Here is my response to uncertainty. Where data exists but I do not have access to that data, I will try to make my best estimates based upon the existing information, noisy, dated or second hand though it might be. Where I have access to data, I will check it against other data, common sense and economic first principles. Where there is no data, I will make my best estimates and to the extent that these estimates come with probability distributions, my value itself is a distribution, not a number. Illustrating this process, with the Uber user valuation: Excel Add On: Crystal Ball (Oracle), Simulation OutputI have made distributional assumptions on four of my inputs: the portion of Uber's expenses that go to servicing existing users, the life time of a user, the proportion of expenses that are variable and the cost of capital (discount rate) to compute today's value. Since these distributions are all centered on my base case assumptions, it should come as no surprise that the median value of a user ($414) is very close to my base case value ($410). However, there is a wide spread around that value, with the numbers ranging a low of $74, when the user life is short, the expenses of servicing a use are high, most of the costs are variable and the cost of capital is low, to a high of more than $1000 per user, when the opposite conditions hold. Note that at the current pricing of $69 billion, you are valuing each user close to $900, at the upper end of the distribution.
User Economics: Cost Propositions
It is true that the end game for every business is to make money for its investors. That said, there is a tendency to over react, when a young company reports a loss, as was the case when Uber reported an operating loss of $2.8 billion for 2016, a few months ago. The pessimists on Uber viewed this as further evidence that the company was on a pathway to nowhere and that investors in the company must be delusional to attach any value to it. The optimists argued that it is natural for young companies to lose money and that Uber should be judged on other dimensions such as user growth and market potential instead. At the risk of angering both groups, I will use my Uber user valuation to argue that while I agree with the second group that losing money is typical at young companies, I will also take sides with the first group that you still need a pathway to profitability amidst the losses, for value to exist.
1. Servicing existing users versus acquiring new users
In my Uber user valuation, I started with the operating losses reported by the company ($2.8 billion), backed into the total operating expenses for the company ($9.3 billion) and then allocated that expense across three categories: servicing existing user (48.17%), acquiring new users (41.08%) and corporate expenses (10.75%). While I based this breakdown on the information (on increase in users and contribution margins in ride sharing) that I had on Uber in 2016, that information is dated, noisy and second hand. It is entirely possible that the actual break down of expenses is different from my estimate. If you are wondering why it matters, since the end result (that Uber lost $2.8 billion) is not changing, there are consequences that you can see in the table below:
Uber User Value: Existing User versus New User Costs table.tableizer-table { font-size: 12px; border: 1px solid #CCC; font-family: Arial, Helvetica, sans-serif; } .tableizer-table td { padding: 4px; margin: 3px; border: 1px solid #CCC; } .tableizer-table th { background-color: #104E8B; color: #FFF; font-weight: bold; }
% of Operating Expenses spent on acquiring new usersValue of Existing UsersValue of New UsersUber User Value% of Value from Existing users0%$6,167 $18,147 $24,314 25.36%20%$10,619 $19,035 $29,654 35.81%40%$15,071 $19,923 $34,994 43.07%60%$19,523 $20,811 $40,334 48.40%80%$23,974 $21,699 $45,673 52.49%100%$28,426 $22,587 $51,013 55.72%
As you increase the proportion of the operating expenses that are spent on acquiring new users, the value of an existing user goes up because you are spending less money on providing service to that user, but the value of a new user also increases, as the net value added (the difference between the user value and the cost of acquiring a user) goes up. Ironically, as you spend more on acquiring new users and less on servicing existing users, the proportion of your value that comes from existing users increases.
User Value Proposition 1: A money-losing company that is losing money providing service to existing users/customers is worth less than a company with equivalent losses, where the primary expenses are coming from customer acquisitions.This is, of course, neither profound nor surprising, and it explains why, left to their own devices and without any monitoring, young companies will claim that most or all of their expenses are for acquiring new customers. If you are investing in a young company, you will have to do your own assessment of whether managers are misrepresenting, by looking at expense growth over time versus new customers. If the number of total customers remains fixed and expenses keep rising, you should be skeptical about managerial claims (that most of the costs are for acquiring new customers).
2. Cost Structure
One reason that investors are willing to accept losses at young companies is because they believe that as the company grows its operations, there will be economies of scale. In income statement terms, this will result in expenses growing less quickly than revenues and improving operating margins. That said, you cannot take it on faith that this will always happen or that it will happen at the same rate for every company. To see the impact on user value of this dimension, I adjusted the portion of Uber's expenses that are variable (and will grow with revenues) and those that are fixed (and grow at a lower rate) and captured the value effect in this table:
Uber User Value and Cost Structure table.tableizer-table { font-size: 12px; border: 1px solid #CCC; font-family: Arial, Helvetica, sans-serif; } .tableizer-table td { padding: 4px; margin: 3px; border: 1px solid #CCC; } .tableizer-table th { background-color: #104E8B; color: #FFF; font-weight: bold; }
% of current expenses that are fixedValue of Existing UsersValue of New UsersUber User Value% of Value from Existing users0%$14,733 $15,250 $29,983 49.14%20%$16,412 $20,191 $36,603 44.84%40%$17,834 $24,373 $42,207 42.25%60%$19,040 $27,924 $46,964 40.54%80%$20,068 $30,949 $51,017 39.34%100%$20,947 $33,536 $54,483 38.45%As the proportion of expenses that are fixed rises, the value of both existing and new users goes up but the latter goes up at a faster rate. Put simply, the economies of scale increase as you increase the rate at which you are adding scale.
User Value Proposition 2: A company whose expenses are primarily fixed (will not grow with revenues) will be worth more than an otherwise identical company whose expenses are variable (track revenues).If unchallenged, young growth companies will always claim that they have massive economies of scale but that claim has to be backed up by the numbers. Specifically, investors should pay attention to the rate of change in revenues and expenses, since with large economies of scale, the former should change more than the latter. The caveat, though, is that having more fixed costs can increase risk, because it will increase the risk of failure at young companies and earnings volatility for more mature firms. As user growth levels off, having more fixed costs will reduce value rather than increasing it.
User Economics: Growth Propositions
For young companies, we generally view growth as good and while that is generally true, not all growth is created equal. In fact, even with young companies, there are some strategies that deliver growth in users or revenues, while destroying value. In a user or subscriber based model, there are two ways you can grow your revenues. One is to get existing users to buy more or your products or services and the other is by trying to acquire new users. While both can increase value, the former will be more value incremental, for two reasons. First, since it comes from existing customers, you don’t have to pay to acquire these users and it is thus less costly to the firm. Second, by increasing the value of a user, it increases the value of any new users as well, creating a secondary impact on value. Using by Uber user valuation, you can see the impact of changing the annual growth rate in revenues for an existing user in the chart below: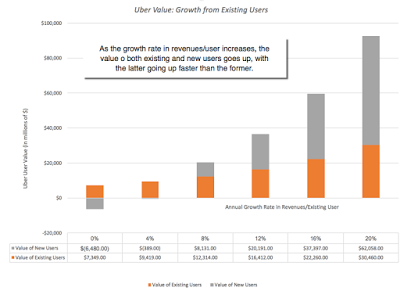 As revenue growth rate increases, the value of both existing and new users increases, with the value of Uber hitting $90 billion at high annual growth rates. If there is no growth in revenues, the value of Uber collapses as new users actually destroy value (because the cost of adding a new user exceeds the value of that user). Now consider how Uber's value is affected, if we hold existing user assumptions fixed and change the compounded annual growth rate (for the next 10 years) in the number of users:
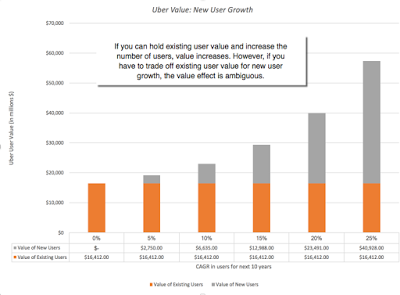 While value increases with user growth rates, it increases at a lower rate than it did when we varied revenue growth from existing users.
User Value Proposition 3: A company that is growing revenues by increasing revenues/user is worth more than an otherwise similar growth company that is deriving growth from increasing the number of users/customers. Young companies face the question of whether to allocate resources to get new users or try to sell more to existing users is one of those. At least in the case of Uber, the numbers seem to indicate that the payoff is greater in getting existing users to use the service more than in looking for new users.
User Economics: Business Propositions
At the risk of stretching the user value model too far, it can be used to discuss business models in the space, from the networking benefits that so many companies in this space claim to possess to how the revenue model you choose (subscription, transaction or advertising) plays out in user values.
1. Competitive Dynamics and Networking BenefitsIs it better to operate in a business where the cost of acquiring a new user is low or high? Holding all else constant, the answer is obvious. A firm will maximize its value if can generate both high value per user and have a low cost of acquiring new users. That said, if everyone in the business shares these characteristics, one or another of these variables has to change. If the cost of acquiring new users is low for everyone, competition will drive down the value per new user, and if the value per user remains high, competition will drive up the cost of acquiring new users. The trade off is captured in the picture below:

User Value Proposition 4: The exceptional firm will be the one that is able to find a pathway to high value per user and a low cost to adding a new user in a market, where its competitors struggle with either low value per user or high costs of acquiring users.
So how do the exceptional companies pull off this seeming impossible combination of high value per user and low cost per new user? I may be stretching, but it is at the heart of two terms that we see increasingly used in business, network benefits and big data.
Network Benefits: If network benefits exist, the cost of acquiring new users will decrease as a company's presence in a market increases, reaching a tipping point where the biggest player will face much lower costs in acquiring new users than the competition, allowing it to capture the market and perhaps use its market dominance to increase the value of each user. In the case of Uber and ride sharing business, the argument for networking benefits is strong on a localized basis, since there are clearly advantages for both drivers and customers to shift to the dominant ride sharing company in any locality, the former because they will generate more income and the latter because they will get better service. The argument is much weaker on a global basis, though ride sharing companies are trying to create networking benefits by allying with airlines and credit care companies, and how this attempt plays out may well determine Uber's ultimate value.Big Data: While I remain a skeptic on the "big data" claims that every company seems to be making today, it is inarguable that there are companies that use big data to augment value. These companies collect data on their existing users/subscribers/customers and use that information to (a) customize existing products/services to meet user preferences, (b) create new products or services that meet perceived user needs and/or (c) for differential pricing. All of these increase user value by altering one or more of the inputs into the equation, with customization increasing user life and new products & differential the growth in revenues/user. In my view, the best users of big data (Netflix, Amazon, Google and Facebook) have used the data to increase their existing user value. Uber is still in the nascent stages, but its attempts at using data have expanded from surge pricing to differential pricing.2. Revenue Models
In my version of user valuation, I look at revenues per user, drawing no distinction on how those revenues are derived. Broadly speaking, there are three revenue models that a user/subscriber based company can use, a subscription-based model where users or subscribers pay a subscription fee to continue to use the service or product, a transaction-based model where users or subscribers pay only when they use the service of product and an advertising-based model where users or subscribers get to use the product or service for free, but are targeted in advertising. Netflix operates on a subscription-based model, Uber is a transaction-based firm and Facebook generates its revenues from advertising. Some companies like LinkedIn have hybrid models, generating revenues from subscriptions (from premium members), transactions (from recruitments) and advertising. There are other inputs into the valuation that will be affected by a company's revenue model and I have tried to capture them in the table below:
table.tableizer-table { font-size: 12px; border: 1px solid #CCC; font-family: Arial, Helvetica, sans-serif; } .tableizer-table td { padding: 4px; margin: 3px; border: 1px solid #CCC; } .tableizer-table th { background-color: #104E8B; color: #FFF; font-weight: bold; }
SubscriptionTransactionAdvertisingUser Stickiness (User life & Renewal Probability)High (High life & renewal probability)Intermediate (Intermediate life & renewal probability)Low (Low life & renewal probability)Revenue per User Predictability (Discount rate)High (Low Discount Rate)Low Predictability (High Discount Rate)Intermediate (Average Discount Rate)Revenue per User Growth (Annual Growth Rate)Low (Low growth rate in revenues/user)Low (High growth rate in revenues/user)Intermediate (Intermediate growth rate in revenues/user)Growth rate in users (CAGR in # Users)Low (Low CAGR in # users)Intermediate (Intermediate CAGR in # users)High (High CAGR in # users)Cost of adding new users (Cost/New User)High (High Cost/New User)Intermediate (Middling Cost/New User)Low (Low Cost/New User)There is no one dominant revenue model, since each has its pluses and minuses. An advertising-based model will allow for much more rapid growth in a firm's early years, a subscription-based model will generate more sustainable growth and a transaction-based model has the greatest potential for revenue growth from existing users.
User Value Proposition 5: The "optimal" revenue model may vary for a firm depending upon where it is in the life cycle and across firms depending on their product or service offerings and across investors, depending on whether they are focused on user growth, revenue growth or revenue sustainability.
3. Real Options
When valuing a company based upon its expected cash flows, there is a chance that you will under value the company, if it has control of a resource that could be used for other purposes in the future, even if that usage makes no economic sense today. That is why a technology or natural resource reserve that is not viable today can still have value, and this is the basis for the real option premium. In the context of a user-based business, optionality can become a component of value, to the extent that companies may be able to exploit their user bases to sell other products and services in the future. While the intuition of real options is simple, valuing real options is notoriously difficult and after much hand waving, most of us (including me) give up, but the user-based valuation model provides a framework to at least eke out some general propositions about optionality and value.
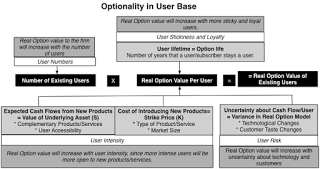 There should be no surprises in this picture, with the value of a real option in a user base tied to the inputs into an option pricing model.
User Value Proposition 6: The value of optionality from a user base will be greatest at firms with lots of sticky, intense users in businesses where the future is unpredictable because of changes in product/service technology and customer tastes.
The Bottom Line
The most direct applications of a user or subscriber based model is in the valuation of companies like Uber, Facebook and Netflix. That said, more and more companies are seeing benefits in shifting from their traditional business models to user-based ones. Apple is a cash machine built around a smartphone but it is also accumulating information on more than a billion users of these phones, to whom it may be able to offer other products and services. Amazon started life as an online retail company but there is no denying the power of its seventy million Prime members in generating revenues for the company. I have used Microsoft and Adobe products for as long as they have been around, but with both companies, but my relationship with both companies has changed. I am now a subscriber (Office 365 and Creative Cloud member) who pays annual fees, rather than a customer who buys and upgrades software on a discretionary basis. Understanding user economics and value is central to not only investors in these companies, when valuing and pricing them, but to managers of these companies, in their day-to-day business decisions. I will admit, without shame, that my knowledge of user-based companies is rudimentary and that my user-based model may be amateurish, in what it misses or mangles. That said, if you are an expert on user-based businesses, I hope that you can build on the model to make it more realistic and useful.
YouTube Video
Links
Crystal Ball (Simulation Add On for Excel)My paper on dealing with uncertainty in valuationAttachments
Uber User Valuation SpreadsheetUber User Value: Simulation OutputBlog PostsUber's Bad Week: Doomsday Scenario or Business Reset (June 2017)User/Subscriber Economics: An Alternative View of Uber's Value
Estimation versus Economic Risk
I will start by conceding the obvious. I made a lot of assumptions to arrive at the value of a user at Uber, but I will go further. There was not a single fact in that valuation, since every number was an estimate. That said, you could say that about the valuation of any company, with the divergence really being one of the degree of uncertainty you face, not in whether it exists. At the risk of restating points that I have made in my other writing, here are three general points that I would make about uncertainty in valuation.
1. Estimation uncertainty versus Economic uncertainty
To deal with uncertainty in a sensible way, you first have to categorize it. One of the categorizations that I find useful is to break the uncertainty you face when you are trying to value a business or an asset into estimation and economic uncertainty. Estimation uncertainty comes from incomplete, missing or misleading information provided by the company that you are valuing, whereas economic uncertainty is driven by forthcoming changes in the business that the company operates in, as well as macro economic factors. Estimation uncertainty can be reduced by obtaining better and more complete information but estimation uncertainty will remain resistant, no matter how time you put in and what data analysis that you do. Using my Uber user valuation, it is true that some of the noise in the valuation comes from Uber being a private, secretive company and but most of the uncertainty comes from the ride sharing business being in a state of flux, as regulators and competitors work out how best to deal with shifting consumer tastes and changing technologies. This has two implications. The first is that even if you had access to more information, either because Uber decides to go public or you are an insider in the company, much of the uncertainty in estimated value per user will remain. The second is that your estimated value will change considerably over time, as the facts on the ground change, and that volatility in value cannot be viewed as a shortcoming of the model.
2. Uncertainty is an integral part of valuation
One critique that leaves me unmoved is that valuing a business or an asset, in the face of significant uncertainty, is pointless because you will be wrong. So what? Uncertainty is part and parcel of doing business and you cannot wish it, pray it or analyze it away. As I see it, you have two choices when it comes to uncertainty. You can deal with it frontally by making explicit assumptions or you can go into "denial" model and make implicit assumptions. When I tried to value a user at Uber, I made explicit assumptions about user life, renewal rates and a host of other variables, and I will cheerfully admit that I will be wrong on every one of them, but what is the alternative? When pricing a user by looking at what others are paying for users in similar companies, you are making assumptions about all of the variables as well, but those assumptions are implicit. In fact, they are hidden so well that you may not be aware of your own assumptions, a dangerous place to be when investing.
3. Uncertainty can (and should) be visualized
Here is my response to uncertainty. Where data exists but I do not have access to that data, I will try to make my best estimates based upon the existing information, noisy, dated or second hand though it might be. Where I have access to data, I will check it against other data, common sense and economic first principles. Where there is no data, I will make my best estimates and to the extent that these estimates come with probability distributions, my value itself is a distribution, not a number. Illustrating this process, with the Uber user valuation:
 Excel Add On: Crystal Ball (Oracle), Simulation OutputI have made distributional assumptions on four of my inputs: the portion of Uber's expenses that go to servicing existing users, the life time of a user, the proportion of expenses that are variable and the cost of capital (discount rate) to compute today's value. Since these distributions are all centered on my base case assumptions, it should come as no surprise that the median value of a user ($414) is very close to my base case value ($410). However, there is a wide spread around that value, with the numbers ranging a low of $74, when the user life is short, the expenses of servicing a use are high, most of the costs are variable and the cost of capital is low, to a high of more than $1000 per user, when the opposite conditions hold. Note that at the current pricing of $69 billion, you are valuing each user close to $900, at the upper end of the distribution.
 User Economics: Cost Propositions
It is true that the end game for every business is to make money for its investors. That said, there is a tendency to over react, when a young company reports a loss, as was the case when Uber reported an operating loss of $2.8 billion for 2016, a few months ago. The pessimists on Uber viewed this as further evidence that the company was on a pathway to nowhere and that investors in the company must be delusional to attach any value to it. The optimists argued that it is natural for young companies to lose money and that Uber should be judged on other dimensions such as user growth and market potential instead. At the risk of angering both groups, I will use my Uber user valuation to argue that while I agree with the second group that losing money is typical at young companies, I will also take sides with the first group that you still need a pathway to profitability amidst the losses, for value to exist.
1. Servicing existing users versus acquiring new users
In my Uber user valuation, I started with the operating losses reported by the company ($2.8 billion), backed into the total operating expenses for the company ($9.3 billion) and then allocated that expense across three categories: servicing existing user (48.17%), acquiring new users (41.08%) and corporate expenses (10.75%). While I based this breakdown on the information (on increase in users and contribution margins in ride sharing) that I had on Uber in 2016, that information is dated, noisy and second hand. It is entirely possible that the actual break down of expenses is different from my estimate. If you are wondering why it matters, since the end result (that Uber lost $2.8 billion) is not changing, there are consequences that you can see in the table below:
Uber User Value: Existing User versus New User Costs table.tableizer-table { font-size: 12px; border: 1px solid #CCC; font-family: Arial, Helvetica, sans-serif; } .tableizer-table td { padding: 4px; margin: 3px; border: 1px solid #CCC; } .tableizer-table th { background-color: #104E8B; color: #FFF; font-weight: bold; }
% of Operating Expenses spent on acquiring new usersValue of Existing UsersValue of New UsersUber User Value% of Value from Existing users0%$6,167 $18,147 $24,314 25.36%20%$10,619 $19,035 $29,654 35.81%40%$15,071 $19,923 $34,994 43.07%60%$19,523 $20,811 $40,334 48.40%80%$23,974 $21,699 $45,673 52.49%100%$28,426 $22,587 $51,013 55.72%
As you increase the proportion of the operating expenses that are spent on acquiring new users, the value of an existing user goes up because you are spending less money on providing service to that user, but the value of a new user also increases, as the net value added (the difference between the user value and the cost of acquiring a user) goes up. Ironically, as you spend more on acquiring new users and less on servicing existing users, the proportion of your value that comes from existing users increases.
User Value Proposition 1: A money-losing company that is losing money providing service to existing users/customers is worth less than a company with equivalent losses, where the primary expenses are coming from customer acquisitions.This is, of course, neither profound nor surprising, and it explains why, left to their own devices and without any monitoring, young companies will claim that most or all of their expenses are for acquiring new customers. If you are investing in a young company, you will have to do your own assessment of whether managers are misrepresenting, by looking at expense growth over time versus new customers. If the number of total customers remains fixed and expenses keep rising, you should be skeptical about managerial claims (that most of the costs are for acquiring new customers).
2. Cost Structure
One reason that investors are willing to accept losses at young companies is because they believe that as the company grows its operations, there will be economies of scale. In income statement terms, this will result in expenses growing less quickly than revenues and improving operating margins. That said, you cannot take it on faith that this will always happen or that it will happen at the same rate for every company. To see the impact on user value of this dimension, I adjusted the portion of Uber's expenses that are variable (and will grow with revenues) and those that are fixed (and grow at a lower rate) and captured the value effect in this table:
Uber User Value and Cost Structure table.tableizer-table { font-size: 12px; border: 1px solid #CCC; font-family: Arial, Helvetica, sans-serif; } .tableizer-table td { padding: 4px; margin: 3px; border: 1px solid #CCC; } .tableizer-table th { background-color: #104E8B; color: #FFF; font-weight: bold; }
% of current expenses that are fixedValue of Existing UsersValue of New UsersUber User Value% of Value from Existing users0%$14,733 $15,250 $29,983 49.14%20%$16,412 $20,191 $36,603 44.84%40%$17,834 $24,373 $42,207 42.25%60%$19,040 $27,924 $46,964 40.54%80%$20,068 $30,949 $51,017 39.34%100%$20,947 $33,536 $54,483 38.45%As the proportion of expenses that are fixed rises, the value of both existing and new users goes up but the latter goes up at a faster rate. Put simply, the economies of scale increase as you increase the rate at which you are adding scale.
User Value Proposition 2: A company whose expenses are primarily fixed (will not grow with revenues) will be worth more than an otherwise identical company whose expenses are variable (track revenues).If unchallenged, young growth companies will always claim that they have massive economies of scale but that claim has to be backed up by the numbers. Specifically, investors should pay attention to the rate of change in revenues and expenses, since with large economies of scale, the former should change more than the latter. The caveat, though, is that having more fixed costs can increase risk, because it will increase the risk of failure at young companies and earnings volatility for more mature firms. As user growth levels off, having more fixed costs will reduce value rather than increasing it.
User Economics: Growth Propositions
For young companies, we generally view growth as good and while that is generally true, not all growth is created equal. In fact, even with young companies, there are some strategies that deliver growth in users or revenues, while destroying value. In a user or subscriber based model, there are two ways you can grow your revenues. One is to get existing users to buy more or your products or services and the other is by trying to acquire new users. While both can increase value, the former will be more value incremental, for two reasons. First, since it comes from existing customers, you don’t have to pay to acquire these users and it is thus less costly to the firm. Second, by increasing the value of a user, it increases the value of any new users as well, creating a secondary impact on value. Using by Uber user valuation, you can see the impact of changing the annual growth rate in revenues for an existing user in the chart below:
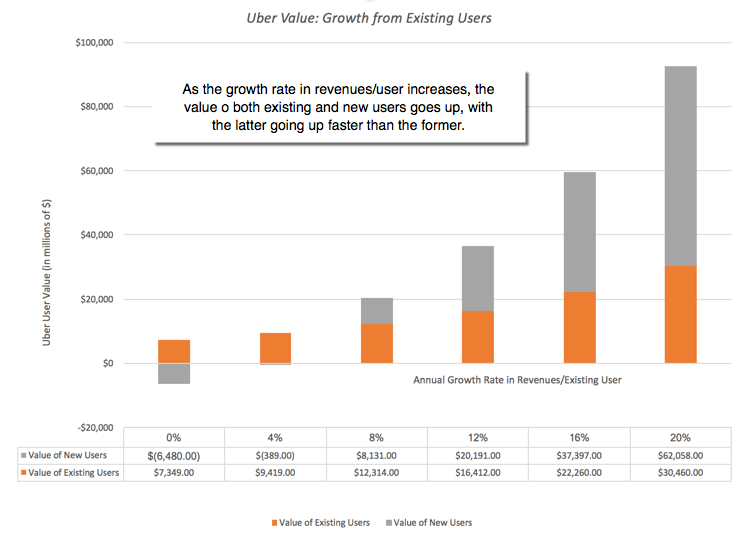 As revenue growth rate increases, the value of both existing and new users increases, with the value of Uber hitting $90 billion at high annual growth rates. If there is no growth in revenues, the value of Uber collapses as new users actually destroy value (because the cost of adding a new user exceeds the value of that user). Now consider how Uber's value is affected, if we hold existing user assumptions fixed and change the compounded annual growth rate (for the next 10 years) in the number of users:
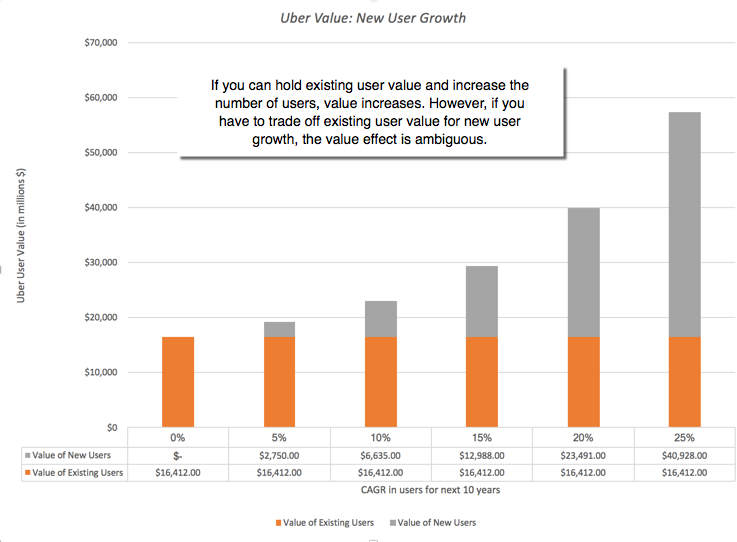 While value increases with user growth rates, it increases at a lower rate than it did when we varied revenue growth from existing users.
User Value Proposition 3: A company that is growing revenues by increasing revenues/user is worth more than an otherwise similar growth company that is deriving growth from increasing the number of users/customers. Young companies face the question of whether to allocate resources to get new users or try to sell more to existing users is one of those. At least in the case of Uber, the numbers seem to indicate that the payoff is greater in getting existing users to use the service more than in looking for new users.
User Economics: Business Propositions
At the risk of stretching the user value model too far, it can be used to discuss business models in the space, from the networking benefits that so many companies in this space claim to possess to how the revenue model you choose (subscription, transaction or advertising) plays out in user values.
1. Competitive Dynamics and Networking BenefitsIs it better to operate in a business where the cost of acquiring a new user is low or high? Holding all else constant, the answer is obvious. A firm will maximize its value if can generate both high value per user and have a low cost of acquiring new users. That said, if everyone in the business shares these characteristics, one or another of these variables has to change. If the cost of acquiring new users is low for everyone, competition will drive down the value per new user, and if the value per user remains high, competition will drive up the cost of acquiring new users. The trade off is captured in the picture below:
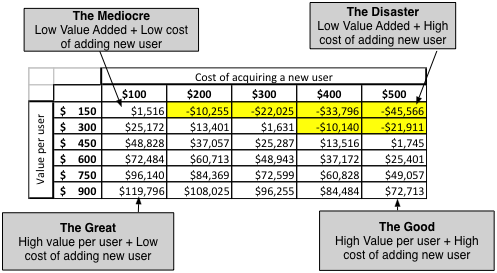
User Value Proposition 4: The exceptional firm will be the one that is able to find a pathway to high value per user and a low cost to adding a new user in a market, where its competitors struggle with either low value per user or high costs of acquiring users.
So how do the exceptional companies pull off this seeming impossible combination of high value per user and low cost per new user? I may be stretching, but it is at the heart of two terms that we see increasingly used in business, network benefits and big data.
Network Benefits: If network benefits exist, the cost of acquiring new users will decrease as a company's presence in a market increases, reaching a tipping point where the biggest player will face much lower costs in acquiring new users than the competition, allowing it to capture the market and perhaps use its market dominance to increase the value of each user. In the case of Uber and ride sharing business, the argument for networking benefits is strong on a localized basis, since there are clearly advantages for both drivers and customers to shift to the dominant ride sharing company in any locality, the former because they will generate more income and the latter because they will get better service. The argument is much weaker on a global basis, though ride sharing companies are trying to create networking benefits by allying with airlines and credit care companies, and how this attempt plays out may well determine Uber's ultimate value.Big Data: While I remain a skeptic on the "big data" claims that every company seems to be making today, it is inarguable that there are companies that use big data to augment value. These companies collect data on their existing users/subscribers/customers and use that information to (a) customize existing products/services to meet user preferences, (b) create new products or services that meet perceived user needs and/or (c) for differential pricing. All of these increase user value by altering one or more of the inputs into the equation, with customization increasing user life and new products & differential the growth in revenues/user. In my view, the best users of big data (Netflix, Amazon, Google and Facebook) have used the data to increase their existing user value. Uber is still in the nascent stages, but its attempts at using data have expanded from surge pricing to differential pricing.2. Revenue Models
In my version of user valuation, I look at revenues per user, drawing no distinction on how those revenues are derived. Broadly speaking, there are three revenue models that a user/subscriber based company can use, a subscription-based model where users or subscribers pay a subscription fee to continue to use the service or product, a transaction-based model where users or subscribers pay only when they use the service of product and an advertising-based model where users or subscribers get to use the product or service for free, but are targeted in advertising. Netflix operates on a subscription-based model, Uber is a transaction-based firm and Facebook generates its revenues from advertising. Some companies like LinkedIn have hybrid models, generating revenues from subscriptions (from premium members), transactions (from recruitments) and advertising. There are other inputs into the valuation that will be affected by a company's revenue model and I have tried to capture them in the table below:
table.tableizer-table { font-size: 12px; border: 1px solid #CCC; font-family: Arial, Helvetica, sans-serif; } .tableizer-table td { padding: 4px; margin: 3px; border: 1px solid #CCC; } .tableizer-table th { background-color: #104E8B; color: #FFF; font-weight: bold; }
SubscriptionTransactionAdvertisingUser Stickiness (User life & Renewal Probability)High (High life & renewal probability)Intermediate (Intermediate life & renewal probability)Low (Low life & renewal probability)Revenue per User Predictability (Discount rate)High (Low Discount Rate)Low Predictability (High Discount Rate)Intermediate (Average Discount Rate)Revenue per User Growth (Annual Growth Rate)Low (Low growth rate in revenues/user)Low (High growth rate in revenues/user)Intermediate (Intermediate growth rate in revenues/user)Growth rate in users (CAGR in # Users)Low (Low CAGR in # users)Intermediate (Intermediate CAGR in # users)High (High CAGR in # users)Cost of adding new users (Cost/New User)High (High Cost/New User)Intermediate (Middling Cost/New User)Low (Low Cost/New User)There is no one dominant revenue model, since each has its pluses and minuses. An advertising-based model will allow for much more rapid growth in a firm's early years, a subscription-based model will generate more sustainable growth and a transaction-based model has the greatest potential for revenue growth from existing users.
User Value Proposition 5: The "optimal" revenue model may vary for a firm depending upon where it is in the life cycle and across firms depending on their product or service offerings and across investors, depending on whether they are focused on user growth, revenue growth or revenue sustainability.
3. Real Options
When valuing a company based upon its expected cash flows, there is a chance that you will under value the company, if it has control of a resource that could be used for other purposes in the future, even if that usage makes no economic sense today. That is why a technology or natural resource reserve that is not viable today can still have value, and this is the basis for the real option premium. In the context of a user-based business, optionality can become a component of value, to the extent that companies may be able to exploit their user bases to sell other products and services in the future. While the intuition of real options is simple, valuing real options is notoriously difficult and after much hand waving, most of us (including me) give up, but the user-based valuation model provides a framework to at least eke out some general propositions about optionality and value.
 There should be no surprises in this picture, with the value of a real option in a user base tied to the inputs into an option pricing model.
User Value Proposition 6: The value of optionality from a user base will be greatest at firms with lots of sticky, intense users in businesses where the future is unpredictable because of changes in product/service technology and customer tastes.
The Bottom Line
The most direct applications of a user or subscriber based model is in the valuation of companies like Uber, Facebook and Netflix. That said, more and more companies are seeing benefits in shifting from their traditional business models to user-based ones. Apple is a cash machine built around a smartphone but it is also accumulating information on more than a billion users of these phones, to whom it may be able to offer other products and services. Amazon started life as an online retail company but there is no denying the power of its seventy million Prime members in generating revenues for the company. I have used Microsoft and Adobe products for as long as they have been around, but with both companies, but my relationship with both companies has changed. I am now a subscriber (Office 365 and Creative Cloud member) who pays annual fees, rather than a customer who buys and upgrades software on a discretionary basis. Understanding user economics and value is central to not only investors in these companies, when valuing and pricing them, but to managers of these companies, in their day-to-day business decisions. I will admit, without shame, that my knowledge of user-based companies is rudimentary and that my user-based model may be amateurish, in what it misses or mangles. That said, if you are an expert on user-based businesses, I hope that you can build on the model to make it more realistic and useful.
YouTube Video
Links
Crystal Ball (Simulation Add On for Excel)My paper on dealing with uncertainty in valuationAttachments
Uber User Valuation SpreadsheetUber User Value: Simulation OutputBlog PostsUber's Bad Week: Doomsday Scenario or Business Reset (June 2017)User/Subscriber Economics: An Alternative View of Uber's Value
June 28, 2017
User/Subscriber Economics: An Alternative View of Uber's Value
In the week since I posted my Uber valuation, I have received many suggestions on what I should have done differently in the valuation, with many of you arguing that I was being a over optimistic in my forecasts of total market, market share and margin improvements and some of you positing that I was too pessimistic. I don't claim to have any certitude about these numbers but the spreadsheet that I used to value Uber is an open one, and you are welcome to convert your suggestions into valuation inputs and make the valuation your own. In just the last few days, though, I have been watching an argument unfold among people that I respect. about whether the reason for my low valuation for Uber is that I am using a DCF model, with the critics making the case that valuing a company based upon its expected cash flows is an old economy framework that will not yield a reasonable estimate of value for new economy companies, driven less by infrastructure investments and returns on those investments, and more by user and subscriber economics. I have long argued that DCF models are much more flexible than most people give them credit for, and that they can be modified to reflect other frameworks. So, rather than deflect the criticism, I will try to build a user based model to value Uber and contrast with my conventional valuation.
Aggregated versus Disaggregated Valuation
If you are doing an intrinsic valuation, the principle that the value of a business is the present value of the expected cash flows from that business, with the discount rate adjusted for risk, cannot be contested. That is true for any business, manufacturing or service, small or large, old economy or new economy. Since that is what a discounted cash flow valuation is designed to do, I have to believe that what critics find objectionable in my Uber DCF model is not with the model itself but in how I estimated the cash flows for Uber, and adjusted for risk. I followed the aggregated model for discounted cash flow valuation where I estimated the cash flows to Uber as a company, starting with its revenues and working through the consolidated expenses and total reinvestment each year and discounted these cash flows at a cost of capital that I estimated for the entire company. Along the way, I had to make assumptions about a total market that Uber would go after, the market share that I expect the company to get in that market and the operating margins in steady state.
Disaggregated ValuationValue is additive and you can value any company on a disaggregated basis, breaking it down into different divisions/businesses, geographical areas or by units:Business Units: In a sum of the parts valuation (SOTP), you can break a multi-business company into its individual business units and value each unit separately. I have a paper where I describe the process of doing a SOTP valuation, using United Technologies, a conglomerate, as my example. If that SOTP valuation is much higher than the value that the market attaches to the company, you may very well find an activist investor targeting the company for a break up. Geographical Groupings: When valuing a multinational, you can break the company's operations down geographically and value each geographical grouping (Asia, Latin America, North America, Europe) separately, not only using different assumptions about growth and risk in region but even different currencies for each region. Unit-based Valuation: More generally, when valuing any company, you can try to value it on a unit-basis, building up to its value by valuing each unit separately and then aggregating across units. Thus, a pharmaceutical company can be valued by taking each of the drugs that are in its portfolio, including those in the pipeline, and valuing that drug based upon its cash flows and risk and then adding up the values across the entire portfolio. A retail business can be valued by valuing individual stores and adding up the store values and a subscription-based company can be valuing by valuing a subscription and multiplying by the number of subscriptions, current and forecasted.I may be misreading the critics of my Uber valuation but it seems to me that some of them, at least are making the argument it is better to value Uber, by valuing an individual Uber user first, and then scaling the value up to reflect not just the number of users that Uber has today (existing users) but also new users it expects to add in the future.
Aggregated versus Disaggregated Valuations: Weighing the Trade offsValuation on a disaggregated basis allows you to be much more flexible in your assumptions, allowing them to vary across each grouping but there are four reasons why you seldom see them practiced (or at least practiced well) in company valuation.Law of large numbers: As companies get larger and more diverse, there is an argument to be made that you are better off estimating on an aggregated basis rather than a disaggregated one. The reason is statistical. To the extent that your estimation errors on a unit basis are uncorrelated or lightly correlated, your estimates on an aggregated level will be more precise than the unit-based estimates. For example, you will have a much better chance of estimating the aggregate revenues for Pfizer correctly than you do of estimating the revenues of each of its dozens of drugs.Information Vacuums: Information on a disaggregated basis is difficult to get for individual businesses, geographies, products or users, if you are an investor looking at a company from the outside. If you are doing your valuation from inside the company (as an owner or venture capitalist), you may be able to get this information, but as you will see with my Uber user valuation, even insiders will face limits.Missing Value Pieces: When valuing a company on a disaggregated business, it is easy to overlook some items that are consequential for value. In sum of the parts valuation, for instance, analysts are so caught up in estimating the values of individual businesses that they sometimes forget to value "corporate costs", which can be a multi-billion drag on value. Corporate Structure: There are some items that are easier to deal with at the aggregate level, because that is where they affect the business. Thus, you can model when taxes come due and the effect of losses easier when you are valuing an aggregated business than when you are valuing it on a disaggregated level. Similarly, if you are concerned about legal penalties or corporate governance, these are better addressed at the aggregated level.It is true that aggregation comes with costs, starting with the blurring of differences across disaggregated units (business, geographies, products, users) as well as the missing of competitive advantages that apply only to some units of the business and not to others. It is also true that using an aggregated valuation can result in a process that is disconnected from how the owners and managers at user-based companies think about their companies and thus cannot help them in managing these companies or valuing them better.
User Based Valuation
Now that we have laid out the pluses and minuses of aggregated versus disaggregated valuation, let us think about how you would construct a disaggregated valuation of a company that derives its value from users or subscribers. In general, the value of such a company can be written as the sum of three components:
Value of user-based company = Value of existing users + Value added by new users - Value drag from corporate expenses
1. Valuing Existing Users
The key step in a user-based valuation is estimating the value of a user and that value is a function of many variables: the cash flows that you are currently generating from a typical user, the length of time you expect that user to use your product or service, your expectations of how much growth you can expect in cash flows from a user over time and the uncertainty that you feel about all of these judgments:
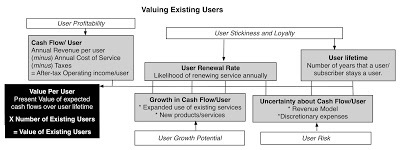
Consider the implications that emerge from this simple framework:
The value of a user increases with user stickiness and loyalty (captured in the expected lifetime of a user and the annual renewal rate).The value of a user is directly proportional to the profitability of that user (captured as the difference between the revenues from that user and the cost of servicing that user). The value of a user is directly proportional to the growth that you can generate in profits over time, by either getting the user to use more of your product or service or coming up with other products or services that you can sell that user. The value of a user decreases as you become more uncertain about future cash flows from that user, with that uncertainty being a function of the revenue model that you use and the discretionary nature of the product or service. A subscription-based model, where users agree to pay a fixed amount every period, will generally be less risky and more valuable than a transaction-based model or an advertising-based model, that delivers the same cash flows. A product or service that delivers a necessity (transportation) is less risky than one that meets a more discretionary need (travel). If you can value a user, you can then estimate the value of an existing user base, by multiplying the value/user by the number of existing users. If you have multiple types of users, with perhaps different revenue models for each, as is the case with LinkedIn's premium and regular members, you can value each user group separately.
Value Added by New Users
The second segment of value is the value added by new users that you expect to see added in the future. To estimate this value, you can start with the value per user from the last section but you have to net out the cost of acquiring a new user, which can take the form of advertising, introductory discounts and/or infrastructure investments to enter new markets. That net value added by a new user (value per user minus cost of acquiring a user) then has to be multiplied by the number of new users that you expect to add each period and brought back to the present, adjusting for both the risk in the cash flows and the time value of money.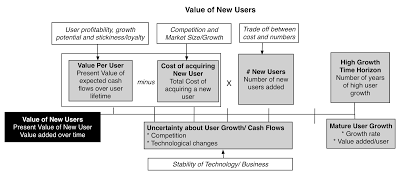
Again, I will agree that this is simplistic but consider the common sense implications:The value added by a new user increases with the value of a user, estimated in the last section. A strategy of going for fewer and more intense users may create more value than one with more and less engaged users, a warning that pursuing user growth at any cost can be dangerous for value.The value added by a new user decreases as the cost of adding users increases. That cost will be a function of the competitiveness of the business (increasing as competition increases) but also of networking effects. If you have strong networking effects, the cost of adding new users will decrease as you accumulate new users, thus creating a value accelerator for your business.The value added by a new user decreases as you become more uncertain about user growth. That uncertainty will be a function of competition and whether the technology that you have built your product or service on is sustainable.Corporate Expenses and Value
To get from user value to the value of the business, you have to bring in the rest of the company into your analysis. To the extent that you have expenses that are unrelated to servicing existing users or adding new ones, i.e., corporate expenses, for lack of a better term, you have to compute the value of these expenses over time and reduce your value as a company by this amount:

While at first sight, this item may look like wasteful that should be eliminated, it represents both a danger and an opportunity for young companies. It is a danger to the extent that bloated corporate expenses can drag a company's value down, but it can be an opportunity insofar as it is at the basis of economies of scale. If corporate expenses represent necessary expenses to keep a business going, and they grow at a rate much lower than the growth rate in users and revenues, you will see margins improve quickly as a company scales up.
Valuing Uber: A User based Model
Can Uber be valued using a user-based model? Yes, but it will require assumptions about users that are, at best, tentative and at worst, based upon little information. While I will attempt with the limited information that I have on Uber to do a user-based valuation, I will leave it to someone who has access to more information than I do (a VC invested in Uber or an Uber manager) to tweak the numbers to get better estimates of value.
Deconstructing the Financials
The numbers that we have on Uber's operations are minimalist, reflecting both its standing as a private company and its general secretiveness. In 2016, according to the financials that Uber provided to a Bloomberg reported, Uber reported $20 billion in gross billings, $6.5 billion in net revenues (counting all revenues from UberPool) and a loss of $2.8 billion (not counting the $1 billion loss on the China operations). According to other reports, Uber had about 40 million users at the end of 2016, up from 24 million users at the end of 2015. Finally, other (dated) reports suggest Uber's contribution margins (revenues minus variable costs) in its most profitable cities ranges from 3-11% of gross billings and its contribution margin in San Francisco, its longest standing and most mature market, is 10.1%. Bringing in these noisy and diverse estimates together, here are my estimates of user statistics:
These numbers are stitched together from diverse sources and vary in reliability, but based upon my judgments, I break down Uber's operating expenses in 2016 into three categories: to service existing users (48.17%), to get new users (41.08%) and corporate expenses (10.75%); the last estimate is a shot in the dark, since there is no information available on the value. The annual profit from an existing user, based on 2016 numbers, is about $50.50 (Net Revenues - Expense/user) and the cost of adding a new user is about $238/75, and both will be key inputs in my valuation.
Valuing Existing UsersTo value Uber's existing users, I use the framework developed in the last section, in conjunction with the estimates that I obtained from the limited financial information provided by Uber. I valued existing users, assuming four additional parameters: a lifetime of 15 years for users, an annual renewal likelihood of 95%, a compounded growth rate of 12% in annual revenues from users expanding their user of Uber services and a growth rate of 9.9% a year in annual user servicing expenses (on the assumption that 80% of the servicing cost is variable). Assuming a cost of capital of 10% (in the 75th percentile of US firms), the resulting value per user and the overall value of existing users is shown below:
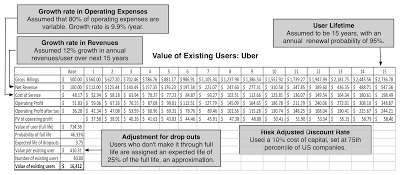 Download spreadsheetThe value per existing user is about $410 and the overall value of Uber's 40 million existing users is $16,412 million. Not surprisingly, this value is sensitive to user stickiness (as measured by user lifetime) and user growth potential (as measured by the growth rate in annual revenues):
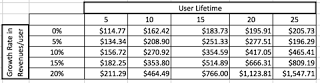 In a market where investors swoon at user numbers, this table makes an obvious point. Not all users are created equal, with more intense, sticky users being worth a great deal more than transient, switching users.
Value Added by New UsersTo estimate the value added by new users, I start with the value per user (estimated in the last section to be $410), which I grow at the inflation rate to get expected value per user over time, and use the cost of acquiring a new user from 2016 (about $240/user). Assuming a growth rate of 25% a year for the next five years, 10% between years six and ten and overall economic growth after year ten, I estimate the value added by new users over time. (With those growth rates, I more than quadruple the number of users over the next ten years to 164 million.) In coming up with value, I assume that new user growth is more uncertain than the value created by existing users, and use a 12% cost of capital (at the 90th percentile of US firms) to get today's value.
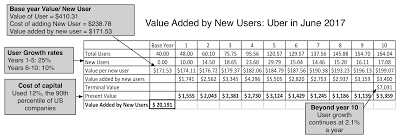 Download spreadsheetThe value added by new users, based upon my estimates, is $20,191 million. That value is sensitive to the net value created by each new user (value of a new user minus the cost of adding a new user) and the growth rate in the number of users:
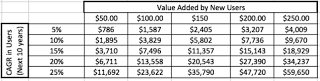 This table illustrates the point made earlier about how some companies will be better off trading off higher value added per user for lower user growth, since there are clearly lower growth/ higher value added scenarios that dominate higher growth/lower value added scenarios in terms of value creation.
Corporate Expenses and overall ValueThe final loose end is the corporate expense component, a number that I estimated (arbitrarily) to be $1 billion in 2016. Allowing for the tax savings that these expenses will generate and assuming a 4% compounded growth rate, well below the 15.16% compounded growth rate in total users, I estimate a value for these corporate expenses (using the 10% cost of capital that I used for existing users):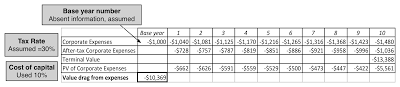 Download spreadsheetThe value drag created by corporate expenses is about $10,369 million. Bringing together all three components, we get a value for Uber's operations of $26.2 billion
Value of Uber's Operating Assets:
= Value of Existing Users+ Value added by New Users - Value drag from corporate expenses
= $16.4 billion + $20.2 billion + $10.4 billion = $26.2 billion
Adding the cash balance ($5 billion) and the holding in Didi Chuxing (estimate value of $6 billion) results in an overall value of equity of $37.2 billion for the company (and its equity, since it has no debt):
Value of Uber Equity = Value of Operating Assets + Cash - Debt = $26.2 + $5.0 + $6.0 = $37.2 billionThis is close to the value that I obtained for Uber on an aggregated basis, but that is a reflection of my understanding of the company's economics.
Pricing versus Valuing UsersAs you can see, valuing users requires assumptions about users that can be difficult to make. So, how do venture capitalists and other early stage investors come up with per user or per subscriber numbers? The answer is that they do not. Drawing on an earlier post that I had on how venture capitalists play the pricing game, venture capitalists price users, rather than value them. What does that involve? Very simply put, the price per user at Uber, given its most recent pricing of $69 billion and the estimated 40 million users is $1,725/user ($69,000/40). To make a judgment on whether that number is a high or a low number, you would compare that price to what you the market is pricing a user at Lyft or Didi Chuxing and if naive, argue that the lower the price per user, the cheaper the company. Using the most recent estimates of pricing and users for the five big ride sharing companies, here is what we get: table.tableizer-table { font-size: 12px; border: 1px solid #CCC; font-family: Arial, Helvetica, sans-serif; } .tableizer-table td { padding: 4px; margin: 3px; border: 1px solid #CCC; } .tableizer-table th { background-color: #104E8B; color: #FFF; font-weight: bold; }
CompanyMost Recent Pricing (in $ millions)# Users (in millions)Price/UserUber$69,00040.00$1,725.00Lyft$7,5005.00$1,500.00Didi Chuxing$50,000250.00$200.00Ola$3,00010.00$300.00GrabTaxi$4,2003.80$1,105.26If you follow the user valuation in the last section, you can see why this pricing comparison can be dangerous. The aggregate pricing that you get for individual companies reflects not only existing users but also new users, and dividing by the existing users will give you much higher numbers for companies that expect to grow their user base more. Even if every company is correctly priced, you should expect to see users at companies with less cash flows per user, lower user growth, less intense and loyal users and more uncertainty about future cash flows to be priced much lower than at companies with intense and sticky users, with more growth potential.
The Bottom LineIf your argument against using discounted cash flow valuation (at least in the aggregated form that it is usually done) is that you have to make a lot of assumptions, I hope that this process of valuing users brings home the reality that you cannot escape having to make those assumptions. In fact, the assumptions that you need to make to value a company on a disaggregated basis (based on users or subscribers) are often more involved and complex than the ones that you have to make in an aggregated valuation. That said, I do agree that looking at value on a disaggregated basis can not only give you insights about value drivers but also about questions that you would want to ask (and get answered) if you are thinking about investing in or building a young company whose value is coming from its user or subscriber base.
YouTube Video
AttachmentsUber User-based ValuationUber aggregated DCFPrevious Posts on UberA Disruptive Cab Ride to Riches (June 2014)Possible, Plausible and Probable: Big Markets and Networking Effects (July 2014)Up, Up and Away: A Crowd Valuation of Uber (December 2014)On the Uber Rollercoaster: Narrative Tweaks, Twists and Turns (October 2015)The Ride Sharing Business: Is a Bar Mitzvah moment coming? (August 2016)Uber's Bad Week: Doomsday Scenario or Business Reset (June 2017)
Aggregated versus Disaggregated Valuation
If you are doing an intrinsic valuation, the principle that the value of a business is the present value of the expected cash flows from that business, with the discount rate adjusted for risk, cannot be contested. That is true for any business, manufacturing or service, small or large, old economy or new economy. Since that is what a discounted cash flow valuation is designed to do, I have to believe that what critics find objectionable in my Uber DCF model is not with the model itself but in how I estimated the cash flows for Uber, and adjusted for risk. I followed the aggregated model for discounted cash flow valuation where I estimated the cash flows to Uber as a company, starting with its revenues and working through the consolidated expenses and total reinvestment each year and discounted these cash flows at a cost of capital that I estimated for the entire company. Along the way, I had to make assumptions about a total market that Uber would go after, the market share that I expect the company to get in that market and the operating margins in steady state.
Disaggregated ValuationValue is additive and you can value any company on a disaggregated basis, breaking it down into different divisions/businesses, geographical areas or by units:Business Units: In a sum of the parts valuation (SOTP), you can break a multi-business company into its individual business units and value each unit separately. I have a paper where I describe the process of doing a SOTP valuation, using United Technologies, a conglomerate, as my example. If that SOTP valuation is much higher than the value that the market attaches to the company, you may very well find an activist investor targeting the company for a break up. Geographical Groupings: When valuing a multinational, you can break the company's operations down geographically and value each geographical grouping (Asia, Latin America, North America, Europe) separately, not only using different assumptions about growth and risk in region but even different currencies for each region. Unit-based Valuation: More generally, when valuing any company, you can try to value it on a unit-basis, building up to its value by valuing each unit separately and then aggregating across units. Thus, a pharmaceutical company can be valued by taking each of the drugs that are in its portfolio, including those in the pipeline, and valuing that drug based upon its cash flows and risk and then adding up the values across the entire portfolio. A retail business can be valued by valuing individual stores and adding up the store values and a subscription-based company can be valuing by valuing a subscription and multiplying by the number of subscriptions, current and forecasted.I may be misreading the critics of my Uber valuation but it seems to me that some of them, at least are making the argument it is better to value Uber, by valuing an individual Uber user first, and then scaling the value up to reflect not just the number of users that Uber has today (existing users) but also new users it expects to add in the future.
Aggregated versus Disaggregated Valuations: Weighing the Trade offsValuation on a disaggregated basis allows you to be much more flexible in your assumptions, allowing them to vary across each grouping but there are four reasons why you seldom see them practiced (or at least practiced well) in company valuation.Law of large numbers: As companies get larger and more diverse, there is an argument to be made that you are better off estimating on an aggregated basis rather than a disaggregated one. The reason is statistical. To the extent that your estimation errors on a unit basis are uncorrelated or lightly correlated, your estimates on an aggregated level will be more precise than the unit-based estimates. For example, you will have a much better chance of estimating the aggregate revenues for Pfizer correctly than you do of estimating the revenues of each of its dozens of drugs.Information Vacuums: Information on a disaggregated basis is difficult to get for individual businesses, geographies, products or users, if you are an investor looking at a company from the outside. If you are doing your valuation from inside the company (as an owner or venture capitalist), you may be able to get this information, but as you will see with my Uber user valuation, even insiders will face limits.Missing Value Pieces: When valuing a company on a disaggregated business, it is easy to overlook some items that are consequential for value. In sum of the parts valuation, for instance, analysts are so caught up in estimating the values of individual businesses that they sometimes forget to value "corporate costs", which can be a multi-billion drag on value. Corporate Structure: There are some items that are easier to deal with at the aggregate level, because that is where they affect the business. Thus, you can model when taxes come due and the effect of losses easier when you are valuing an aggregated business than when you are valuing it on a disaggregated level. Similarly, if you are concerned about legal penalties or corporate governance, these are better addressed at the aggregated level.It is true that aggregation comes with costs, starting with the blurring of differences across disaggregated units (business, geographies, products, users) as well as the missing of competitive advantages that apply only to some units of the business and not to others. It is also true that using an aggregated valuation can result in a process that is disconnected from how the owners and managers at user-based companies think about their companies and thus cannot help them in managing these companies or valuing them better.
User Based Valuation
Now that we have laid out the pluses and minuses of aggregated versus disaggregated valuation, let us think about how you would construct a disaggregated valuation of a company that derives its value from users or subscribers. In general, the value of such a company can be written as the sum of three components:
Value of user-based company = Value of existing users + Value added by new users - Value drag from corporate expenses
1. Valuing Existing Users
The key step in a user-based valuation is estimating the value of a user and that value is a function of many variables: the cash flows that you are currently generating from a typical user, the length of time you expect that user to use your product or service, your expectations of how much growth you can expect in cash flows from a user over time and the uncertainty that you feel about all of these judgments:

Consider the implications that emerge from this simple framework:
The value of a user increases with user stickiness and loyalty (captured in the expected lifetime of a user and the annual renewal rate).The value of a user is directly proportional to the profitability of that user (captured as the difference between the revenues from that user and the cost of servicing that user). The value of a user is directly proportional to the growth that you can generate in profits over time, by either getting the user to use more of your product or service or coming up with other products or services that you can sell that user. The value of a user decreases as you become more uncertain about future cash flows from that user, with that uncertainty being a function of the revenue model that you use and the discretionary nature of the product or service. A subscription-based model, where users agree to pay a fixed amount every period, will generally be less risky and more valuable than a transaction-based model or an advertising-based model, that delivers the same cash flows. A product or service that delivers a necessity (transportation) is less risky than one that meets a more discretionary need (travel). If you can value a user, you can then estimate the value of an existing user base, by multiplying the value/user by the number of existing users. If you have multiple types of users, with perhaps different revenue models for each, as is the case with LinkedIn's premium and regular members, you can value each user group separately.
Value Added by New Users
The second segment of value is the value added by new users that you expect to see added in the future. To estimate this value, you can start with the value per user from the last section but you have to net out the cost of acquiring a new user, which can take the form of advertising, introductory discounts and/or infrastructure investments to enter new markets. That net value added by a new user (value per user minus cost of acquiring a user) then has to be multiplied by the number of new users that you expect to add each period and brought back to the present, adjusting for both the risk in the cash flows and the time value of money.
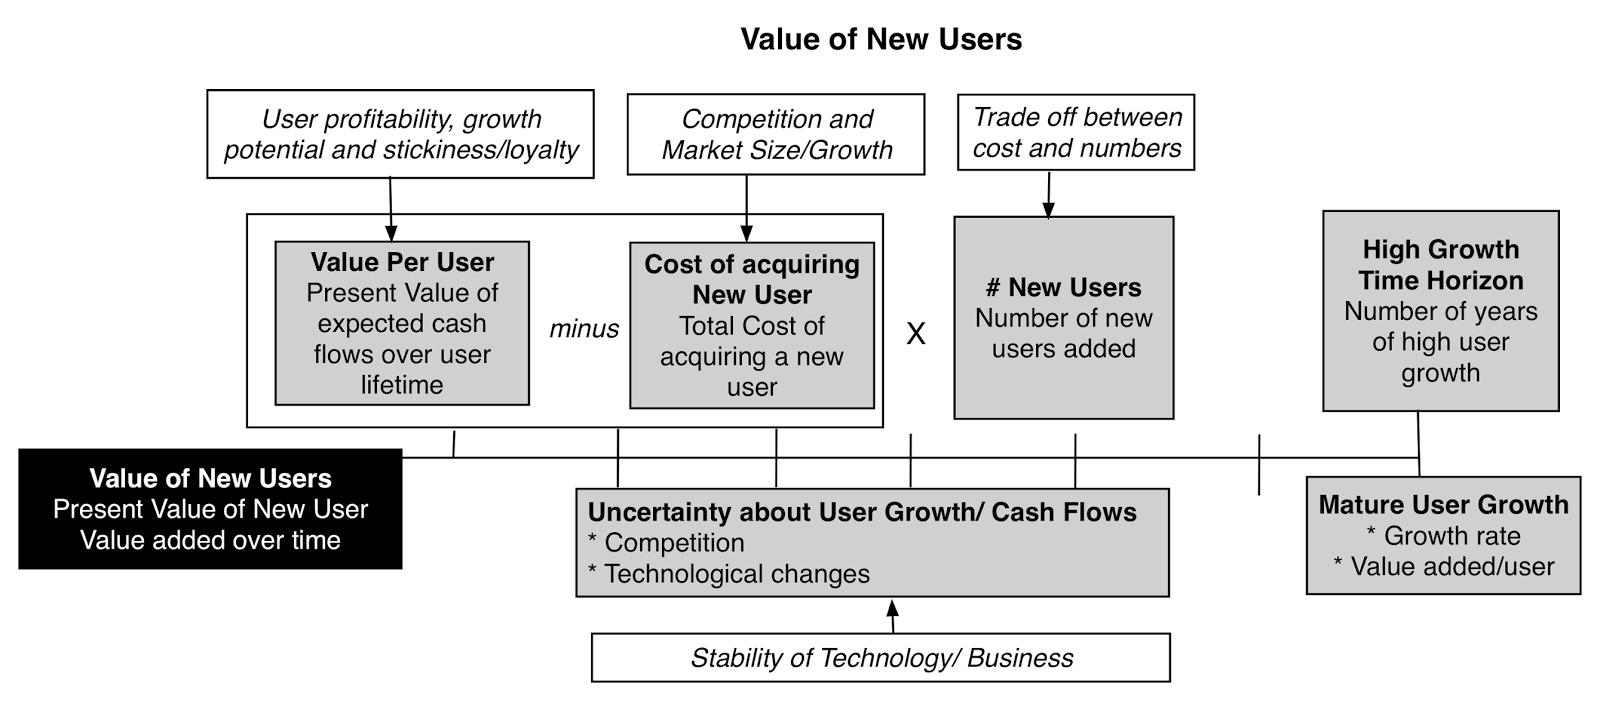
Again, I will agree that this is simplistic but consider the common sense implications:The value added by a new user increases with the value of a user, estimated in the last section. A strategy of going for fewer and more intense users may create more value than one with more and less engaged users, a warning that pursuing user growth at any cost can be dangerous for value.The value added by a new user decreases as the cost of adding users increases. That cost will be a function of the competitiveness of the business (increasing as competition increases) but also of networking effects. If you have strong networking effects, the cost of adding new users will decrease as you accumulate new users, thus creating a value accelerator for your business.The value added by a new user decreases as you become more uncertain about user growth. That uncertainty will be a function of competition and whether the technology that you have built your product or service on is sustainable.Corporate Expenses and Value
To get from user value to the value of the business, you have to bring in the rest of the company into your analysis. To the extent that you have expenses that are unrelated to servicing existing users or adding new ones, i.e., corporate expenses, for lack of a better term, you have to compute the value of these expenses over time and reduce your value as a company by this amount:
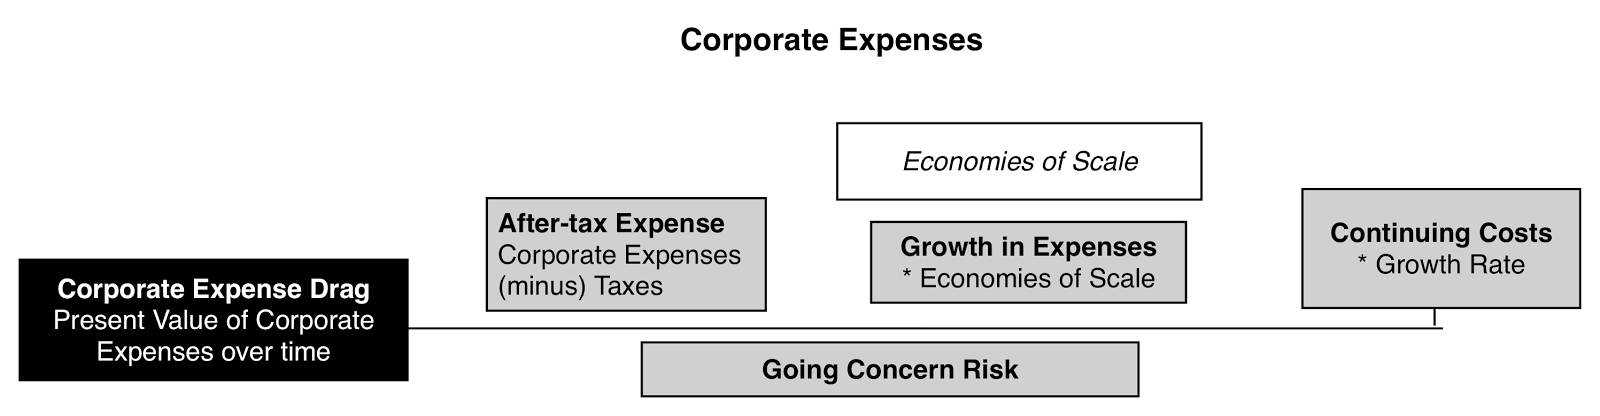
While at first sight, this item may look like wasteful that should be eliminated, it represents both a danger and an opportunity for young companies. It is a danger to the extent that bloated corporate expenses can drag a company's value down, but it can be an opportunity insofar as it is at the basis of economies of scale. If corporate expenses represent necessary expenses to keep a business going, and they grow at a rate much lower than the growth rate in users and revenues, you will see margins improve quickly as a company scales up.
Valuing Uber: A User based Model
Can Uber be valued using a user-based model? Yes, but it will require assumptions about users that are, at best, tentative and at worst, based upon little information. While I will attempt with the limited information that I have on Uber to do a user-based valuation, I will leave it to someone who has access to more information than I do (a VC invested in Uber or an Uber manager) to tweak the numbers to get better estimates of value.
Deconstructing the Financials
The numbers that we have on Uber's operations are minimalist, reflecting both its standing as a private company and its general secretiveness. In 2016, according to the financials that Uber provided to a Bloomberg reported, Uber reported $20 billion in gross billings, $6.5 billion in net revenues (counting all revenues from UberPool) and a loss of $2.8 billion (not counting the $1 billion loss on the China operations). According to other reports, Uber had about 40 million users at the end of 2016, up from 24 million users at the end of 2015. Finally, other (dated) reports suggest Uber's contribution margins (revenues minus variable costs) in its most profitable cities ranges from 3-11% of gross billings and its contribution margin in San Francisco, its longest standing and most mature market, is 10.1%. Bringing in these noisy and diverse estimates together, here are my estimates of user statistics:
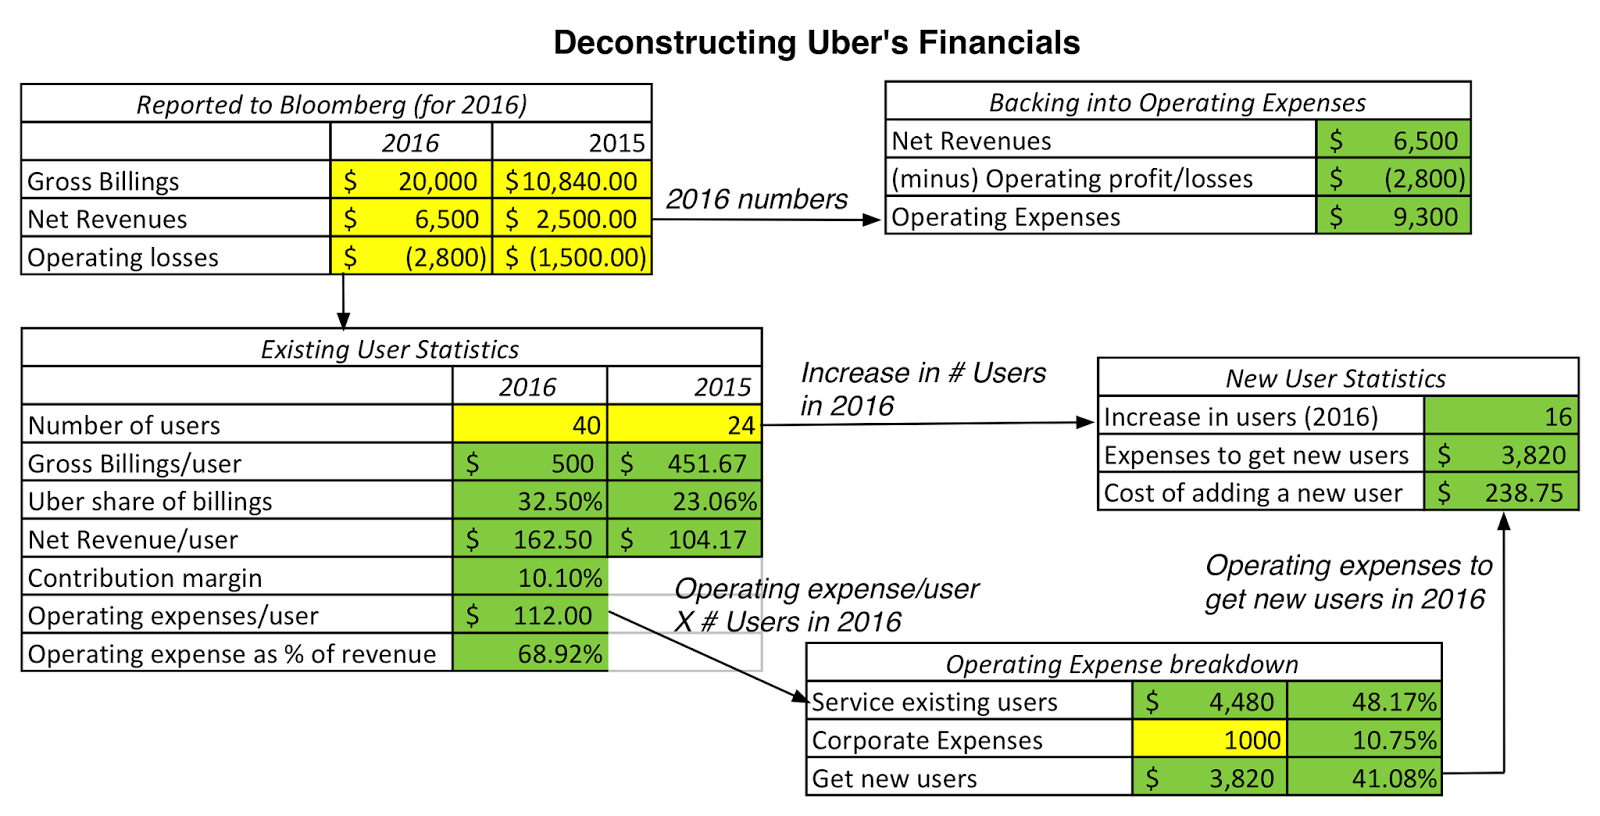
These numbers are stitched together from diverse sources and vary in reliability, but based upon my judgments, I break down Uber's operating expenses in 2016 into three categories: to service existing users (48.17%), to get new users (41.08%) and corporate expenses (10.75%); the last estimate is a shot in the dark, since there is no information available on the value. The annual profit from an existing user, based on 2016 numbers, is about $50.50 (Net Revenues - Expense/user) and the cost of adding a new user is about $238/75, and both will be key inputs in my valuation.
Valuing Existing UsersTo value Uber's existing users, I use the framework developed in the last section, in conjunction with the estimates that I obtained from the limited financial information provided by Uber. I valued existing users, assuming four additional parameters: a lifetime of 15 years for users, an annual renewal likelihood of 95%, a compounded growth rate of 12% in annual revenues from users expanding their user of Uber services and a growth rate of 9.9% a year in annual user servicing expenses (on the assumption that 80% of the servicing cost is variable). Assuming a cost of capital of 10% (in the 75th percentile of US firms), the resulting value per user and the overall value of existing users is shown below:
 Download spreadsheetThe value per existing user is about $410 and the overall value of Uber's 40 million existing users is $16,412 million. Not surprisingly, this value is sensitive to user stickiness (as measured by user lifetime) and user growth potential (as measured by the growth rate in annual revenues):
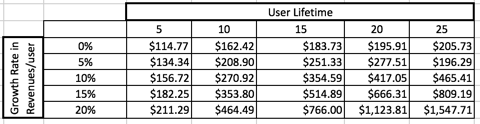 In a market where investors swoon at user numbers, this table makes an obvious point. Not all users are created equal, with more intense, sticky users being worth a great deal more than transient, switching users.
Value Added by New UsersTo estimate the value added by new users, I start with the value per user (estimated in the last section to be $410), which I grow at the inflation rate to get expected value per user over time, and use the cost of acquiring a new user from 2016 (about $240/user). Assuming a growth rate of 25% a year for the next five years, 10% between years six and ten and overall economic growth after year ten, I estimate the value added by new users over time. (With those growth rates, I more than quadruple the number of users over the next ten years to 164 million.) In coming up with value, I assume that new user growth is more uncertain than the value created by existing users, and use a 12% cost of capital (at the 90th percentile of US firms) to get today's value.
 Download spreadsheetThe value added by new users, based upon my estimates, is $20,191 million. That value is sensitive to the net value created by each new user (value of a new user minus the cost of adding a new user) and the growth rate in the number of users:
 This table illustrates the point made earlier about how some companies will be better off trading off higher value added per user for lower user growth, since there are clearly lower growth/ higher value added scenarios that dominate higher growth/lower value added scenarios in terms of value creation.
Corporate Expenses and overall ValueThe final loose end is the corporate expense component, a number that I estimated (arbitrarily) to be $1 billion in 2016. Allowing for the tax savings that these expenses will generate and assuming a 4% compounded growth rate, well below the 15.16% compounded growth rate in total users, I estimate a value for these corporate expenses (using the 10% cost of capital that I used for existing users):
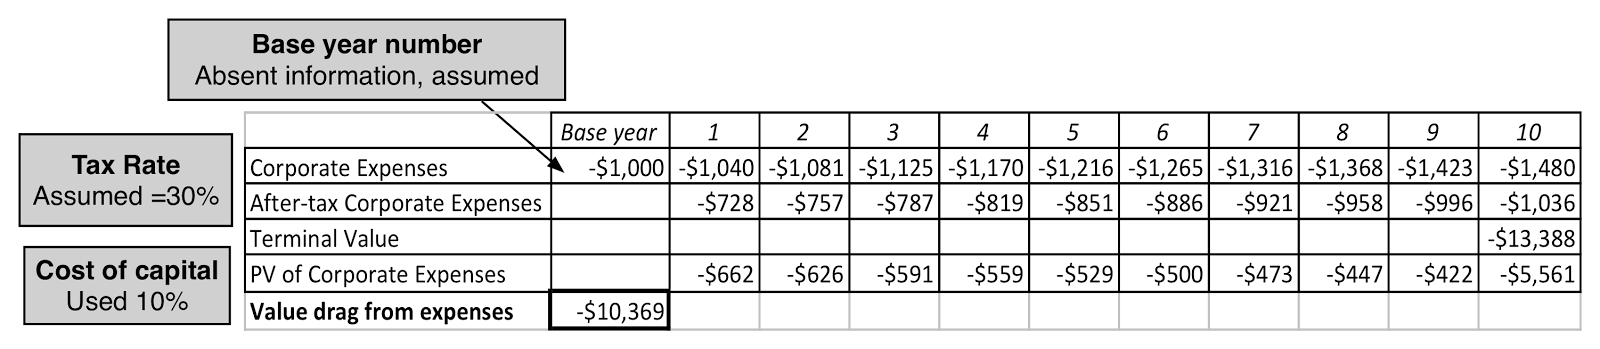 Download spreadsheetThe value drag created by corporate expenses is about $10,369 million. Bringing together all three components, we get a value for Uber's operations of $26.2 billion
Value of Uber's Operating Assets:
= Value of Existing Users+ Value added by New Users - Value drag from corporate expenses
= $16.4 billion + $20.2 billion + $10.4 billion = $26.2 billion
Adding the cash balance ($5 billion) and the holding in Didi Chuxing (estimate value of $6 billion) results in an overall value of equity of $37.2 billion for the company (and its equity, since it has no debt):
Value of Uber Equity = Value of Operating Assets + Cash - Debt = $26.2 + $5.0 + $6.0 = $37.2 billionThis is close to the value that I obtained for Uber on an aggregated basis, but that is a reflection of my understanding of the company's economics.
Pricing versus Valuing UsersAs you can see, valuing users requires assumptions about users that can be difficult to make. So, how do venture capitalists and other early stage investors come up with per user or per subscriber numbers? The answer is that they do not. Drawing on an earlier post that I had on how venture capitalists play the pricing game, venture capitalists price users, rather than value them. What does that involve? Very simply put, the price per user at Uber, given its most recent pricing of $69 billion and the estimated 40 million users is $1,725/user ($69,000/40). To make a judgment on whether that number is a high or a low number, you would compare that price to what you the market is pricing a user at Lyft or Didi Chuxing and if naive, argue that the lower the price per user, the cheaper the company. Using the most recent estimates of pricing and users for the five big ride sharing companies, here is what we get: table.tableizer-table { font-size: 12px; border: 1px solid #CCC; font-family: Arial, Helvetica, sans-serif; } .tableizer-table td { padding: 4px; margin: 3px; border: 1px solid #CCC; } .tableizer-table th { background-color: #104E8B; color: #FFF; font-weight: bold; }
CompanyMost Recent Pricing (in $ millions)# Users (in millions)Price/UserUber$69,00040.00$1,725.00Lyft$7,5005.00$1,500.00Didi Chuxing$50,000250.00$200.00Ola$3,00010.00$300.00GrabTaxi$4,2003.80$1,105.26If you follow the user valuation in the last section, you can see why this pricing comparison can be dangerous. The aggregate pricing that you get for individual companies reflects not only existing users but also new users, and dividing by the existing users will give you much higher numbers for companies that expect to grow their user base more. Even if every company is correctly priced, you should expect to see users at companies with less cash flows per user, lower user growth, less intense and loyal users and more uncertainty about future cash flows to be priced much lower than at companies with intense and sticky users, with more growth potential.
The Bottom LineIf your argument against using discounted cash flow valuation (at least in the aggregated form that it is usually done) is that you have to make a lot of assumptions, I hope that this process of valuing users brings home the reality that you cannot escape having to make those assumptions. In fact, the assumptions that you need to make to value a company on a disaggregated basis (based on users or subscribers) are often more involved and complex than the ones that you have to make in an aggregated valuation. That said, I do agree that looking at value on a disaggregated basis can not only give you insights about value drivers but also about questions that you would want to ask (and get answered) if you are thinking about investing in or building a young company whose value is coming from its user or subscriber base.
YouTube Video
AttachmentsUber User-based ValuationUber aggregated DCFPrevious Posts on UberA Disruptive Cab Ride to Riches (June 2014)Possible, Plausible and Probable: Big Markets and Networking Effects (July 2014)Up, Up and Away: A Crowd Valuation of Uber (December 2014)On the Uber Rollercoaster: Narrative Tweaks, Twists and Turns (October 2015)The Ride Sharing Business: Is a Bar Mitzvah moment coming? (August 2016)Uber's Bad Week: Doomsday Scenario or Business Reset (June 2017)
June 21, 2017
Uber's bad week: Doomsday Scenario or Business Reset?
Uber just cannot seem to help itself, finding a way to get in the news, and often in ways that leave its image in tatters. You could see this pattern in full display last week, where Travis Kalanick, its founder and CEO took a leave of absence to reinvent himself as Travis 2.0, and David Bonderman, founding partner at TPG and Uber director, had to step down after making a sexist remark at a meeting with Uber employees about countering sexism. Today, Travis made his departure permanent, throwing the company into chaos as the board searches for a replacement. As someone who has been collecting stories almost obsessively about the company since June 2014, this is just the latest in a long string of news events, where Uber has been portrayed as a bad corporate citizen. As with prior episodes, there are many who are writing the company’s epitaph but I would not be in too much of a hurry. This is a company that built itself by breaking rules, and while I believe that the latest controversies will damage Uber, they will not disable it.
Uber: Retracing history
If you are just starting to pay attention to Uber, after the last week, let me start by bringing you up to date with the company. Founded in 2009, by Travis Kalanick and Garrett Camp, in San Francisco as UberCab, and going into operation in 2010, the company has redefined the car service business, making the taxi cab a relic, at least for some segments of the population. Uber’s initial business model, which became the template for the ride sharing business, was a simple one. The company entered the car service business, and did so without buying any cars or hiring any drivers, essentially letting independent contractors use their own cars and operating as match-maker (with customers). That low capital intensity model has allowed the company to grow at an astronomical rate, with almost no large infrastructure or capital investments through much of its life.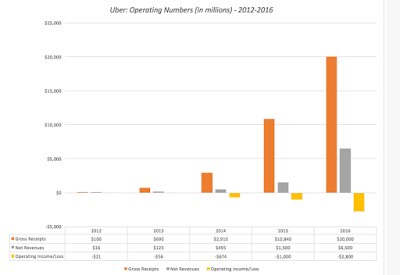
My first brush with Uber was in June 2014, when I tried to value the company. While many have since reminded me how wrong I was in my judgment, I have no qualms about repeating the story that I said about Uber at the time and the resulting valuation. Framing Uber as an urban, car-service company with local networking benefits and a low capital intensity model, I valued the company at about $6 billion. In fact, Bill Gurley, a partner at Benchmark Capital and an early investor in Uber, took me to task for the narrowness of my story, arguing that I was missing how much Uber would change the logistics market with his offerings.
Bill was right, I was wrong, and I did underestimate Uber’s growth potential, both in terms of geography and in attracting new users into the car service business. In October 2015, I revisited my Uber valuation and told a more expansive story of the company, incorporating its global reach and the influx of new users, while also noting that the pathway to profitability now faced far more roadblocks (as Didi Chuxing, Ola and GrabTaxi all found investors with open pockets and ramped up the competition). That resulted in a much higher revenue forecast, combined with more subdued operating margins, to yield a value of about $23 billion for the company.
In August 2016, I took another look at Uber, after it exited the Chinese market (the largest potential ridesharing market in the world) ceding the market to Didi Chuxing in return for Uber getting a 20% stake in Didi. I argued that this was a good development, since China had become a money pit for the company, sucking up more than a billion dollars in cash in the prior year. While there was some positive movement on some of my assumptions (slightly smaller losses and continued revenue growth), they were offset by some negative movement in other assumptions, leaving my value at about $28 billion, with almost all of the change in value from the prior year coming from the Didi stake that Uber got in exchange for leaving the China market. These are, of course, my stories about Uber and valuations and they matter little in how Uber is perceived by the market. In fact, there is clear evidence that notwithstanding all of the negativity around the company, investors have consistently pushed up its pricing from $ 60 million in 2011 to $3.5 billion in 2013 to $17 billion in June 2014 to almost $70 billion in the most recent capital round.
Uber: An Operations Update
The problem with Uber is that as a private business, albeit one with a high profile, its financial statements are not public. For much of its life, the only numbers that have been made public about the company have been leaked and my valuations have been based on this leaked information. Early this year, Uber finally departed from the script, partly with the intent of drawing attention away from negative stories about the company, and revealed selected financials for 2016. In particular, it reported that it generated more than $20 billion in gross billings in 2016, doubling its 2015 numbers, and that its share of these billings was $6.5 billion (which represents its net revenues). The latter number is puzzling since the company's stated share of the billings is only 20% (which would have meant only $4 billion in revenues) but part of the difference can be explained by the fact that Uber reported its gross billings from UberPool, its car pooling service, as revenues. The revenue growth has been dazzling but the losses continued to mount as well. Uber reported a loss of $2.8 billion for 2016, but that number would have been worse (closer to $3.8 billion) if losses in its defunct China operations had been counted. Overall, though, like all of its financial disclosures, leaked or otherwise, the number paint a mixed picture of Uber. On the plus side, they show a company growing explosively, adding cities, drivers and gross billings as it goes along. On the minus side, you are not seeing the rapid improvements in margins that you would expect to see as a company scales up, if it has economies of scale.
One reason why losses at Uber have continued to mount, even as revenues rise, is that the competition has not cooperated in Uber's quest for world domination. Rather than be intimidated by the Uber presence and capital advantage, some competitors (like Lyft) have adapted and narrowed their focus to markets, where they can compete. In fact, it is ironic that Lyft, which has long been viewed as the weaker competitor, reported an increase in market share in the US ride sharing market in 2016 and may be first to turn a profit in this business. Others, like Didi Chuxing, have attacked Uber's strength with strength, showing the capacity to raise capital and burn through it just as fast and recklessly as Uber has. Still others, like Ola, have played to local advantages to establish a beachhead against Uber. If Uber's original intent was to use shock and awe to wipe out its competition and emerge as the only player standing, it will have to rethink its plans.
The final leaked reports from the first quarter of 2017 seem to offer some glimmers of hope for Uber, as net revenues continued to increase (rising 18% from the prior quarter's numbers to 3.4 billion) and losses shrunk to $708 million from the $991 million in the prior quarter. Uber optimists found reasons to celebrate in these numbers, arguing that the much awaited margin improvement is now observable, but I would hold off until we not only get fuller financials but also are able to see how much the company paid out in stock based compensation. Using the same indefensible practice that other technology companies have adopted, Uber reports its profits (or in its case, its losses) before stock based compensation.
Uber: The Extracurricular Activity
With Uber, it has never just been about the numbers, because the company finds a myriad of ways to get in the news. Early on its life, some of this was by design, especially when the news stories were about the company evading rules and regulations to offer service in a city, since it burnished the company's reputation for getting things done first and worrying about the rules afterwards. In the last few months, it looks like the news cycle has spun out of Uber's control and that the stories have the potential, at least, to do real damage.The Google/Waymo Legal Tangle: Uber has not been shy about its desires to one day have self driving cars be its vehicles of choice, increasing investment needs in the business and potentially profit margins. The problem with this strategy it that it has brought Uber head to head against Google, a player with not only a head start in this business but also pockets so deep that it make's Uber's access to capital look paltry. That is perhaps why Uber announced with fanfare that it had hired Anthony Levandowski, a key player on the Google Waymo team, to lead its self driving car project. Any positive payoff from this announcement has been more than erased by subsequent developments, starting with Google accusing Mr. Levandowski of stealing proprietary information and suing Uber for being complicit in the deception, and with Uber folding, by firing Mr. Levandowski. I am not sure how far this has set Uber back in the driverless car business, but it certainly could not have helped.Travis YouTube Meltdown: You would think that someone with Travis Kalanick's tech savvy would know better, but his public confrontation with an Uber driver about whether Uber was squeezing drivers was recorded and went public. While this was a small misstep, relative to Uber's much bigger public relations fiascos, the incident reinforced the view among some that Kalanick was too impetuous and immature to be the CEO of a high profile company.Sexism and Boorishness: The stories about boorish behavior at Uber have been around a long time, and for a while, the company seemed to not just ignore these stories but feed off them. In the last few months, the stories acquired a darker edge with Susan Fowler, an ex-Uber engineer, writing about sexual harassment during her tenure at the company and the unwillingness of the company to do anything about it. Susan Fowler's chronicling of sexism at Uber had consequences, since the company hired Eric Holder and Tammy Albaran to look at corporate behavior and culture. Their report not only contained a listing of Uber's cultural problems but also included forty seven recommendations on how Uber could create an inclusive workplace, leading off with the one that Uber's board of directors "should evaluate the extent to which some of the responsibilities that Mr.Kalanick has historically possessed should be shared or given outright to other members of senior management".The Covington report could not be ignored and the last week was consequential. Travis Kalanick announced that he was taking a break from his role as CEO "to work on Travis 2.0 to become the leader that this company needs and that you deserve". It was in a follow-up meeting with Uber employees that Arianna Huffington chaired, with the intent of making Uber a more welcoming environment for women, that David Bonderman quipped about how having more women as directors would make it "much more likely there’ll be more talking" at meetings. Talk about being stone deaf!
What now?
In a post from long ago, I talked about how news events can alter valuations by affecting the stories that you tell about companies and classified these story alterations into three groups:
In a story break, you learn something about a company that renders your story moot and makes your valuation irrelevant (perhaps making it zero). This is the take that some have taken with Uber, when they have argued that the most recent news stories have doomed the company by breaking its story.In a story change, the news that you acquire can lead to you significantly expanding or contracting the story that you were telling about the company, with the former increasing value and the latter reducing it. My story for Uber dramatically expanded from the urban, car service company, with a value of $6 billion in June 2014, to a global logistics company facing challenges in turning revenues to profits, with a value of $23 billion, in September 2015.In a story shift, your basic story stays unchanged but with shifted contours. With Uber, that is what transpired, at least for me, between September 2015 and September 2016, where notwithstanding all of the news about the company, the story remained mostly unchanged, with perhaps higher revenue growth and lower profitability offsetting each other to leave value unchanged at about $25 billion.So, are the events of the last few months at Uber a story break (which would be catastrophic for its business and value), a story change (where Uber will continue to operate but with much more restraint in going for growth) or just a story shift (where after a few bumps and bruises, the company will continue on its current path)? To answer this question, you have to look how the different constituent groups, that are key to the company's pathway to profits, will react to these latest news stories. On the operations side, there are the regulators, who set the entry and operating rules in the cities that Uber operates in, the drivers who provide the life blood for the ride sharing operations and the customers, who choose to uber rather than use their own cars, mass transit or cabs. On the business side, there are the managers, from the top levels down to middle management, who will chart the future growth map for the company, and the engineers and technical staff, who make it a functional company. On the financing side, there are the venture capitalists who provided the initial capital for the company to go from start up to operations and the public equity investors (mutual funds and sovereign funds). Each of these groups has the potential to alter the Uber story and thus its value: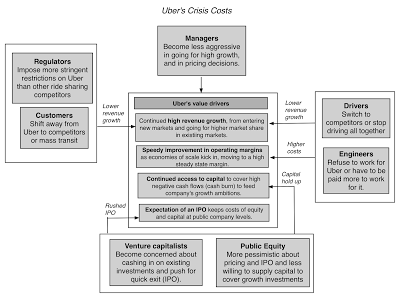 The doomsday scenario is embedded in this picture. For this crisis to take Uber down, millions of Uber customers will have to delete their apps, droves of Uber drivers will quit, regulators will rescind permissions already granted to operate in cities, Uber managers will be paralyzed, engineers will refuse to work for the company and investors (both venture capital and public equity) will not only cut off access to fresh capital and mark down their existing investments. Could these events unfold? It is possible, but unlikely, because each of these groups, I think, has too much to lose, if Uber implodes:Customers use Uber because it is cheap, convenient and quick and I seriously doubt that the corporate culture makes it even to the top ten list of considerations for most customers. Remember that the much publicized #DeleteUber movement a few months ago resulted in about 200,000 people deleting the app, about 0.5% of Uber's 40 million users. When moral arguments conflict with basic economics, economics almost always wins, and I seriously doubt that Uber will face much of a customer backlash.Without its drivers, there would be no Uber but of all of the constituent groups, drivers are likely to have the fewest delusions about the company, since they have been at the receiving end of its ruthless competitiveness. Given their need to make an income, it is both unfair and unrealistic to expect a significant number of drivers to stop driving for Uber just because of recent news stories, especially since most of these stories reaffirm what the drivers have always believed about the company.It is true that Uber has handed regulators another cudgel to beat them with and perhaps use as an excuse for crimping their operations, but given how ineffective regulators have been in slowing the company down, especially in the fact of backlash from Uber customers, I don't see the recent news changing the dynamics by enough to make a difference.On the managerial front, several news stories over the last week suggest that while Travis Kalanick was away on his reinvention mission, the company would be run by a committee of thirteen lieutenants (the people reporting to Kalanick), not a good development, especially when you have to make decisions quickly, but since these are people who were all hand picked by Kalanick, and are therefore more likely to think alike than disagree, it may work. This morning's news story that Kalanick had quit as CEO does create some uncertainty about future direction, which will not be resolved until a new CEO is hired.Susan Fowler, the author of the blog post that led Uber to their current woes, was an engineer at Uber and she indicates that Uber's actions resulted in female engineers fleeing the company, dropping from 25% to less than 3% of the engineering workforce. There is the danger that Uber's environment is viewed as so toxic that engineers will refuse to work for the company and that could be devastating for the company. While I think that this will weigh, at least in the near term, on Uber's capacity to attract investors, there will be enough engineers who will still be swayed by the company's resources and the excitement of working on the next big thing in sharing economy.The investors (venture capitalists and public investors) who seeded this company clearly have the most to lose (in potential profits) from the company imploding and the desire to preserve capital will lead them to do whatever needs to be done to save the company. Consequently, it is extremely unlikely that they will abandon their investments, just because of public outrage, or stop providing more capital to the firm, if the failure to do so is a complete loss in value. In fact, I believe that Kalanick's resignation today was prompted by investor pressure to move on; they have too much money at stake for them for them to let personal friendship or loyalty get in the way. That said, these investors play the pricing game and much of how investors will react will depend on what the pricing is for the next round of financing. If that happens at a price greater than the most recent round, all will be forgiven and investors will view this episode as a bump in the road to one of the most lucrative IPOs of all time. If not, and this is the biggest risk that Uber faces, you can see a shrinking story (and value) for the company.
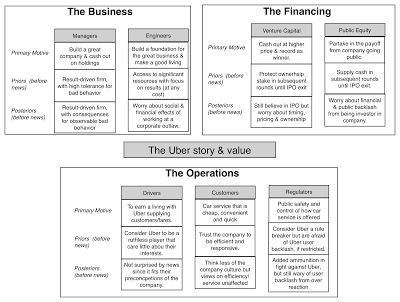
The bottom line is that I don't see the events as story breaks. There is the possibility that it is a story change, but that new story cannot be told until we find out who will head the company. For the moment, my story for Uber is mostly unchanged from September 2016 with two shifts: there is now a change, albeit a small one (5%), that the company could fail and I believe that these events have increased the likelihood that Uber will have to follow a more conventional business path of treating drivers as employees (lowering target operating margins). The resulting valuation is below: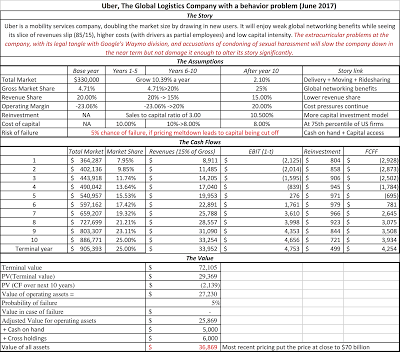 Download spreadsheetThe value that I attach to the operating assets stays at the $25 billion that I estimated in September 2015 and 2016, with the additional value of close to $11 billion coming from cash on hand and the Didi Chuxing stake. Could the new CEO affect this value? Yes, and here is why. Uber's value requires that the company continue to be audacious in its reach for new markets, aggressive in challenging competition and willing to be dependent on new capital for growth. If, as some news stories suggest, Uber's directors are thinking of playing it safe and hiring a corporatist and a rule follower, you may need to reassess the story to a safer, smaller one, delivering less value. This is still a company that needs a visionary CEO, but one with a little more self-restraint than Travis Kalanick. Good luck with that!
In ClosingMy conclusion is that the Uber's value, notwithstanding the sturm und drang of the last week, is intact but at a number that is far lower than investors have priced it at recently. The effect of the last week may be to bring the pricers back to earth, by reminding investors that there is a long way to go for Uber to convert potential to profits. Prior to these news stories, Uber was a rule breaking company with a business model that delivered revenue growth but offered a very narrow path to profitability. After these news stories, the story remains the same but Uber has just made its narrow path even narrower and much rests on who will head the company on this path.
YouTube video
Blog Posts on UberA Disruptive Cab Ride to Riches (June 2014)Possible, Plausible and Probable: Big Markets and Networking Effects (July 2014)Up, Up and Away: A Crowd Valuation of Uber (December 2014)On the Uber Rollercoaster: Narrative Tweaks, Twists and Turns (October 2015)The Ride Sharing Business: Is a Bar Mitzvah moment coming? (August 2016)Uber valuation spreadsheetsUber valuation (June 2014)Uber valuation (September 2015)Uber valuation (August 2016)Uber valuation (June 2017)
Uber: Retracing history
If you are just starting to pay attention to Uber, after the last week, let me start by bringing you up to date with the company. Founded in 2009, by Travis Kalanick and Garrett Camp, in San Francisco as UberCab, and going into operation in 2010, the company has redefined the car service business, making the taxi cab a relic, at least for some segments of the population. Uber’s initial business model, which became the template for the ride sharing business, was a simple one. The company entered the car service business, and did so without buying any cars or hiring any drivers, essentially letting independent contractors use their own cars and operating as match-maker (with customers). That low capital intensity model has allowed the company to grow at an astronomical rate, with almost no large infrastructure or capital investments through much of its life.

My first brush with Uber was in June 2014, when I tried to value the company. While many have since reminded me how wrong I was in my judgment, I have no qualms about repeating the story that I said about Uber at the time and the resulting valuation. Framing Uber as an urban, car-service company with local networking benefits and a low capital intensity model, I valued the company at about $6 billion. In fact, Bill Gurley, a partner at Benchmark Capital and an early investor in Uber, took me to task for the narrowness of my story, arguing that I was missing how much Uber would change the logistics market with his offerings.
Bill was right, I was wrong, and I did underestimate Uber’s growth potential, both in terms of geography and in attracting new users into the car service business. In October 2015, I revisited my Uber valuation and told a more expansive story of the company, incorporating its global reach and the influx of new users, while also noting that the pathway to profitability now faced far more roadblocks (as Didi Chuxing, Ola and GrabTaxi all found investors with open pockets and ramped up the competition). That resulted in a much higher revenue forecast, combined with more subdued operating margins, to yield a value of about $23 billion for the company.
In August 2016, I took another look at Uber, after it exited the Chinese market (the largest potential ridesharing market in the world) ceding the market to Didi Chuxing in return for Uber getting a 20% stake in Didi. I argued that this was a good development, since China had become a money pit for the company, sucking up more than a billion dollars in cash in the prior year. While there was some positive movement on some of my assumptions (slightly smaller losses and continued revenue growth), they were offset by some negative movement in other assumptions, leaving my value at about $28 billion, with almost all of the change in value from the prior year coming from the Didi stake that Uber got in exchange for leaving the China market. These are, of course, my stories about Uber and valuations and they matter little in how Uber is perceived by the market. In fact, there is clear evidence that notwithstanding all of the negativity around the company, investors have consistently pushed up its pricing from $ 60 million in 2011 to $3.5 billion in 2013 to $17 billion in June 2014 to almost $70 billion in the most recent capital round.
Uber: An Operations Update
The problem with Uber is that as a private business, albeit one with a high profile, its financial statements are not public. For much of its life, the only numbers that have been made public about the company have been leaked and my valuations have been based on this leaked information. Early this year, Uber finally departed from the script, partly with the intent of drawing attention away from negative stories about the company, and revealed selected financials for 2016. In particular, it reported that it generated more than $20 billion in gross billings in 2016, doubling its 2015 numbers, and that its share of these billings was $6.5 billion (which represents its net revenues). The latter number is puzzling since the company's stated share of the billings is only 20% (which would have meant only $4 billion in revenues) but part of the difference can be explained by the fact that Uber reported its gross billings from UberPool, its car pooling service, as revenues. The revenue growth has been dazzling but the losses continued to mount as well. Uber reported a loss of $2.8 billion for 2016, but that number would have been worse (closer to $3.8 billion) if losses in its defunct China operations had been counted. Overall, though, like all of its financial disclosures, leaked or otherwise, the number paint a mixed picture of Uber. On the plus side, they show a company growing explosively, adding cities, drivers and gross billings as it goes along. On the minus side, you are not seeing the rapid improvements in margins that you would expect to see as a company scales up, if it has economies of scale.
One reason why losses at Uber have continued to mount, even as revenues rise, is that the competition has not cooperated in Uber's quest for world domination. Rather than be intimidated by the Uber presence and capital advantage, some competitors (like Lyft) have adapted and narrowed their focus to markets, where they can compete. In fact, it is ironic that Lyft, which has long been viewed as the weaker competitor, reported an increase in market share in the US ride sharing market in 2016 and may be first to turn a profit in this business. Others, like Didi Chuxing, have attacked Uber's strength with strength, showing the capacity to raise capital and burn through it just as fast and recklessly as Uber has. Still others, like Ola, have played to local advantages to establish a beachhead against Uber. If Uber's original intent was to use shock and awe to wipe out its competition and emerge as the only player standing, it will have to rethink its plans.
The final leaked reports from the first quarter of 2017 seem to offer some glimmers of hope for Uber, as net revenues continued to increase (rising 18% from the prior quarter's numbers to 3.4 billion) and losses shrunk to $708 million from the $991 million in the prior quarter. Uber optimists found reasons to celebrate in these numbers, arguing that the much awaited margin improvement is now observable, but I would hold off until we not only get fuller financials but also are able to see how much the company paid out in stock based compensation. Using the same indefensible practice that other technology companies have adopted, Uber reports its profits (or in its case, its losses) before stock based compensation.
Uber: The Extracurricular Activity
With Uber, it has never just been about the numbers, because the company finds a myriad of ways to get in the news. Early on its life, some of this was by design, especially when the news stories were about the company evading rules and regulations to offer service in a city, since it burnished the company's reputation for getting things done first and worrying about the rules afterwards. In the last few months, it looks like the news cycle has spun out of Uber's control and that the stories have the potential, at least, to do real damage.The Google/Waymo Legal Tangle: Uber has not been shy about its desires to one day have self driving cars be its vehicles of choice, increasing investment needs in the business and potentially profit margins. The problem with this strategy it that it has brought Uber head to head against Google, a player with not only a head start in this business but also pockets so deep that it make's Uber's access to capital look paltry. That is perhaps why Uber announced with fanfare that it had hired Anthony Levandowski, a key player on the Google Waymo team, to lead its self driving car project. Any positive payoff from this announcement has been more than erased by subsequent developments, starting with Google accusing Mr. Levandowski of stealing proprietary information and suing Uber for being complicit in the deception, and with Uber folding, by firing Mr. Levandowski. I am not sure how far this has set Uber back in the driverless car business, but it certainly could not have helped.Travis YouTube Meltdown: You would think that someone with Travis Kalanick's tech savvy would know better, but his public confrontation with an Uber driver about whether Uber was squeezing drivers was recorded and went public. While this was a small misstep, relative to Uber's much bigger public relations fiascos, the incident reinforced the view among some that Kalanick was too impetuous and immature to be the CEO of a high profile company.Sexism and Boorishness: The stories about boorish behavior at Uber have been around a long time, and for a while, the company seemed to not just ignore these stories but feed off them. In the last few months, the stories acquired a darker edge with Susan Fowler, an ex-Uber engineer, writing about sexual harassment during her tenure at the company and the unwillingness of the company to do anything about it. Susan Fowler's chronicling of sexism at Uber had consequences, since the company hired Eric Holder and Tammy Albaran to look at corporate behavior and culture. Their report not only contained a listing of Uber's cultural problems but also included forty seven recommendations on how Uber could create an inclusive workplace, leading off with the one that Uber's board of directors "should evaluate the extent to which some of the responsibilities that Mr.Kalanick has historically possessed should be shared or given outright to other members of senior management".The Covington report could not be ignored and the last week was consequential. Travis Kalanick announced that he was taking a break from his role as CEO "to work on Travis 2.0 to become the leader that this company needs and that you deserve". It was in a follow-up meeting with Uber employees that Arianna Huffington chaired, with the intent of making Uber a more welcoming environment for women, that David Bonderman quipped about how having more women as directors would make it "much more likely there’ll be more talking" at meetings. Talk about being stone deaf!
What now?
In a post from long ago, I talked about how news events can alter valuations by affecting the stories that you tell about companies and classified these story alterations into three groups:
In a story break, you learn something about a company that renders your story moot and makes your valuation irrelevant (perhaps making it zero). This is the take that some have taken with Uber, when they have argued that the most recent news stories have doomed the company by breaking its story.In a story change, the news that you acquire can lead to you significantly expanding or contracting the story that you were telling about the company, with the former increasing value and the latter reducing it. My story for Uber dramatically expanded from the urban, car service company, with a value of $6 billion in June 2014, to a global logistics company facing challenges in turning revenues to profits, with a value of $23 billion, in September 2015.In a story shift, your basic story stays unchanged but with shifted contours. With Uber, that is what transpired, at least for me, between September 2015 and September 2016, where notwithstanding all of the news about the company, the story remained mostly unchanged, with perhaps higher revenue growth and lower profitability offsetting each other to leave value unchanged at about $25 billion.So, are the events of the last few months at Uber a story break (which would be catastrophic for its business and value), a story change (where Uber will continue to operate but with much more restraint in going for growth) or just a story shift (where after a few bumps and bruises, the company will continue on its current path)? To answer this question, you have to look how the different constituent groups, that are key to the company's pathway to profits, will react to these latest news stories. On the operations side, there are the regulators, who set the entry and operating rules in the cities that Uber operates in, the drivers who provide the life blood for the ride sharing operations and the customers, who choose to uber rather than use their own cars, mass transit or cabs. On the business side, there are the managers, from the top levels down to middle management, who will chart the future growth map for the company, and the engineers and technical staff, who make it a functional company. On the financing side, there are the venture capitalists who provided the initial capital for the company to go from start up to operations and the public equity investors (mutual funds and sovereign funds). Each of these groups has the potential to alter the Uber story and thus its value:
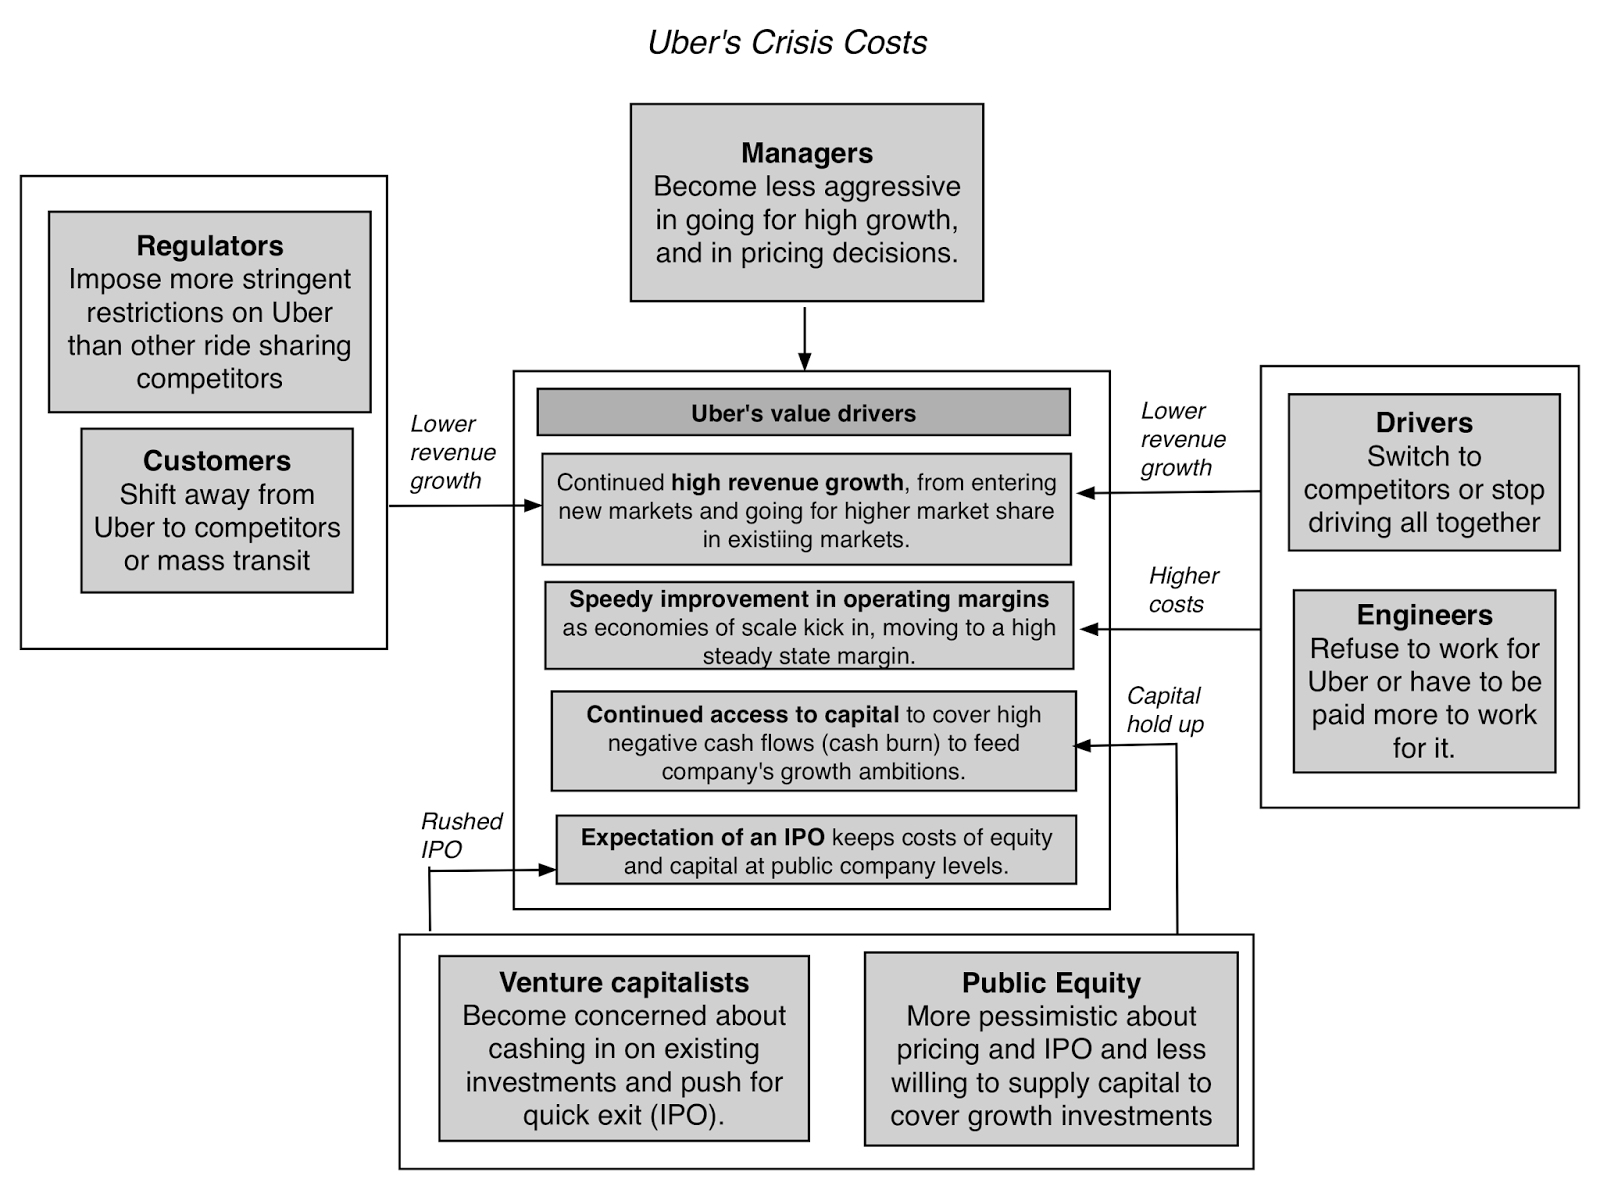 The doomsday scenario is embedded in this picture. For this crisis to take Uber down, millions of Uber customers will have to delete their apps, droves of Uber drivers will quit, regulators will rescind permissions already granted to operate in cities, Uber managers will be paralyzed, engineers will refuse to work for the company and investors (both venture capital and public equity) will not only cut off access to fresh capital and mark down their existing investments. Could these events unfold? It is possible, but unlikely, because each of these groups, I think, has too much to lose, if Uber implodes:Customers use Uber because it is cheap, convenient and quick and I seriously doubt that the corporate culture makes it even to the top ten list of considerations for most customers. Remember that the much publicized #DeleteUber movement a few months ago resulted in about 200,000 people deleting the app, about 0.5% of Uber's 40 million users. When moral arguments conflict with basic economics, economics almost always wins, and I seriously doubt that Uber will face much of a customer backlash.Without its drivers, there would be no Uber but of all of the constituent groups, drivers are likely to have the fewest delusions about the company, since they have been at the receiving end of its ruthless competitiveness. Given their need to make an income, it is both unfair and unrealistic to expect a significant number of drivers to stop driving for Uber just because of recent news stories, especially since most of these stories reaffirm what the drivers have always believed about the company.It is true that Uber has handed regulators another cudgel to beat them with and perhaps use as an excuse for crimping their operations, but given how ineffective regulators have been in slowing the company down, especially in the fact of backlash from Uber customers, I don't see the recent news changing the dynamics by enough to make a difference.On the managerial front, several news stories over the last week suggest that while Travis Kalanick was away on his reinvention mission, the company would be run by a committee of thirteen lieutenants (the people reporting to Kalanick), not a good development, especially when you have to make decisions quickly, but since these are people who were all hand picked by Kalanick, and are therefore more likely to think alike than disagree, it may work. This morning's news story that Kalanick had quit as CEO does create some uncertainty about future direction, which will not be resolved until a new CEO is hired.Susan Fowler, the author of the blog post that led Uber to their current woes, was an engineer at Uber and she indicates that Uber's actions resulted in female engineers fleeing the company, dropping from 25% to less than 3% of the engineering workforce. There is the danger that Uber's environment is viewed as so toxic that engineers will refuse to work for the company and that could be devastating for the company. While I think that this will weigh, at least in the near term, on Uber's capacity to attract investors, there will be enough engineers who will still be swayed by the company's resources and the excitement of working on the next big thing in sharing economy.The investors (venture capitalists and public investors) who seeded this company clearly have the most to lose (in potential profits) from the company imploding and the desire to preserve capital will lead them to do whatever needs to be done to save the company. Consequently, it is extremely unlikely that they will abandon their investments, just because of public outrage, or stop providing more capital to the firm, if the failure to do so is a complete loss in value. In fact, I believe that Kalanick's resignation today was prompted by investor pressure to move on; they have too much money at stake for them for them to let personal friendship or loyalty get in the way. That said, these investors play the pricing game and much of how investors will react will depend on what the pricing is for the next round of financing. If that happens at a price greater than the most recent round, all will be forgiven and investors will view this episode as a bump in the road to one of the most lucrative IPOs of all time. If not, and this is the biggest risk that Uber faces, you can see a shrinking story (and value) for the company.
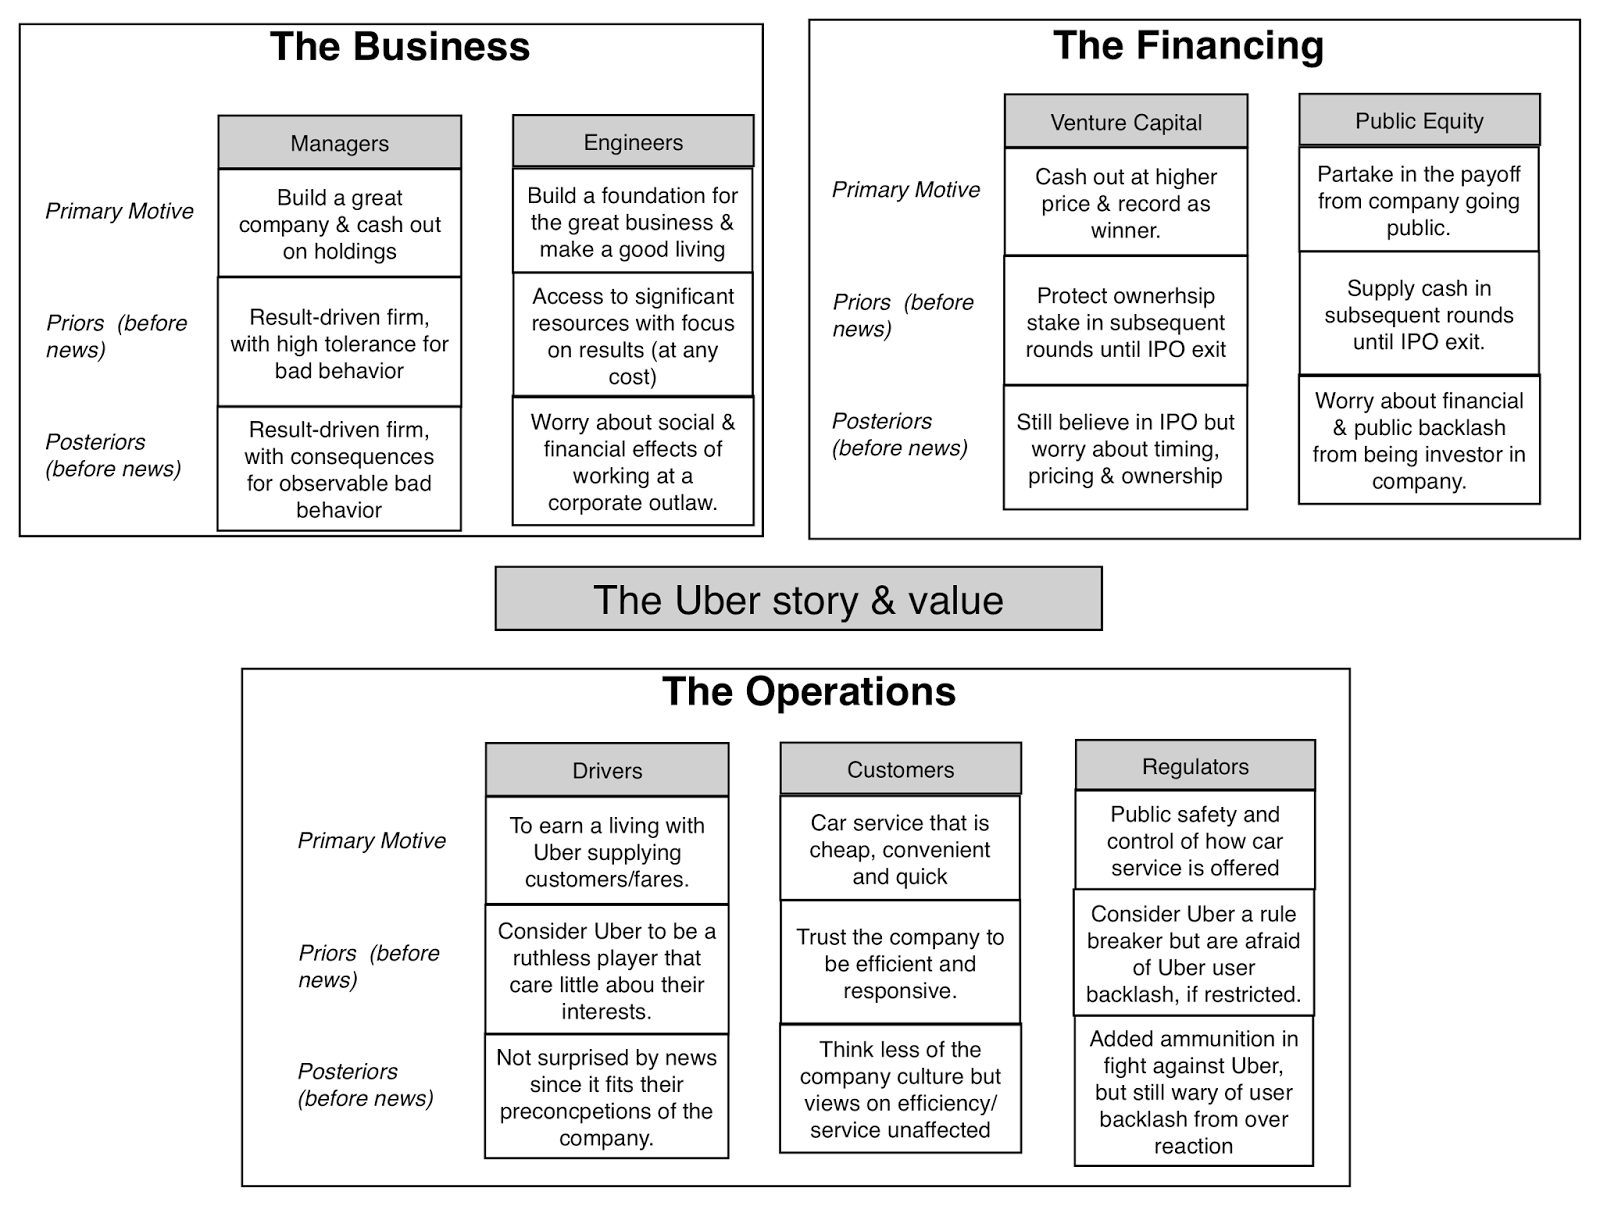
The bottom line is that I don't see the events as story breaks. There is the possibility that it is a story change, but that new story cannot be told until we find out who will head the company. For the moment, my story for Uber is mostly unchanged from September 2016 with two shifts: there is now a change, albeit a small one (5%), that the company could fail and I believe that these events have increased the likelihood that Uber will have to follow a more conventional business path of treating drivers as employees (lowering target operating margins). The resulting valuation is below:
 Download spreadsheetThe value that I attach to the operating assets stays at the $25 billion that I estimated in September 2015 and 2016, with the additional value of close to $11 billion coming from cash on hand and the Didi Chuxing stake. Could the new CEO affect this value? Yes, and here is why. Uber's value requires that the company continue to be audacious in its reach for new markets, aggressive in challenging competition and willing to be dependent on new capital for growth. If, as some news stories suggest, Uber's directors are thinking of playing it safe and hiring a corporatist and a rule follower, you may need to reassess the story to a safer, smaller one, delivering less value. This is still a company that needs a visionary CEO, but one with a little more self-restraint than Travis Kalanick. Good luck with that!
In ClosingMy conclusion is that the Uber's value, notwithstanding the sturm und drang of the last week, is intact but at a number that is far lower than investors have priced it at recently. The effect of the last week may be to bring the pricers back to earth, by reminding investors that there is a long way to go for Uber to convert potential to profits. Prior to these news stories, Uber was a rule breaking company with a business model that delivered revenue growth but offered a very narrow path to profitability. After these news stories, the story remains the same but Uber has just made its narrow path even narrower and much rests on who will head the company on this path.
YouTube video
Blog Posts on UberA Disruptive Cab Ride to Riches (June 2014)Possible, Plausible and Probable: Big Markets and Networking Effects (July 2014)Up, Up and Away: A Crowd Valuation of Uber (December 2014)On the Uber Rollercoaster: Narrative Tweaks, Twists and Turns (October 2015)The Ride Sharing Business: Is a Bar Mitzvah moment coming? (August 2016)Uber valuation spreadsheetsUber valuation (June 2014)Uber valuation (September 2015)Uber valuation (August 2016)Uber valuation (June 2017)
June 6, 2017
A Tale of Two Markets: Politics and Investing!
"It was the best of times, it was the worst of times, it was the age of wisdom, it was the age of foolishness, it was the epoch of belief, it was the epoch of incredulity, it was the season of Light, it was the season of Darkness, it was the spring of hope, it was the winter of despair, we had everything before us, we had nothing before us, we were all going direct to Heaven, we were all going direct the other way.” That Charles Dickens opening to The Tale of Two Cities is an apt description of financial markets today. While disagreement among market participants has always been a feature of markets, seldom has there been such a divide between those who believe that we are on the verge of a massive correction and those who equally vehemently feel that this is the cusp of a new bull market, and between those who see unprecedented economic and policy uncertainty and market indicators that suggest the exact opposite. Is one side right and the other wrong? Is it possible that both sides are right? Or that both sides are wrong?
The Divergence
The investor divide is visible, and sometimes dramatically so, in almost every aspect of markets, from risk indicators to fund flows to consumer behavior.
1. Risk on? Risk off?Do we live in risky or safe times? It depends on who you ask and what indicator to look at. Over the last two decades, the VIX (Volatility Index) has become a proxy for how much risk investors see in equity markets and the graph below captures the movement of the index (and a similarly constructed index for European stocks) over much of that period:
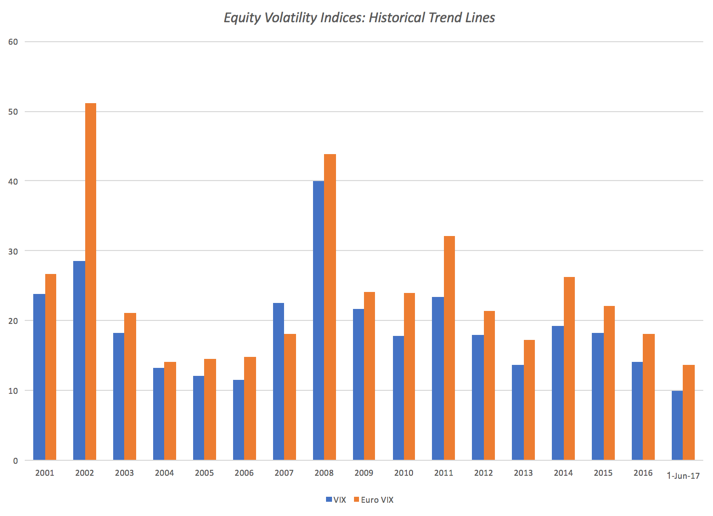 VIX: S&P 500, Euro VIX: Euro Stoxx 50Last year, the volatility measures in both the US and Europe not only took Brexit and the Trump election in stride but they have, in the months since the US presidential elections, continued their downward move, ending May 2017 at close to historic lows.
 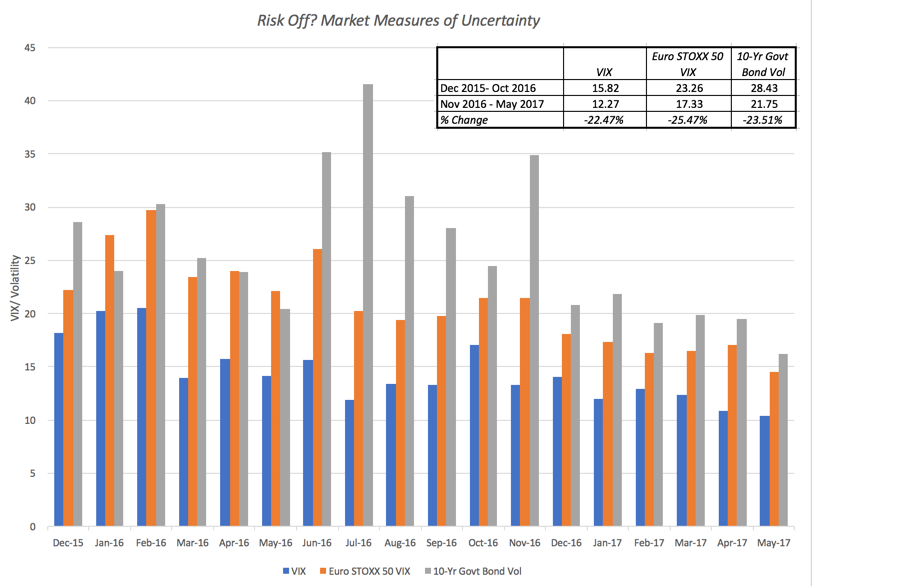 Lest you believe that this drop in volatility is restricted to stocks, you see similar patterns in other measures of risk including treasury yield volatility (shown in the graph) and in corporate bond volatility. This volatility swoon is also not restricted to the US, since measures of global volatility have also leveled off or decreased over the last few months. In fact, the volatility in currency movements has also dropped close to all-time lows.
 In sum, the market seems to be signaling a period of unusual stability. That is at odds with what we are reading about economic policies, where there is talk of major changes to the US tax code and trade policies, signaling a period of high volatility for global economies. The economic policy uncertainty index, is an index constructed by looking at news stories, CBO lists of temporary tax code provisions and disagreement among economic forecasters, has been sending a very different signal to the market than the market volatility indices:
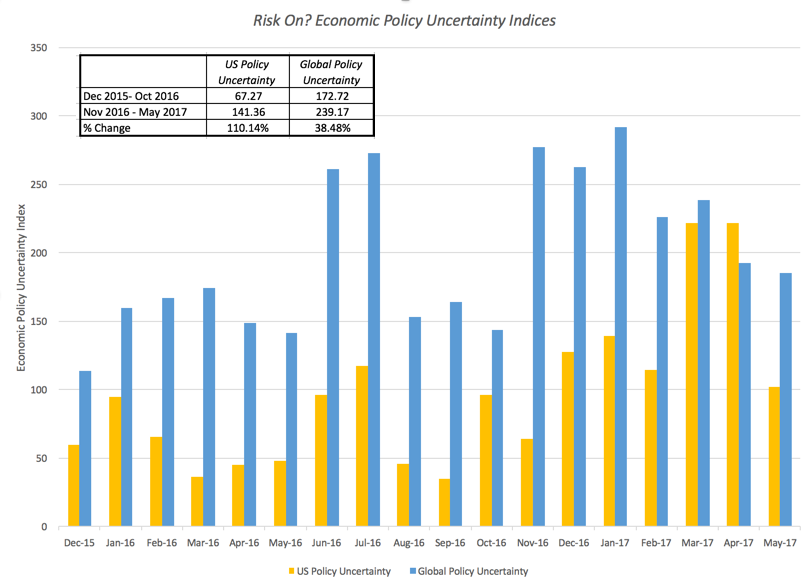
In the months since the election, the indices have spiked multiple times, breaking through records set during the 2008 crisis. In short, we are either on the cusp of unprecedented stability (at least as measured with the market volatility indices) or explosive change (according to the economic policy indices).
2. Funds in? Funds out?The ultimate measure of how comfortable investors feel about risk is whether they are putting money into stocks or taking them out and fund flows have historically been a good measure of that comfort. Put simply, if investors are wary and risk averse about an asset class or market, you should expect to see money flow out of that market and if they are sanguine, you should see money flow in. In the graph below, we look at fund flows into equity, bond and commodity funds, by month, from the start of 2016 to the April 2017:
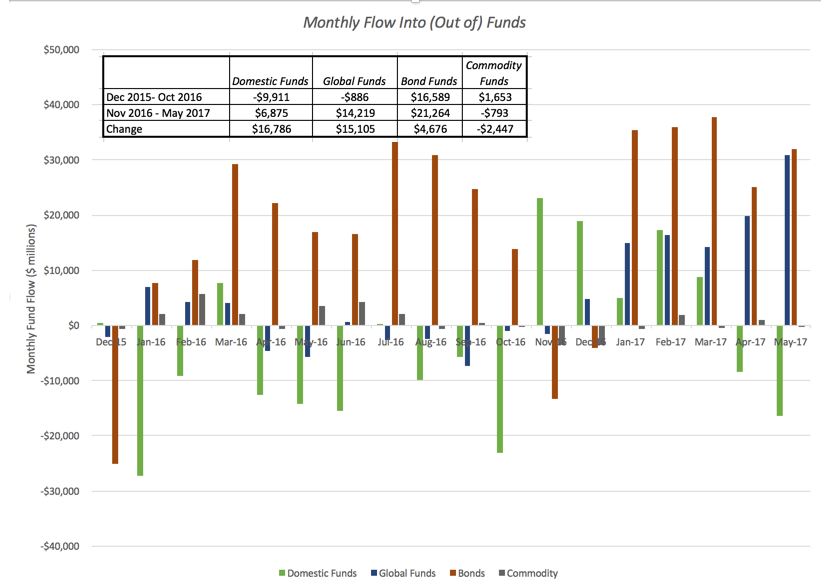 Source: Investment Company InstituteMore money has flowed into both equity and bond funds, on a monthly basis, since November 2016 than in the first ten months of 2016. While the fund flow picture is consistent with the drop in volatility that you see across the market-based risk measures, there are discordant notes here as well. First, and perhaps least surprisingly, the perennial market bears have become even more bearish, with concerns about macroeconomic risk augmenting their long-standing concerns about stocks trading at high PE ratios. Second, there are big name investors who are cautioning that a market correction is around the corner, with Jeff Gundlach being the latest to argue that it is time to sell the S&P 500 and buy emerging market stocks. Finally, there is some evidence that money is leaving US stocks, with the Wall Street Journal reporting that money going into US stocks is at a 9-year low, while inflows into European stocks hit a five-year high.
3. Corporate and Business BehaviorUltimately, risk does not come from market perceptions or newsletters but is reflected in consumer spending and business investment. On these dimensions as well, there is enough ammunition for both sides to see what they want to see. With consumer confidence, the trend lines are clear cut, with consumers becoming increasingly confident about both their current and future prospects:

That confidence, though, is not carrying through into consumer spending, where the numbers indicate more uncertainty about the future:

While consumer spending has increased since November, the rate of change has not accelerated from growth in prior years. You can see similar divergences between confidence and spending numbers at the business level, with business confidence up strongly since November 2016 but business investment not showing any significant acceleration. In short, both consumers and businesses seem to be feeling better about future prospects but they don't seem willing to back up that confidence with spending.
The Diagnostics
So, how do we go about explaining these stark differences between different indicators? Has risk gone up or has it gone down in the last few months? Is money coming into stocks or is it leaving stocks? Why, if consumers and businesses are feeling better about the future, are they not spending and investing more? There are four possible explanations and they are not mutually exclusive. In fact, I believe that all three contribute to the dichotomy.Markets have become inured to crises: The last decade has been one filled with crises, in different regions and with different origins, with each one described as the one that is going to tip markets into collapse. Each time, after the debris has cleared, markets have emerged resilient and sometimes stronger than they went in. It is possible that investors have learned to take these market shocks in stride. Like the boy who cried wolf, it is possible that market pundits are viewed by investors as prone to hysteria, and are being ignored.Disagreement about economic policy changes/effects: It is also possible that economic pundits and investors are parting ways on both the likelihood of economic policy shocks and/or the consequences. On economic policy changes, the skepticism on the part of investors can be explained by the fact that governments across the globe seem to be more interested in talking about making big changes than they are in making those changes. On the effects of changes, the logic that policy uncertainty leads to economic uncertainty which, in turn, causes market uncertainty is being put to the test as governments and central banks are discovering that policy changes, on everything from interest rates to tax rates, are having a much smaller impact on both economic growth and investor behavior than they used to, perhaps because of globalization. Macro to Micro Risk: One of the residual effects of the 2008 crisis was an increase in correlation across stocks, with the proportion of risk attributable to market risk in individual stocks rising, relative to firm-specific risk, with that effect persisting into 2016. Since November 2016, the correlation across stocks has dropped, as investors try to assess how new policies on taxes and infrastructure will help or hurt individual stocks.and this may explain the drop in the VIX, even as individual stocks are perhaps getting riskier.Politics first, analysis later: It is no secret that we live in partisan times, where almost every news story is viewed through political lens. Why should financial markets be immune from political partisanship? I have seen no research to back this up, but my very limited sampling of investor views (on politics and markets) indicates a convergence of the two in recent months. Put simply, Trump supporters are more likely to be bullish on stocks and confident about the future of the economy, and Trump opponents are more likely to be bearish about both stocks and the economy. Both sides see what they want to see in news stories and data releases and ignore that which does not advance their theses.So, who is right here? I think that both sides have reasonable cases to make and both have their blind spots. On crisis weariness, it is true that market watchers have been guilty of hyping every crisis over the last decade, but it is also true that not all crises are benign and that one of them may very well be the next "big one". On economic policy changes and effects, I am inclined to side with those who feel that the powers of governments and central banks to guide economies is overstated but I also know that both entities can cause serious damage, if they pursue ill-thought through policies. On the political front, I won't tip my hand on my political affiliations but I believe that viewing economics and markets through political lens can be deadly for my portfolio.
My Sanity Check: Equity Risk Premiums
As you can see, it is easy to talk yourself on to the cliff or off the cliff but after all the talking is done, it remains just that, talk. So, I will fall back on a calculation that lets the numbers do the talking (rather than my biases) and that is my computation of the implied equity risk premium for US stocks. On June 1, 2017, as I have at the start of every month since September 2008 and every year going back to 1990, I backed out the rate of return that investors can expect to make on the S&P 500, given where it was trading at on that day (2411.8) and expected cash flows from dividends and buybacks on the index in the future (estimated from the cash flows in the most recent twelve months and consensus estimates of earnings growth over the next five years in earnings). Given the index level and cash flows on June 1, 2017, the expected annual return on stocks (the IRR of the cash flows) is 7.50%. Netting out the 10-year treasury bond rate (2.21%) on June 1 yields an implied equity risk premium of 5.29%.
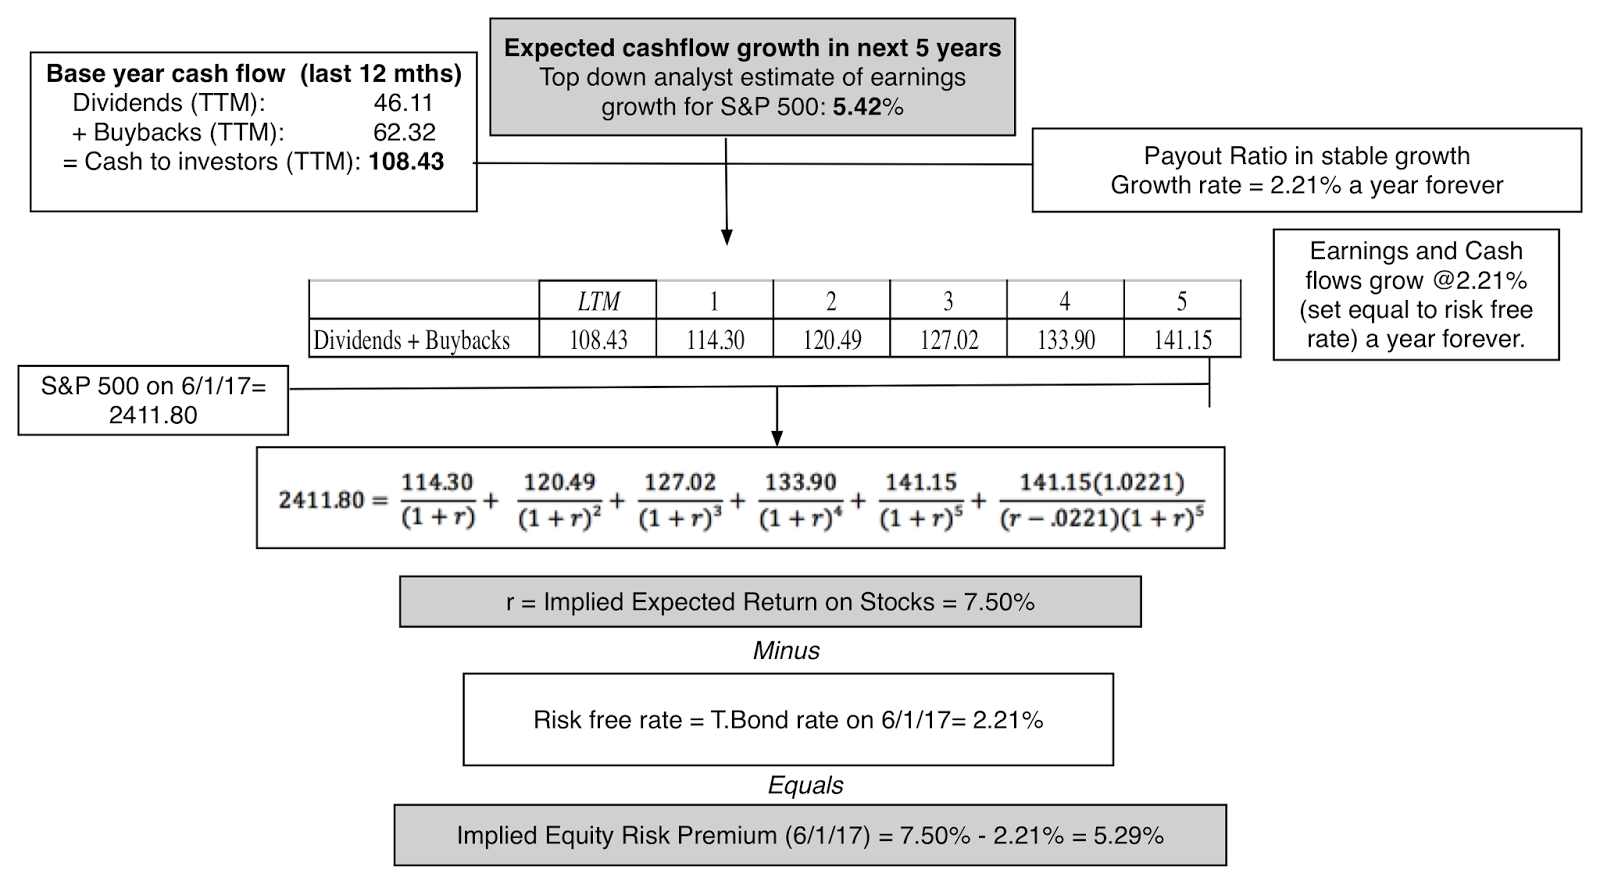 Download spreadsheetTo put this in perspective, I have graphed out the implied equity risk premiums for the S&P 500, by year, going back to 1960.
 Download historical dataTo the extent that the equity risk premium is higher than median values over values over the 1960-2017 time period, you should feel comforted, but the market's weakest links are visible in this graphs as well. Much of the expansion in equity risk premiums in the last decade has been sustained by two forces.
Low interest rates: If the US treasury bond rate was at its 2007 level of 4.5%, the implied equity risk premium on June 1, 2017, would have been 3%, dangerously close to all time lows. High cash return: US companies have been returning immense amounts of cash in the form of buybacks over the last decade and it is the surge in the collective cash flow that pushes premiums up. As earnings at S&P 500 companies flattened and dropped in 2015 and 2016, you can argue that the current rate of cash return is not just unsustainable but also incompatible with the infrastructure-investment driven growth stories told by some market bulls.The first half of 2017 delivered some good news and some bad news on this front. The good news is that notwithstanding rumors of Fed tightening, treasury bond rates dropped from 2.45% on January 1, 2017 to 2.21% on June 1, 2017, and S&P 500 companies reported much stronger earnings for the first quarter, up almost 17% from the first quarter of 2016. The bad news is that it seems a near certainty that Fed will hike the Fed Funds rate soon (though its impact on longer term rates is debatable) and that there is preliminary evidence that companies have slowed the pace of stock buybacks. The bottom line, and this may disappoint those of you who were expecting a decisive market timing forecast, is that stocks are richly priced, relative to history, but not relative to alternative investments today. Paraphrasing Dickens, we could be on the verge of a sharp surge in stock prices or a sharp correction, entering an extended bull market or on the brink of a bear market, at the cusp of an economic boom or on the precipice of a bust. I will leave it to others who are much better than me at market timing to make these calls and continue to muddle along with my stock picking.
YouTube Video
Attachments
Implied Equity Risk Premium for S&P 500 - June 2017Historical ERP for S&P 500: 1961-2017
March 23, 2017
A Valeant Update: Damaged Goods or Deeply Discounted Drug Company?
Rats get a bad rap for fleeing sinking ships. After all, given that survival is the strongest evolutionary impulse and that rats are not high up in the food chain, why would they not? That idiom, unfortunately, is what came to mind as I took another look at Valeant, the vessel in my investment portfolio that most closely resembles a sinking ship. This is a stock that I had little interest in, during its glory days as the ultimate value investing play, but that I took first a look at, after its precipitous fall from grace in November 2015. While I stayed away from it then, I bought it in May 2016 after it had dropped another 60% and I found it cheap enough to add to my portfolio. I then compounded my losses when I doubled my holding in October 2016, arguing that while it was, at best, an indifferently managed company in a poor business, it was under priced at $14 . With the stock trading at less than $12 (and down to $10.50, as I write this post) and its biggest investor/promoter abandoning it, there is no way that I can avert my eyes any longer from this train wreck. So, here I go!
Valeant: A Short (and Personal) HistoryI won't bore you by repeating (for a third time) the story of Valeant's fall from investment grace, which happened with stunning speed in 2015, as it went from value investing favorite to untouchable, in the matter of months. My first post, from November 2015, examined the company in the aftermath of the fall, as it was touted as a contrarian bet, trading at close to $90, down more than 50% in a few months. My belief then was that the company's business model, built on acquisitions, debt and drug repricing was broken and that the company, if it became a more conventional drug business company, with low growth driven by R&D, was worth $73 per share. I revisited Valeant in April 2016, after the company had gone through a series of additional setbacks, with many of its wounds self inflicted and reflecting either accounting or management misplays. At the time, with the updated information I had and staying with my story of Valeant transitioning to a boring drug company, with less attractive margins, I estimated a value per share of $44, above the stock price of $33 at the time. I bought my first batch of shares. In the months that followed, Valeant's woes continued, both in terms of operations and stock price. After it announced a revenue drop and a decline in income in an earnings report in November 2016, the stock hit $14 and I had no choice but to revisit it, with a fresh valuation. Adjusting the valuation for the new numbers (and a more pessimistic take on how long it would take for the company to make its way back to being a conventional, R&D-driven pharmaceutical company, I valued the shares at $32.50. That may have been hopeful thinking but I added to my holdings at around $14/share.
Valeant: Updating the NumbersSince that valuation, not much has gone well for the company and its most recent earnings report suggests that its transition back to health is still hitting roadblocks. While talk of imminent default seems to have subsided, there seems to be overwhelming pessimism on the company's operating prospects, at least in the near term. In its most recent earnings report, Valeant reported further deterioration in key numbers: table.tableizer-table { font-size: 12px; border: 1px solid #CCC; font-family: Arial, Helvetica, sans-serif; } .tableizer-table td { padding: 4px; margin: 3px; border: 1px solid #CCC; } .tableizer-table th { background-color: #104E8B; color: #FFF; font-weight: bold; }
2016 10K2015 10K% ChangeRevenues$9,674.00 $10,442.00 -7.35%Operating income or EBIT$3,105.46 $4,550.38 -31.75%Interest expense$1,836.00 $1,563.00 17.47%Book value of equity$3,258.00 $6,029.00 -45.96%Book value of debt$29,852.00 $31,104.00 -4.03%Much as I would like to believe that this decline is short term and that the stock will come back, there is now a real chance that my story for Valeant, not an optimistic and uplifting story to begin with, is now broken. The company's growth strategy of acquiring other companies, using huge amounts of debt, raising prices on "under priced" drugs and paying as little in taxes as possible were perhaps legally defensible but they were ethically questionable and may have damaged its reputation and credibility so thoroughly that it is now unable to get back to normalcy. This can explain why the company has had so much trouble not only in getting its operations back on track but also why it has been unable to pivot to being a more traditional drug company. If researchers are leery about working in your R&D department, if every price increase you try to make faces scrutiny and push back and your credibility with markets is rock bottom, making the transition will be tough to do. It can also indirectly explain why Valeant may be having trouble selling some of its most lucrative assets, as potential buyers seem wary of the corporate taint and perhaps have lingering doubts about whether they can trust Valeant's numbers.
In fact, the one silver lining that may emerge from this experience is that I now have the perfect example to illustrate why being a business entity that violates the norms of good corporate behavior (even if their actions legal) can destroy value. At least in sectors like health care, where the government is a leading customer and predatory pricing can lead to more than just public shaming, the Valeant story should be a cautionary note for others in the sector who may be embarking on similar paths.
The Ackman EffectYou may find it strange that I would spend this much time talking about Valeant without mentioning what may seem to be the big story about the stock, which is that Bill Ackman, long the company's biggest investor and cheerleader and for much of the last two years, a powerful board member, has admitted defeat, selling the shares that Pershing Square (his investment vehicle) has held in Valeant for about $11 per share, representing a staggering loss of almost 90% on his investment. The reasons for my lack of response are similar Don't get me wrong! I think Bill Ackman, notwithstanding his Valeant setbacks, is an accomplished investor whose wins outnumber his losses and when he takes a position (long or short) in a stock, I will check it out. That said, I did not buy Valeant because Ackman owned the stock and I am not selling, just because he sold. In fact, and this may seem like a stretch, it is possible that Ackman's presence in the company and the potential veto power that he might have been exercising over big decisions may have become more of an impediment than a help as the company tries to untangle itself from its past. I am not sure how well-sourced these stories are, but there are some that suggest that it was Ackman who was the obstacle to a Salix sale last year.
Valeant: Three OutcomesAs I see it, there are three paths that Valeant can take, going forward.1. Going Concern: To value Valeant as a going concern, I revisited my valuation from November 2016 and made its pathway to stable drug company more rocky by assuming that revenues would continue to drop 2% a year and margins will stay depressed at 2016 levels for the next 5 years and that revenue growth will stay anemic (3% a year) after that, with a moderate improvement in margins. With those changes put in and leaving the likelihood that the company will not make it at 10% (since the company has made some headway in reducing debt), the value per share that I get is $13.68.
 Download spreadsheetTo illustrate the uncertainty associated with this value estimate, I ran a simulation with my estimated distributions for revenue growth, margins and cost of capital and arrived at the following distribution of values.
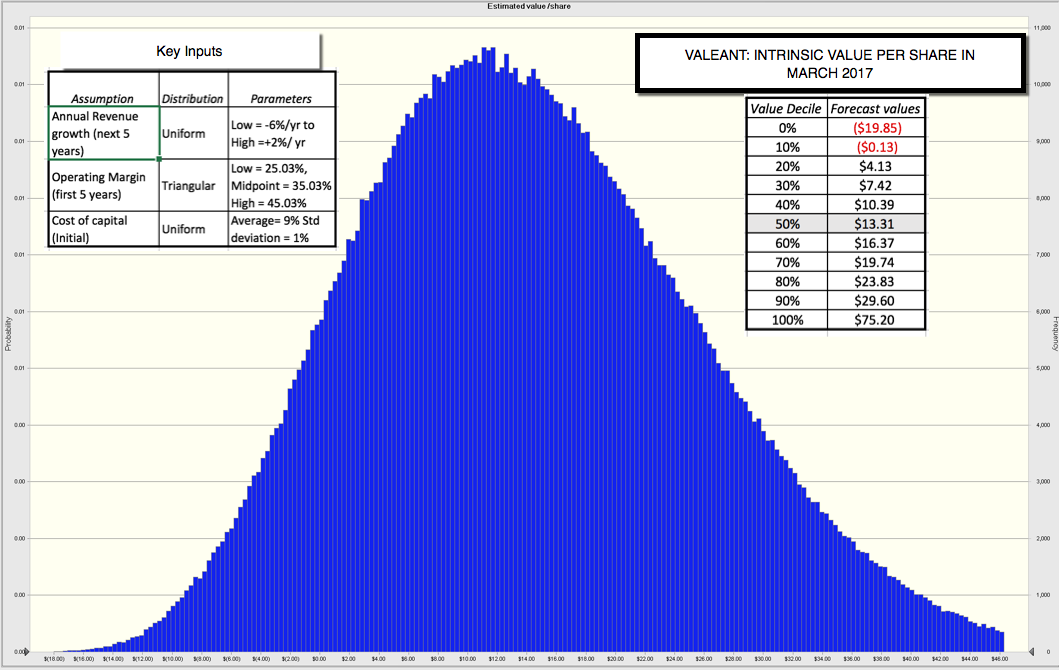 The simulation confirms the base case intrinsic valuation, insofar as the median value of $13.31 is close to the price at the time of the valuation ($12) but it provides more information that may or may not tilt the investment decision. There is a clear chance that the equity could go to zero (about 12%), if the value dips below the outstanding debt ($29 billion). At the same time, there is significant upside, if the company can find a way to alter its trajectory and become a boring, low growth drug company.2. Acquisition Target: It is a sign of desperation when as an investor, your best hope is that someone else will acquire your company and pay a premium for it. I am afraid that the Valeant taint so strong and its structure so opaque and complex that very few acquirers will want to buy the entire company. I see little chance of this bailing me out.3. Sum of its parts, liquidated: It is true that Valeant has some valuable pieces in it, with Bausch & Lomb and Salix being the biggest prices. While neither business has attracted as much attention as Valeant had hoped, there are two reasons why. The first is that Ackman, with significant losses on the stock and a seat on the board, may have exercised some veto power over any potential sales. The second is that potential buyers may be scared away by Valeant's history. One solution, now that Ackman is no longer at the company, is for Valeant to open its books to potential acquirers and sell its assets individually to the best possible buyers. Note that this liquidation value will have to exceed $29 billion, the outstanding debt, for equity investors to generate any remaining cash.
There is one other macro concern that may make Valeant's future more thorny. As a company that pays a low effective tax rate and borrows lots of money, the proposed changes to the tax law (where the marginal tax rate is likely to be reduced and the tax savings from interest expenses curbed), Valeant will probably have to pay a much higher effective tax rate going forward, one reason why I have shifted to a 30% tax rate for the future.
The Bottom LineLet's start with the easy judgment. This was not an investment that I should have made and much as I would like to blame macro forces, the company's management and Bill Ackman for my losses, this was my mistake. I was right in my initial post in concluding that the company's old business model (of acquiring growth with borrowed money and repricing drugs) was broken but I clearly underestimated how much damage that model has done to the company's reputation and how much work it will take for it to become a boring, drug company. In fact, it is possible that the damage is so severe, the company will not be able to make the adjustments necessary to survive as a going concern.
So, now what? I cannot reverse the consequences of my original sin (of buying Valeant at $32) in April 2017 and the secondary sin (of doubling down, when Valeant was trading at $14) by selling now. The question then becomes a simple one. Would I buy Valeant at today's price? If the answer is yes, I should hold and if the answer is no, I should fold. My intrinsic value per share has dropped to just above where the stock is trading at now, and at this stage, my judgment is that, valued as a going concern, it would be trading slightly under value. In a strange way, Bill Ackman's exit is what tipped the scales for me, since it will give Valeant's management, if they are so inclined, the capacity to make the decisions that they may have been constrained from making before. In particular, if they recognize that this may be a clear case where the company is worth more as the sum of its liquidated parts than as a going concern, there is still a chance that I could reduce my losses on this investment. Note, though, that based on my numbers, I don't expect to make my original investment (which averages out to $21/share) back. I am not happy about that but sunk costs are sunk!
As I continue to hold Valeant, I am also aware that I might be committing one of investing's biggest sins, which is an aversion to admitting mistakes by selling losers. My discounted cash flow valuations may be an after-the-fact rationalizing of something that I don't want to do, i.e., sell a big loser. To counter this, I briefly considering selling the shares and rebuying them back immediately; that makes me admit my mistake and take my losses while restarting the investment process with a new buy, but the "wash sales" rule is an impediment to this cleansing exercise. The bottom line is that if I am holding on to Valeant, not for intrinsic value reasons (as I am trying to convince myself) but because I have an investing blind spot, I will be last one to know!
YouTube Video
Previous Posts on Valeant
Checkmate or Stalemate: Valeant's Fall from Investing Grace (November 2015)Valeant: Information Vacuums, Management Credibility and Investment Value (April 2016)Faith, Feedback and Fear: The Valeant Test (November 2016)Spreadsheets
Valeant Valuation: March 2017
A Valeant Update: Damaged Goods or Deeply Discount Drug Company?
Rats get a bad rap for fleeing sinking ships. After all, given that survival is the strongest evolutionary impulse and that rats are not high up in the food chain, why would they not? That idiom, unfortunately, is what came to mind as I took another look at Valeant, the vessel in my investment portfolio that most closely resembles a sinking ship. This is a stock that I had little interest in, during its glory days as the ultimate value investing play, but that I took first a look at, after its precipitous fall from grace in November 2015. While I stayed away from it then, I bought it in May 2016 after it had dropped another 60% and I found it cheap enough to add to my portfolio. I then compounded my losses when I doubled my holding in October 2016, arguing that while it was, at best, an indifferently managed company in a poor business, it was under priced at $14 . With the stock trading at less than $12 (and down to $10.50, as I write this post) and its biggest investor/promoter abandoning it, there is no way that I can avert my eyes any longer from this train wreck. So, here I go!
Valeant: A Short (and Personal) HistoryI won't bore you by repeating (for a third time) the story of Valeant's fall from investment grace, which happened with stunning speed in 2015, as it went from value investing favorite to untouchable, in the matter of months. My first post, from November 2015, examined the company in the aftermath of the fall, as it was touted as a contrarian bet, trading at close to $90, down more than 50% in a few months. My belief then was that the company's business model, built on acquisitions, debt and drug repricing was broken and that the company, if it became a more conventional drug business company, with low growth driven by R&D, was worth $73 per share. I revisited Valeant in April 2016, after the company had gone through a series of additional setbacks, with many of its wounds self inflicted and reflecting either accounting or management misplays. At the time, with the updated information I had and staying with my story of Valeant transitioning to a boring drug company, with less attractive margins, I estimated a value per share of $44, above the stock price of $33 at the time. I bought my first batch of shares. In the months that followed, Valeant's woes continued, both in terms of operations and stock price. After it announced a revenue drop and a decline in income in an earnings report in November 2016, the stock hit $14 and I had no choice but to revisit it, with a fresh valuation. Adjusting the valuation for the new numbers (and a more pessimistic take on how long it would take for the company to make its way back to being a conventional, R&D-driven pharmaceutical company, I valued the shares at $32.50. That may have been hopeful thinking but I added to my holdings at around $14/share.
Valeant: Updating the NumbersSince that valuation, not much has gone well for the company and its most recent earnings report suggests that its transition back to health is still hitting roadblocks. While talk of imminent default seems to have subsided, there seems to be overwhelming pessimism on the company's operating prospects, at least in the near term. In its most recent earnings report, Valeant reported further deterioration in key numbers: table.tableizer-table { font-size: 12px; border: 1px solid #CCC; font-family: Arial, Helvetica, sans-serif; } .tableizer-table td { padding: 4px; margin: 3px; border: 1px solid #CCC; } .tableizer-table th { background-color: #104E8B; color: #FFF; font-weight: bold; }
2016 10K2015 10K% ChangeRevenues$9,674.00 $10,442.00 -7.35%Operating income or EBIT$3,105.46 $4,550.38 -31.75%Interest expense$1,836.00 $1,563.00 17.47%Book value of equity$3,258.00 $6,029.00 -45.96%Book value of debt$29,852.00 $31,104.00 -4.03%Much as I would like to believe that this decline is short term and that the stock will come back, there is now a real chance that my story for Valeant, not an optimistic and uplifting story to begin with, is now broken. The company's growth strategy of acquiring other companies, using huge amounts of debt, raising prices on "under priced" drugs and paying as little in taxes as possible were perhaps legally defensible but they were ethically questionable and may have damaged its reputation and credibility so thoroughly that it is now unable to get back to normalcy. This can explain why the company has had so much trouble not only in getting its operations back on track but also why it has been unable to pivot to being a more traditional drug company. If researchers are leery about working in your R&D department, if every price increase you try to make faces scrutiny and push back and your credibility with markets is rock bottom, making the transition will be tough to do. It can also indirectly explain why Valeant may be having trouble selling some of its most lucrative assets, as potential buyers seem wary of the corporate taint and perhaps have lingering doubts about whether they can trust Valeant's numbers.
In fact, the one silver lining that may emerge from this experience is that I now have the perfect example to illustrate why being a business entity that violates the norms of good corporate behavior (even if their actions legal) can destroy value. At least in sectors like health care, where the government is a leading customer and predatory pricing can lead to more than just public shaming, the Valeant story should be a cautionary note for others in the sector who may be embarking on similar paths.
The Ackman EffectYou may find it strange that I would spend this much time talking about Valeant without mentioning what may seem to be the big story about the stock, which is that Bill Ackman, long the company's biggest investor and cheerleader and for much of the last two years, a powerful board member, has admitted defeat, selling the shares that Pershing Square (his investment vehicle) has held in Valeant for about $11 per share, representing a staggering loss of almost 90% on his investment. The reasons for my lack of response are similar Don't get me wrong! I think Bill Ackman, notwithstanding his Valeant setbacks, is an accomplished investor whose wins outnumber his losses and when he takes a position (long or short) in a stock, I will check it out. That said, I did not buy Valeant because Ackman owned the stock and I am not selling, just because he sold. In fact, and this may seem like a stretch, it is possible that Ackman's presence in the company and the potential veto power that he might have been exercising over big decisions may have become more of an impediment than a help as the company tries to untangle itself from its past. I am not sure how well-sourced these stories are, but there are some that suggest that it was Ackman who was the obstacle to a Salix sale last year.
Valeant: Three OutcomesAs I see it, there are three paths that Valeant can take, going forward.1. Going Concern: To value Valeant as a going concern, I revisited my valuation from November 2016 and made its pathway to stable drug company more rocky by assuming that revenues would continue to drop 2% a year and margins will stay depressed at 2016 levels for the next 5 years and that revenue growth will stay anemic (3% a year) after that, with a moderate improvement in margins. With those changes put in and leaving the likelihood that the company will not make it at 10% (since the company has made some headway in reducing debt), the value per share that I get is $13.68.
Download spreadsheetTo illustrate the uncertainty associated with this value estimate, I ran a simulation with my estimated distributions for revenue growth, margins and cost of capital and arrived at the following distribution of values.
The simulation confirms the base case intrinsic valuation, insofar as the median value of $13.31 is close to the price at the time of the valuation ($12) but it provides more information that may or may not tilt the investment decision. There is a clear chance that the equity could go to zero (about 12%), if the value dips below the outstanding debt ($29 billion). At the same time, there is significant upside, if the company can find a way to alter its trajectory and become a boring, low growth drug company.2. Acquisition Target: It is a sign of desperation when as an investor, your best hope is that someone else will acquire your company and pay a premium for it. I am afraid that the Valeant taint so strong and its structure so opaque and complex that very few acquirers will want to buy the entire company. I see little chance of this bailing me out.3. Sum of its parts, liquidated: It is true that Valeant has some valuable pieces in it, with Bausch & Lomb and Salix being the biggest prices. While neither business has attracted as much attention as Valeant had hoped, there are two reasons why. The first is that Ackman, with significant losses on the stock and a seat on the board, may have exercised some veto power over any potential sales. The second is that potential buyers may be scared away by Valeant's history. One solution, now that Ackman is no longer at the company, is for Valeant to open its books to potential acquirers and sell its assets individually to the best possible buyers. Note that this liquidation value will have to exceed $29 billion, the outstanding debt, for equity investors to generate any remaining cash.There is one other macro concern that may make Valeant's future more thorny. As a company that pays a low effective tax rate and borrows lots of money, the proposed changes to the tax law (where the marginal tax rate is likely to be reduced and the tax savings from interest expenses curbed), Valeant will probably have to pay a much higher effective tax rate going forward, one reason why I have shifted to a 30% tax rate for the future.
The Bottom LineLet's start with the easy judgment. This was not an investment that I should have made and much as I would like to blame macro forces, the company's management and Bill Ackman for my losses, this was my mistake. I was right in my initial post in concluding that the company's old business model (of acquiring growth with borrowed money and repricing drugs) was broken but I clearly underestimated how much damage that model has done to the company's reputation and how much work it will take for it to become a boring, drug company. In fact, it is possible that the damage is so severe, the company will not be able to make the adjustments necessary to survive as a going concern.
So, now what? I cannot reverse the consequences of my original sin (of buying Valeant at $32) in April 2017 and the secondary sin (of doubling down, when Valeant was trading at $14) by selling now. The question then becomes a simple one. Would I buy Valeant at today's price? If the answer is yes, I should hold and if the answer is no, I should fold. My intrinsic value per share has dropped to just above where the stock is trading at now, and at this stage, my judgment is that, valued as a going concern, it would be trading slightly under value. In a strange way, Bill Ackman's exit is what tipped the scales for me, since it will give Valeant's management, if they are so inclined, the capacity to make the decisions that they may have been constrained from making before. In particular, if they recognize that this may be a clear case where the company is worth more as the sum of its liquidated parts than as a going concern, there is still a chance that I could reduce my losses on this investment. Note, though, that based on my numbers, I don't expect to make my original investment (which averages out to $21/share) back. I am not happy about that but sunk costs are sunk!
As I continue to hold Valeant, I am also aware that I might be committing one of investing's biggest sins, which is an aversion to admitting mistakes by selling losers. My discounted cash flow valuations may be an after-the-fact rationalizing of something that I don't want to do, i.e., sell a big loser. To counter this, I briefly considering selling the shares and rebuying them back immediately; that makes me admit my mistake and take my losses while restarting the investment process with a new buy, but the "wash sales" rule is an impediment to this cleansing exercise. The bottom line is that if I am holding on to Valeant, not for intrinsic value reasons (as I am trying to convince myself) but because I have an investing blind spot, I will be last one to know!
YouTube Video
Previous Posts on Valeant
Checkmate or Stalemate: Valeant's Fall from Investing Grace (November 2015)Valeant: Information Vacuums, Management Credibility and Investment Value (April 2016)Faith, Feedback and Fear: The Valeant Test (November 2016)Spreadsheets
Valeant Valuation: March 2017
March 10, 2017
January 2017 Data Update 10: The Pricing Game!
It's taken me a while to get here, but in this, the last of my ten posts looking at publicly traded companies globally, I look at pricing differences across regions and sectors. I laid out my rationale for looking at pricing in my most recent post on the topic, where I drew a distinction between good companies, good management and good investments, arguing that investing is about finding mismatches between reality (as driven by cash flows, growth and risk) and perception (as determined by the market).
Multiple = Standardized PriceWhen looking at how stocks are priced and especially when comparing pricing across stocks, we almost invariably look at pricing multiples (PE, EV to EBITDA) rather than absolute prices. That is because prices per share are a function of the number of shares and are, in a sense, almost arbitrary. Before you respond with indignation, what I mean to say is that I can make the price per share decrease from $100/share to $10/share, by instituting a ten for one stock split, without changing anything about the company. As a consequence, a stock cannot be classified as cheap or expensive based on price per share and you can find Berkshire Hathaway to be under valued at $263,500 per share, while viewing a stock trading at 5 cents per share as hopelessly overvalued.
The process of standardizing prices is straight forward. In the numerator, you need a market measure of value of equity, the entire firm (debt + equity) or the operating assets of the firm (debt + equity -cash = enterprise value). If you confused about the distinction, you may want to review this post of mine from the archives. In the denominator, you can scale the market value to revenues, earnings, accounting estimates of value (book value) or cash flows.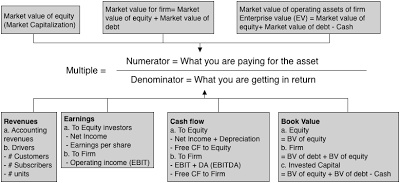
As you can see, there is a very large number of standardized versions of value that you can calculate for firms, especially if you bring in variants on each individual variable in the denominator. With net income, for instance, you can look at income in the last fiscal year (current), the last twelve months (trailing) or the next year (forward). The one simple proposition that you should always follow is to be consistent in your definition of multiple.
The "Consistent Multiple" Rule: If your numerator is the market value of equity (market capitalization or price per share), your denominator has to be an equity measure as well (net income or earnings per share, book value of equity. For example, a price earnings ratio is consistent, since both the numerator and denominator are equity values, and so is an EV to EBITDA multiple. A Price to EBITDA or a Price to Sales ratio is inconsistent, since the numerator is an equity value and the denominator is to the entire business, and will lead to conclusions that are not merited by the fundamentals.
Pricing – A Global PictureTo see how stocks are priced around the world at the start of 2017, I focus on four multiples, the price earnings ratio, the price to book (equity) ratio, the EV/Sales multiple and EV/EBITDA. With each multiple, I will start with a histogram describing how stocks are priced globally (with sub-sector specifics) and then provide country specific numbers in heat maps.
PE ratio The PE ratio has many variants, some related to what period the earnings per share is measured (current, trailing or forward), some relating to whether the earnings per share are primary or diluted and some a function of whether and how you adjust for extraordinary items. If you superimpose on top of these differences the fact that earnings per share reported by companies reflect very different accounting standards around the world, you can already start to see the caveats roll out. That said, it is still useful to start with a histogram of PE ratios of all publicly traded companies around the world: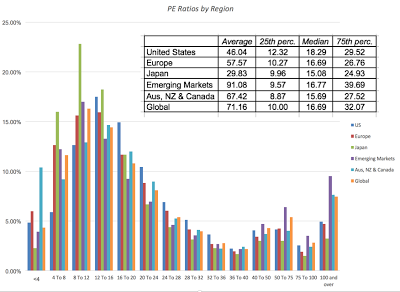 Damodaran Online (data)Note that of the 42,668 firms in my global sample, there were only 25,493 firms that made it through into this graph; the rest of the sample (about 40%) had negative earnings per share and the PE ratios was not meaningful. While the histogram provides the distributions by regional sub-groups, the heat map below provides the median PE ratio by country:
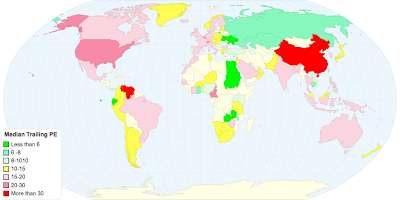 Live Heat Map
If you go to the live heat map, you will also be able to see the 25th and 75th quartiles within each country, or you can download the spreadsheet that contains the data. I mistrust PE ratios for many reasons. First, the more accountants can work on a number, the less trustworthy it becomes, and there is no more massaged, manipulated and mangled variable than earnings per share. Second, the sampling bias introduced by eliminating a large subset of your sample, by eliminating money losing companies, is immense. Third, it is the most volatile of all of the multiples as it is based upon earnings per share.
Price to Book In many ways, the price to book ratio confronts investors on a fundamental question of whether they trust markets or accountants more, by scaling the market’s estimate of what a company is worth (the market capitalization) to what the accountants consider the company’s value (book value of equity). The rules of thumb that have been build around book value go back in history to the origins of value investing and all make implicit assumptions about what book value measures in the first place. Again, I will start with the histogram for all global stocks, with the table at the regional level imposed on it: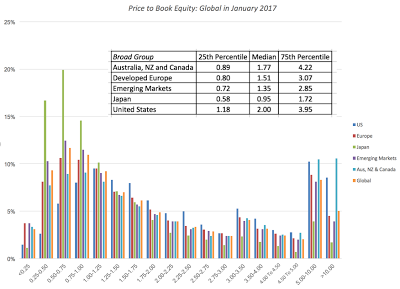 Damodaran Online (data)The price to book ratio has better sampling properties than price earnings ratios for the simple reason that there are far fewer firms with negative book equities (only about 10% of all firms globally) than with negative earnings. If you believe, as some do, that stocks that trade at less than book value are cheap, there is good news: you have lots and lots of buying opportunities (including the entire Japanese market). Following up, let’s take a look in the heat map below of median price to book ratios, by country.
 Live Heat MapAgain, you can see the 25th and 75th quartiles in either the live map or by downloading the spreadsheet with the data. Pausing to look at the numbers, note the countries shaded in green, which are the cheapest in the world, at least on a price to book basis, are concentrated in Africa and Eastern Europe, arguably among the riskiest parts of the world. The most expensive countries are China, a couple of outliers in Africa (Ivory Coast and Senegal, with very small sample sizes) and Argentina, a bit of a surprise.
EV to EBITDA The EV to EBITDA multiple has quickly grown in favor among analysts, for some good reasons and some bad. Among the good reasons, it is less affected by different financial leverage policies than PE ratios (but it is not immune) and depreciation methods than other earnings multiples. Among the bad ones is that it is a cash flow measure based on a dangerously loose definition of cash flow that works only if you live in a world where there are no taxes, debt payments and capital expenditures laying claim on those cash flows. The global histogram of EV to EBITDA multiples share the positive skew of the other multiples, with the peak to the left and the tail to the right: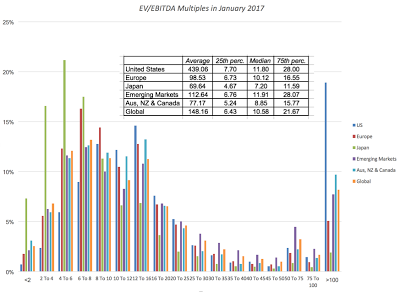 Damodaran Online (data)Again, there will be firms that had negative EBITDA that did not make the cut, but they are fewer in number than those with negative EPS. Looking at the median EV to EBITDA multiple by country in the heat map below, you can see the cheap spots and the expensive ones.
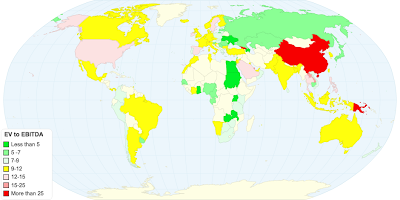 Live Heat MapAs with the other data, you can get the lower and higher quartile data in the spreadsheet. As with price to book, the cheapest countries in the world lie in some of the riskiest parts of the world, in Africa and Eastern Europe. China remains among the most expensive countries in the world but Argentina which also made the list, on a price to book basis, drops back to the pack.
EV to Sales If you share my fear of accounting game playing, you probably also feel more comfortable working with revenues, the number on which accountants have the fewest degrees of freedom. Let’s start with the histogram for global stocks: Damodaran Online (Data)Of all the multiples, this should be the one where you lose the least companies (though many financial service companies don’t report conventional revenues) and the one that you can use even on young companies that are working their way through the early stages of the life cycle. The median EV/Sales ratio for each country are in the heat map below:
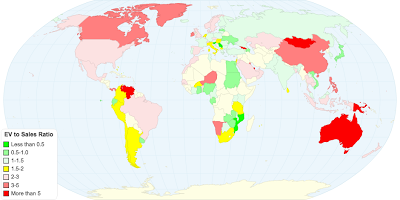 Live Heat MapYou can download more extensive numbers in the spreadsheet. By now, the familiar pattern reasserts itself, with East European and African companies looking cheap and China looking expensive. With revenue multiples, Canada and Australia also enter the overvalued list, perhaps because of the preponderance of natural resource companies in these countries.
Pricing – Sector Differences All of the multiples that I talked about in the last section can also be computed at the industry level and it is worth doing so, partly to gain perspective on what comprises cheap and expensive in each grouping and partly to look for under and over priced groupings. The following table, lists the ten lowest-priced and highest priced industry groups at the start of 2017, based upon trailing PE: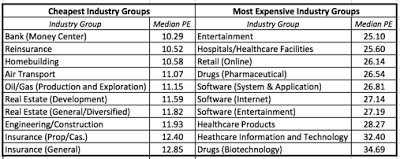 Multiples by SectorIn many of the cheapest sectors, the reasons for the low pricing are fundamental: low growth, high risk and an inability to generate high returns on equity or margins. Similarly, the highest PE sectors also tend to be in higher growth, high return on equity businesses. I will leave the judgment to you whether any fit the definition of a cheap company. The entire list of multiples, by sector, can be obtained by clicking on this spreadsheet.
One comparison that you may consider making is to pick and multiple and trace how it has changed over time for an industry group. Isolating pharmaceutical and biotechnology companies in the United States, for instance, here is what I find when it comes to EV to EBITR&D for the two groups over time:
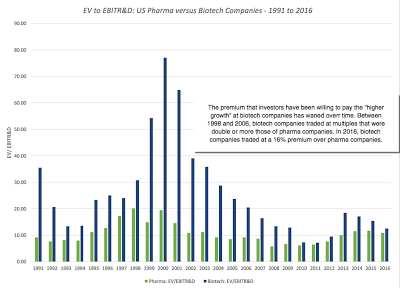
You can read this graph in one of two ways. If you are a firm believer in mean reversion, you would load up on biotech stocks and hope that they revert back to their pre-2006 premiums, but I think you would be on dangerous ground. The declining premium is just as much a function of a changing health care business (with less pricing power for drug companies), increasing scale at biotech companies and more competition.
Rules for the Road
Absolute rules of thumb are dangerous (and lazy): The investing world is full of rules of thumb for finding bargains. Companies that trade at less than book value are cheap, as are companies that trade at less than six times EBITDA or have PEG ratios less than one. Many of these rules have their roots in a different age, when data was difficult to access and there were no ready tools for analyzing them, other than abacuses and ledger sheets. In Ben Graham's day, the very fact that you had collected the data to run his "cheap stock" screens was your competitive advantage. In today's market, where you can download the entire market with the click of a button and tailor your Excel spreadsheet to compute and screen, it strikes me as odd that screens still remain based on absolute values. If you want to find cheap companies based upon EV to EBITDA, why not just compute the number for every company (as I have in my histogram) and then use the first quartile (25th percentile) as your cut off for cheap. By my calculations, a company with an EV/EBITDA of 7.70 would be cheap in the United States but you would need an EV to EBITDA less than 4.67 to be cheap in Japan, at least in January 2017.Most stocks that look cheap deserve to be cheap: If your investment strategy is buying stocks that trade at low multiples of earnings and book value and waiting for them to recover, you are playing a game of mean reversion. It may work for you, but there is little that you are bringing to the investing table, and there is little that I would expect you to take away. If you want to price a stock, you have to bring in not just how cheap it is but also look at measures of value that may explain why the stock is cheap. If you are paying a price, you are "estimating" the future: When I do an intrinsic valuation (as I did a couple of weeks ago with Snap), I am often taken to task by some readers for playing God, i.e., forecasting revenue growth, margins and risk for a company with a very uncertain future. I accept that critique but I don't see an alternative. If your view is that using a multiple lets you evade this responsibility, it is because you have chosen not to look under the hood, If you pay 50 times revenues for a company, which is what you might be with Snap, you are making assumptions about revenue growth and margins, whether you like it or not. The only difference between us seems to be that I am being explicit about my assumptions, whereas your assumptions are implicit. In fact, they may be so implicit that you don't even know what they are, a decidedly dangerous place to be in investing.YouTube Video
Data Links
PE, PBV, EV to EBITDA and EV to Sales by Country: January 2017PE, PBV, EV to EBITDA and EV to Sales by Industry Group: January 2017
Data 2017 Posts
Data Update 1: The Promise and Perils of Big DataData Update 2: The Resilience of US EquitiesData Update 3: Cracking the Currency Code - January 2017Data Update 4: Country Risk and Pricing, January 2017Data Update 5: A Taxing Year Ahead?Data Update 6: The Cost of Capital in January 2017Data Update 7: Profitability, Excess Returns and Corporate Governance- January 2017Data Update 8: The Debt Trade off in January 2017Data Update 9: Dividends and Buybacks in 2017Data Update 10: The Pricing Game
Multiple = Standardized PriceWhen looking at how stocks are priced and especially when comparing pricing across stocks, we almost invariably look at pricing multiples (PE, EV to EBITDA) rather than absolute prices. That is because prices per share are a function of the number of shares and are, in a sense, almost arbitrary. Before you respond with indignation, what I mean to say is that I can make the price per share decrease from $100/share to $10/share, by instituting a ten for one stock split, without changing anything about the company. As a consequence, a stock cannot be classified as cheap or expensive based on price per share and you can find Berkshire Hathaway to be under valued at $263,500 per share, while viewing a stock trading at 5 cents per share as hopelessly overvalued.
The process of standardizing prices is straight forward. In the numerator, you need a market measure of value of equity, the entire firm (debt + equity) or the operating assets of the firm (debt + equity -cash = enterprise value). If you confused about the distinction, you may want to review this post of mine from the archives. In the denominator, you can scale the market value to revenues, earnings, accounting estimates of value (book value) or cash flows.
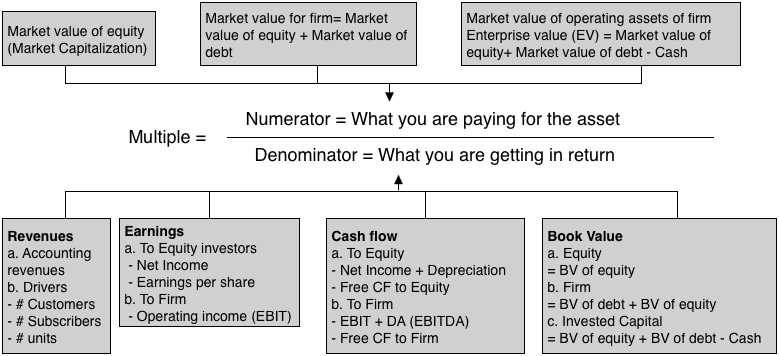
As you can see, there is a very large number of standardized versions of value that you can calculate for firms, especially if you bring in variants on each individual variable in the denominator. With net income, for instance, you can look at income in the last fiscal year (current), the last twelve months (trailing) or the next year (forward). The one simple proposition that you should always follow is to be consistent in your definition of multiple.
The "Consistent Multiple" Rule: If your numerator is the market value of equity (market capitalization or price per share), your denominator has to be an equity measure as well (net income or earnings per share, book value of equity. For example, a price earnings ratio is consistent, since both the numerator and denominator are equity values, and so is an EV to EBITDA multiple. A Price to EBITDA or a Price to Sales ratio is inconsistent, since the numerator is an equity value and the denominator is to the entire business, and will lead to conclusions that are not merited by the fundamentals.
Pricing – A Global PictureTo see how stocks are priced around the world at the start of 2017, I focus on four multiples, the price earnings ratio, the price to book (equity) ratio, the EV/Sales multiple and EV/EBITDA. With each multiple, I will start with a histogram describing how stocks are priced globally (with sub-sector specifics) and then provide country specific numbers in heat maps.
PE ratio The PE ratio has many variants, some related to what period the earnings per share is measured (current, trailing or forward), some relating to whether the earnings per share are primary or diluted and some a function of whether and how you adjust for extraordinary items. If you superimpose on top of these differences the fact that earnings per share reported by companies reflect very different accounting standards around the world, you can already start to see the caveats roll out. That said, it is still useful to start with a histogram of PE ratios of all publicly traded companies around the world:
 Damodaran Online (data)Note that of the 42,668 firms in my global sample, there were only 25,493 firms that made it through into this graph; the rest of the sample (about 40%) had negative earnings per share and the PE ratios was not meaningful. While the histogram provides the distributions by regional sub-groups, the heat map below provides the median PE ratio by country:
 Live Heat Map
If you go to the live heat map, you will also be able to see the 25th and 75th quartiles within each country, or you can download the spreadsheet that contains the data. I mistrust PE ratios for many reasons. First, the more accountants can work on a number, the less trustworthy it becomes, and there is no more massaged, manipulated and mangled variable than earnings per share. Second, the sampling bias introduced by eliminating a large subset of your sample, by eliminating money losing companies, is immense. Third, it is the most volatile of all of the multiples as it is based upon earnings per share.
Price to Book In many ways, the price to book ratio confronts investors on a fundamental question of whether they trust markets or accountants more, by scaling the market’s estimate of what a company is worth (the market capitalization) to what the accountants consider the company’s value (book value of equity). The rules of thumb that have been build around book value go back in history to the origins of value investing and all make implicit assumptions about what book value measures in the first place. Again, I will start with the histogram for all global stocks, with the table at the regional level imposed on it:
 Damodaran Online (data)The price to book ratio has better sampling properties than price earnings ratios for the simple reason that there are far fewer firms with negative book equities (only about 10% of all firms globally) than with negative earnings. If you believe, as some do, that stocks that trade at less than book value are cheap, there is good news: you have lots and lots of buying opportunities (including the entire Japanese market). Following up, let’s take a look in the heat map below of median price to book ratios, by country.
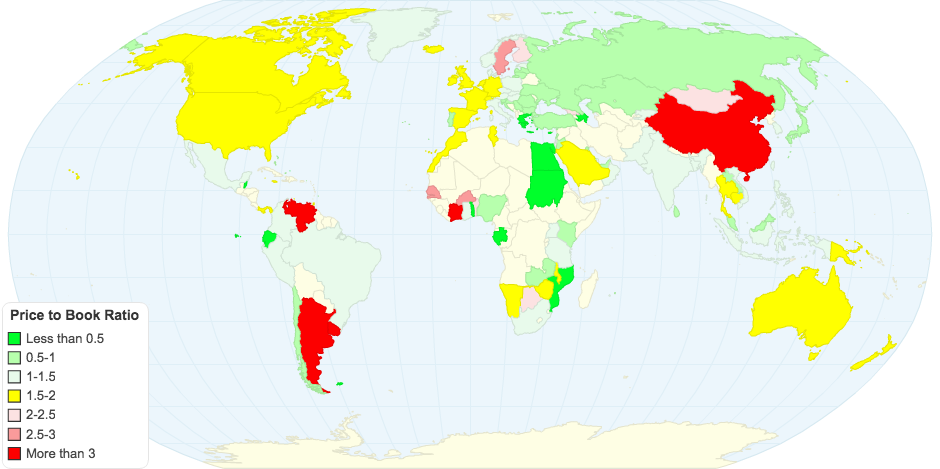 Live Heat MapAgain, you can see the 25th and 75th quartiles in either the live map or by downloading the spreadsheet with the data. Pausing to look at the numbers, note the countries shaded in green, which are the cheapest in the world, at least on a price to book basis, are concentrated in Africa and Eastern Europe, arguably among the riskiest parts of the world. The most expensive countries are China, a couple of outliers in Africa (Ivory Coast and Senegal, with very small sample sizes) and Argentina, a bit of a surprise.
EV to EBITDA The EV to EBITDA multiple has quickly grown in favor among analysts, for some good reasons and some bad. Among the good reasons, it is less affected by different financial leverage policies than PE ratios (but it is not immune) and depreciation methods than other earnings multiples. Among the bad ones is that it is a cash flow measure based on a dangerously loose definition of cash flow that works only if you live in a world where there are no taxes, debt payments and capital expenditures laying claim on those cash flows. The global histogram of EV to EBITDA multiples share the positive skew of the other multiples, with the peak to the left and the tail to the right:
 Damodaran Online (data)Again, there will be firms that had negative EBITDA that did not make the cut, but they are fewer in number than those with negative EPS. Looking at the median EV to EBITDA multiple by country in the heat map below, you can see the cheap spots and the expensive ones.
 Live Heat MapAs with the other data, you can get the lower and higher quartile data in the spreadsheet. As with price to book, the cheapest countries in the world lie in some of the riskiest parts of the world, in Africa and Eastern Europe. China remains among the most expensive countries in the world but Argentina which also made the list, on a price to book basis, drops back to the pack.
EV to Sales If you share my fear of accounting game playing, you probably also feel more comfortable working with revenues, the number on which accountants have the fewest degrees of freedom. Let’s start with the histogram for global stocks:
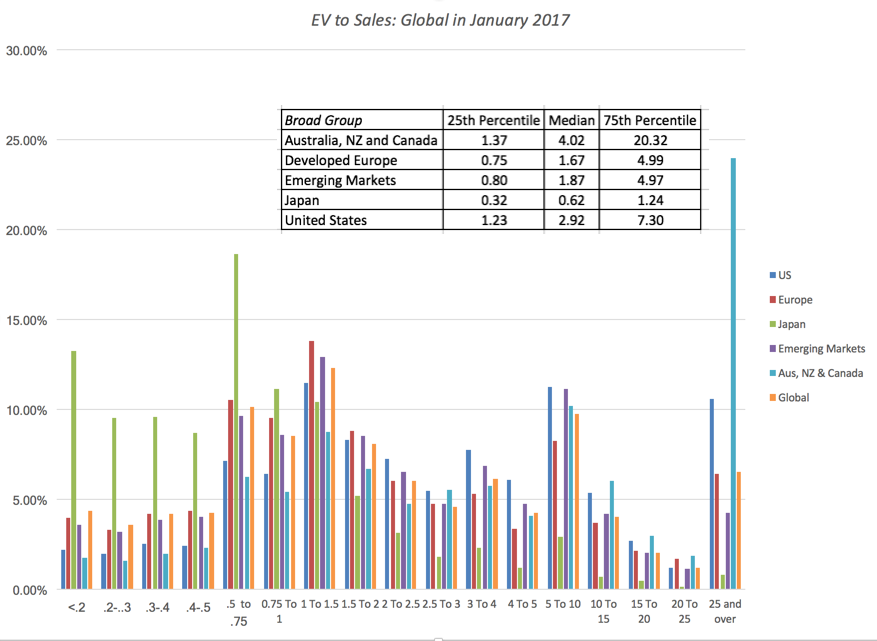 Damodaran Online (Data)Of all the multiples, this should be the one where you lose the least companies (though many financial service companies don’t report conventional revenues) and the one that you can use even on young companies that are working their way through the early stages of the life cycle. The median EV/Sales ratio for each country are in the heat map below:
 Live Heat MapYou can download more extensive numbers in the spreadsheet. By now, the familiar pattern reasserts itself, with East European and African companies looking cheap and China looking expensive. With revenue multiples, Canada and Australia also enter the overvalued list, perhaps because of the preponderance of natural resource companies in these countries.
Pricing – Sector Differences All of the multiples that I talked about in the last section can also be computed at the industry level and it is worth doing so, partly to gain perspective on what comprises cheap and expensive in each grouping and partly to look for under and over priced groupings. The following table, lists the ten lowest-priced and highest priced industry groups at the start of 2017, based upon trailing PE:
 Multiples by SectorIn many of the cheapest sectors, the reasons for the low pricing are fundamental: low growth, high risk and an inability to generate high returns on equity or margins. Similarly, the highest PE sectors also tend to be in higher growth, high return on equity businesses. I will leave the judgment to you whether any fit the definition of a cheap company. The entire list of multiples, by sector, can be obtained by clicking on this spreadsheet.
One comparison that you may consider making is to pick and multiple and trace how it has changed over time for an industry group. Isolating pharmaceutical and biotechnology companies in the United States, for instance, here is what I find when it comes to EV to EBITR&D for the two groups over time:

You can read this graph in one of two ways. If you are a firm believer in mean reversion, you would load up on biotech stocks and hope that they revert back to their pre-2006 premiums, but I think you would be on dangerous ground. The declining premium is just as much a function of a changing health care business (with less pricing power for drug companies), increasing scale at biotech companies and more competition.
Rules for the Road
Absolute rules of thumb are dangerous (and lazy): The investing world is full of rules of thumb for finding bargains. Companies that trade at less than book value are cheap, as are companies that trade at less than six times EBITDA or have PEG ratios less than one. Many of these rules have their roots in a different age, when data was difficult to access and there were no ready tools for analyzing them, other than abacuses and ledger sheets. In Ben Graham's day, the very fact that you had collected the data to run his "cheap stock" screens was your competitive advantage. In today's market, where you can download the entire market with the click of a button and tailor your Excel spreadsheet to compute and screen, it strikes me as odd that screens still remain based on absolute values. If you want to find cheap companies based upon EV to EBITDA, why not just compute the number for every company (as I have in my histogram) and then use the first quartile (25th percentile) as your cut off for cheap. By my calculations, a company with an EV/EBITDA of 7.70 would be cheap in the United States but you would need an EV to EBITDA less than 4.67 to be cheap in Japan, at least in January 2017.Most stocks that look cheap deserve to be cheap: If your investment strategy is buying stocks that trade at low multiples of earnings and book value and waiting for them to recover, you are playing a game of mean reversion. It may work for you, but there is little that you are bringing to the investing table, and there is little that I would expect you to take away. If you want to price a stock, you have to bring in not just how cheap it is but also look at measures of value that may explain why the stock is cheap. If you are paying a price, you are "estimating" the future: When I do an intrinsic valuation (as I did a couple of weeks ago with Snap), I am often taken to task by some readers for playing God, i.e., forecasting revenue growth, margins and risk for a company with a very uncertain future. I accept that critique but I don't see an alternative. If your view is that using a multiple lets you evade this responsibility, it is because you have chosen not to look under the hood, If you pay 50 times revenues for a company, which is what you might be with Snap, you are making assumptions about revenue growth and margins, whether you like it or not. The only difference between us seems to be that I am being explicit about my assumptions, whereas your assumptions are implicit. In fact, they may be so implicit that you don't even know what they are, a decidedly dangerous place to be in investing.YouTube Video
Data Links
PE, PBV, EV to EBITDA and EV to Sales by Country: January 2017PE, PBV, EV to EBITDA and EV to Sales by Industry Group: January 2017
Data 2017 Posts
Data Update 1: The Promise and Perils of Big DataData Update 2: The Resilience of US EquitiesData Update 3: Cracking the Currency Code - January 2017Data Update 4: Country Risk and Pricing, January 2017Data Update 5: A Taxing Year Ahead?Data Update 6: The Cost of Capital in January 2017Data Update 7: Profitability, Excess Returns and Corporate Governance- January 2017Data Update 8: The Debt Trade off in January 2017Data Update 9: Dividends and Buybacks in 2017Data Update 10: The Pricing Game
March 9, 2017
Explaining a Paradox: Why Good (Bad) Companies can be Bad (Good)
Investments!
In nine posts, stretched out over almost two months, I have tried to describe how companies around the world make investments, finance them and decide how much cash to return to shareholders. Along the way, I have argued that a preponderance of publicly traded companies, across all regions, have trouble generating returns on the capital invested in them that exceeds the cost of capital. I have also presented evidence that there are entire sectors and regions that are characterized by financing and dividend policies that can be best described as dysfunctional, reflecting management inertia or ineptitude. The bottom line is that there are a lot more bad companies with bad managers than good companies with good ones in the public market place. In this, the last of my posts, I want to draw a distinction between good companies and good investments, arguing that a good company can often be a bad investment and a bad company can just as easily be a good investment. I am also going argue that not all good companies are well managed and that many bad companies have competent management.
Good Businesses, Managers and investments
Investment advice often blurs the line between good companies, good management and good investments, using the argument that for a company to be a "good" company, it has to have good management, and if a company has good management, it should be a good investment. That is not true, but to see why, we have to be explicit about what makes for a good company, how we determine that it has good management and finally, the ingredients for a good investment.
Good and Bad Companies
There are various criteria that get used to determine whether a company is a good one, but every one of them comes with a catch. You could start with profitability, arguing that a company that generates more in profits is better than generates less, but that statement may not be true if the company is capital intensive (and the profits generated are small relative to the capital invested) and/or a risky business, where you need to make a higher return to just break even. You could look at growth, but growth, as I noted in this post, can be good, bad or neutral for value and a company can have high growth, while destroying value. The best measure of corporate quality, for me, is a high excess return, i.e., a return on capital that is vastly higher than its cost of capital, though I have noted my caveats about how return on capital is measured. Reproducing my cross sectional distribution of excess returns across all global companies in January 2017, here is what I get:
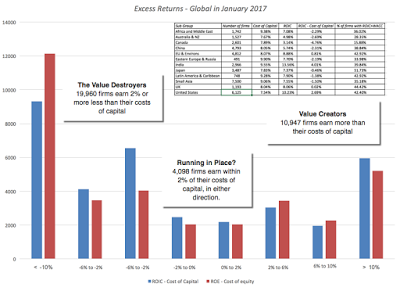 Blog Post on Excess ReturnsTo the extent that you want the capital that you have invested in companies to generate excess returns, you could argue that the good companies in this graph as the value creators and the bad ones are the value destroyers. At least in 2017, there were a lot more value destroyers (19,960) than value creators (10,947) listed globally!
Good and Bad ManagementIf a company generates returns greater (less) than its opportunity cost (cost of capital), can we safely conclude that it is a well (badly) managed company? Not really! The “goodness” or “badness” of a company might just reflect the ageing of the company, its endowed barriers to entry or macro factors (exchange rate movements, country risk or commodity price volatility). The essence of good management is being realistic about where a company is in the life cycle and adapting decision making to reflect reality. If the value of a business is determined by its investment decisions (where it invests scarce resources), financing decisions (the amount and type of debt utilized) and dividend decisions (how much cash to return and in what form to the owners of the business), good management will try to optimize these decisions at their company. For a young growth company, this will translate into making investments that deliver growth and not over using debt or paying much in dividends. As the company matures, good management will shift to playing defense, protecting brand name and franchise value from competitive assault, using more debt and returning more cash to stockholders. At a declining company, the essence of “good” management is to not just avoid taking more investments in a bad business, but to extricate the company from its existing investments and to return cash to the business owners. My way of capturing the quality of a management is to value a company twice, once with the management in place (status quo) and once with new (and "optimal" management).
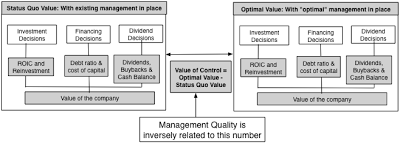
I term the difference between the optimal value and the status quo value the “value of control” but I would argue it is also just as much a measure of management quality, with the value of control shrinking towards zero for “good” managers and increasing for bad ones.
Good and Bad Investments
Now that we have working definitions of good companies and good managers, let’s think about good investments. For a company to be a good investment, you have to bring price into consideration. After all, the greatest company in the world with superb managers can be a bad investment, if it is priced too high. Conversely, the worst company in the world with inept management may be a good investment is the price is low enough. In investing therefore, the comparison is between the value that you attach to a company, given its fundamentals and the price at which it trades.
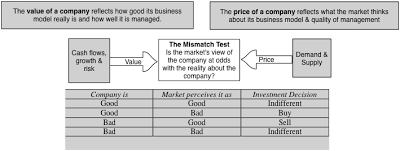
As you can see at the bottom, investing becomes a search for mismatches, where the market's assessment of a company (and it's management) quality is out of sync with reality.
Screening for Mismatches
If you take the last section to heart, you can see why picking stocks to invest in by looking at only one side of the price/value divide can lead you astray. Thus, if your investment strategy is to buy low PE stocks, you may end up with stocks that look cheap but are not good investments, if these are companies that deserve to be cheap (because they have made awful investments, borrowed too much money or adopted cash return policies that destroy value). Conversely, if your investment strategy is focused on finding good companies (strong moats, low risk), you can easily end up with bad investments, if the price already more than reflects these good qualities. In effect, to be a successful investor, you have to find market mismatches, a very good company in terms of business and management that is being priced as a bad company will be your “buy”. With that mission in hand, let’s consider how you can use multiples in screening, using the PE ratio to illustrate the process. To start, here is what we will do. Starting with a very basic dividend discount model, you can back out the fundamentals drivers of the PE ratio: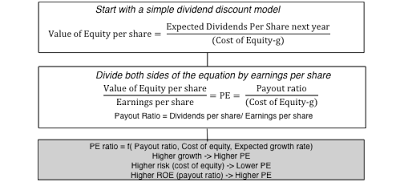
Now what? This equation links PE to three variables, growth, risk (through the cost of equity) and the quality of growth (in the payout ratio or return on equity). Plugging in values for these variables into this equation, you will quickly find that companies that have low growth, high risk and abysmally low returns on equity should trade at low PE ratios and those with higher growth, lower risk and sold returns on equity, should trade at high PE ratios. If you are looking to screen for good investments, you therefore need to find stocks with low PE, high growth, a low cost of equity and a high return on equity. Using this approach, I list multiples and the screening mismatches that characterize cheap and expensive companies.
table.tableizer-table { font-size: 12px; border: 1px solid #CCC; font-family: Arial, Helvetica, sans-serif; } .tableizer-table td { padding: 4px; margin: 3px; border: 1px solid #CCC; } .tableizer-table th { background-color: #104E8B; color: #FFF; font-weight: bold; }
MultipleCheap CompanyExpensive CompanyPELow PE, High growth, Low Equity Risk, High PayoutHigh PE, Low growth, High Equity Risk, Low PayoutPEGLow PEG, Low Growth, Low Equity Risk, High PayoutHigh PEG, High Growth, High Equity Risk, Low PayoutPBVLow PBV, High Growth, Low Equity Risk, High ROEHigh PBV, Low Growth, High Equity Risk, Low ROEEV/Invested CapitalLow EV/IC, High Growth, Low Operating Risk, High ROICHigh EV/IC, Low Growth, High Operating Risk, Low ROICEV/SalesLow EV/Sales, High Growth, Low Operating Risk, High Operating MarginHigh EV/Sales, Low Growth, High Operating Risk, High Operating MarginEV/EBITDALow EV/EBITDA, High Growth, Low Operating Risk, Low Tax RateHigh EV/EBITDA, Low Growth, High Operating Risk, High Tax Rate
If you are wondering about the contrast between equity risk and operating risk, the answer is simple. Operating risk reflects the risk of the businesses that you operate in, whereas equity risk reflects operating risk magnified by financial leverage; the former is measured with the cost of capital whereas the latter is captured in the cost of equity. With payout, my definition is broader than the conventional dividend-based one; I would include stock buybacks in my computation of cash returned, thus bringing a company like Apple to a high payout ratio.
The Bottom Line If the length of this post has led you to completely forget what the point of it was, I don’t blame you. So, let me summarize. Separating good companies from bad ones is easy, determining whether companies are well or badly managed is slightly more complicated but defining which companies are good investments is the biggest challenge. Good companies bring strong competitive advantages to a growing market and their results (high margins, high returns on capital) reflect these advantages. In well managed companies, the investing, financing and dividend decisions reflect what will maximize value for the company, thus allowing for the possibility that you can have good companies that are sub-optimally managed and bad companies that are well managed. Good investments require that you be able to buy at a price that is less than the value of the company, given its business and management.
Thus, you can have good companies become bad investments, if they trade at too high a price, and bad companies become good investments, at a low enough price. Given a choice, I would like to buy great companies with great managers at a great price, but greatness on all fronts is hard to find. So. I’ll settle for a more pragmatic end game. At the right price, I will buy a company in a bad business, run by indifferent managers. At the wrong price, I will avoid even superstar companies. At the risk of over simplifying, here is my buy/sell template: table.tableizer-table { font-size: 12px; border: 1px solid #CCC; font-family: Arial, Helvetica, sans-serif; } .tableizer-table td { padding: 4px; margin: 3px; border: 1px solid #CCC; } .tableizer-table th { background-color: #104E8B; color: #FFF; font-weight: bold; }
Company's BusinessCompany's ManagersCompany PricingInvestment DecisionGood (Strong competitive advantages, Growing market)Good (Optimize investment, financing, dividend decisions)Good (Price < Value)Emphatic BuyGood (Strong competitive advantages, Growing market)Bad (Sub-optimal investment, financing, dividend decisions)Good (Price < Value)Buy & hope for management changeBad (No competitive advantages, Stagnant or shrinking market)Good (Optimize investment, financing, dividend decisions)Good (Price < Value)Buy & hope that management does not changeBad (No competitive advantages, Stagnant or shrinking market)Bad (Sub-optimal investment, financing, dividend decisions)Good (Price < Value)Buy, hope for management change & pray company survivesGood (Strong competitive advantages, Growing market)Good (Optimize investment, financing, dividend decisions)Bad (Price > Value)Admire, but don't buyGood (Strong competitive advantages, Growing market)Bad (Sub-optimal investment, financing, dividend decisions)Bad (Price > Value)Wait for management changeBad (No competitive advantages, Stagnant or shrinking market)Good (Optimize investment, financing, dividend decisions)Bad (Price > Value)SellBad (No competitive advantages, Stagnant or shrinking market)Bad (Sub-optimal investment, financing, dividend decisions)Bad (Price > Value)Emphatic Sell
YouTube Video
Good Businesses, Managers and investments
Investment advice often blurs the line between good companies, good management and good investments, using the argument that for a company to be a "good" company, it has to have good management, and if a company has good management, it should be a good investment. That is not true, but to see why, we have to be explicit about what makes for a good company, how we determine that it has good management and finally, the ingredients for a good investment.
Good and Bad Companies
There are various criteria that get used to determine whether a company is a good one, but every one of them comes with a catch. You could start with profitability, arguing that a company that generates more in profits is better than generates less, but that statement may not be true if the company is capital intensive (and the profits generated are small relative to the capital invested) and/or a risky business, where you need to make a higher return to just break even. You could look at growth, but growth, as I noted in this post, can be good, bad or neutral for value and a company can have high growth, while destroying value. The best measure of corporate quality, for me, is a high excess return, i.e., a return on capital that is vastly higher than its cost of capital, though I have noted my caveats about how return on capital is measured. Reproducing my cross sectional distribution of excess returns across all global companies in January 2017, here is what I get:
 Blog Post on Excess ReturnsTo the extent that you want the capital that you have invested in companies to generate excess returns, you could argue that the good companies in this graph as the value creators and the bad ones are the value destroyers. At least in 2017, there were a lot more value destroyers (19,960) than value creators (10,947) listed globally!
Good and Bad ManagementIf a company generates returns greater (less) than its opportunity cost (cost of capital), can we safely conclude that it is a well (badly) managed company? Not really! The “goodness” or “badness” of a company might just reflect the ageing of the company, its endowed barriers to entry or macro factors (exchange rate movements, country risk or commodity price volatility). The essence of good management is being realistic about where a company is in the life cycle and adapting decision making to reflect reality. If the value of a business is determined by its investment decisions (where it invests scarce resources), financing decisions (the amount and type of debt utilized) and dividend decisions (how much cash to return and in what form to the owners of the business), good management will try to optimize these decisions at their company. For a young growth company, this will translate into making investments that deliver growth and not over using debt or paying much in dividends. As the company matures, good management will shift to playing defense, protecting brand name and franchise value from competitive assault, using more debt and returning more cash to stockholders. At a declining company, the essence of “good” management is to not just avoid taking more investments in a bad business, but to extricate the company from its existing investments and to return cash to the business owners. My way of capturing the quality of a management is to value a company twice, once with the management in place (status quo) and once with new (and "optimal" management).
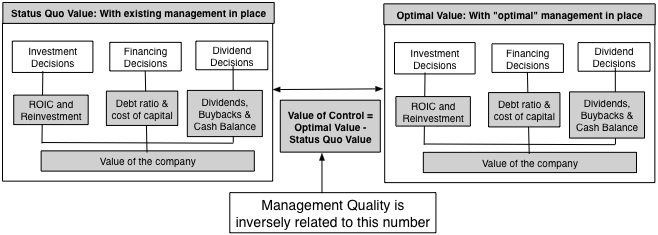
I term the difference between the optimal value and the status quo value the “value of control” but I would argue it is also just as much a measure of management quality, with the value of control shrinking towards zero for “good” managers and increasing for bad ones.
Good and Bad Investments
Now that we have working definitions of good companies and good managers, let’s think about good investments. For a company to be a good investment, you have to bring price into consideration. After all, the greatest company in the world with superb managers can be a bad investment, if it is priced too high. Conversely, the worst company in the world with inept management may be a good investment is the price is low enough. In investing therefore, the comparison is between the value that you attach to a company, given its fundamentals and the price at which it trades.

As you can see at the bottom, investing becomes a search for mismatches, where the market's assessment of a company (and it's management) quality is out of sync with reality.
Screening for Mismatches
If you take the last section to heart, you can see why picking stocks to invest in by looking at only one side of the price/value divide can lead you astray. Thus, if your investment strategy is to buy low PE stocks, you may end up with stocks that look cheap but are not good investments, if these are companies that deserve to be cheap (because they have made awful investments, borrowed too much money or adopted cash return policies that destroy value). Conversely, if your investment strategy is focused on finding good companies (strong moats, low risk), you can easily end up with bad investments, if the price already more than reflects these good qualities. In effect, to be a successful investor, you have to find market mismatches, a very good company in terms of business and management that is being priced as a bad company will be your “buy”. With that mission in hand, let’s consider how you can use multiples in screening, using the PE ratio to illustrate the process. To start, here is what we will do. Starting with a very basic dividend discount model, you can back out the fundamentals drivers of the PE ratio:

Now what? This equation links PE to three variables, growth, risk (through the cost of equity) and the quality of growth (in the payout ratio or return on equity). Plugging in values for these variables into this equation, you will quickly find that companies that have low growth, high risk and abysmally low returns on equity should trade at low PE ratios and those with higher growth, lower risk and sold returns on equity, should trade at high PE ratios. If you are looking to screen for good investments, you therefore need to find stocks with low PE, high growth, a low cost of equity and a high return on equity. Using this approach, I list multiples and the screening mismatches that characterize cheap and expensive companies.
table.tableizer-table { font-size: 12px; border: 1px solid #CCC; font-family: Arial, Helvetica, sans-serif; } .tableizer-table td { padding: 4px; margin: 3px; border: 1px solid #CCC; } .tableizer-table th { background-color: #104E8B; color: #FFF; font-weight: bold; }
MultipleCheap CompanyExpensive CompanyPELow PE, High growth, Low Equity Risk, High PayoutHigh PE, Low growth, High Equity Risk, Low PayoutPEGLow PEG, Low Growth, Low Equity Risk, High PayoutHigh PEG, High Growth, High Equity Risk, Low PayoutPBVLow PBV, High Growth, Low Equity Risk, High ROEHigh PBV, Low Growth, High Equity Risk, Low ROEEV/Invested CapitalLow EV/IC, High Growth, Low Operating Risk, High ROICHigh EV/IC, Low Growth, High Operating Risk, Low ROICEV/SalesLow EV/Sales, High Growth, Low Operating Risk, High Operating MarginHigh EV/Sales, Low Growth, High Operating Risk, High Operating MarginEV/EBITDALow EV/EBITDA, High Growth, Low Operating Risk, Low Tax RateHigh EV/EBITDA, Low Growth, High Operating Risk, High Tax Rate
If you are wondering about the contrast between equity risk and operating risk, the answer is simple. Operating risk reflects the risk of the businesses that you operate in, whereas equity risk reflects operating risk magnified by financial leverage; the former is measured with the cost of capital whereas the latter is captured in the cost of equity. With payout, my definition is broader than the conventional dividend-based one; I would include stock buybacks in my computation of cash returned, thus bringing a company like Apple to a high payout ratio.
The Bottom Line If the length of this post has led you to completely forget what the point of it was, I don’t blame you. So, let me summarize. Separating good companies from bad ones is easy, determining whether companies are well or badly managed is slightly more complicated but defining which companies are good investments is the biggest challenge. Good companies bring strong competitive advantages to a growing market and their results (high margins, high returns on capital) reflect these advantages. In well managed companies, the investing, financing and dividend decisions reflect what will maximize value for the company, thus allowing for the possibility that you can have good companies that are sub-optimally managed and bad companies that are well managed. Good investments require that you be able to buy at a price that is less than the value of the company, given its business and management.
Thus, you can have good companies become bad investments, if they trade at too high a price, and bad companies become good investments, at a low enough price. Given a choice, I would like to buy great companies with great managers at a great price, but greatness on all fronts is hard to find. So. I’ll settle for a more pragmatic end game. At the right price, I will buy a company in a bad business, run by indifferent managers. At the wrong price, I will avoid even superstar companies. At the risk of over simplifying, here is my buy/sell template: table.tableizer-table { font-size: 12px; border: 1px solid #CCC; font-family: Arial, Helvetica, sans-serif; } .tableizer-table td { padding: 4px; margin: 3px; border: 1px solid #CCC; } .tableizer-table th { background-color: #104E8B; color: #FFF; font-weight: bold; }
Company's BusinessCompany's ManagersCompany PricingInvestment DecisionGood (Strong competitive advantages, Growing market)Good (Optimize investment, financing, dividend decisions)Good (Price < Value)Emphatic BuyGood (Strong competitive advantages, Growing market)Bad (Sub-optimal investment, financing, dividend decisions)Good (Price < Value)Buy & hope for management changeBad (No competitive advantages, Stagnant or shrinking market)Good (Optimize investment, financing, dividend decisions)Good (Price < Value)Buy & hope that management does not changeBad (No competitive advantages, Stagnant or shrinking market)Bad (Sub-optimal investment, financing, dividend decisions)Good (Price < Value)Buy, hope for management change & pray company survivesGood (Strong competitive advantages, Growing market)Good (Optimize investment, financing, dividend decisions)Bad (Price > Value)Admire, but don't buyGood (Strong competitive advantages, Growing market)Bad (Sub-optimal investment, financing, dividend decisions)Bad (Price > Value)Wait for management changeBad (No competitive advantages, Stagnant or shrinking market)Good (Optimize investment, financing, dividend decisions)Bad (Price > Value)SellBad (No competitive advantages, Stagnant or shrinking market)Bad (Sub-optimal investment, financing, dividend decisions)Bad (Price > Value)Emphatic Sell
YouTube Video
Aswath Damodaran's Blog

- Aswath Damodaran's profile
- 725 followers
Aswath Damodaran isn't a Goodreads Author
(yet),
but they
do have a blog,
so here are some recent posts imported from
their feed.

