
Aswath Damodaran's Blog, page 21
January 9, 2018
January 2018 Data Update 2: The Buoyancy of US Equities
If you were an investor in US stocks, 2017 was a very good year for you. Faced with a wall of macro economic and political worries, the US equity market proved more than up to the challenge and delivered good returns, proving the experts wrong again. Looking back at the year, the word that I used to describe US equities at the start of last year, which was "resilient", best described US stocks in 2017 as well. As we enter 2018 with US stocks at historical highs, worries remain, but stocks are on a healthier footing now, than a year ago, in terms of fundamentals. At the same time, the long promised surge in T.Bond rates that the Fed watchers promised us would happen in 2017 was nowhere to be seen, which raises interesting questions about whether we should waste our time listening to either stock market prognosticators and Fed watchers. But then again, without them, how would CNBC fill all its time?
The Year that WasThe best way that I can think of mapping out the year is to look at how stocks and bonds performed on a month by month basis through the entire year. In the table below, I look at returns on the S&P 500 and on bonds, through the year: table.tableizer-table { font-size: 12px; border: 1px solid #CCC; font-family: Arial, Helvetica, sans-serif; } .tableizer-table td { padding: 4px; margin: 3px; border: 1px solid #CCC; } .tableizer-table th { background-color: #104E8B; color: #FFF; font-weight: bold; }
Start of monthS&P 500Price Appreciation in MonthT.Bond RateMonthly return1-Jan-1722392.45%1-Feb-1722791.79%2.47%0.03%1-Mar-1723643.73%2.40%0.82%1-Apr-172363-0.04%2.39%0.29%1-May-1723840.89%2.30%1.00%1-Jun-1724121.17%2.21%0.99%1-Jul-1724230.46%2.30%-0.61%1-Aug-1724701.94%2.30%0.19%1-Sep-172418-2.11%2.12%1.80%1-Oct-1725194.18%2.33%-1.68%1-Nov-1725752.22%2.37%-0.16%1-Dec-1726482.83%2.42%-0.24%1-Jan-1826740.98%2.41%0.29%Dividend Yield2.22%-Total Return21.65%2.80%The return on the S&P 500 for the year was 21.65%, with price appreciation accounting for 19.43% in returns and dividend yield representing the remaining 2.22%. In fact, the S&P 500 increased in ten of twelve months, with August representing the only significant down month; stocks were barely down in April. The T.Bond rate stayed within a tight bound for much of the year, with rates dropping to 2.12% at the start of September, from 2.45% at the start of the year, before rebounding to end the year little changed at 2.41%. Given that rates changed so little over the course of the year, the return on a 10-year T.Bond, with coupon and price change included, was 2.80%.
Putting 2017 in perspective, adding the 2017 returns for stocks, T.Bonds and T.Bills to the historical data yields the following historical annual average returns for the three asset classes: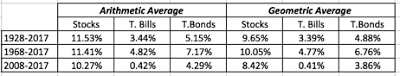 Download historical returns spreadsheetFor devotees of mean reversion (and I am not one), this table becomes the basis for estimating equity risk premiums, with the geometric average returns pointing to an equity risk premium of 4.77% over the 10-year T.Bond rate, i.e., the difference between the geometric average return on stocks (9.65%) and the geometric average return on bonds (4.88%).
When stocks have as good a year as they did in 2017, you would normally expect the fundamentals to weaken, at least relative to prices, but stocks ended the year in a healthier state than at the start. That can be seen by comparing the earnings, dividends and cash returned in 2017, by the S&P 500 companies, relative to 2016:
table.tableizer-table { font-size: 12px; border: 1px solid #CCC; font-family: Arial, Helvetica, sans-serif; } .tableizer-table td { padding: 4px; margin: 3px; border: 1px solid #CCC; } .tableizer-table th { background-color: #104E8B; color: #FFF; font-weight: bold; }
20162017% Change for year10-Year AverageEarnings106.26124.9417.58%93.00Dividends45.749.738.82%32.76Dividends + Buybacks108.02109.891.73%82.28Payout Ratio43.01%39.80%42.05%Cash Return Ratio101.66%87.95%89.35%Note that earnings almost kept track with stock prices for the year, but the change is in the cash returned, where you saw a leveling off in the buyback boom. While that would normally be a negative for stocks, the draw back in buybacks left stocks looking healthier by reducing the cash returned as a percent of earnings from an unsustainable 101.66% in 2016 to 87.95% in 2017.
To evaluate whether the T.Bond rate is at a level that can be justified by fundamentals, I fall back on an approach that I have used before, where I compare the T.Bond rate to an intrinsic risk free rate that I compute by adding the inflation rate for the year to real growth rate in the economy (GDP real growth rate). While those numbers are still not final for 2017, using the most recent values for both allows for an update of my intrinsic interest rate chart: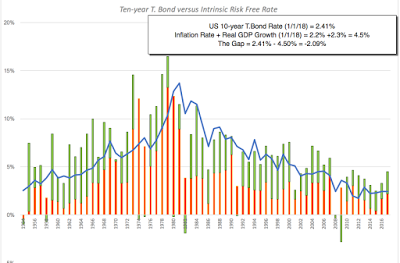 Download spreadsheet with data
The intrinsic risk free rate, using the estimated numbers as of January 1, 2018, is 4.50%, 2.09% higher than the US treasury bond rate of 2.41%, suggesting that there will be upward pressure on the US treasury bond rate over the next year.
Download spreadsheet with data
The intrinsic risk free rate, using the estimated numbers as of January 1, 2018, is 4.50%, 2.09% higher than the US treasury bond rate of 2.41%, suggesting that there will be upward pressure on the US treasury bond rate over the next year.
Looking ForwardWhile it is tempting to continue to dissect last year's numbers, it is healthier to turn our attention to the future. It is why I have increasingly moved away from using historical risk premiums, like the 4.77% premium that I computed by looking at the 1928-2017 return table, and towards implied equity risk premiums, where I back out what investors are demanding as a premium for investing in stocks by looking at how much they pay for stocks and what they expect to generate as cash flows. (Think of it as an IRR for stocks, analogous to the yield to maturity on a bond). At the start of 2018, putting this approach into play, I estimated an equity risk premium of 5.08% for the S&P 500:
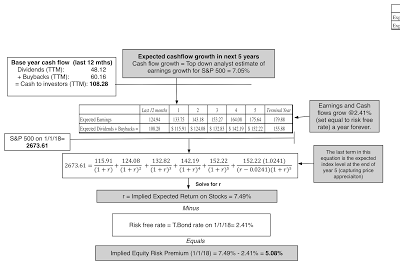 Download spreadsheetIt is instructive to look at how the inputs have changed since the start of 2017, when my estimate of the implied ERP was 5.69%. The S&P 500 has risen 19.43%, while cash returned has remained stable; the drop in buybacks has been offset by an increase in dividends. Analysts have become more optimistic about future earnings growth, partly because US companies had a healthy earnings year and partly because of the expected drop in corporate tax rates. It is true that there are judgment calls that I had to make in estimating the implied premium, including using the analyst estimates of earnings growth for the S&P 500 (7.05%), but the resulting error pales in comparison to the standard error in the historical risk premium estimate.
While I take this implied equity risk premium as a market price for risk, and will use it in my individual company valuations in January 2018, there are some who like playing the market timing game. If you are so inclined, the question that you are asking is whether 5.08% is a high, low or reasonable number. If you believe that the current implied premium is too low (high), you also have to believe that stocks are over priced (under priced), and to help you make that judgment, I have graphed the implied equity risk premium for the S&P 500 from 1960 to 2017 in the graph below: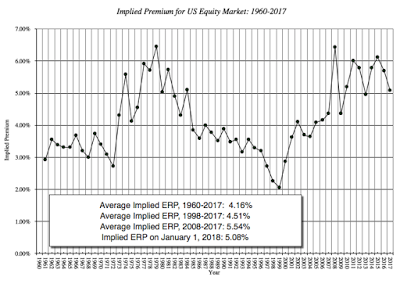 Historical Implied ERP spreadsheetThere is a reason why those who are intent on claiming that the market is in a bubble have a tough sell. Unlike the end of 1999, when implied equity risk premiums were at historical lows (close to 2%), the current implied ERP is well within the bounds of historic norms. It is only if you read this graph, in conjunction with the earlier one on risk free rates, that you should be concerned, since one reason that the premium is at 5.08% is because the US treasury bond rate is 2.41%. If the T.Bond rate moves towards 4.50%, and nothing else changes, the implied ERP will drop below comfort levels.
Worried about Equities? There has never been a time in the last three decades where I have felt sanguine about equity markets and I am thankful for that, since that is a sure sign of denial about the risk that is always under the surface, with stocks. That said, my worries shift from year to year and in this new year, I will continue to watch how the changing tax code will play out in both earnings and cash flows, since both are likely to be significantly affected, the former, because a lower tax rate should raise after-tax earnings, and the latter, because of the release of hundreds of billions of trapped cash. My macro crystal ball is always hazy but I expect T. Bond rates to rise, but if those higher rates go with a more robust economy, the market will take it in stride. There is the very real possibility that the economy stumbles, while rates rise, in which case US equities will be hard pressed to repeat their 2017 performance next year.
YouTube Video
Data Links
Historical Returns on Stocks, Bonds and Bills: 1928-2017T.Bond and Intrinsic Interest Rates: 1960-2017Implied Equity Risk Premium, S&P 500 (Jan 1, 2018)Historical Implied Equity Risk Premiums, 1960-2017Data Update PostsJanuary 2018 Data Update 1: Numbers don't lie, or do they?January 2018 Data Update 2: The Buoyancy of US Equities!January 2018 Data Update 3: Taxing Questions on ValueJanuary 2018 Data Update 4: The Currency ConundrumJanuary 2018 Data Update 5: Country Risk UpdateJanuary 2018 Data Update 6: A Cost of Capital PrimerJanuary 2018 Data Update 7: Growth and Value - Investment ReturnsJanuary 2018 Data Update 8: Debt and TaxesJanuary 2018 Data Update 9: The Cash Harvest - Dividend PolicyJanuary 2018 Data Update 10: The Pricing Prerogative
The Year that WasThe best way that I can think of mapping out the year is to look at how stocks and bonds performed on a month by month basis through the entire year. In the table below, I look at returns on the S&P 500 and on bonds, through the year: table.tableizer-table { font-size: 12px; border: 1px solid #CCC; font-family: Arial, Helvetica, sans-serif; } .tableizer-table td { padding: 4px; margin: 3px; border: 1px solid #CCC; } .tableizer-table th { background-color: #104E8B; color: #FFF; font-weight: bold; }
Start of monthS&P 500Price Appreciation in MonthT.Bond RateMonthly return1-Jan-1722392.45%1-Feb-1722791.79%2.47%0.03%1-Mar-1723643.73%2.40%0.82%1-Apr-172363-0.04%2.39%0.29%1-May-1723840.89%2.30%1.00%1-Jun-1724121.17%2.21%0.99%1-Jul-1724230.46%2.30%-0.61%1-Aug-1724701.94%2.30%0.19%1-Sep-172418-2.11%2.12%1.80%1-Oct-1725194.18%2.33%-1.68%1-Nov-1725752.22%2.37%-0.16%1-Dec-1726482.83%2.42%-0.24%1-Jan-1826740.98%2.41%0.29%Dividend Yield2.22%-Total Return21.65%2.80%The return on the S&P 500 for the year was 21.65%, with price appreciation accounting for 19.43% in returns and dividend yield representing the remaining 2.22%. In fact, the S&P 500 increased in ten of twelve months, with August representing the only significant down month; stocks were barely down in April. The T.Bond rate stayed within a tight bound for much of the year, with rates dropping to 2.12% at the start of September, from 2.45% at the start of the year, before rebounding to end the year little changed at 2.41%. Given that rates changed so little over the course of the year, the return on a 10-year T.Bond, with coupon and price change included, was 2.80%.
Putting 2017 in perspective, adding the 2017 returns for stocks, T.Bonds and T.Bills to the historical data yields the following historical annual average returns for the three asset classes:
 Download historical returns spreadsheetFor devotees of mean reversion (and I am not one), this table becomes the basis for estimating equity risk premiums, with the geometric average returns pointing to an equity risk premium of 4.77% over the 10-year T.Bond rate, i.e., the difference between the geometric average return on stocks (9.65%) and the geometric average return on bonds (4.88%).
When stocks have as good a year as they did in 2017, you would normally expect the fundamentals to weaken, at least relative to prices, but stocks ended the year in a healthier state than at the start. That can be seen by comparing the earnings, dividends and cash returned in 2017, by the S&P 500 companies, relative to 2016:
table.tableizer-table { font-size: 12px; border: 1px solid #CCC; font-family: Arial, Helvetica, sans-serif; } .tableizer-table td { padding: 4px; margin: 3px; border: 1px solid #CCC; } .tableizer-table th { background-color: #104E8B; color: #FFF; font-weight: bold; }
20162017% Change for year10-Year AverageEarnings106.26124.9417.58%93.00Dividends45.749.738.82%32.76Dividends + Buybacks108.02109.891.73%82.28Payout Ratio43.01%39.80%42.05%Cash Return Ratio101.66%87.95%89.35%Note that earnings almost kept track with stock prices for the year, but the change is in the cash returned, where you saw a leveling off in the buyback boom. While that would normally be a negative for stocks, the draw back in buybacks left stocks looking healthier by reducing the cash returned as a percent of earnings from an unsustainable 101.66% in 2016 to 87.95% in 2017.
To evaluate whether the T.Bond rate is at a level that can be justified by fundamentals, I fall back on an approach that I have used before, where I compare the T.Bond rate to an intrinsic risk free rate that I compute by adding the inflation rate for the year to real growth rate in the economy (GDP real growth rate). While those numbers are still not final for 2017, using the most recent values for both allows for an update of my intrinsic interest rate chart:
 Download spreadsheet with data
The intrinsic risk free rate, using the estimated numbers as of January 1, 2018, is 4.50%, 2.09% higher than the US treasury bond rate of 2.41%, suggesting that there will be upward pressure on the US treasury bond rate over the next year.
Download spreadsheet with data
The intrinsic risk free rate, using the estimated numbers as of January 1, 2018, is 4.50%, 2.09% higher than the US treasury bond rate of 2.41%, suggesting that there will be upward pressure on the US treasury bond rate over the next year.Looking ForwardWhile it is tempting to continue to dissect last year's numbers, it is healthier to turn our attention to the future. It is why I have increasingly moved away from using historical risk premiums, like the 4.77% premium that I computed by looking at the 1928-2017 return table, and towards implied equity risk premiums, where I back out what investors are demanding as a premium for investing in stocks by looking at how much they pay for stocks and what they expect to generate as cash flows. (Think of it as an IRR for stocks, analogous to the yield to maturity on a bond). At the start of 2018, putting this approach into play, I estimated an equity risk premium of 5.08% for the S&P 500:
 Download spreadsheetIt is instructive to look at how the inputs have changed since the start of 2017, when my estimate of the implied ERP was 5.69%. The S&P 500 has risen 19.43%, while cash returned has remained stable; the drop in buybacks has been offset by an increase in dividends. Analysts have become more optimistic about future earnings growth, partly because US companies had a healthy earnings year and partly because of the expected drop in corporate tax rates. It is true that there are judgment calls that I had to make in estimating the implied premium, including using the analyst estimates of earnings growth for the S&P 500 (7.05%), but the resulting error pales in comparison to the standard error in the historical risk premium estimate.
 While I take this implied equity risk premium as a market price for risk, and will use it in my individual company valuations in January 2018, there are some who like playing the market timing game. If you are so inclined, the question that you are asking is whether 5.08% is a high, low or reasonable number. If you believe that the current implied premium is too low (high), you also have to believe that stocks are over priced (under priced), and to help you make that judgment, I have graphed the implied equity risk premium for the S&P 500 from 1960 to 2017 in the graph below:
 Historical Implied ERP spreadsheetThere is a reason why those who are intent on claiming that the market is in a bubble have a tough sell. Unlike the end of 1999, when implied equity risk premiums were at historical lows (close to 2%), the current implied ERP is well within the bounds of historic norms. It is only if you read this graph, in conjunction with the earlier one on risk free rates, that you should be concerned, since one reason that the premium is at 5.08% is because the US treasury bond rate is 2.41%. If the T.Bond rate moves towards 4.50%, and nothing else changes, the implied ERP will drop below comfort levels.
 Worried about Equities? There has never been a time in the last three decades where I have felt sanguine about equity markets and I am thankful for that, since that is a sure sign of denial about the risk that is always under the surface, with stocks. That said, my worries shift from year to year and in this new year, I will continue to watch how the changing tax code will play out in both earnings and cash flows, since both are likely to be significantly affected, the former, because a lower tax rate should raise after-tax earnings, and the latter, because of the release of hundreds of billions of trapped cash. My macro crystal ball is always hazy but I expect T. Bond rates to rise, but if those higher rates go with a more robust economy, the market will take it in stride. There is the very real possibility that the economy stumbles, while rates rise, in which case US equities will be hard pressed to repeat their 2017 performance next year.
YouTube Video
Data Links
Historical Returns on Stocks, Bonds and Bills: 1928-2017T.Bond and Intrinsic Interest Rates: 1960-2017Implied Equity Risk Premium, S&P 500 (Jan 1, 2018)Historical Implied Equity Risk Premiums, 1960-2017Data Update PostsJanuary 2018 Data Update 1: Numbers don't lie, or do they?January 2018 Data Update 2: The Buoyancy of US Equities!January 2018 Data Update 3: Taxing Questions on ValueJanuary 2018 Data Update 4: The Currency ConundrumJanuary 2018 Data Update 5: Country Risk UpdateJanuary 2018 Data Update 6: A Cost of Capital PrimerJanuary 2018 Data Update 7: Growth and Value - Investment ReturnsJanuary 2018 Data Update 8: Debt and TaxesJanuary 2018 Data Update 9: The Cash Harvest - Dividend PolicyJanuary 2018 Data Update 10: The Pricing Prerogative


January 2017 Data Update 2: The Buoyancy of US Equities
If you were an investor in US stocks, 2017 was a very good year for you. Faced with a wall of macro economic and political worries, the US equity market proved more than up to the challenge and delivered good returns, proving the experts wrong again. Looking back at the year, the word that I used to describe US equities at the start of last year, which was "resilient", best described US stocks in 2017 as well. As we enter 2018 with US stocks at historical highs, worries remain, but stocks are on a healthier footing now, than a year ago, in terms of fundamentals. At the same time, the long promised surge in T.Bond rates that the Fed watchers promised us would happen in 2017 was nowhere to be seen, which raises interesting questions about whether we should waste our time listening to either stock market prognosticators and Fed watchers. But then again, without them, how would CNBC fill all its time?
The Year that WasThe best way that I can think of mapping out the year is to look at how stocks and bonds performed on a month by month basis through the entire year. In the table below, I look at returns on the S&P 500 and on bonds, through the year: table.tableizer-table { font-size: 12px; border: 1px solid #CCC; font-family: Arial, Helvetica, sans-serif; } .tableizer-table td { padding: 4px; margin: 3px; border: 1px solid #CCC; } .tableizer-table th { background-color: #104E8B; color: #FFF; font-weight: bold; }
Start of monthS&P 500Price Appreciation in MonthT.Bond RateMonthly return1-Jan-1722392.45%1-Feb-1722791.79%2.47%0.03%1-Mar-1723643.73%2.40%0.82%1-Apr-172363-0.04%2.39%0.29%1-May-1723840.89%2.30%1.00%1-Jun-1724121.17%2.21%0.99%1-Jul-1724230.46%2.30%-0.61%1-Aug-1724701.94%2.30%0.19%1-Sep-172418-2.11%2.12%1.80%1-Oct-1725194.18%2.33%-1.68%1-Nov-1725752.22%2.37%-0.16%1-Dec-1726482.83%2.42%-0.24%1-Jan-1826740.98%2.41%0.29%Dividend Yield2.22%-Total Return21.65%2.80%The return on the S&P 500 for the year was 21.65%, with price appreciation accounting for 19.43% in returns and dividend yield representing the remaining 2.22%. In fact, the S&P 500 increased in ten of twelve months, with August representing the only significant down month; stocks were barely down in April. The T.Bond rate stayed within a tight bound for much of the year, with rates dropping to 2.12% at the start of September, from 2.45% at the start of the year, before rebounding to end the year little changed at 2.41%. Given that rates changed so little over the course of the year, the return on a 10-year T.Bond, with coupon and price change included, was 2.80%.
Putting 2017 in perspective, adding the 2017 returns for stocks, T.Bonds and T.Bills to the historical data yields the following historical annual average returns for the three asset classes:
Download historical returns spreadsheetFor devotees of mean reversion (and I am not one), this table becomes the basis for estimating equity risk premiums, with the geometric average returns pointing to an equity risk premium of 4.77% over the 10-year T.Bond rate, i.e., the difference between the geometric average return on stocks (9.65%) and the geometric average return on bonds (4.88%).
When stocks have as good a year as they did in 2017, you would normally expect the fundamentals to weaken, at least relative to prices, but stocks ended the year in a healthier state than at the start. That can be seen by comparing the earnings, dividends and cash returned in 2017, by the S&P 500 companies, relative to 2016:
table.tableizer-table { font-size: 12px; border: 1px solid #CCC; font-family: Arial, Helvetica, sans-serif; } .tableizer-table td { padding: 4px; margin: 3px; border: 1px solid #CCC; } .tableizer-table th { background-color: #104E8B; color: #FFF; font-weight: bold; }
20162017% Change for year10-Year AverageEarnings106.26124.9417.58%93.00Dividends45.749.738.82%32.76Dividends + Buybacks108.02109.891.73%82.28Payout Ratio43.01%39.80%42.05%Cash Return Ratio101.66%87.95%89.35%Note that earnings almost kept track with stock prices for the year, but the change is in the cash returned, where you saw a leveling off in the buyback boom. While that would normally be a negative for stocks, the draw back in buybacks left stocks looking healthier by reducing the cash returned as a percent of earnings from an unsustainable 101.66% in 2016 to 87.95% in 2017.
To evaluate whether the T.Bond rate is at a level that can be justified by fundamentals, I fall back on an approach that I have used before, where I compare the T.Bond rate to an intrinsic risk free rate that I compute by adding the inflation rate for the year to real growth rate in the economy (GDP real growth rate). While those numbers are still not final for 2017, using the most recent values for both allows for an update of my intrinsic interest rate chart:
Download spreadsheet with data
The intrinsic risk free rate, using the estimated numbers as of January 1, 2018, is 4.50%, 2.09% higher than the US treasury bond rate of 2.41%, suggesting that there will be upward pressure on the US treasury bond rate over the next year.
Looking ForwardWhile it is tempting to continue to dissect last year's numbers, it is healthier to turn our attention to the future. It is why I have increasingly moved away from using historical risk premiums, like the 4.77% premium that I computed by looking at the 1928-2017 return table, and towards implied equity risk premiums, where I back out what investors are demanding as a premium for investing in stocks by looking at how much they pay for stocks and what they expect to generate as cash flows. (Think of it as an IRR for stocks, analogous to the yield to maturity on a bond). At the start of 2018, putting this approach into play, I estimated an equity risk premium of 5.08% for the S&P 500:
Download spreadsheetIt is instructive to look at how the inputs have changed since the start of 2017, when my estimate of the implied ERP was 5.69%. The S&P 500 has risen 19.43%, while cash returned has remained stable; the drop in buybacks has been offset by an increase in dividends. Analysts have become more optimistic about future earnings growth, partly because US companies had a healthy earnings year and partly because of the expected drop in corporate tax rates. It is true that there are judgment calls that I had to make in estimating the implied premium, including using the analyst estimates of earnings growth for the S&P 500 (7.05%), but the resulting error pales in comparison to the standard error in the historical risk premium estimate.
While I take this implied equity risk premium as a market price for risk, and will use it in my individual company valuations in January 2018, there are some who like playing the market timing game. If you are so inclined, the question that you are asking is whether 5.08% is a high, low or reasonable number. If you believe that the current implied premium is too low (high), you also have to believe that stocks are over priced (under priced), and to help you make that judgment, I have graphed the implied equity risk premium for the S&P 500 from 1960 to 2017 in the graph below:
Historical Implied ERP spreadsheetThere is a reason why those who are intent on claiming that the market is in a bubble have a tough sell. Unlike the end of 1999, when implied equity risk premiums were at historical lows (close to 2%), the current implied ERP is well within the bounds of historic norms. It is only if you read this graph, in conjunction with the earlier one on risk free rates, that you should be concerned, since one reason that the premium is at 5.08% is because the US treasury bond rate is 2.41%. If the T.Bond rate moves towards 4.50%, and nothing else changes, the implied ERP will drop below comfort levels.
Worried about Equities? There has never been a time in the last three decades where I have felt sanguine about equity markets and I am thankful for that, since that is a sure sign of denial about the risk that is always under the surface, with stocks. That said, my worries shift from year to year and in this new year, I will continue to watch how the changing tax code will play out in both earnings and cash flows, since both are likely to be significantly affected, the former, because a lower tax rate should raise after-tax earnings, and the latter, because of the release of hundreds of billions of trapped cash. My macro crystal ball is always hazy but I expect T. Bond rates to rise, but if those higher rates go with a more robust economy, the market will take it in stride. There is the very real possibility that the economy stumbles, while rates rise, in which case US equities will be hard pressed to repeat their 2017 performance next year.
YouTube Video
Data Links
Historical Returns on Stocks, Bonds and Bills: 1928-2017T.Bond and Intrinsic Interest Rates: 1960-2017Implied Equity Risk Premium, S&P 500 (Jan 1, 2018)Historical Implied Equity Risk Premiums, 1960-2017Data Update PostsJanuary 2018 Data Update 1: Numbers don't lie, or do they?January 2018 Data Update 2: The Buoyancy of US Equities!January 2018 Data Update 3: Taxing Questions on ValueJanuary 2018 Data Update 4: The Currency ConundrumJanuary 2018 Data Update 5: Country Risk January 2018 Data Update 6: Cost of Capital - A Global UpdateJanuary 2018 Data Update 7: Growth and Value - Investment ReturnsJanuary 2018 Data Update 8: Debt and ValueJanuary 2018 Data Update 9: The Cash Harvest - Dividend PolicyJanuary 2018 Data Update 10: The Pricing Prerogative
The Year that WasThe best way that I can think of mapping out the year is to look at how stocks and bonds performed on a month by month basis through the entire year. In the table below, I look at returns on the S&P 500 and on bonds, through the year: table.tableizer-table { font-size: 12px; border: 1px solid #CCC; font-family: Arial, Helvetica, sans-serif; } .tableizer-table td { padding: 4px; margin: 3px; border: 1px solid #CCC; } .tableizer-table th { background-color: #104E8B; color: #FFF; font-weight: bold; }
Start of monthS&P 500Price Appreciation in MonthT.Bond RateMonthly return1-Jan-1722392.45%1-Feb-1722791.79%2.47%0.03%1-Mar-1723643.73%2.40%0.82%1-Apr-172363-0.04%2.39%0.29%1-May-1723840.89%2.30%1.00%1-Jun-1724121.17%2.21%0.99%1-Jul-1724230.46%2.30%-0.61%1-Aug-1724701.94%2.30%0.19%1-Sep-172418-2.11%2.12%1.80%1-Oct-1725194.18%2.33%-1.68%1-Nov-1725752.22%2.37%-0.16%1-Dec-1726482.83%2.42%-0.24%1-Jan-1826740.98%2.41%0.29%Dividend Yield2.22%-Total Return21.65%2.80%The return on the S&P 500 for the year was 21.65%, with price appreciation accounting for 19.43% in returns and dividend yield representing the remaining 2.22%. In fact, the S&P 500 increased in ten of twelve months, with August representing the only significant down month; stocks were barely down in April. The T.Bond rate stayed within a tight bound for much of the year, with rates dropping to 2.12% at the start of September, from 2.45% at the start of the year, before rebounding to end the year little changed at 2.41%. Given that rates changed so little over the course of the year, the return on a 10-year T.Bond, with coupon and price change included, was 2.80%.
Putting 2017 in perspective, adding the 2017 returns for stocks, T.Bonds and T.Bills to the historical data yields the following historical annual average returns for the three asset classes:
Download historical returns spreadsheetFor devotees of mean reversion (and I am not one), this table becomes the basis for estimating equity risk premiums, with the geometric average returns pointing to an equity risk premium of 4.77% over the 10-year T.Bond rate, i.e., the difference between the geometric average return on stocks (9.65%) and the geometric average return on bonds (4.88%).When stocks have as good a year as they did in 2017, you would normally expect the fundamentals to weaken, at least relative to prices, but stocks ended the year in a healthier state than at the start. That can be seen by comparing the earnings, dividends and cash returned in 2017, by the S&P 500 companies, relative to 2016:
table.tableizer-table { font-size: 12px; border: 1px solid #CCC; font-family: Arial, Helvetica, sans-serif; } .tableizer-table td { padding: 4px; margin: 3px; border: 1px solid #CCC; } .tableizer-table th { background-color: #104E8B; color: #FFF; font-weight: bold; }
20162017% Change for year10-Year AverageEarnings106.26124.9417.58%93.00Dividends45.749.738.82%32.76Dividends + Buybacks108.02109.891.73%82.28Payout Ratio43.01%39.80%42.05%Cash Return Ratio101.66%87.95%89.35%Note that earnings almost kept track with stock prices for the year, but the change is in the cash returned, where you saw a leveling off in the buyback boom. While that would normally be a negative for stocks, the draw back in buybacks left stocks looking healthier by reducing the cash returned as a percent of earnings from an unsustainable 101.66% in 2016 to 87.95% in 2017.
To evaluate whether the T.Bond rate is at a level that can be justified by fundamentals, I fall back on an approach that I have used before, where I compare the T.Bond rate to an intrinsic risk free rate that I compute by adding the inflation rate for the year to real growth rate in the economy (GDP real growth rate). While those numbers are still not final for 2017, using the most recent values for both allows for an update of my intrinsic interest rate chart:
Download spreadsheet with data
The intrinsic risk free rate, using the estimated numbers as of January 1, 2018, is 4.50%, 2.09% higher than the US treasury bond rate of 2.41%, suggesting that there will be upward pressure on the US treasury bond rate over the next year.Looking ForwardWhile it is tempting to continue to dissect last year's numbers, it is healthier to turn our attention to the future. It is why I have increasingly moved away from using historical risk premiums, like the 4.77% premium that I computed by looking at the 1928-2017 return table, and towards implied equity risk premiums, where I back out what investors are demanding as a premium for investing in stocks by looking at how much they pay for stocks and what they expect to generate as cash flows. (Think of it as an IRR for stocks, analogous to the yield to maturity on a bond). At the start of 2018, putting this approach into play, I estimated an equity risk premium of 5.08% for the S&P 500:
Download spreadsheetIt is instructive to look at how the inputs have changed since the start of 2017, when my estimate of the implied ERP was 5.69%. The S&P 500 has risen 19.43%, while cash returned has remained stable; the drop in buybacks has been offset by an increase in dividends. Analysts have become more optimistic about future earnings growth, partly because US companies had a healthy earnings year and partly because of the expected drop in corporate tax rates. It is true that there are judgment calls that I had to make in estimating the implied premium, including using the analyst estimates of earnings growth for the S&P 500 (7.05%), but the resulting error pales in comparison to the standard error in the historical risk premium estimate. While I take this implied equity risk premium as a market price for risk, and will use it in my individual company valuations in January 2018, there are some who like playing the market timing game. If you are so inclined, the question that you are asking is whether 5.08% is a high, low or reasonable number. If you believe that the current implied premium is too low (high), you also have to believe that stocks are over priced (under priced), and to help you make that judgment, I have graphed the implied equity risk premium for the S&P 500 from 1960 to 2017 in the graph below:
Historical Implied ERP spreadsheetThere is a reason why those who are intent on claiming that the market is in a bubble have a tough sell. Unlike the end of 1999, when implied equity risk premiums were at historical lows (close to 2%), the current implied ERP is well within the bounds of historic norms. It is only if you read this graph, in conjunction with the earlier one on risk free rates, that you should be concerned, since one reason that the premium is at 5.08% is because the US treasury bond rate is 2.41%. If the T.Bond rate moves towards 4.50%, and nothing else changes, the implied ERP will drop below comfort levels. Worried about Equities? There has never been a time in the last three decades where I have felt sanguine about equity markets and I am thankful for that, since that is a sure sign of denial about the risk that is always under the surface, with stocks. That said, my worries shift from year to year and in this new year, I will continue to watch how the changing tax code will play out in both earnings and cash flows, since both are likely to be significantly affected, the former, because a lower tax rate should raise after-tax earnings, and the latter, because of the release of hundreds of billions of trapped cash. My macro crystal ball is always hazy but I expect T. Bond rates to rise, but if those higher rates go with a more robust economy, the market will take it in stride. There is the very real possibility that the economy stumbles, while rates rise, in which case US equities will be hard pressed to repeat their 2017 performance next year.
YouTube Video
Data Links
Historical Returns on Stocks, Bonds and Bills: 1928-2017T.Bond and Intrinsic Interest Rates: 1960-2017Implied Equity Risk Premium, S&P 500 (Jan 1, 2018)Historical Implied Equity Risk Premiums, 1960-2017Data Update PostsJanuary 2018 Data Update 1: Numbers don't lie, or do they?January 2018 Data Update 2: The Buoyancy of US Equities!January 2018 Data Update 3: Taxing Questions on ValueJanuary 2018 Data Update 4: The Currency ConundrumJanuary 2018 Data Update 5: Country Risk January 2018 Data Update 6: Cost of Capital - A Global UpdateJanuary 2018 Data Update 7: Growth and Value - Investment ReturnsJanuary 2018 Data Update 8: Debt and ValueJanuary 2018 Data Update 9: The Cash Harvest - Dividend PolicyJanuary 2018 Data Update 10: The Pricing Prerogative
January 5, 2018
January 2018 Data Update 1: Numbers don't lie, or do they?
Every year, since 1992, I have spent the first week of my year, paying homage to the numbers gods. I collect raw accounting and market data from a variety of raw data providers, and I am grateful to all of them for making my life easier, and I summarize the data on many dimensions, by geography, by industry and by market capitalization. That summarized data, for the start of 2018, can be found on my website, as can the archived data from prior years.
The What?My dataset includes every publicly traded firm that has a market price available for it, in my raw dataset, and at the start of 2018, it included 43,848 firms, up from the 42,678 firms at the start of 2017. To the question of why I don't restrict myself to just the biggest, the most liquid or the most heavily followed firms, my answer is a statistical one. Any decision that I make on screening the data or sampling will create biases that will color my results, and while I will not claim to be bias-free (no one is), I would prefer to not initiate it with my sampling.
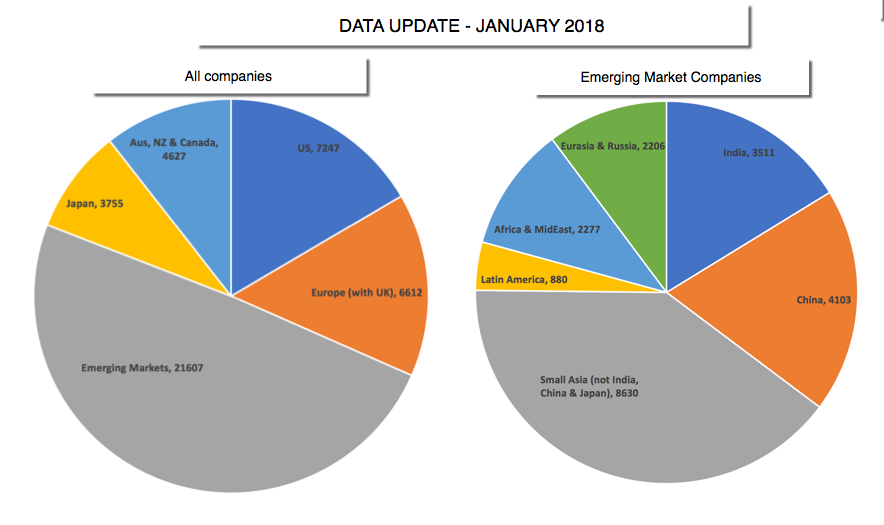
There are 135 countries that are represented in the data, though many have only a handful of firms that are incorporated there. That said, it is worth noting that while the companies are classified by country of incorporation, many have operations in multiple countries. I have classified my firms into five "big" groups: the United States, Europe (EU, UK), Emerging Markets, Japan and Australia/Canada/New Zealand. The pie chart below provides the breakdown: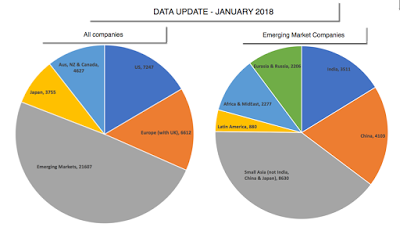 Download spreadsheetSince the emerging market grouping includes firms from Asia, Latin America, Africa and Eurasia, I also have the data for sub-groups including India, China, Small Asia (other than India, China and Japan), Latin America, Africa & MidEast and Russia/Eurasia. That is pictured in the second pie chart above.
Within each geographic group, I break the companies down into 94 industry groupings and the numbers in each grouping are summarized at this link. While some would prefer a finer breakdown, I prefer this coarser grouping because it allows for larger sample sizes, especially as I go to sub-groups. Finally, I compute a range of numbers for each grouping, reflecting my corporate finance biases, and classify them into risk, profitability, leverage and cash return measures in the table below:
table.tableizer-table { font-size: 12px; border: 1px solid #CCC; font-family: Arial, Helvetica, sans-serif; } .tableizer-table td { padding: 4px; margin: 3px; border: 1px solid #CCC; } .tableizer-table th { background-color: #104E8B; color: #FFF; font-weight: bold; }
Risk MeasuresCost of FundingPricing Multiples1. Beta1. Cost of Equity1. PE &PEG2. Standard deviation in stock price2. Cost of Debt2. Price to Book3. Standard deviation in operating income3. Cost of Capital3. EV/EBIT, EV/EBITDA and EV/EBITDA4. High-Low Price Risk Measure4. EV/Sales and Price/SalesProfitabilityFinancial LeverageCash Flow Add-ons1. Net Profit Margin1. D/E ratio & Debt/Capital (book & market) (with lease effect)1. Cap Ex & Net Cap Ex2. Operating Margin2. Debt/EBITDA2. Non-cash Working Capital as % of Revenue3. EBITDA, EBIT and EBITDAR&D Margins3. Interest Coverage Ratios3. Sales/Invested CapitalReturnsDividend PolicyRisk Premiums1. Return on Equity1. Dividend Payout & Yield1. Equity Risk Premiums (by country)2. Return on Capital2. Dividends/FCFE & (Dividends Buybacks)/ FCFE2. US equity returns (historical)3. ROE - Cost of Equity4. ROIC - Cost of CapitalThe links in the table will lead you to the html versions of the US data, but you can find the excel versions of this data and for the other groupings on my webpage. Since I report more than 150 data items, you may have to work to find what you are looking for but it (or a close variant) should be available somewhere on the site. Since there can be variations on how metrics are computed (like EV/EBITDA or even PE), I summarize my definitions at this link.
The Why?Much as I would like to claim that my data sharing is driven by altruism and making the world a better place, the reasons are more prosaic. I do this for myself. I enjoy analyzing the data for many reasons:Perspective: As our access to data increases, partly because of increased information disclosure on the part of firms, and partly because technology has made it easier to download data, it is ironic that we are more likely to develop tunnel vision now than before we had access to this data. When valuing individual companies, I find that knowing the industry and geographic averages gives me perspective on the numbers that I use for the company. Thus, when valuing Indofoods, an Indonesian food processing company, I can look at typical profit margins for food processing companies in South East Asia, in making my estimates for inputs, and compare my valuation to the pricing of other South East Asian food companies, when I am done.Rules of Thumb: Investing is full of rules of thumb that we devised in a different time for a different market, but still are used by investors, often without question. The notion that a stock that trades at a PEG ratio less than one or at a price less than its book value is cheap is deeply engrained in value investing books, but is it true? Looking at the cross sectional distributions of PEG and Price to Book ratios across all companies should give us the answer and allow us to eliminate the rules of thumb that no longer work.Curiosity: There are questions that all of us have about companies that the numbers can help answer. Do US companies pay less in taxes than their foreign counterparts? Does growth create or destroy value at companies? The answers to these questions are in the numbers and I find that they provide an antidote to experts who try to pass off opinions as facts.Trends and Shifts: Companies change over time, albeit slowly, and these changes have consequences not just for investors, but for governments, taxpayers and workers. One reason that I do not make jarring changes in the way that I classify and report my numbers is to see how these numbers change over time.In the next two weeks, I will try to summarize what I learn from the data about corporate investment, financing and dividend policy in a series of posts that I have tentatively listed at the end of this post, starting with an update on US equities (and risk premiums) and ending with the a look at market pricing multiples at the end of 2017. Along the way, I will grapple with the rise of crypto currencies and what they might or might not mean for valuation. The motivations for creating these datasets are selfish but I find it pointless to keep them to myself. After all, there is no secret sauce in this data that will lead me to riches, and nothing that someone else with access to the raw data could not generate themselves. If, in the process, a few people are able to use my data in their analyses, I consider them deposits in my "good karma" bank.
The QuirksEach year that I update the data, there are four challenges that await me. The first relates to data timing, where I try to put myself in the shoes of an investor making investment choices on January 2, 2018. The second is how best to deal with missing data, par for the course since my dataset includes some very small companies in under developed markets. The third is to clean up after the accountants, who are not always consistent in their rules across sectors and geographies. The fourth and final challenge is to find and correct mistakes in the data.Timing: All of the data that I have used in my analysis was collected after the close of trading on the last trading day of 2017 (December 29 for most markets) and reflects the most updated data, as of that day. That said, it is worth noting that not all data gets updated at the same rate, with market-set numbers (risk free rate, stock prices, risk premiums) being as of close of trading at the end of the year, but accounting numbers reflecting the most recent financial reports (from October, November and December of 2017). The accounting numbers that I use to compute my financial and pricing ratios are therefore trailing 12-month numbers, if they are updated every quarter, or even 2016 numbers, if they are not updated. Missing Data: Information disclosure requirements vary widely across markets and since my dataset spans all markets, there are some items that are available in some markets and not in others. Rather than eliminate companies with missing data, which will both decimate and bias my sample, I keep them in the sample and deal with them the best that I can. For instance, US companies report stock based compensation as an expense item but many non-US companies do not. I report stock based compensation as a percent of total revenues in every market but they are close to reality only in the US data.Accounting inconsistencies: I have argued in prior posts that accountants are inconsistent in their treatment of capital expenditures and debt across companies, treating the biggest capital expenditures (R&D) at technology and pharmaceutical companies as operating expenses and ignoring the primary debt (leases) at retail and restaurant companies. Rather than wait for accounting rules to come to their senses, which may take decades, I have capitalized both R&D and lease commitments for all companies and that has consequences for my earnings, invested capital and debt numbers.Data mistakes: Working with a spreadsheet with 43,848 companies and 150 data items, I am sure that there are mistakes that have found their way into my summaries, notwithstanding my attempts to catch them. Some of these mistakes are mine but some reflect errors in the raw data. The datasets that are least likely to be affected by mistakes are the US and Global dataset, where I have a combination of the law of large numbers and good disclosure backing me up. Needless to say, if you do find mistakes, please draw my attention to them.The CaveatsIf you find my data useful in your investing, valuation or corporate finance analysis, you are welcome to partake of it. That said, as a number cruncher who both loves numbers and views them with caution, here are a few things to keep in mind.Numbers ≠ Facts: While the numbers, once reported, look precise, they are not facts. Thus, when you look at the debt ratios that I report for a sector, it is worth emphasizing that I have capitalized lease commitments and added them to all interest bearing debt (short and long term) to arrive at total debt, yielding a different number than what you may see on a different service. I have tried to be as transparent as I can in making my estimates but they reflect my judgment calls. Past is not always prologue: There are some numbers where I report historical trend lines and averages. That is not because I am a die-hard believer in mean reversion, the driving force in many investment philosophies. I believe that knowing history is useful in investing, but trusting it to repeat itself is dangerous.Just because everyone does it does not make it right: As you look at the datasets, you will see patterns in investment, financing and dividend policy in sectors. Some sectors, such as telecommunications, are more debt funded than others, say pharmaceuticals, and other pay more dividends (utilities) than others (technology). While there are often good reasons for these differences, there are also bad ones, with inertial on top of that list. The reality is that there are established corporate finance policies in many sectors that no longer make sense, because the sectors have changed fundamentally over time.As you browse through the numbers, you will notice that I report almost no numbers at the company level. While I do have that data, I am constrained from sharing that data, because I risk stepping on the toes and the legal rights of my raw data providers.
ConclusionAt the end of my data week, I am both exhilarated and exhausted, exhilarated because I can now analyze the data and exhausted because even a number cruncher can get tired of working with numbers. There is information in this data but it will take more care than I have given it so far, but I have the rest of the year to spend looking for those nuggets.
YouTube Video
LinksData BreakdownMy current data pageMy archived data pageData Update PostsJanuary 2018 Data Update 1: Numbers don't lie, or do they?January 2018 Data Update 2: US Equities, Let the Good Times Roll!January 2018 Data Update 3: A New Tax Code - Value Consequences? January 2018 Data Update 4: The Currency QuestionJanuary 2018 Data Update 5: Country Risk January 2018 Data Update 6: Cost of Capital - A Global UpdateJanuary 2018 Data Update 7: Growth and Value - Investment ReturnsJanuary 2018 Data Update 8: Debt and ValueJanuary 2018 Data Update 9: The Cash Harvest - Dividend PolicyJanuary 2018 Data Update 10: The Pricing Prerogative
The What?My dataset includes every publicly traded firm that has a market price available for it, in my raw dataset, and at the start of 2018, it included 43,848 firms, up from the 42,678 firms at the start of 2017. To the question of why I don't restrict myself to just the biggest, the most liquid or the most heavily followed firms, my answer is a statistical one. Any decision that I make on screening the data or sampling will create biases that will color my results, and while I will not claim to be bias-free (no one is), I would prefer to not initiate it with my sampling.
There are 135 countries that are represented in the data, though many have only a handful of firms that are incorporated there. That said, it is worth noting that while the companies are classified by country of incorporation, many have operations in multiple countries. I have classified my firms into five "big" groups: the United States, Europe (EU, UK), Emerging Markets, Japan and Australia/Canada/New Zealand. The pie chart below provides the breakdown:
 Download spreadsheetSince the emerging market grouping includes firms from Asia, Latin America, Africa and Eurasia, I also have the data for sub-groups including India, China, Small Asia (other than India, China and Japan), Latin America, Africa & MidEast and Russia/Eurasia. That is pictured in the second pie chart above.
Within each geographic group, I break the companies down into 94 industry groupings and the numbers in each grouping are summarized at this link. While some would prefer a finer breakdown, I prefer this coarser grouping because it allows for larger sample sizes, especially as I go to sub-groups. Finally, I compute a range of numbers for each grouping, reflecting my corporate finance biases, and classify them into risk, profitability, leverage and cash return measures in the table below:
table.tableizer-table { font-size: 12px; border: 1px solid #CCC; font-family: Arial, Helvetica, sans-serif; } .tableizer-table td { padding: 4px; margin: 3px; border: 1px solid #CCC; } .tableizer-table th { background-color: #104E8B; color: #FFF; font-weight: bold; }
Risk MeasuresCost of FundingPricing Multiples1. Beta1. Cost of Equity1. PE &PEG2. Standard deviation in stock price2. Cost of Debt2. Price to Book3. Standard deviation in operating income3. Cost of Capital3. EV/EBIT, EV/EBITDA and EV/EBITDA4. High-Low Price Risk Measure4. EV/Sales and Price/SalesProfitabilityFinancial LeverageCash Flow Add-ons1. Net Profit Margin1. D/E ratio & Debt/Capital (book & market) (with lease effect)1. Cap Ex & Net Cap Ex2. Operating Margin2. Debt/EBITDA2. Non-cash Working Capital as % of Revenue3. EBITDA, EBIT and EBITDAR&D Margins3. Interest Coverage Ratios3. Sales/Invested CapitalReturnsDividend PolicyRisk Premiums1. Return on Equity1. Dividend Payout & Yield1. Equity Risk Premiums (by country)2. Return on Capital2. Dividends/FCFE & (Dividends Buybacks)/ FCFE2. US equity returns (historical)3. ROE - Cost of Equity4. ROIC - Cost of CapitalThe links in the table will lead you to the html versions of the US data, but you can find the excel versions of this data and for the other groupings on my webpage. Since I report more than 150 data items, you may have to work to find what you are looking for but it (or a close variant) should be available somewhere on the site. Since there can be variations on how metrics are computed (like EV/EBITDA or even PE), I summarize my definitions at this link.
The Why?Much as I would like to claim that my data sharing is driven by altruism and making the world a better place, the reasons are more prosaic. I do this for myself. I enjoy analyzing the data for many reasons:Perspective: As our access to data increases, partly because of increased information disclosure on the part of firms, and partly because technology has made it easier to download data, it is ironic that we are more likely to develop tunnel vision now than before we had access to this data. When valuing individual companies, I find that knowing the industry and geographic averages gives me perspective on the numbers that I use for the company. Thus, when valuing Indofoods, an Indonesian food processing company, I can look at typical profit margins for food processing companies in South East Asia, in making my estimates for inputs, and compare my valuation to the pricing of other South East Asian food companies, when I am done.Rules of Thumb: Investing is full of rules of thumb that we devised in a different time for a different market, but still are used by investors, often without question. The notion that a stock that trades at a PEG ratio less than one or at a price less than its book value is cheap is deeply engrained in value investing books, but is it true? Looking at the cross sectional distributions of PEG and Price to Book ratios across all companies should give us the answer and allow us to eliminate the rules of thumb that no longer work.Curiosity: There are questions that all of us have about companies that the numbers can help answer. Do US companies pay less in taxes than their foreign counterparts? Does growth create or destroy value at companies? The answers to these questions are in the numbers and I find that they provide an antidote to experts who try to pass off opinions as facts.Trends and Shifts: Companies change over time, albeit slowly, and these changes have consequences not just for investors, but for governments, taxpayers and workers. One reason that I do not make jarring changes in the way that I classify and report my numbers is to see how these numbers change over time.In the next two weeks, I will try to summarize what I learn from the data about corporate investment, financing and dividend policy in a series of posts that I have tentatively listed at the end of this post, starting with an update on US equities (and risk premiums) and ending with the a look at market pricing multiples at the end of 2017. Along the way, I will grapple with the rise of crypto currencies and what they might or might not mean for valuation. The motivations for creating these datasets are selfish but I find it pointless to keep them to myself. After all, there is no secret sauce in this data that will lead me to riches, and nothing that someone else with access to the raw data could not generate themselves. If, in the process, a few people are able to use my data in their analyses, I consider them deposits in my "good karma" bank.
The QuirksEach year that I update the data, there are four challenges that await me. The first relates to data timing, where I try to put myself in the shoes of an investor making investment choices on January 2, 2018. The second is how best to deal with missing data, par for the course since my dataset includes some very small companies in under developed markets. The third is to clean up after the accountants, who are not always consistent in their rules across sectors and geographies. The fourth and final challenge is to find and correct mistakes in the data.Timing: All of the data that I have used in my analysis was collected after the close of trading on the last trading day of 2017 (December 29 for most markets) and reflects the most updated data, as of that day. That said, it is worth noting that not all data gets updated at the same rate, with market-set numbers (risk free rate, stock prices, risk premiums) being as of close of trading at the end of the year, but accounting numbers reflecting the most recent financial reports (from October, November and December of 2017). The accounting numbers that I use to compute my financial and pricing ratios are therefore trailing 12-month numbers, if they are updated every quarter, or even 2016 numbers, if they are not updated. Missing Data: Information disclosure requirements vary widely across markets and since my dataset spans all markets, there are some items that are available in some markets and not in others. Rather than eliminate companies with missing data, which will both decimate and bias my sample, I keep them in the sample and deal with them the best that I can. For instance, US companies report stock based compensation as an expense item but many non-US companies do not. I report stock based compensation as a percent of total revenues in every market but they are close to reality only in the US data.Accounting inconsistencies: I have argued in prior posts that accountants are inconsistent in their treatment of capital expenditures and debt across companies, treating the biggest capital expenditures (R&D) at technology and pharmaceutical companies as operating expenses and ignoring the primary debt (leases) at retail and restaurant companies. Rather than wait for accounting rules to come to their senses, which may take decades, I have capitalized both R&D and lease commitments for all companies and that has consequences for my earnings, invested capital and debt numbers.Data mistakes: Working with a spreadsheet with 43,848 companies and 150 data items, I am sure that there are mistakes that have found their way into my summaries, notwithstanding my attempts to catch them. Some of these mistakes are mine but some reflect errors in the raw data. The datasets that are least likely to be affected by mistakes are the US and Global dataset, where I have a combination of the law of large numbers and good disclosure backing me up. Needless to say, if you do find mistakes, please draw my attention to them.The CaveatsIf you find my data useful in your investing, valuation or corporate finance analysis, you are welcome to partake of it. That said, as a number cruncher who both loves numbers and views them with caution, here are a few things to keep in mind.Numbers ≠ Facts: While the numbers, once reported, look precise, they are not facts. Thus, when you look at the debt ratios that I report for a sector, it is worth emphasizing that I have capitalized lease commitments and added them to all interest bearing debt (short and long term) to arrive at total debt, yielding a different number than what you may see on a different service. I have tried to be as transparent as I can in making my estimates but they reflect my judgment calls. Past is not always prologue: There are some numbers where I report historical trend lines and averages. That is not because I am a die-hard believer in mean reversion, the driving force in many investment philosophies. I believe that knowing history is useful in investing, but trusting it to repeat itself is dangerous.Just because everyone does it does not make it right: As you look at the datasets, you will see patterns in investment, financing and dividend policy in sectors. Some sectors, such as telecommunications, are more debt funded than others, say pharmaceuticals, and other pay more dividends (utilities) than others (technology). While there are often good reasons for these differences, there are also bad ones, with inertial on top of that list. The reality is that there are established corporate finance policies in many sectors that no longer make sense, because the sectors have changed fundamentally over time.As you browse through the numbers, you will notice that I report almost no numbers at the company level. While I do have that data, I am constrained from sharing that data, because I risk stepping on the toes and the legal rights of my raw data providers.
ConclusionAt the end of my data week, I am both exhilarated and exhausted, exhilarated because I can now analyze the data and exhausted because even a number cruncher can get tired of working with numbers. There is information in this data but it will take more care than I have given it so far, but I have the rest of the year to spend looking for those nuggets.
YouTube Video
LinksData BreakdownMy current data pageMy archived data pageData Update PostsJanuary 2018 Data Update 1: Numbers don't lie, or do they?January 2018 Data Update 2: US Equities, Let the Good Times Roll!January 2018 Data Update 3: A New Tax Code - Value Consequences? January 2018 Data Update 4: The Currency QuestionJanuary 2018 Data Update 5: Country Risk January 2018 Data Update 6: Cost of Capital - A Global UpdateJanuary 2018 Data Update 7: Growth and Value - Investment ReturnsJanuary 2018 Data Update 8: Debt and ValueJanuary 2018 Data Update 9: The Cash Harvest - Dividend PolicyJanuary 2018 Data Update 10: The Pricing Prerogative
October 27, 2017
Bitcoin Backlash: Back to the Drawing Board?
My last post on Bitcoin got me some push back and I am glad that it did. I would rather be read, and disagreed with, than not read at all. I have been told that I know very little about crypto currencies and that I have much to learn, and I agree. The crux of the disagreements though lay in my classifying Bitcoin as a currency, not as an asset or as a commodity. Since this classification is central to how you should think about investing versus trading, and value versus price, and goes well beyond Bitcoin, I decided to dig deeper into the classification and provide even more ammunition for those who disagree with me to tell me how wrong I am.
Classifying Investment: The What and the Why
We are products of our own world views, and mine, for better or worse, are built around my interest in valuation. It is that perspective that led me to classifying investments into cash flow generating assets, commodities, currencies and collectibles. To value an investment, I need that investment to generate future cashflows (at least on an expected basis) and that was my basis for separating cash flow generating assets (which range the spectrum from a bond to a stock to a business) from the rest.
The pushback that I got did not surprised me, partly because my definition may be at odds with the definitions used by other entities. Accountants, for instance, classify items as assets that I think are pure fiction, such as goodwill. There are others who argue that any investment on which you can make money is an asset, broadening it to include just about everything from baseball cards to government bonds. In fact, crypto currencies have been at the center of many of these disagreements, with the SEC recently deciding to treat ICOs as securities (and thus assets) and the Korean central bank categorizing Bitcoin as a commodity. Since the judgment made by these entities have regulatory and tax consequences, I am sure that they will be debated, discussed and disagreed with.
Why Bitcoin is a currency and not an asset..One reason that people are uncomfortable drawing the line between currency, commodity and asset is that the line can sometimes shift quickly. Take the US dollar, for instance. Its primary purpose is to serve as a medium of exchange and as a store of value, and it is thus a currency. However, you can lend US dollars to a business or individual and generate interest income. That is true, but it is not the currency that is then the asset, but the loan that you make with it, or the bond that is denominated in it. Building further, if I create a bank that takes in deposits in dollars (and pays an interest rate on them) and lends out those dollars as loans, I have a business and that business is an asset. I can value the loan and the bond based upon the interest rate you earn and the default risk that you face, or the bank, based upon the interest rate spread it earns and the risk of default that it faces on its collective portfolio, but I cannot value the US dollar.
Can I construct investments denominated in Bitcoin or another crypto currency that earn me interest or a return? Of course, but I can do that in any currency, and it is in fact one of the functions of a currency. That does not make Bitcoin an asset! You can already see that the question of whether Initial Coin Offerings (ICO) are currencies or assets becomes trickier, because an ICO can be constructed to give you a share of the ownership in a business (and the cash flows from that business), making it more of an asset than a currency (thus giving credence to the SEC's view that it is a security). The lack of standardization in ICO structures, though, makes it difficult to generalize, since loosely put, an ICO can be constructed to be anything from a donation (at least, according to Kathleen Breitman at Tezos) to quasi common stock (without the voting rights).
A few of you have pointed to the networking benefits that might create value for Bitcoin, but I am afraid that I don't see that as a basis for assigning value to it. A network can become an asset, but only when you can make money off the network. The value of Facebook to me, as an investor, is not that I am part of the Facebook network (I am not, since I have not posted on Facebook in almost three years) but that I get a share of the money made from selling advertising to those on the network. Unless you can trace monetary benefits to being part of the Bitcoin network, there is no value to being part of the network. (Visa and MasterCard are assets, not because they have wide networks and are accepted globally, but because every time they are used, they make 1-2% of the transaction value.) To the argument that Bitcoin miners can make money as the network expands, that value is for providing a service, not for holding Bitcoin.
Why Bitcoin is more currency than commodity
The essence of a currency is that its primary uses are as a medium of exchange or as a store of value. The key to a commodity is that it is an input into a process that has a utilitarian function. Oil and coal are clearly commodities, since they derive their value from the fact that they can be used to produce energy. It is true, as with currencies, that you can create an asset based upon a commodity. A share of an oil well is an asset not because you like or even need oil, it is because you hope to sell the oil to generate cash flows. It is also true that gold is a commodity, but as I noted in the prior post, I think it is more currency than commodity, because the quantity of gold that we have on the face of the earth vastly exceeds whatever utilitarian needs it might serve. It is shiny, durable, makes beautiful jewelry and has some industrial uses, but if that is all we valued gold for, it would be worth a lot less than it is trading for, and there would be less of it around.
The question with Bitcoin then becomes whether it can become (or perhaps already is) like gold. Here is my test: If tomorrow, humanity collectively decided to abandon its attachment to gold as a value store, would its price go to zero? I don't think so, because it does have uses and while its price will drop, it will be priced like based on those uses. Applying the same test to Bitcoin, I am left nonplussed about what value to attach to a digital currency if at the end, no one uses it in transactions, it has no aesthetic value and it produces nothing utilitarian.
A Commodity Argument for Crypto Currencies (but perhaps not for Bitcoin)Some of you have pointed to Bitcoin's scarcity (created by the hard cap on production) and the fact that time and energy are spent on its production. Scarcity is neither a sufficient nor even a necessary condition for something to be a commodity. Sand is a scarce resource but it is not a commodity because I cannot think of a good use for it; so is bull manure, but that is a discussion for another time and day. The fact that time and energy went into the production of Bitcoin cannot be used to justify paying for it unless you can show that it is necessary for something that does create utility or value. If, as argued by someone who commented on my last post, Bitcoin is a synthetic commodity, I can see that it is synthetic but what conceivable use does it have that makes it a commodity? Therein lies an opening for a “crypto currency as commodity” defense, though it works better for crypto currencies like Ethereum than it does for Bitcoin, and it require three building blocks: Block Chains and Smart Contracts will create large disruptions in businesses: You have to believe that block chains and the smart contracts that emerge from them will replace conventional contracts in many businesses, and that will generate cash flows to the contract providers. Your argument can be based upon either economic (that the transactions costs willl be lower) or security (that the contracts will be more secure) rationales.Crypto Currencies are the lubricants for smart contracting: The discussion of block chains and crypto currency have become entangled into one discussion, but it is worth remembering that block chains predate crypto currencies and can work with fiat currencies. Thus, you will have to argue that crypto currencies are a necessary ingredient to make smart contracts work efficiently, and that the demand for them will then rise as smart contracting expands. “Your” crypto currency will be one of the winners: Even if you can make the first two legs of this argument, it remains an argument for growth in digital or crypto currencies, not an argument for a specific one. To seal the deal, you will have to explain why your crypto currency of choice (Bitcoin, Ethereum etc.) will become the winner or at least one of the winners in the smart contracting currency race, perhaps because it has the “best technology” for smart contracting or has the most buy in by the institutional players in the game.I think that the first leg of this argument will be easy to make, the second leg a little more difficult and the third leg will need the most convincing. Even if you can show, based upon today's technology, that you have the "best" smart contracting currency, how do you build barriers to entry that prevent you being pre-empted by another innovation or technology down the road?
ConclusionThe game is still early, and there is much that we do not know about crypto currencies. I remain willing to learn both from people who know more than I do (and there are many out there) as well as events on the ground. As you listen to arguments for or against crypto currencies, my only advice is that you go back to basics about the needs that they are filling and that you ask questions about their long term staying power. I think it is also time for us to separate arguments about block chains/smart contracts from arguments about crypto currencies, since you can have one without the other, and to differentiate between crypto currencies, rather than defend them or abandon them all, as a bundle. To me, Bitcoin, Ethereum, Ripple and ICOs are different enough from each other, not only in structure but also in terms of end game, that they need to be assessed independently.
YouTube Video
Past Blog Posts on Crypto CurrenciesBitcoin Q&A: Bubble or Breakthrough?Crypto Currencies: Future of Money or Speculative HypeThe Bitcoin Boom: Asset, Currency, Commodity or Collectible
October 24, 2017
The Bitcoin Boom: Asset, Currency, Commodity or Collectible?
As I have noted with my earlier posts on crypto currencies, in general, and bitcoin, in particular, I find myself disagreeing with both its most virulent critics and its strongest proponents. Unlike Jamie Dimon, I don't believe that bitcoin is a fraud and that people who are "stupid enough to buy it" will pay a price for that stupidity. Unlike its biggest cheerleaders, I don't believe that crypto currencies are now or ever will be an asset class or that these currencies can change fundamental truths about risk, investing and management. The reason for the divide, though, is that the two sides seem to disagree fundamentally on what bitcoin is, and at the risk of raising hackles all the way around, I will argue that bitcoin is not an asset, but a currency, and as such, you cannot value it or invest in it. You can only price it and trade it.
Assets, Commodities, Currencies and Collectibles
Not everything can be valued, but almost everything can be priced. To understand the distinction between value and price, let me start by positing that every investment that I will look at has to fall into one of the following four groupings:
Cash Generating Asset: An asset generates or is expected to generate cash flows in the future. A business that you own is definitely an asset, as is a claim on the cash flows on that business. Those claims can be either contractually set (bonds or debt), residual (equity or stock) or even contingent (options). What assets share in common is that these cash flows can be valued, and assets with high cash flows and less risk should be valued more than assets with lower cash flows and more risk. At the same time, assets can also be priced, relative to each other, by scaling the price that you pay to a common metric. With stocks, this takes the form of comparing pricing multiples (PE ratio, EV/EBITDA, Price to Book or Value/Sales) across similar companies to form pricing judgments of which stocks are cheap and which ones are expensive.Commodity: A commodity derives its value from its use as raw material to meet a fundamental need, whether it be energy, food or shelter. While that value can be estimated by looking at the demand for and supply of the commodity, there are long lag and lead times in both that make that valuation process much more difficult than for an asset. Consequently, commodities tend to be priced, often relative to their own history, with normalized oil, coal wheat or iron ore prices being computed by averaging prices across long cycles.Currency: A currency is a medium of exchange that you use to denominate cash flows and is a store of purchasing power, if you choose to not invest. Standing alone, currencies have no cash flows and cannot be valued, but they can be priced against other currencies. In the long term, currencies that are accepted more widely as a medium of exchange and that hold their purchasing power better over time should see their prices rise, relative to currencies that don't have those characteristics. In the short term, though, other forces including governments trying to manipulate exchange rates can dominate. Using a more conventional currency example, you can see this in a graph of the US $ against seven fiat currencies, where over the long term (1995-2017), you can see the Swiss Franc and the Chinese Yuan increasing in price, relative to the $, and the Mexican Peso, Brazilian Real, Indian Rupee and British Pound, dropping in price, again relative to the $.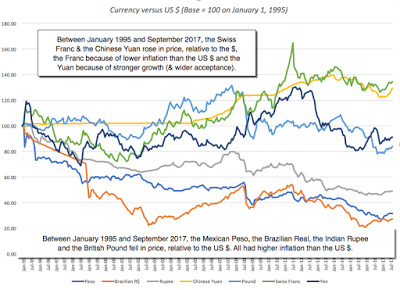 Collectible: A collectible has no cash flows and is not a medium of exchange but it can sometimes have aesthetic value (as is the case with a master painting or a sculpture) or an emotional attachment (a baseball card or team jersey). A collectible cannot be valued since it too generates no cash flows but it can be priced, based upon how other people perceive its desirability and the scarcity of the collectible. Viewed through this prism, Gold is clearly not a cash flow generating asset, but is it a commodity? Since gold's value has little to do with its utilitarian functions and more to do with its longstanding function as a store of value, especially during crises or when you lose faith in paper currencies, it is more currency than commodity. Real estate is an asset, even if it takes the form of a personal home, because you would have had to pay rental expenses (a cash flow), in its absence. Private equity and hedge funds are forms of investing in assets, currencies, commodities or collectibles, and are not separate asset classes.
Investing versus Trading
The key is that cash generating assets can be both valued and priced, commodities can be priced much more easily than valued, and currencies and collectibles can only be priced. So what? I have written before about the divide between investing and trading and it is worth revisiting that contrast. To invest in something, you need to assess its value, compare to the price, and then act on that comparison, buying if the price is less than value and selling if it is greater. Trading is a much simpler exercise, where you price something, make a judgment on whether that price will go up or down in the next time period and then make a pricing bet. While you can be successful at either, the skill sets and tool kits that you use are different for investing and trading, and what makes for a good investor is different from the ingredients needed for good trading. The table below captures the difference between trading (the pricing game) and investing (the value game).
The Pricing Game The Value Game Underlying philosophy The price is the only real number that you can act on. No one knows what the value of an asset is and estimating it is of little use. Every asset has a fair or true value. You can estimate that value, albeit with error, and price has to converge on value (eventually). To play the game You try to guess which direction the price will move in the next period(s) and trade ahead of the movement. To win the game, you have to be right more often than wrong about direction and to exit before the winds shift. You try to estimate the value of an asset, and if it is under(over) value, you buy (sell) the asset. To win the game, you have to be right about value (for the most part) and the market price has to move to that value Key drivers Price is determined by demand & supply, which in turn are affected by mood and momentum. Value is determined by cash flows, growth and risk. Information effect Incremental information (news, stories, rumors) that shifts the mood will move the price, even if it has no real consequences for long term value. Only information that alter cash flows, growth and risk in a material way can affect value. Tools of the game (1) Technical indicators, (2) Price Charts (3) Investor Psychology (1) Ratio analysis, (2) DCF Valuation (3) Accounting Research Time horizon Can be very short term (minutes) to mildly short term (weeks, months). Long term Key skill Be able to gauge market mood/momentum shifts earlier than the rest of the market. Be able to “value” assets, given uncertainty. Key personality traits (1) Market amnesia (2) Quick Acting (3) Gambling Instincts (1) Faith in “value” (2) Faith in markets (3) Patience (4) Immunity from peer pressure Biggest Danger(s) Momentum shifts can occur quickly, wiping out months of profits in a few hours. The price may not converge on value, even if your value is “right”. Added bonus Capacity to move prices (with lots of money and lots of followers). Can provide the catalyst that can move price to value. Most Delusional Player A trader who thinks he is trading based on value. A value investor who thinks he can reason with markets.
As I see it, you can play either the value or pricing game well, but being delusional about the game you are playing, and using the wrong tools or bringing the wrong skill set to that game, is a recipe for disaster.
What is Bitcoin?
The first step towards a serious debate on bitcoin then has to be deciding whether it is an asset, a currency, a commodity or collectible. Bitcoin is not an asset, since it does not generate cash flows standing alone for those who hold it (until you sell it). It is not a commodity, because it is not raw material that can be used in the production of something useful. The only exception that I can think off is that if it becomes a necessary component of smart contracts, it could take on the role of a commodity; that may be ethereum's saving grace, since it has been marketed less as a currency and more as a smart contracting lubricant. The choice then becomes whether it is a currency or a collectible, with its supporters tilting towards the former and its detractors the latter. I argued in my last post that Bitcoin is a currency, but it is not a good one yet, insofar as it has only limited acceptance as a medium of exchange and it is too volatile to be a store of value. Looking forward, there are three possible paths that I see for Bitcoin as a currency, from best case to worst case.The Global Digital Currency: In the best case scenario, Bitcoin gains wide acceptance in transactions across the world, becoming a widely used global digital currency. For this to happen, it has to become more stable (relative to other currencies), central banks and governments around the world have to accept its use (or at least not actively try to impede it) and the aura of mystery around it has to fade. If that happens, it could compete with fiat currencies and given the algorithm set limits on its creation, its high price could be justified.Gold for Millennials: In this scenario, Bitcoin becomes a haven for those who do not trust central banks, governments and fiat currencies. In short, it takes on the role that gold has, historically, for those who have lost trust in or fear centralized authority. It is interesting that the language of Bitcoin is filled with mining terminology, since it suggests that intentionally or otherwise, the creators of Bitcoin shared this vision. In fact, the hard cap on Bitcoin of 21 million is more compatible with this scenario than the first one. If this scenario unfolds, and Bitcoin shows the same staying power as gold, it will behave like gold does, rising during crises and dropping in more sanguine time periods. The 21st Century Tulip Bulb: In this, the worst case scenario, Bitcoin is like a shooting star, attracting more money as it soars, from those who see it as a source of easy profits, but just as quickly flares out as these traders move on to something new and different (which could be a different and better designed digital currency), leaving Bitcoin holders with memories of what might have been. If this happens, Bitcoin could very well become the equivalent of Tulip Bulbs, a speculative asset that saw its prices soar in the sixteen hundreds in Holland, before collapsing in the aftermath.I would be lying if I said that I knew which of these scenarios will unfold, but they are all still plausible scenarios. If you are trading in Bitcoin, you may very well not care, since your time horizon may be in minutes and hours, not weeks, months or years. If you have a longer term interest in Bitcoin, though, your focus should be less on the noise of day-to-day price movements and more on advancements on its use as a currency. Note also that you could be a pessimist on Bitcoin and other crypto currencies but be an optimist about the underlying technology, especially block chain, and its potential for disruption.
Reality Checks
Combining the section where I classified investments into assets, commodities, currencies and collectibles with the one where I argued that Bitcoin is a "young" currency allows me to draw the following conclusions:Bitcoin is not an asset class: To those who are carving out a portion of their portfolios for Bitcoin, be clear about why you are doing it. It is not because you want to a diversified portfolio and hold all asset classes, it is because you want to use your trading skills on Bitcoin to supercharge your portfolio returns. Lest you view this as a swipe at cryptocurrencies, I would hasten to add that fiat currencies (like the US dollar, Euro or Yen) are not asset classes either.You cannot value Bitcoin, you can only price it: This follows from the acceptance that Bitcoin is a currency, not an asset or a commodity. Any one who claims to value Bitcoin either has a very different definition of value than I do or is just making up stuff as he or she goes along.It will be judged as a currency: In the long term, the price that you attach to Bitcoin will depend on how well it will performs as a currency. If it is accepted widely as a medium of exchange and is stable enough to be a store of value, it should command a high price. If it becomes gold-like, a fringe currency that investors flee to during crises, its price will be lower. Worse, if it is a transient currency that loses all purchasing power, as it is replaced by something new and different, it will crash and burn.You don't invest in Bitcoin, you trade it: Since you cannot value Bitcoin, you don't have a critical ingredient that you need to be an investor. You can trade Bitcoin and become wealthy doing so, but it is because you are a good trader.Good trader ingredients: To be a successful trader in Bitcoin, you need to recognize that moves in its price will have little do with fundamentals, everything to do with mood and momentum and big price shifts can happen on incremental information.Would I buy Bitcoin at $6,100? No, but not for the reasons that you think. It is not because I believe that it is over valued, since I cannot make that judgment without valuing it and as I noted before, it cannot be valued. It is because I am not and never have been a good trader and, as a consequence, my pricing judgments are suspect. If you have good trading instincts, you should play the pricing game, as long as you recognize that it is a game, where you can win millions or lose millions, based upon your calls on momentum. If you win millions, I wish you the best! If you lose millions, please don't let paranoia lead you to blame the establishment, banks and governments for why you lost. Come easy, go easy!
YouTube Video
Past Blog Posts on Crypto Currencies
Bitcoin Q&A: Bubble or Breakthrough?Crypto Currencies: Future of Money or Speculative Hype
Assets, Commodities, Currencies and Collectibles
Not everything can be valued, but almost everything can be priced. To understand the distinction between value and price, let me start by positing that every investment that I will look at has to fall into one of the following four groupings:
Cash Generating Asset: An asset generates or is expected to generate cash flows in the future. A business that you own is definitely an asset, as is a claim on the cash flows on that business. Those claims can be either contractually set (bonds or debt), residual (equity or stock) or even contingent (options). What assets share in common is that these cash flows can be valued, and assets with high cash flows and less risk should be valued more than assets with lower cash flows and more risk. At the same time, assets can also be priced, relative to each other, by scaling the price that you pay to a common metric. With stocks, this takes the form of comparing pricing multiples (PE ratio, EV/EBITDA, Price to Book or Value/Sales) across similar companies to form pricing judgments of which stocks are cheap and which ones are expensive.Commodity: A commodity derives its value from its use as raw material to meet a fundamental need, whether it be energy, food or shelter. While that value can be estimated by looking at the demand for and supply of the commodity, there are long lag and lead times in both that make that valuation process much more difficult than for an asset. Consequently, commodities tend to be priced, often relative to their own history, with normalized oil, coal wheat or iron ore prices being computed by averaging prices across long cycles.Currency: A currency is a medium of exchange that you use to denominate cash flows and is a store of purchasing power, if you choose to not invest. Standing alone, currencies have no cash flows and cannot be valued, but they can be priced against other currencies. In the long term, currencies that are accepted more widely as a medium of exchange and that hold their purchasing power better over time should see their prices rise, relative to currencies that don't have those characteristics. In the short term, though, other forces including governments trying to manipulate exchange rates can dominate. Using a more conventional currency example, you can see this in a graph of the US $ against seven fiat currencies, where over the long term (1995-2017), you can see the Swiss Franc and the Chinese Yuan increasing in price, relative to the $, and the Mexican Peso, Brazilian Real, Indian Rupee and British Pound, dropping in price, again relative to the $.
 Collectible: A collectible has no cash flows and is not a medium of exchange but it can sometimes have aesthetic value (as is the case with a master painting or a sculpture) or an emotional attachment (a baseball card or team jersey). A collectible cannot be valued since it too generates no cash flows but it can be priced, based upon how other people perceive its desirability and the scarcity of the collectible. Viewed through this prism, Gold is clearly not a cash flow generating asset, but is it a commodity? Since gold's value has little to do with its utilitarian functions and more to do with its longstanding function as a store of value, especially during crises or when you lose faith in paper currencies, it is more currency than commodity. Real estate is an asset, even if it takes the form of a personal home, because you would have had to pay rental expenses (a cash flow), in its absence. Private equity and hedge funds are forms of investing in assets, currencies, commodities or collectibles, and are not separate asset classes.
 Investing versus Trading
The key is that cash generating assets can be both valued and priced, commodities can be priced much more easily than valued, and currencies and collectibles can only be priced. So what? I have written before about the divide between investing and trading and it is worth revisiting that contrast. To invest in something, you need to assess its value, compare to the price, and then act on that comparison, buying if the price is less than value and selling if it is greater. Trading is a much simpler exercise, where you price something, make a judgment on whether that price will go up or down in the next time period and then make a pricing bet. While you can be successful at either, the skill sets and tool kits that you use are different for investing and trading, and what makes for a good investor is different from the ingredients needed for good trading. The table below captures the difference between trading (the pricing game) and investing (the value game).
The Pricing Game The Value Game Underlying philosophy The price is the only real number that you can act on. No one knows what the value of an asset is and estimating it is of little use. Every asset has a fair or true value. You can estimate that value, albeit with error, and price has to converge on value (eventually). To play the game You try to guess which direction the price will move in the next period(s) and trade ahead of the movement. To win the game, you have to be right more often than wrong about direction and to exit before the winds shift. You try to estimate the value of an asset, and if it is under(over) value, you buy (sell) the asset. To win the game, you have to be right about value (for the most part) and the market price has to move to that value Key drivers Price is determined by demand & supply, which in turn are affected by mood and momentum. Value is determined by cash flows, growth and risk. Information effect Incremental information (news, stories, rumors) that shifts the mood will move the price, even if it has no real consequences for long term value. Only information that alter cash flows, growth and risk in a material way can affect value. Tools of the game (1) Technical indicators, (2) Price Charts (3) Investor Psychology (1) Ratio analysis, (2) DCF Valuation (3) Accounting Research Time horizon Can be very short term (minutes) to mildly short term (weeks, months). Long term Key skill Be able to gauge market mood/momentum shifts earlier than the rest of the market. Be able to “value” assets, given uncertainty. Key personality traits (1) Market amnesia (2) Quick Acting (3) Gambling Instincts (1) Faith in “value” (2) Faith in markets (3) Patience (4) Immunity from peer pressure Biggest Danger(s) Momentum shifts can occur quickly, wiping out months of profits in a few hours. The price may not converge on value, even if your value is “right”. Added bonus Capacity to move prices (with lots of money and lots of followers). Can provide the catalyst that can move price to value. Most Delusional Player A trader who thinks he is trading based on value. A value investor who thinks he can reason with markets.
As I see it, you can play either the value or pricing game well, but being delusional about the game you are playing, and using the wrong tools or bringing the wrong skill set to that game, is a recipe for disaster.
What is Bitcoin?
The first step towards a serious debate on bitcoin then has to be deciding whether it is an asset, a currency, a commodity or collectible. Bitcoin is not an asset, since it does not generate cash flows standing alone for those who hold it (until you sell it). It is not a commodity, because it is not raw material that can be used in the production of something useful. The only exception that I can think off is that if it becomes a necessary component of smart contracts, it could take on the role of a commodity; that may be ethereum's saving grace, since it has been marketed less as a currency and more as a smart contracting lubricant. The choice then becomes whether it is a currency or a collectible, with its supporters tilting towards the former and its detractors the latter. I argued in my last post that Bitcoin is a currency, but it is not a good one yet, insofar as it has only limited acceptance as a medium of exchange and it is too volatile to be a store of value. Looking forward, there are three possible paths that I see for Bitcoin as a currency, from best case to worst case.The Global Digital Currency: In the best case scenario, Bitcoin gains wide acceptance in transactions across the world, becoming a widely used global digital currency. For this to happen, it has to become more stable (relative to other currencies), central banks and governments around the world have to accept its use (or at least not actively try to impede it) and the aura of mystery around it has to fade. If that happens, it could compete with fiat currencies and given the algorithm set limits on its creation, its high price could be justified.Gold for Millennials: In this scenario, Bitcoin becomes a haven for those who do not trust central banks, governments and fiat currencies. In short, it takes on the role that gold has, historically, for those who have lost trust in or fear centralized authority. It is interesting that the language of Bitcoin is filled with mining terminology, since it suggests that intentionally or otherwise, the creators of Bitcoin shared this vision. In fact, the hard cap on Bitcoin of 21 million is more compatible with this scenario than the first one. If this scenario unfolds, and Bitcoin shows the same staying power as gold, it will behave like gold does, rising during crises and dropping in more sanguine time periods. The 21st Century Tulip Bulb: In this, the worst case scenario, Bitcoin is like a shooting star, attracting more money as it soars, from those who see it as a source of easy profits, but just as quickly flares out as these traders move on to something new and different (which could be a different and better designed digital currency), leaving Bitcoin holders with memories of what might have been. If this happens, Bitcoin could very well become the equivalent of Tulip Bulbs, a speculative asset that saw its prices soar in the sixteen hundreds in Holland, before collapsing in the aftermath.I would be lying if I said that I knew which of these scenarios will unfold, but they are all still plausible scenarios. If you are trading in Bitcoin, you may very well not care, since your time horizon may be in minutes and hours, not weeks, months or years. If you have a longer term interest in Bitcoin, though, your focus should be less on the noise of day-to-day price movements and more on advancements on its use as a currency. Note also that you could be a pessimist on Bitcoin and other crypto currencies but be an optimist about the underlying technology, especially block chain, and its potential for disruption.
Reality Checks
Combining the section where I classified investments into assets, commodities, currencies and collectibles with the one where I argued that Bitcoin is a "young" currency allows me to draw the following conclusions:Bitcoin is not an asset class: To those who are carving out a portion of their portfolios for Bitcoin, be clear about why you are doing it. It is not because you want to a diversified portfolio and hold all asset classes, it is because you want to use your trading skills on Bitcoin to supercharge your portfolio returns. Lest you view this as a swipe at cryptocurrencies, I would hasten to add that fiat currencies (like the US dollar, Euro or Yen) are not asset classes either.You cannot value Bitcoin, you can only price it: This follows from the acceptance that Bitcoin is a currency, not an asset or a commodity. Any one who claims to value Bitcoin either has a very different definition of value than I do or is just making up stuff as he or she goes along.It will be judged as a currency: In the long term, the price that you attach to Bitcoin will depend on how well it will performs as a currency. If it is accepted widely as a medium of exchange and is stable enough to be a store of value, it should command a high price. If it becomes gold-like, a fringe currency that investors flee to during crises, its price will be lower. Worse, if it is a transient currency that loses all purchasing power, as it is replaced by something new and different, it will crash and burn.You don't invest in Bitcoin, you trade it: Since you cannot value Bitcoin, you don't have a critical ingredient that you need to be an investor. You can trade Bitcoin and become wealthy doing so, but it is because you are a good trader.Good trader ingredients: To be a successful trader in Bitcoin, you need to recognize that moves in its price will have little do with fundamentals, everything to do with mood and momentum and big price shifts can happen on incremental information.Would I buy Bitcoin at $6,100? No, but not for the reasons that you think. It is not because I believe that it is over valued, since I cannot make that judgment without valuing it and as I noted before, it cannot be valued. It is because I am not and never have been a good trader and, as a consequence, my pricing judgments are suspect. If you have good trading instincts, you should play the pricing game, as long as you recognize that it is a game, where you can win millions or lose millions, based upon your calls on momentum. If you win millions, I wish you the best! If you lose millions, please don't let paranoia lead you to blame the establishment, banks and governments for why you lost. Come easy, go easy!
YouTube Video
Past Blog Posts on Crypto Currencies
Bitcoin Q&A: Bubble or Breakthrough?Crypto Currencies: Future of Money or Speculative Hype
October 17, 2017
Deconstructing Amazon Prime: Loss Leader or Value Creator?
Update (October 17, 2017): One of the things that I enjoy most about posting my valuations online is the feedback and how much I can use that feedback loop to improve my valuation. There are three changes that I have made to my Amazon valuation, though the end number that I get is not that different. First, as many Prime members outside the US have pointed out, the cost of Amazon Prime is less than $99/year in many countries, ranging from $22/year in Italy to just over $50/year in Germany to only $8/year in India. That lower annual cost will bring down the value of a member (existing and new). To allow for that, I have replaced the $99 annual fee that I had used in my valuation with $93.78, a weighted average of the fees, allowing for the one quarter of Prime customers in the US who have monthly subscriptions (and pay more) and the 20% of customers outside the US (my estimate), who pay, on average, about $50/year. Second, as some of you have noted, my operating margin was computed prior to just shipping costs and that I am double counting the customer service and media costs, which should also be added back. That increases my operating margin to 12.11% from 9.19% and I will assume that it improves to 13% over time. Third, and this was entirely my mistake, my value per existing member did not factor in the drop out rate and that has been fixed.
I am an Amazon Prime member and have been one for a long time, and I am completely hooked. Not only do I (and my family) use Amazon Prime for items ranging from tissue paper to big screen televisions, but it has become my go-to for every possession that I need in my working and personal life. In fact, I know (and am completely at peace with the fact) that it has subtly affected my buying, as I substitute slightly more expensive Prime items for non-Prime equivalents, even when I shop on Amazon. It is not just the absence of shipping costs that draws me to Prime, but the reliability of delivery and the ease of return. In short, it makes shopping painless. As I tally how much we save each year because of Prime and weigh it against the $99 that we pay for it, I am convinced that we are getting far more value from it than what we pay, and that leads to an interesting follow up. If many of the 85 million other Prime members in October 2017 are getting the same bargain that we are, is this not an indication that Amazon has not just under priced Prime, but is perhaps selling it below cost? As someone who has wrestled with valuing Amazon over the last 20 years, I have learned never to under estimate the company. In this post, I would like to take the process I used to value a user at Uber and apply it to value not just a Prime member to Amazon but the collective value of Amazon Prime to the company.
The Growth of Amazon Prime
Amazon introduced Prime in 2005 and the service was slow to take off. At the end of 2011, only about 4% of Amazon customers were Prime members. In the years since, though, the service has seen explosive growth:
 In fact, the jump in members in the last three years is particularly impressive, given how much bigger the base has become. In 2016, the company added almost 20 million new members and is on pace to add a similar number this year. In October 2017, the company’s mammoth Prime user base meant that almost 60% of all US households had memberships, suggesting that a non-Prime member is more the exception than the rule for Amazon’s US operations. Growth has been slower outside the US, slowed both by competitive/regulatory pressures and logistical challenges.
The Economics of Amazon PrimeTo understand how Amazon Prime works, let’s break down the mechanics. Any one (in the countries where Prime is offered) can become a Prime member, either on a monthly or an annual basis. In the US, in 2017, the annual fee for membership was $99, as it has been for the last few years, and the monthly fee was $10.99. With 85 million members, that translates into a total revenue for the company of over $8.5 billion; the monthly members pay more but there is a portion of the membership (including students) who get discounted memberships. The other benefit for Amazon, though, comes from the fact that Amazon Prime members spend more on Amazon than non-Prime members. While the exact numbers are known only to Amazon, the most recently leaked reports suggest that the typical Prime member spends approximately $1,300/year on Amazon products, as opposed to the $700 spent by a non-Prime member. While it seems obvious, then, that Prime membership leads to more spending ($600, if you believe these two numbers), the statisticians will raise red flags about sampling bias since the true incremental revenue is unobservable; it is the difference between what the existing Prime members are spending ($1300/year) and what those same members would have spent, if they did not have Prime memberships. That is a reasonable point, but there is clearly a Prime impact, where Prime members choose Prime items over less expensive non-Prime offerings on Amazon, just as I do.
The biggest cost, by far, to Amazon is the shipping cost that the company now bears on Prime items. In 2016, the company reported net shipping subsidy costs of $7.2 billion (in the footnotes to the 10K) and assuming that almost all of these costs were related to servicing the 60 million members that Amazon had in 2016 leads to a per-member shipping cost of close to $120/ member. The other free services that Amazon offers its Prime members also create costs, though those costs are embedded in larger company-wide items and are more difficult to separate out. The company expends administrative costs in providing additional customer service to its Prime members. These costs are part of the total G&A cost of $2,432 million that the company reported in 2016, but we will assume that the servicing cost per member was $10 (or $600 million in the aggregate in 2016).The company also buys some content for its media and Kindle reading sections specifically to back up its Prime membership. Again, that cost is part of the $16,085 million that the company as its technology and content cost in 2016 and we will assume that 10% of those costs (approximately $1.6 billion) can be attributed to Amazon Prime.There is one final component of cost that we would like to know, but have to guess at and that is the cost to Amazon of acquiring a new member. That promotional/marketing cost is part of the total marketing cost of $7,233 million that Amazon reported in 2016 and we will assume that this cost is $100/member; in 2016, this would have translated into a total cost of $2 billion to acquire 20 million new members, leaving the remaining $5.2 billion in marketing costs as conventional advertising/marketing cost. Pulling all these numbers, real and imagined, into a picture, here is what we get as the economics of an Amazon Prime member.

The closing statistic that is worth emphasizing here is that once someone becomes an Amazon Prime member, they tend to stay as members with an annual renewal rate of 96%.
The Value of an Existing Prime Member
Using the numbers from the previous section as a starting point, we are on our way to valuing an existing Prime member. To get to that value, we have to make some estimates for the future that reflect how the base numbers will evolve over time:Renewal Rate: We will assume that annual renewal rates will stay high, at 96%, since the subscription model and the dependence on free shipping makes dropping the service difficult to do. Incremental Revenue/ Member Growth: As Amazon looks for new products and services to sell its Prime members, we will assume that the company’s legendary marketing skills will work and that the incremental revenue (which we estimated to be $600 and attributed entirely to Prime membership) will grow 10% a year for the next five years. That growth rate will scale down to the inflation rate (1.50%) in year 10, but that cumulated effect will result in incremental sales of $1,275/member in 2027. Operating Margins on revenues: To estimate the operating margin on revenues, I started with Amazon's operating margin but then added back the shipping, customer service and Prime media acquisition costs, since I treat them as separate costs. The resulting margin is 12.11%.Shipping Costs: The biggest cost to Amazon is shipping and much of what the company seems to be doing both in terms of new investments (in distribution centers, trucks and drop off locations) and acquisitions (Whole Foods) seems to be designed to keep these costs in check. We will assume that shipping costs will grow 3% a year for the next five years (well below the incremental revenue growth), before settling into growing at the inflation rate thereafter. Customer Service Costs: The cost of Prime member customer service will increase 5% a year for the next 5 years and the inflation rate thereafter.Risk and Cost of Capital: I will assume that Amazon’s overall cost of capital applies as the right risk adjusted rate to use on all of its member valuations, since they partake in its entire product line. That cost of capital, in October 2017, given a US treasury bond rate of 2.35% was 8.00%.With those assumptions in place, we can estimate the value of a Prime member:
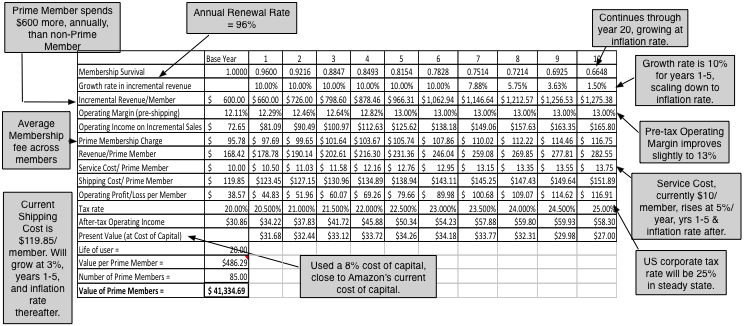 Download spreadsheetWith our estimates, the value per prime member is approximately $486 and the total value of 85 million prime members is $41.3 billion. While you may view this value as built on a mountain of guesstimates, and you would be right, the analysis does provide guidance on the drivers of Prime member value. The two biggest are:Growth in incremental revenues: Getting Amazon Prime members to buy more products and services is key to their value and it should be no surprise to see stories like this one. As revenue growth climbs from 10% to 15%, for instance, the value of an existing member becomes $744 and the value of member base increases almost 65%.Keeping shipping costs contained: The key to extracting value from Prime members is checking shipping costs. To illustrate, if shipping costs grow at the same rate as incremental revenues do, the value per member collapses to $71.50. Viewing Prime members through this prism makes it easier to explain the Whole Foods acquisition, by Amazon, for about $14 billion. Rather than think of it as Amazon’s entrée into a low-margin, intensely competitive grocery business, it would make more sense to view it as an acquisition of a distribution system (of 460 Whole Foods stores, in prime locations) that will reduce shipping costs in the future, while also providing a new menu of products/services that can be offered to Prime members. That is bad news for a whole host of other players in the market but that is a story for another day.
The Value of a New MemberTo get from the value of an existing member to that of a new member, you need to have a measure of how much Amazon is spending to acquire new members. As I noted earlier, the company is opaque on this issue, though I would hazard a guess that it is a much more onerous number outside the United States. If you work with my guess of $100/new member as the base year number, we need only one more estimate to get to the value of new members and that is the growth in the membership base. Given the success that the company has shown on this front in the last five years, we will assume a growth rate of 15% for the next five years (which will bring Prime membership to 155 million in 2022). Given that large base, we will scale growth down to 5% a year from years 6-10 and to 2.25% a year thereafter.
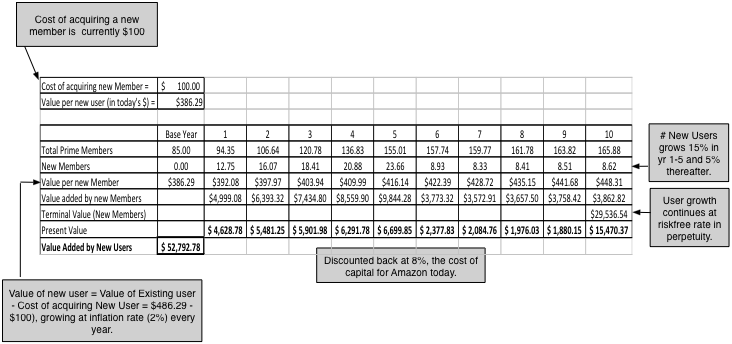 Download spreadsheetAgain, with our estimates, the value of new Prime Members is approximately $53.9 billion and that number, in addition to being sensitive to our estimates of growth in members, magnifies the effects of incremental revenue and shipping cost growth that affected the value of an existing member. Thus, setting shipping costs to grow at the same rate as incremental revenues makes the value of new members a negative number, suggesting that growth will become value destructive if shipping costs are not brought under control.
The Corporate DragWhile it is tempting to stop and add the value of existing members and new members to arrive at the value of Amazon Prime, you would be missing a significant cost that we will term the corporate drag. To feed its ambitions with Prime, Amazon is spending far more on media content (books, movies, TV shows) than it would otherwise have and those costs will continue to grow with Prime. Earlier, we assume that 10% of the company’s current technology/media costs are attributable to Prime, yielding a base year cost of $1,609 million. We will assume that these costs will grow with the number of Prime members, yielding the following value for future costs:
 Download spreadsheetIn effect, we will lower the value of Amazon Prime by $32.8 billion to reflect these additional costs. Note that though I treat this cost as a drag, it is not wasted, since it is the additional media that is being offered as a sweetener for existing Prime members to stay on and new ones to join.
The Value of Amazon PrimeNow that we have valued Amazon Prime’s existing members, its new members and the corporate drag, it is a matter of bringing them all together into a consolidated value. In our judgment, Amazon Prime is worth $62.2 billion to Amazon: table.tableizer-table { font-size: 12px; border: 1px solid #CCC; font-family: Arial, Helvetica, sans-serif; } .tableizer-table td { padding: 4px; margin: 3px; border: 1px solid #CCC; } .tableizer-table th { background-color: #104E8B; color: #FFF; font-weight: bold; }
CategoryValue/Cost todayDetailsValue of Existing Members$41,334.69Value of 85 million members @$486/eachValue of New Members$52,792.78Value of new members added- PV of Corporate Expenses$32,845.63 Value of additional media/tecnology costsValue of Prime Membership$61,281.83Overall value of Amazon PrimeI know that I have made a multitude of assumptions along the way to get to this value and that you may disagree with many of them. As always, you can download my spreadsheet and make the changes that you think need to be made. If you work at Amazon or view yourself as an expert on Amazon (I am not), your numbers should be much better than mine, and I would hope that your valuation will reflect the better information. While I have made a few optimistic assumptions to get to the value of Amazon Prime, I believe that there is an additional value that I have not counted in. Amazon is building a base of loyal, intense members that it can draw on to promote whatever its next product or service is, whether it be in retailing, technology, entertainment or cloud computing. That value is what you could call a real option, though those words are used far too frequently in places where they should not be, and that real option may be Amazon’s ultimate wild card.
ConclusionI have long described Amazon as a Field of Dreams company, one that goes for higher revenues first and then thinks about ways of converting those revenues into profits; if you build it, they will come. In coining this description, I am not being derisive but arguing that the market's willingness to be patient with the company is largely a the result of the consistency with Jeff Bezos has told the same story for the company, since 1997, and acted in accordance with it. Amazon Prime symbolizes how Amazon plays the long game, an investment that has taken a decade to bear fruit, but one that will be the foundation on which Amazon launches into new businesses. I know that there are many companies that model themselves after Amazon, but unless these "Amazon Wannabes" can match its narrative consistency and long time horizon, it will remain a one of a kind.
YouTube Video
Attachments
Amazon Prime ValuationAmazon 10K (2016)Previous (related) blog postsUser/Subscriber Economics: The Value of an Uber User (June 2017)User/Subscriber Economics: Value Dynamics (July 2017)
Loss Leader or Value Creator? Deconstructing Amazon Prime
I am an Amazon Prime member and have been one for a long time, and I am completely hooked. Not only do I (and my family) use Amazon Prime for items ranging from tissue paper to big screen televisions, but it has become my go-to for every possession that I need in my working and personal life. In fact, I know (and am completely at peace with the fact) that it has subtly affected my buying, as I substitute slightly more expensive Prime items for non-Prime equivalents, even when I shop on Amazon. It is not just the absence of shipping costs that draws me to Prime, but the reliability of delivery and the ease of return. In short, it makes shopping painless. As I tally how much we save each year because of Prime and weigh it against the $99 that we pay for it, I am convinced that we are getting far more value from it than what we pay, and that leads to an interesting follow up. If many of the 85 million other Prime members in October 2017 are getting the same bargain that we are, is this not an indication that Amazon has not just under priced Prime, but is perhaps selling it below cost? As someone who has wrestled with valuing Amazon over the last 20 years, I have learned never to under estimate the company. In this post, I would like to take the process I used to value a user at Uber and apply it to value not just a Prime member to Amazon but the collective value of Amazon Prime to the company.
The Growth of Amazon Prime
Amazon introduced Prime in 2005 and the service was slow to take off. At the end of 2011, only about 4% of Amazon customers were Prime members. In the years since, though, the service has seen explosive growth:
In fact, the jump in members in the last three years is particularly impressive, given how much bigger the base has become. In 2016, the company added almost 20 million new members and is on pace to add a similar number this year. In October 2017, the company’s mammoth Prime user base meant that almost 60% of all US households had memberships, suggesting that a non-Prime member is more the exception than the rule for Amazon’s US operations. Growth has been slower outside the US, slowed both by competitive/regulatory pressures and logistical challenges.The Economics of Amazon PrimeTo understand how Amazon Prime works, let’s break down the mechanics. Any one (in the countries where Prime is offered) can become a Prime member, either on a monthly or an annual basis. In the US, in 2017, the annual fee for membership was $99, as it has been for the last few years, and the monthly fee was $10.99. With 85 million members, that translates into a total revenue for the company of over $8.5 billion; the monthly members pay more but there is a portion of the membership (including students) who get discounted memberships. The other benefit for Amazon, though, comes from the fact that Amazon Prime members spend more on Amazon than non-Prime members. While the exact numbers are known only to Amazon, the most recently leaked reports suggest that the typical Prime member spends approximately $1,300/year on Amazon products, as opposed to the $700 spent by a non-Prime member. While it seems obvious, then, that Prime membership leads to more spending ($600, if you believe these two numbers), the statisticians will raise red flags about sampling bias since the true incremental revenue is unobservable; it is the difference between what the existing Prime members are spending ($1300/year) and what those same members would have spent, if they did not have Prime memberships. That is a reasonable point, but there is clearly a Prime impact, where Prime members choose Prime items over less expensive non-Prime offerings on Amazon, just as I do.
The biggest cost, by far, to Amazon is the shipping cost that the company now bears on Prime items. In 2016, the company reported net shipping subsidy costs of $7.2 billion (in the footnotes to the 10K) and assuming that almost all of these costs were related to servicing the 60 million members that Amazon had in 2016 leads to a per-member shipping cost of close to $120/ member. The other free services that Amazon offers its Prime members also create costs, though those costs are embedded in larger company-wide items and are more difficult to separate out. The company expends administrative costs in providing additional customer service to its Prime members. These costs are part of the total G&A cost of $2,432 million that the company reported in 2016, but we will assume that the servicing cost per member was $10 (or $600 million in the aggregate in 2016).The company also buys some content for its media and Kindle reading sections specifically to back up its Prime membership. Again, that cost is part of the $16,085 million that the company as its technology and content cost in 2016 and we will assume that 10% of those costs (approximately $1.6 billion) can be attributed to Amazon Prime.There is one final component of cost that we would like to know, but have to guess at and that is the cost to Amazon of acquiring a new member. That promotional/marketing cost is part of the total marketing cost of $7,233 million that Amazon reported in 2016 and we will assume that this cost is $100/member; in 2016, this would have translated into a total cost of $2 billion to acquire 20 million new members, leaving the remaining $5.2 billion in marketing costs as conventional advertising/marketing cost. Pulling all these numbers, real and imagined, into a picture, here is what we get as the economics of an Amazon Prime member.

The closing statistic that is worth emphasizing here is that once someone becomes an Amazon Prime member, they tend to stay as members with an annual renewal rate of 96%.
The Value of an Existing Prime Member
Using the numbers from the previous section as a starting point, we are on our way to valuing an existing Prime member. To get to that value, we have to make some estimates for the future that reflect how the base numbers will evolve over time:Renewal Rate: We will assume that annual renewal rates will stay high, at 96%, since the subscription model and the dependence on free shipping makes dropping the service difficult to do. Incremental Revenue/ Member Growth: As Amazon looks for new products and services to sell its Prime members, we will assume that the company’s legendary marketing skills will work and that the incremental revenue (which we estimated to be $600 and attributed entirely to Prime membership) will grow 10% a year for the next five years. That growth rate will scale down to the inflation rate (1.50%) in year 10, but that cumulated effect will result in incremental sales of $1,275/member in 2027. Shipping Costs: The biggest cost to Amazon is shipping and much of what the company seems to be doing both in terms of new investments (in distribution centers, trucks and drop off locations) and acquisitions (Whole Foods) seems to be designed to keep these costs in check. We will assume that shipping costs will grow 3% a year for the next five years (well below the incremental revenue growth), before settling into growing at the inflation rate thereafter. Customer Service Costs: The cost of Prime member customer service will increase 5% a year for the next 5 years and the inflation rate thereafter.Risk and Cost of Capital: I will assume that Amazon’s overall cost of capital applies as the right risk adjusted rate to use on all of its member valuations, since they partake in its entire product line. That cost of capital, in October 2017, given a US treasury bond rate of 2.35% was 8.00%.With those assumptions in place, we can estimate the value of a Prime member:
 Download spreadsheetWith our estimates, the value per prime member is approximately $491 and the total value of 85 million prime members is $41.7 billion. While you may view this value as built on a mountain of guesstimates, and you would be right, the analysis does provide guidance on the drivers of Prime member value. The two biggest are:Growth in incremental revenues: Getting Amazon Prime members to buy more products and services is key to their value and it should be no surprise to see stories like this one. As revenue growth climbs from 10% to 15%, for instance, the value of an existing member becomes $744 and the value of member base increases almost 65%.Keeping shipping costs contained: The key to extracting value from Prime members is checking shipping costs. To illustrate, if shipping costs grow at the same rate as incremental revenues do, the value per member collapses to $71.50. Viewing Prime members through this prism makes it easier to explain the Whole Foods acquisition, by Amazon, for about $14 billion. Rather than think of it as Amazon’s entrée into a low-margin, intensely competitive grocery business, it would make more sense to view it as an acquisition of a distribution system (of 460 Whole Foods stores, in prime locations) that will reduce shipping costs in the future, while also providing a new menu of products/services that can be offered to Prime members. That is bad news for a whole host of other players in the market but that is a story for another day.
The Value of a New MemberTo get from the value of an existing member to that of a new member, you need to have a measure of how much Amazon is spending to acquire new members. As I noted earlier, the company is opaque on this issue, though I would hazard a guess that it is a much more onerous number outside the United States. If you work with my guess of $100/new member as the base year number, we need only one more estimate to get to the value of new members and that is the growth in the membership base. Given the success that the company has shown on this front in the last five years, we will assume a growth rate of 15% for the next five years (which will bring Prime membership to 155 million in 2022). Given that large base, we will scale growth down to 5% a year from years 6-10 and to 1.5% a year thereafter.
 Download spreadsheetAgain, with our estimates, the value of new Prime Members is approximately $53.9 billion and that number, in addition to being sensitive to our estimates of growth in members, magnifies the effects of incremental revenue and shipping cost growth that affected the value of an existing member. Thus, setting shipping costs to grow at the same rate as incremental revenues makes the value of new members a negative number, suggesting that growth will become value destructive if shipping costs are not brought under control.
The Corporate DragWhile it is tempting to stop and add the value of existing members and new members to arrive at the value of Amazon Prime, you would be missing a significant cost that we will term the corporate drag. To feed its ambitions with Prime, Amazon is spending far more on media content (books, movies, TV shows) than it would otherwise have and those costs will continue to grow with Prime. Earlier, we assume that 10% of the company’s current technology/media costs are attributable to Prime, yielding a base year cost of $1,609 million. We will assume that these costs will grow with the number of Prime members, yielding the following value for future costs:
Download spreadsheetIn effect, we will lower the value of Amazon Prime by $32.8 billion to reflect these additional costs. Note that though I treat this cost as a drag, it is not wasted, since it is the additional media that is being offered as a sweetener for existing Prime members to stay on and new ones to join.The Value of Amazon PrimeNow that we have valued Amazon Prime’s existing members, its new members and the corporate drag, it is a matter of bringing them all together into a consolidated value. In our judgment, Amazon Prime is worth $62.2 billion to Amazon: table.tableizer-table { font-size: 12px; border: 1px solid #CCC; font-family: Arial, Helvetica, sans-serif; } .tableizer-table td { padding: 4px; margin: 3px; border: 1px solid #CCC; } .tableizer-table th { background-color: #104E8B; color: #FFF; font-weight: bold; }
CategoryValue/Cost todayDetailsValue of Existing Members$41,711.80 Value of 85 million members @$491/eachValue of New Members$53,399.12 Value of new members added- PV of Corporate Expenses$32,845.63 Value of additional media/tecnology costsValue of Prime Membership$62,265.29 Overall value of Amazon PrimeI know that I have made a multitude of assumptions along the way to get to this value and that you may disagree with many of them. As always, you can download my spreadsheet and make the changes that you think need to be made. If you work at Amazon or view yourself as an expert on Amazon (I am not), your numbers should be much better than mine, and I would hope that your valuation will reflect the better information. While I have made a few optimistic assumptions to get to the value of Amazon Prime, I believe that there is an additional value that I have not counted in. Amazon is building a base of loyal, intense members that it can draw on to promote whatever its next product or service is, whether it be in retailing, technology, entertainment or cloud computing. That value is what you could call a real option, though those words are used far too frequently in places where they should not be, and that real option may be Amazon’s ultimate wild card.
ConclusionI have long described Amazon as a Field of Dreams company, one that goes for higher revenues first and then thinks about ways of converting those revenues into profits; if you build it, they will come. In coining this description, I am not being derisive but arguing that the market's willingness to be patient with the company is largely a the result of the consistency with Jeff Bezos has told the same story for the company, since 1997, and acted in accordance with it. Amazon Prime symbolizes how Amazon plays the long game, an investment that has taken a decade to bear fruit, but one that will be the foundation on which Amazon launches into new businesses. I know that there are many companies that model themselves after Amazon, but unless these "Amazon Wannabes" can match its narrative consistency and long time horizon, it will remain a one of a kind.
YouTube Video
Attachments
Amazon Prime ValuationAmazon 10K (2016)Previous (related) blog postsUser/Subscriber Economics: The Value of an Uber User (June 2017)User/Subscriber Economics: Value Dynamics (July 2017)
October 6, 2017
Tax Reform, 2017: Promise of Plenty or Poisoned Chalice?
Every decade or two, the political class in the United States wakes up to the reality that the US tax code, as written, is an abomination that encourages and rewards bad behavior, and works on a tax reform package. In each iteration (and I have had a front row seat with the 1986, 1993 and 2001 attempts), the reformers start with the claim that the changes they make will make the system “fairer” and “simpler”, with the added bonus of increasing economic growth. And with each one, the end result is that we end up with a system that is more complex and less fair. I am not a utopian and I understand that tax reform is a political exercise where different interests have to be balanced, but as we start to see the contours of the 2017 reform package, the big question becomes whether, on balance, it does more good than bad. As with prior tax debates, this one follows a predictable path, with support or opposition to the package, depending on who is initiating the reform. Since this version of tax reform comes from Republicans, Democrats are vehement that this reform will benefit the rich and devastate the middle class. The Republicans are just as assertive in their claims that this reform will help US companies compete better in the global economy, and increase economic growth. I would love to tell you that I am completely unbiased on this issue, but I cannot, because no one is objective when it comes to taxes. We all have our priors on taxes and look for data and evidence to back up those preconceptions. Nevertheless, my intent in this post is to start with a general assessment of how taxes affect value and to then look at both the current and proposed corporate tax models, with the objective of evaluating how the planned changes will affect value at companies.
Taxes and Value
To understand how the tax code affects the value of a business, let's go back to basics, and link the value of a business to three component parts: the cash flows generated from existing assets, the value of future growth and a risk adjustment, usually taking the form of a cost of capital or discount rate.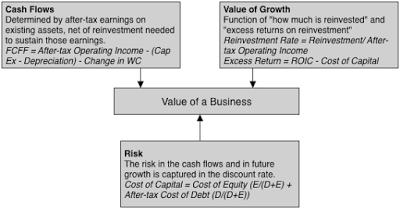
Where does the tax rate show up in value? Everywhere, since each of these drivers is affected by not just the tax rate, but also by other provisions in the tax code. Cash flows from existing investments: The cash flow from existing investments is estimated by starting with after-tax operating income and then subtracting out the reinvestment needed to sustain future growth. Since the cash flow is an after-tax cash flow, the effective tax rate paid by a firm will affect that cash flow, with higher effective tax rates resulting in lower after-tax cash flows. The statutory tax rate in the tax code is a driver, albeit not the only one, of the effective tax rate, but so are the provisions of the code that relate to the taxation of foreign income, as well as tax credits and special tax deductions that are directed at specific sectors. Cost of capital (or discount rate): The cost of capital is a weighted average of the cost of equity and after-tax cost of debt, with the weights reflecting how much of each is used to fund operations. The most direct effect of the tax code arises from its tilt being towards debt, in much of the world. In particular, the tax benefit of debt takes the form of tax deductible interest expenses and the benefits of borrowing will increase with the statutory tax rate (or the marginal tax rate). There are more subtle effects, as well, that come from how the tax code treats investment income in the hands of investors, since changing tax rates on dividends and capital gains can affect the price charged by investors for taking equity risk (i.e., the equity risk premium) and altering the tax rates on interest income earned by investors can affect the price charged by investors in the bond market (i.e., default spreads).Value of growth: The value of growth can be traced back to the amount that companies reinvest back into themselves (measured as a reinvestment rate) and the excess returns generated on those investments (captured as an excess return, or the difference between return on invested capital and the cost of capital). The tax code can affect both the reinvestment rate and excess returns, with provisions either encouraging or discouraging more investment and the after-tax earnings showing up in the return on capital and excess returns. It is on this dimension that the effects of changes in the tax code become most unpredictable, since they affect both returns and costs of capital. Lwering the statutory tax rate can increase after-tax cash flows and returns but also increase the cost of capital, by reducing the tax benefits from debt.The figure below captures the full picture of how taxes affect almost every input into value, and thus value.
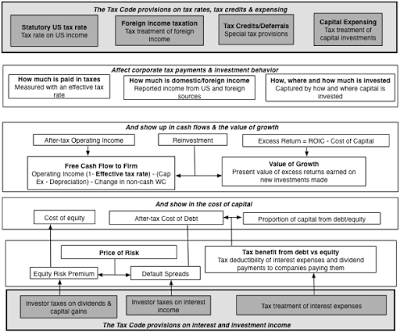
The Current Tax Code
It is no secret that I think that the current US tax code is a mess, creating perverse incentives to under invest in the US and over borrow, and from that perspective, I welcome change. To see how the current tax code plays out in the numbers, I have taken the picture where I have connected taxes to value and looked at the tax code, as it exists today.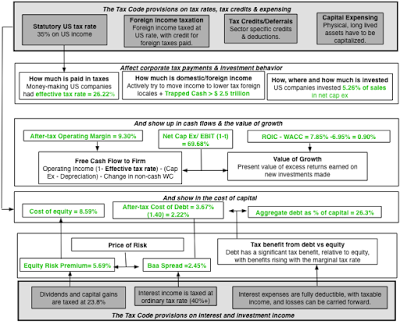
The US has one of the highest statutory tax rates for corporate income in the world, at 35% (and this is before state and local taxes, which push it up to 40%) and it combines this rate with a “global” tax model, where it aims to tax foreign income earned by US companies, at the US tax rate, after allowing a credit for foreign taxes paid. In theory, then, a US company that earns income in a foreign market with a 20% corporate tax rate would first pay those taxes and then pay an extra 15% (the difference between the US marginal rate of 35% and the foreign country's tax rate of 20%) to the US government. In practice, this seldom happens because the US also has a provision in the code that specifies that this extra tax is due only when foreign income is remitted back to the US. The result is no surprise. US multinationals have held off on remitting foreign income back to the US, resulting in “trapped cash” of $2.5 trillion or more, “trapped” because this cash cannot be invested back in the US or used to pay dividends or buy back stock. This behavior also, in large part, explains why the aggregate effective tax rate paid by US companies in 2016 amount was just above 26%, well below the statutory tax rate. At the same time, the high statutory tax rate encourages US companies to borrow and often in the US, where the tax benefits from debt are the highest (because of the high marginal tax rate). At the start of 2017, non-financial service US companies funded themselves with a debt ratio of 26.3%, partly because the after-tax cost of debt (at 2.22% for the typical US company) was so much lower than the average cost of equity of 8.59%. Finally, the US taxes dividends and capital gains income at a maximum rate of 23.8%, at the investor level, lower than the federal tax rate of 40% (at the highest bracket) that these investors pay on their other income (including earned and interest income).
The Proposed Tax Code
There is many a slip between the cup and the lip and I am sure that there will not only be many changes that will be made between now and the eventual legislation, but also a chance that there may be no change at all. At least, as described by its proponents last week, there are four significant changes being planned to the tax code:
Statutory Tax Rate: If this reform passes in the current form, the statutory tax rate for corporate income generated in the United States will become 20%, almost halving the existing statutory tax rate of 35%.Foreign Income: In almost as significant a shift, the US will shift to a territorial tax model, used by most other countries in the world, resulting in foreign income being taxed at the foreign tax rate, with no additional assessments for US taxes. Thus, if a corporation generates income in a country with a 15% tax rate, it will pay the 15% in taxes but no more. Twinned with this change, and perhaps with the intent of generating some revenues, there will be a one-time tax that will be assessed on trapped foreign income (rumored to be about 10%), and after the tax is paid, the cash will be effectively untrapped, to be used for new investments, dividends and stock buybacks.Expensing & Capitalizing: In an upending of accounting tradition, the tax code will allowing for the expensing of capital investments, at least for tax purposes, for a period of five years. Thus, rather than amortize/depreciate these expenses, which spreads the tax benefits over time, companies will get the tax deduction up front, which increases value.Interest Expense Deduction: While there were rumors initially that the entire interest tax deduction would be done away with, it looks more likely that there will be limits put on how much interest expense will be deducted for tax purposes, and only for some types of corporations. In the table below, I take each of these changes and look at the potential impact on after-tax cash flows, the value of growth and the cost of capital: table.tableizer-table { font-size: 12px; border: 1px solid #CCC; font-family: Arial, Helvetica, sans-serif; } .tableizer-table td { padding: 4px; margin: 3px; border: 1px solid #CCC; } .tableizer-table th { background-color: #104E8B; color: #FFF; font-weight: bold; }
After-tax Cash FlowsCost of CapitalValue of Growth1. Lower Statutory tax rate on US incomeLower effective tax rate, leading to higher after-tax cash flows and returns on capital. Bigger effect on firms that derive most or all of their income in US.Lower tax benefits from debt, raising after-tax cost of debt & capital, and more so for firms with a lot of debt.Depends on how much return on capital changes, relative to cost of capital. Firms with little debt & high effective tax rates will see biggest benefit and firms with high debt & low effective tax rates will be hurt.2. Taxes on Foreign incomeLower effective tax rate & higher after-tax cash flows. Bigger effect on firms that derived & repatriated substantial foreign income.May induce more borrowing outside US in higher tax countries.One-time release of trapped cash could increase reinvestment, but value will depend upon whether investments generate excess returns.3. Expensing & CapitalizingReduce cost of investing, by moving tax benefits up front rather than spread over time.None.Will increase value of growth at firms with substantial physical assets. Low or no effect at companies with intangible assets.4. Interest Tax Deduction LimitsNone.Will increase cost of capital at companies that test the limits. (Too much debt or debt in the wrong places)Will decrease value of growth and more so at firms that violate interest deduction limits.
Overall, if this tax reform is put into the code, you can expect to see after-tax cash flows and returns on capital rise, costs of capital also go up and the effects on the value of growth will vary across companies.
Winners and Losers
Looking at the list of effects, it is clear that not all companies will win with the new tax code but that should come as no surprise and is good news for taxpayers in general. Looking at the big picture, the biggest winners will be companies that have the following features:
Pay high effective tax rates, either because they derive most or all of their income in the US or because they repatriate foreign incomeHave low or no debt in their capital structure, thus immunizing themselves from the loss of tax benefits of debt. Earn healthy returns on capital, which will allow them to reinvest their higher earnings back to generate value.Have more physical assets than intangible assets, enabling them to get a bigger boost from the immediate expensing of capital expenditures.To screen for these firms, I used a simple test. Taking all 7000+ publicly traded companies, listed in the US in October 2017, I looked for companies that met the following screens:Effective tax rate > 30%, the 75th percentile for US companiesTotal Debt/EBITDA = 0, i.e., the company has no debtReturn on capital > 20%, the 75th percentile for US companiesCapital expenditures/sales > 2%, the median for US companiesA list of companies that passed all four screens is available at the bottom of this post. Note that these are crude screens, based upon the most recent twelve months of data, and that you could refine them by looking at the averages across time or using other proxies.
The biggest losers will be companies that pay low effective tax rates currently, have substantial debt in their capital structure and low returns on capital. Though some of these firms may gain from the one-time release of trapped cash in overseas locales, that cash will most likely be returned to shareholders in the form of dividends and buybacks and there will be little benefit from new investments, and will be small if the cash balance is small. To find these companies, I looked for the following:Had effective tax rate < 10%, the 25th percentile for US companies, while also reporting positive taxable incomeHad Total Debt/EBITDA >4, the 75th percentile for US companiesHad return on capital < 5%, the 25th percentile of returns on capital for money-making companiesI also eliminate real estate investment trusts and master limited partnerships, which pay no corporate taxes currently, but pass through income to their shareholders, since they will be unaffected by the change in corporate tax rates and may even benefit from having a lower tax rate on pass through income. The list of screened companies is at the bottom of the post but here again, there are refinements that you could add to come up with a better listing of companies.
As for the overall market, if this tax reform comes into effect, the aggregate effective tax rate will decrease, pushing up after-tax earnings, cash flows and returns on capital. The cost of capital will increase, as the cost of debt goes up, but that increase should be small and become smaller as companies adjust to the new tax code, reducing debt. There are two unknowns that will determine the effect on aggregate equity value. The first is the impact that the reform will have on real economic growth in the US since higher real growth will allow firms to generate higher earnings, cash flows and value. The second is how it will affect interest rates, both through the effects on real growth as well as on budget deficts in the future. I am no market timer but while I see this tax package as a net positive for markets, I don’t see it, standing alone, as an impetus for a new bull market. That has to come from other fundamentals changing.
Taking Stock: The Good and the Bad
I think that US tax code is vastly over due for change and I think that there are components of this tax reform package that move us in the right direction. By lowering the US statutory tax rate on corporate income towards that of most other industrialized countries and shifting from a global to a territorial tax system, the reform package moves the US towards a healthier system, where companies will spend less time on transfer pricing and managing trapped cash, and more on core businesses. I also think that the changes that are designed to reduce the tax tilt towards debt are sensible and will hopefully shift the focus of corporate restructuring from recapitalization (where the bulk of the value comes from increasing debt) to real operating changes. There are changes in this tax reform, though, that will create costs and unintended consequences.
1. Tax Books versus Reporting Books: I understand the motives behind the immediate expensing of capital expenditures, but it will make the gap between reporting books and tax books into a chasm. Companies will eagerly expense their capital investments, in their tax books, report low income and pay low taxes, but will keep to GAAP rules in their reporting books, with the only clue to the divergence being very low effective tax rates. 2. Divergent Tax Rates: I remember a time when individual investors were taxed at rates as high as 70%, capital gains were taxed at 28% and corporations were taxed at 40%, and the tax game playing that those divergent tax rates created. In fact, the 1986 tax reform act was specifically focused on eliminating these differences, trying to bring the tax rate to 28% for all income. This tax reform act moves us in the opposite direction, creating divergent tax rates (federal) again: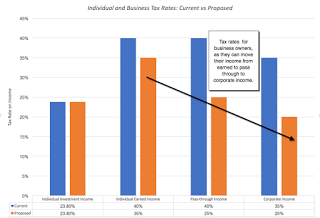
While most wage earners have no choice but to pay the individual earned income tax rate, a business owner will now pay very different taxes, depending on whether he or she files as an individual, a partner in a business or as a corporation. I know that the reform act plans to counteract this by requiring owners of pass through entities to pay themselves salaries (which will be taxed as individual earned income), but I, for one, don’t feel comfortable, asking the revenue authorities to make judgments on what comprises “reasonable” salaries.
My Tax Reform Package
I am not a tax expert, but if I were given a chance, there are a few changes that I would make to this package. First, I would eliminate the provision on the expensing of capital equipment, since the benefits in terms of additional corporate investment will be small, relative to the costs of the complexity that it will add to financial statements. Second, I would try to push for convergence in tax rates on all types of income (investment, earned, pass through and corporate income), since that will reduce the incentives to play tax games and I would .make the targeted tax rate about 25% (to keep it close to corporate tax rates elsewhere in the world). Third, I would remove the tax credits and deductions that have been added over time to the tax code; they skew business decisions and almost never accomplish the objectives that they were designed to accomplish. Fourth, I would start a weaning away from debt, by putting limits on interest tax deductions that would become more stringent over time. To those who would accuse me of being politically naive, since this package would never pass, I plead guilty. To those who would argue that I am giving too much away to the rich (who will see their marginal tax rates cut from 39.6% to 25%), my answer is that no matter how egalitarian you make your tax code, the very rich will find a way to pay little in taxes and all you will do is enrich tax lawyers and tax havens, on that path.
YouTube Video
The Tax Reform Proposal
The 2017 Tax Reform Proposal (in outline)Data Links
Effective Tax Rates by Industry (for US companies)Blog Posts on TaxesThe Insanity of the US tax code (August 2014)The Tax Dance: To Pass or Not Pass Through Income (September 2014)The Tax Story in 2015: Myths, Misconceptions and Reality Checks (January 2015)Value and Taxes: Breaking down the Pfizer-Allergan Deal (November 2015)Tax Winners (High effective tax rate + No debt + High Return on capital + High cap ex/sales) table.tableizer-table { font-size: 12px; border: 1px solid #CCC; font-family: Arial, Helvetica, sans-serif; } .tableizer-table td { padding: 4px; margin: 3px; border: 1px solid #CCC; } .tableizer-table th { background-color: #104E8B; color: #FFF; font-weight: bold; }
Company NameExchange:TickerEffective Tax RateTotal Debt/EBITDAReturn on CapitalCap Ex/SalesUlta Beauty, Inc. (NasdaqGS:ULTA)NasdaqGS:ULTA35.88%0.00132.46%7.85%Anika Therapeutics, Inc. (NasdaqGS:ANIK)NasdaqGS:ANIK35.31%0.0014.36%7.24%AAON, Inc. (NasdaqGS:AAON)NasdaqGS:AAON31.87%0.0023.57%7.19%R1 RCM Inc. (NasdaqCM:RCM)NasdaqCM:RCM49.65%0.0063.13%6.87%Sanderson Farms, Inc. (NasdaqGS:SAFM)NasdaqGS:SAFM34.40%0.0020.84%6.39%CorVel Corporation (NasdaqGS:CRVL)NasdaqGS:CRVL37.90%0.0033.19%5.89%Sturm, Ruger & Company, Inc. (NYSE:RGR)NYSE:RGR35.14%0.0032.01%5.59%Texas Pacific Land Trust (NYSE:TPL)NYSE:TPL32.37%0.00106.64%5.29%Insteel Industries, Inc. (NasdaqGS:IIIN)NasdaqGS:IIIN33.64%0.0014.02%5.26%Capella Education Company (NasdaqGS:CPLA)NasdaqGS:CPLA35.72%0.0021.90%5.24%The Boston Beer Company, Inc. (NYSE:SAM)NYSE:SAM33.96%0.0021.91%4.61%Exponent, Inc. (NasdaqGS:EXPO)NasdaqGS:EXPO30.07%0.0017.05%4.33%Monster Beverage Corporation (NasdaqGS:MNST)NasdaqGS:MNST33.37%0.0021.83%3.84%Zix Corporation (NasdaqGS:ZIXI)NasdaqGS:ZIXI42.00%0.0013.09%3.42%Trex Company, Inc. (NYSE:TREX)NYSE:TREX33.73%0.0053.07%3.27%PetMed Express, Inc. (NasdaqGS:PETS)NasdaqGS:PETS37.20%0.0026.32%3.14%Omega Flex, Inc. (NasdaqGM:OFLX)NasdaqGM:OFLX32.04%0.0031.57%3.03%Jewett-Cameron Trading Company Ltd. (NasdaqCM:JCTC.F)NasdaqCM:JCTC.F40.00%0.0013.08%2.58%Dorman Products, Inc. (NasdaqGS:DORM)NasdaqGS:DORM36.84%0.0018.37%2.45%F5 Networks, Inc. (NasdaqGS:FFIV)NasdaqGS:FFIV32.60%0.0035.44%2.35%Lancaster Colony Corporation (NasdaqGS:LANC)NasdaqGS:LANC34.30%0.0022.97%2.25%Nutrisystem, Inc. (NasdaqGS:NTRI)NasdaqGS:NTRI31.21%0.0045.46%2.17%Collectors Universe Inc. (NasdaqGM:CLCT)NasdaqGM:CLCT35.76%0.00110.70%2.01%
Tax Losers (Low Effective Tax Rate + High Debt + Low Return on Capital)
table.tableizer-table { font-size: 12px; border: 1px solid #CCC; font-family: Arial, Helvetica, sans-serif; } .tableizer-table td { padding: 4px; margin: 3px; border: 1px solid #CCC; } .tableizer-table th { background-color: #104E8B; color: #FFF; font-weight: bold; }
Company NameExchange:TickerIndustry GroupEffective Tax RateTotal Debt/EBITDAReturn on CapitalLions Gate Entertainment Corp. (NYSE:LGF.A)NYSE:LGF.AConsumer Discretionary (Primary)0.00%9.003.38%AV Homes, Inc. (NasdaqGS:AVHI)NasdaqGS:AVHIConsumer Discretionary (Primary)8.63%11.604.36%Smart & Final Stores, Inc. (NYSE:SFS)NYSE:SFSConsumer Staples (Primary)0.00%4.883.19%Orchids Paper Products Company (AMEX:TIS)AMEX:TISConsumer Staples (Primary)0.00%9.781.06%Cheniere Energy, Inc. (AMEX:LNG)AMEX:LNGEnergy (Primary)1.35%22.303.23%U.S. Silica Holdings, Inc. (NYSE:SLCA)NYSE:SLCAEnergy (Primary)0.00%4.132.10%Envision Healthcare Corporation (NYSE:EVHC)NYSE:EVHCHealthcare (Primary)0.00%6.444.87%CIRCOR International, Inc. (NYSE:CIR)NYSE:CIRIndustrials (Primary)0.00%4.464.15%Pangaea Logistics Solutions Ltd. (NasdaqCM:PANL)NasdaqCM:PANLIndustrials (Primary)0.00%5.504.52%DXC Technology Company (NYSE:DXC)NYSE:DXCInformation Technology (Primary)0.00%6.122.71%GoDaddy Inc. (NYSE:GDDY)NYSE:GDDYInformation Technology (Primary)0.00%13.101.83%Park Electrochemical Corp. (NYSE:PKE)NYSE:PKEInformation Technology (Primary)0.00%5.623.21%Brocade Communications Systems, Inc. (NasdaqGS:BRCD)NasdaqGS:BRCDInformation Technology (Primary)0.00%4.334.74%Hickok Incorporated (OTCPK:HICK.A)OTCPK:HICK.AInformation Technology (Primary)0.00%12.102.88%Olin Corporation (NYSE:OLN)NYSE:OLNMaterials (Primary)0.00%4.304.32%Venator Materials PLC (NYSE:VNTR)NYSE:VNTRMaterials (Primary)0.00%4.242.22%Xenia Hotels & Resorts, Inc. (NYSE:XHR)NYSE:XHRReal Estate (Primary); Real Estate (Primary)2.19%4.054.15%Connecticut Water Service, Inc. (NasdaqGS:CTWS)NasdaqGS:CTWSUtilities (Primary)3.29%5.734.59%
Taxes and Value
To understand how the tax code affects the value of a business, let's go back to basics, and link the value of a business to three component parts: the cash flows generated from existing assets, the value of future growth and a risk adjustment, usually taking the form of a cost of capital or discount rate.

Where does the tax rate show up in value? Everywhere, since each of these drivers is affected by not just the tax rate, but also by other provisions in the tax code. Cash flows from existing investments: The cash flow from existing investments is estimated by starting with after-tax operating income and then subtracting out the reinvestment needed to sustain future growth. Since the cash flow is an after-tax cash flow, the effective tax rate paid by a firm will affect that cash flow, with higher effective tax rates resulting in lower after-tax cash flows. The statutory tax rate in the tax code is a driver, albeit not the only one, of the effective tax rate, but so are the provisions of the code that relate to the taxation of foreign income, as well as tax credits and special tax deductions that are directed at specific sectors. Cost of capital (or discount rate): The cost of capital is a weighted average of the cost of equity and after-tax cost of debt, with the weights reflecting how much of each is used to fund operations. The most direct effect of the tax code arises from its tilt being towards debt, in much of the world. In particular, the tax benefit of debt takes the form of tax deductible interest expenses and the benefits of borrowing will increase with the statutory tax rate (or the marginal tax rate). There are more subtle effects, as well, that come from how the tax code treats investment income in the hands of investors, since changing tax rates on dividends and capital gains can affect the price charged by investors for taking equity risk (i.e., the equity risk premium) and altering the tax rates on interest income earned by investors can affect the price charged by investors in the bond market (i.e., default spreads).Value of growth: The value of growth can be traced back to the amount that companies reinvest back into themselves (measured as a reinvestment rate) and the excess returns generated on those investments (captured as an excess return, or the difference between return on invested capital and the cost of capital). The tax code can affect both the reinvestment rate and excess returns, with provisions either encouraging or discouraging more investment and the after-tax earnings showing up in the return on capital and excess returns. It is on this dimension that the effects of changes in the tax code become most unpredictable, since they affect both returns and costs of capital. Lwering the statutory tax rate can increase after-tax cash flows and returns but also increase the cost of capital, by reducing the tax benefits from debt.The figure below captures the full picture of how taxes affect almost every input into value, and thus value.

The Current Tax Code
It is no secret that I think that the current US tax code is a mess, creating perverse incentives to under invest in the US and over borrow, and from that perspective, I welcome change. To see how the current tax code plays out in the numbers, I have taken the picture where I have connected taxes to value and looked at the tax code, as it exists today.

The US has one of the highest statutory tax rates for corporate income in the world, at 35% (and this is before state and local taxes, which push it up to 40%) and it combines this rate with a “global” tax model, where it aims to tax foreign income earned by US companies, at the US tax rate, after allowing a credit for foreign taxes paid. In theory, then, a US company that earns income in a foreign market with a 20% corporate tax rate would first pay those taxes and then pay an extra 15% (the difference between the US marginal rate of 35% and the foreign country's tax rate of 20%) to the US government. In practice, this seldom happens because the US also has a provision in the code that specifies that this extra tax is due only when foreign income is remitted back to the US. The result is no surprise. US multinationals have held off on remitting foreign income back to the US, resulting in “trapped cash” of $2.5 trillion or more, “trapped” because this cash cannot be invested back in the US or used to pay dividends or buy back stock. This behavior also, in large part, explains why the aggregate effective tax rate paid by US companies in 2016 amount was just above 26%, well below the statutory tax rate. At the same time, the high statutory tax rate encourages US companies to borrow and often in the US, where the tax benefits from debt are the highest (because of the high marginal tax rate). At the start of 2017, non-financial service US companies funded themselves with a debt ratio of 26.3%, partly because the after-tax cost of debt (at 2.22% for the typical US company) was so much lower than the average cost of equity of 8.59%. Finally, the US taxes dividends and capital gains income at a maximum rate of 23.8%, at the investor level, lower than the federal tax rate of 40% (at the highest bracket) that these investors pay on their other income (including earned and interest income).
The Proposed Tax Code
There is many a slip between the cup and the lip and I am sure that there will not only be many changes that will be made between now and the eventual legislation, but also a chance that there may be no change at all. At least, as described by its proponents last week, there are four significant changes being planned to the tax code:
Statutory Tax Rate: If this reform passes in the current form, the statutory tax rate for corporate income generated in the United States will become 20%, almost halving the existing statutory tax rate of 35%.Foreign Income: In almost as significant a shift, the US will shift to a territorial tax model, used by most other countries in the world, resulting in foreign income being taxed at the foreign tax rate, with no additional assessments for US taxes. Thus, if a corporation generates income in a country with a 15% tax rate, it will pay the 15% in taxes but no more. Twinned with this change, and perhaps with the intent of generating some revenues, there will be a one-time tax that will be assessed on trapped foreign income (rumored to be about 10%), and after the tax is paid, the cash will be effectively untrapped, to be used for new investments, dividends and stock buybacks.Expensing & Capitalizing: In an upending of accounting tradition, the tax code will allowing for the expensing of capital investments, at least for tax purposes, for a period of five years. Thus, rather than amortize/depreciate these expenses, which spreads the tax benefits over time, companies will get the tax deduction up front, which increases value.Interest Expense Deduction: While there were rumors initially that the entire interest tax deduction would be done away with, it looks more likely that there will be limits put on how much interest expense will be deducted for tax purposes, and only for some types of corporations. In the table below, I take each of these changes and look at the potential impact on after-tax cash flows, the value of growth and the cost of capital: table.tableizer-table { font-size: 12px; border: 1px solid #CCC; font-family: Arial, Helvetica, sans-serif; } .tableizer-table td { padding: 4px; margin: 3px; border: 1px solid #CCC; } .tableizer-table th { background-color: #104E8B; color: #FFF; font-weight: bold; }
After-tax Cash FlowsCost of CapitalValue of Growth1. Lower Statutory tax rate on US incomeLower effective tax rate, leading to higher after-tax cash flows and returns on capital. Bigger effect on firms that derive most or all of their income in US.Lower tax benefits from debt, raising after-tax cost of debt & capital, and more so for firms with a lot of debt.Depends on how much return on capital changes, relative to cost of capital. Firms with little debt & high effective tax rates will see biggest benefit and firms with high debt & low effective tax rates will be hurt.2. Taxes on Foreign incomeLower effective tax rate & higher after-tax cash flows. Bigger effect on firms that derived & repatriated substantial foreign income.May induce more borrowing outside US in higher tax countries.One-time release of trapped cash could increase reinvestment, but value will depend upon whether investments generate excess returns.3. Expensing & CapitalizingReduce cost of investing, by moving tax benefits up front rather than spread over time.None.Will increase value of growth at firms with substantial physical assets. Low or no effect at companies with intangible assets.4. Interest Tax Deduction LimitsNone.Will increase cost of capital at companies that test the limits. (Too much debt or debt in the wrong places)Will decrease value of growth and more so at firms that violate interest deduction limits.
Overall, if this tax reform is put into the code, you can expect to see after-tax cash flows and returns on capital rise, costs of capital also go up and the effects on the value of growth will vary across companies.
Winners and Losers
Looking at the list of effects, it is clear that not all companies will win with the new tax code but that should come as no surprise and is good news for taxpayers in general. Looking at the big picture, the biggest winners will be companies that have the following features:
Pay high effective tax rates, either because they derive most or all of their income in the US or because they repatriate foreign incomeHave low or no debt in their capital structure, thus immunizing themselves from the loss of tax benefits of debt. Earn healthy returns on capital, which will allow them to reinvest their higher earnings back to generate value.Have more physical assets than intangible assets, enabling them to get a bigger boost from the immediate expensing of capital expenditures.To screen for these firms, I used a simple test. Taking all 7000+ publicly traded companies, listed in the US in October 2017, I looked for companies that met the following screens:Effective tax rate > 30%, the 75th percentile for US companiesTotal Debt/EBITDA = 0, i.e., the company has no debtReturn on capital > 20%, the 75th percentile for US companiesCapital expenditures/sales > 2%, the median for US companiesA list of companies that passed all four screens is available at the bottom of this post. Note that these are crude screens, based upon the most recent twelve months of data, and that you could refine them by looking at the averages across time or using other proxies.
The biggest losers will be companies that pay low effective tax rates currently, have substantial debt in their capital structure and low returns on capital. Though some of these firms may gain from the one-time release of trapped cash in overseas locales, that cash will most likely be returned to shareholders in the form of dividends and buybacks and there will be little benefit from new investments, and will be small if the cash balance is small. To find these companies, I looked for the following:Had effective tax rate < 10%, the 25th percentile for US companies, while also reporting positive taxable incomeHad Total Debt/EBITDA >4, the 75th percentile for US companiesHad return on capital < 5%, the 25th percentile of returns on capital for money-making companiesI also eliminate real estate investment trusts and master limited partnerships, which pay no corporate taxes currently, but pass through income to their shareholders, since they will be unaffected by the change in corporate tax rates and may even benefit from having a lower tax rate on pass through income. The list of screened companies is at the bottom of the post but here again, there are refinements that you could add to come up with a better listing of companies.
As for the overall market, if this tax reform comes into effect, the aggregate effective tax rate will decrease, pushing up after-tax earnings, cash flows and returns on capital. The cost of capital will increase, as the cost of debt goes up, but that increase should be small and become smaller as companies adjust to the new tax code, reducing debt. There are two unknowns that will determine the effect on aggregate equity value. The first is the impact that the reform will have on real economic growth in the US since higher real growth will allow firms to generate higher earnings, cash flows and value. The second is how it will affect interest rates, both through the effects on real growth as well as on budget deficts in the future. I am no market timer but while I see this tax package as a net positive for markets, I don’t see it, standing alone, as an impetus for a new bull market. That has to come from other fundamentals changing.
Taking Stock: The Good and the Bad
I think that US tax code is vastly over due for change and I think that there are components of this tax reform package that move us in the right direction. By lowering the US statutory tax rate on corporate income towards that of most other industrialized countries and shifting from a global to a territorial tax system, the reform package moves the US towards a healthier system, where companies will spend less time on transfer pricing and managing trapped cash, and more on core businesses. I also think that the changes that are designed to reduce the tax tilt towards debt are sensible and will hopefully shift the focus of corporate restructuring from recapitalization (where the bulk of the value comes from increasing debt) to real operating changes. There are changes in this tax reform, though, that will create costs and unintended consequences.
1. Tax Books versus Reporting Books: I understand the motives behind the immediate expensing of capital expenditures, but it will make the gap between reporting books and tax books into a chasm. Companies will eagerly expense their capital investments, in their tax books, report low income and pay low taxes, but will keep to GAAP rules in their reporting books, with the only clue to the divergence being very low effective tax rates. 2. Divergent Tax Rates: I remember a time when individual investors were taxed at rates as high as 70%, capital gains were taxed at 28% and corporations were taxed at 40%, and the tax game playing that those divergent tax rates created. In fact, the 1986 tax reform act was specifically focused on eliminating these differences, trying to bring the tax rate to 28% for all income. This tax reform act moves us in the opposite direction, creating divergent tax rates (federal) again:

While most wage earners have no choice but to pay the individual earned income tax rate, a business owner will now pay very different taxes, depending on whether he or she files as an individual, a partner in a business or as a corporation. I know that the reform act plans to counteract this by requiring owners of pass through entities to pay themselves salaries (which will be taxed as individual earned income), but I, for one, don’t feel comfortable, asking the revenue authorities to make judgments on what comprises “reasonable” salaries.
My Tax Reform Package
I am not a tax expert, but if I were given a chance, there are a few changes that I would make to this package. First, I would eliminate the provision on the expensing of capital equipment, since the benefits in terms of additional corporate investment will be small, relative to the costs of the complexity that it will add to financial statements. Second, I would try to push for convergence in tax rates on all types of income (investment, earned, pass through and corporate income), since that will reduce the incentives to play tax games and I would .make the targeted tax rate about 25% (to keep it close to corporate tax rates elsewhere in the world). Third, I would remove the tax credits and deductions that have been added over time to the tax code; they skew business decisions and almost never accomplish the objectives that they were designed to accomplish. Fourth, I would start a weaning away from debt, by putting limits on interest tax deductions that would become more stringent over time. To those who would accuse me of being politically naive, since this package would never pass, I plead guilty. To those who would argue that I am giving too much away to the rich (who will see their marginal tax rates cut from 39.6% to 25%), my answer is that no matter how egalitarian you make your tax code, the very rich will find a way to pay little in taxes and all you will do is enrich tax lawyers and tax havens, on that path.
YouTube Video
The Tax Reform Proposal
The 2017 Tax Reform Proposal (in outline)Data Links
Effective Tax Rates by Industry (for US companies)Blog Posts on TaxesThe Insanity of the US tax code (August 2014)The Tax Dance: To Pass or Not Pass Through Income (September 2014)The Tax Story in 2015: Myths, Misconceptions and Reality Checks (January 2015)Value and Taxes: Breaking down the Pfizer-Allergan Deal (November 2015)Tax Winners (High effective tax rate + No debt + High Return on capital + High cap ex/sales) table.tableizer-table { font-size: 12px; border: 1px solid #CCC; font-family: Arial, Helvetica, sans-serif; } .tableizer-table td { padding: 4px; margin: 3px; border: 1px solid #CCC; } .tableizer-table th { background-color: #104E8B; color: #FFF; font-weight: bold; }
Company NameExchange:TickerEffective Tax RateTotal Debt/EBITDAReturn on CapitalCap Ex/SalesUlta Beauty, Inc. (NasdaqGS:ULTA)NasdaqGS:ULTA35.88%0.00132.46%7.85%Anika Therapeutics, Inc. (NasdaqGS:ANIK)NasdaqGS:ANIK35.31%0.0014.36%7.24%AAON, Inc. (NasdaqGS:AAON)NasdaqGS:AAON31.87%0.0023.57%7.19%R1 RCM Inc. (NasdaqCM:RCM)NasdaqCM:RCM49.65%0.0063.13%6.87%Sanderson Farms, Inc. (NasdaqGS:SAFM)NasdaqGS:SAFM34.40%0.0020.84%6.39%CorVel Corporation (NasdaqGS:CRVL)NasdaqGS:CRVL37.90%0.0033.19%5.89%Sturm, Ruger & Company, Inc. (NYSE:RGR)NYSE:RGR35.14%0.0032.01%5.59%Texas Pacific Land Trust (NYSE:TPL)NYSE:TPL32.37%0.00106.64%5.29%Insteel Industries, Inc. (NasdaqGS:IIIN)NasdaqGS:IIIN33.64%0.0014.02%5.26%Capella Education Company (NasdaqGS:CPLA)NasdaqGS:CPLA35.72%0.0021.90%5.24%The Boston Beer Company, Inc. (NYSE:SAM)NYSE:SAM33.96%0.0021.91%4.61%Exponent, Inc. (NasdaqGS:EXPO)NasdaqGS:EXPO30.07%0.0017.05%4.33%Monster Beverage Corporation (NasdaqGS:MNST)NasdaqGS:MNST33.37%0.0021.83%3.84%Zix Corporation (NasdaqGS:ZIXI)NasdaqGS:ZIXI42.00%0.0013.09%3.42%Trex Company, Inc. (NYSE:TREX)NYSE:TREX33.73%0.0053.07%3.27%PetMed Express, Inc. (NasdaqGS:PETS)NasdaqGS:PETS37.20%0.0026.32%3.14%Omega Flex, Inc. (NasdaqGM:OFLX)NasdaqGM:OFLX32.04%0.0031.57%3.03%Jewett-Cameron Trading Company Ltd. (NasdaqCM:JCTC.F)NasdaqCM:JCTC.F40.00%0.0013.08%2.58%Dorman Products, Inc. (NasdaqGS:DORM)NasdaqGS:DORM36.84%0.0018.37%2.45%F5 Networks, Inc. (NasdaqGS:FFIV)NasdaqGS:FFIV32.60%0.0035.44%2.35%Lancaster Colony Corporation (NasdaqGS:LANC)NasdaqGS:LANC34.30%0.0022.97%2.25%Nutrisystem, Inc. (NasdaqGS:NTRI)NasdaqGS:NTRI31.21%0.0045.46%2.17%Collectors Universe Inc. (NasdaqGM:CLCT)NasdaqGM:CLCT35.76%0.00110.70%2.01%
Tax Losers (Low Effective Tax Rate + High Debt + Low Return on Capital)
table.tableizer-table { font-size: 12px; border: 1px solid #CCC; font-family: Arial, Helvetica, sans-serif; } .tableizer-table td { padding: 4px; margin: 3px; border: 1px solid #CCC; } .tableizer-table th { background-color: #104E8B; color: #FFF; font-weight: bold; }
Company NameExchange:TickerIndustry GroupEffective Tax RateTotal Debt/EBITDAReturn on CapitalLions Gate Entertainment Corp. (NYSE:LGF.A)NYSE:LGF.AConsumer Discretionary (Primary)0.00%9.003.38%AV Homes, Inc. (NasdaqGS:AVHI)NasdaqGS:AVHIConsumer Discretionary (Primary)8.63%11.604.36%Smart & Final Stores, Inc. (NYSE:SFS)NYSE:SFSConsumer Staples (Primary)0.00%4.883.19%Orchids Paper Products Company (AMEX:TIS)AMEX:TISConsumer Staples (Primary)0.00%9.781.06%Cheniere Energy, Inc. (AMEX:LNG)AMEX:LNGEnergy (Primary)1.35%22.303.23%U.S. Silica Holdings, Inc. (NYSE:SLCA)NYSE:SLCAEnergy (Primary)0.00%4.132.10%Envision Healthcare Corporation (NYSE:EVHC)NYSE:EVHCHealthcare (Primary)0.00%6.444.87%CIRCOR International, Inc. (NYSE:CIR)NYSE:CIRIndustrials (Primary)0.00%4.464.15%Pangaea Logistics Solutions Ltd. (NasdaqCM:PANL)NasdaqCM:PANLIndustrials (Primary)0.00%5.504.52%DXC Technology Company (NYSE:DXC)NYSE:DXCInformation Technology (Primary)0.00%6.122.71%GoDaddy Inc. (NYSE:GDDY)NYSE:GDDYInformation Technology (Primary)0.00%13.101.83%Park Electrochemical Corp. (NYSE:PKE)NYSE:PKEInformation Technology (Primary)0.00%5.623.21%Brocade Communications Systems, Inc. (NasdaqGS:BRCD)NasdaqGS:BRCDInformation Technology (Primary)0.00%4.334.74%Hickok Incorporated (OTCPK:HICK.A)OTCPK:HICK.AInformation Technology (Primary)0.00%12.102.88%Olin Corporation (NYSE:OLN)NYSE:OLNMaterials (Primary)0.00%4.304.32%Venator Materials PLC (NYSE:VNTR)NYSE:VNTRMaterials (Primary)0.00%4.242.22%Xenia Hotels & Resorts, Inc. (NYSE:XHR)NYSE:XHRReal Estate (Primary); Real Estate (Primary)2.19%4.054.15%Connecticut Water Service, Inc. (NasdaqGS:CTWS)NasdaqGS:CTWSUtilities (Primary)3.29%5.734.59%
August 11, 2017
A Tesla 2017 Update: A Disruptive Force and a Debt Puzzle!
These are certainly exciting times for Tesla. The first production version of the Tesla 3 was unveiled on July 28, with few surprises on the details, but plenty of good reviews. Elon Musk was his usual self, alternating between celebrating success and warning investors in the stock that the company was approaching "manufacturing hell", as it ramps up its production schedule to meet its target of producing 10,000 cars a week. It is perhaps to cover the cash burn in manufacturing hell that Tesla also announced that it planned to raise $1.5 billion in a junk bond offering. Investors continued to be unfazed by the negative and lapped up the positive, as the stock price soared to $365 at close of trading on August 9, 2017. With all of this happening, it is time for me to revisit my Tesla valuation, last updated in July 2016, and incorporate, as best as I can, what I have learned about the company since then.
Tesla: The Story Stock
I have been following Tesla for a few years and rather than revisit the entire history, let me go back to just my most recent post on the company in July 2016, where I called Tesla the ultimate story stock. I argued that wide differences between investors on what Tesla is worth can be traced to divergent story lines on the stock. I used the picture below to illustrate the story choices when it comes to Tesla, and how those choices affected the inputs into the valuation.
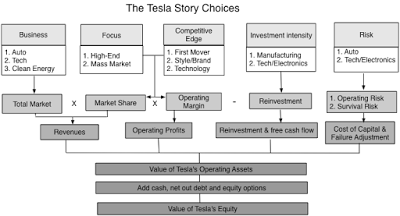
In that post, I also traced out the effect of story choices on value, by estimating how the numbers vary, depending upon the business, focus and competitive edge that you saw Tesla having in the future:
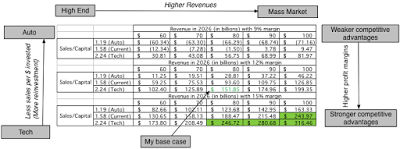
With my base case story of Tesla being an auto/tech company with revenues pushing towards mass market levels and margins resembling those of tech companies, I estimated a value of about $151 a share for the company and my best case estimate of value was $316.46.
Tesla: Operating Update
If you are invested in or have been following Tesla for the last year, you are certainly aware that the market has blown through my best case scenario, with the stock trading on August 9, at $365 a share, completing a triumphant year in markets:
As Tesla's stock price rose, it broke through milestones that guaranteed it publicity along the way. It's market capitalization exceeded that of Ford and General Motors in April 2016, and in June 2016, Tesla leapfrogged BMW to become the fourth largest market cap automaker in the world, though it has dropped back a little since. It now ranks fifth, in market capitalization, among global automobile companies:
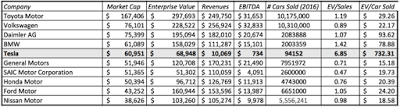 Largest Auto Companies (Market Capitalization) on August 9, 2017While Tesla's market cap has caught up with larger and more established auto makers, its production and revenues are a fraction of theirs, leading some to use metrics like enterprise value per car sold to conclude that Tesla is massively over valued. I don't have much faith in these pricing metrics to begin with, but even less so when comparing a company with massive potential to companies that are in decline, as I think many of the conventional auto companies in this table are currently.
As I noted at the start of the post, it has been an eventful year for Tesla, with the completion of the Solar City acquisition, and the Tesla 3 dominating news, and its financial results reflect its changes as a company. In the twelve months ended June 30, 2017, Tesla's revenues hit $10.07 billion, up from $7 billion in its most recent fiscal year, which ended on December 31, 3016; on an annualized basis, that translates into a revenue growth rate of 107%. That positive news, though, has to be offset at least partially with the bad news, which is that the company continues to lose money, reporting an operating loss of $638 million in the most recent 12 months, with R&D expensed, and a loss of $103 million, with capitalized R&D. The growth in the company can be seen by looking at how quickly its operations have scaled up, over the last few years: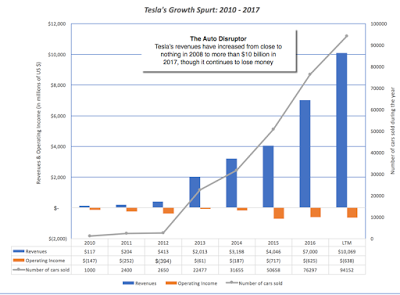
Tesla's growth has not just been in the operating numbers but in its influence on the automobile sector. While it was initially dismissed by the other automobile companies as a newcomer that would learn the facts of life in the sector, as it aged, the reverse has occurred. It is the conventional automobile companies that are, slowly but surely, coming to the recognition that Tesla has changed their long-standing business. Volvo, a Swedish automaker not known for its flair, announced recently that all of its cars would be either electric or hybrid by 2019, and Ford's CEO was displaced for not being more future oriented. A little more than a decade after it burst on to the scene, it is a testimonial to Elon Musk that he has started the disruption of one of the most tradition-bound sectors in business.
Tesla: Valuation Update
The production hiccups notwithstanding, the company continues to move towards production of the Tesla 3, with the delivery of the handful to start the process. There is much that needs to be done, but I consider it a good sign that the company sees a manufacturing crunch approaching, since I would be concerned if they were to claim that they could ramp up production from 94,000 to 500,000 cars effortlessly. My updated story for Tesla is close to the story that I was telling in July 2016, with two minor changes. The first is that the production models of the Tesla 3 confirm that the company is capable of delivering a car that can appeal to a much broader market than prior models, putting it on a pathway to higher revenues. My expected revenues for Tesla in ten years are close to $93 billion, a nine-fold increase from last year's revenues and a higher target than the $81 billion that I projected in my July 2016 valuation. Second, the operating margins, while still negative, have become less so in the most recent period, reducing reinvestment needs for funding growth. The free cash flows are still negative for the next seven years, a cash burn that will require about $15.5 billion in new capital infusions over that period. With those changes, the value per share that I estimate is about $192/share, about 20% higher than my $151 estimate a year ago, but well below the current price per share of $365.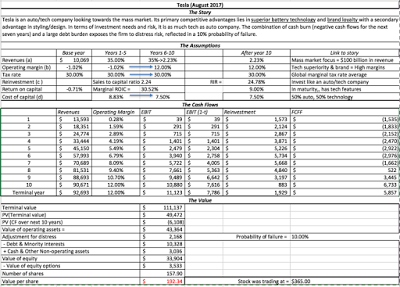 Download spreadsheetAs with every Tesla valuation that I have done, I am sure (and I hope) that you will disagree with me, with some finding me way too pessimistic about Tesla's future, and others, much too optimistic. As always, rather than tell me what you think I am getting wrong, I would encourage you to download the spreadsheet and replace my assumption with yours. I think I am being clear eyed about the challenges that Tesla will face along the way and here are the top three: Can Tesla sell millions of cars? One of Tesla's accomplishments has been exposing the potential of the hybrid/electric car market, even in an era of restrained fuel prices. That is good news for Tesla, but it has also woken up the established automobile companies, as is evidenced by not only the news from Volvo and Ford, but also in increased activity on this front at the other automobile companies. In my valuation, the revenues that I project in 2027 will require Tesla to sell close to 2 million cars, in the face of increased competition.Can it make millions of cars? Tesla's current production capacity is constrained and there are two production tests that Tesla has to meet. The first is timing, since the Tesla 3 deliveries have been promised for the middle of 2018, and the assembly lines have to be humming by then. The second is cost, since a subtext of the Tesla story, reinforced by hints from Elon Musk, is that the company has found new and innovative ways of scaling up production quickly and at much lower costs than conventional automobile companies. Can it generate double digit margins? In my valuation, I assume an operating margin of 12% for Tesla, almost double the average of 6.33% for global auto companies. For Tesla to generate this higher margin, it has to be able to keep production costs low at its existing and new assembly plants and to be able to charge a premium price for its automobiles, perhaps because of its brand name. Tesla has shown a capacity to attract and keep customers and I think it is more than capable of meeting the first challenge, i.e., sell millions of cars, especially since its competition is saddled with legacy costs and image problems. It is the production challenge that is the more daunting one, simply because this has always been Tesla's weakest link. Over the last few years, Tesla has consistently had trouble meeting logistical and delivery targets it has set for itself, and those targets will only get more daunting in the years to come. Furthermore, if its production costs run above expectations, it will be unable to deliver on higher margins. To succeed, Tesla will require vision, focus and operating discipline. With Elon Musk at its helm, the company will never lack vision, but as I argued in my July 2016 post, Mr. Musk may need a chief operating officer at his side to take care of delivery deadlines and supply chains.
Financing Cash Burn: Tesla's Odd Choice
There is much to admire in the Tesla story but there is one aspect of the story that I find puzzling, and if I were an equity investor, troubling. It is the way in which Tesla has chosen to, and continues to, finance itself. Over the last decade, as Tesla has grown, it has needed substantial capital to finance its growth. That is neither surprising nor unexpected, since cash burn is part of the pathway to glory for companies like Tesla. However, Tesla has chosen to fund its growth with large debt issues, as can be seen in the graph below: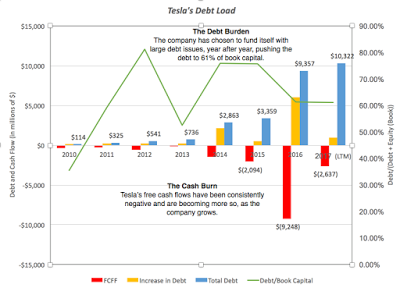
That debt load, already high, given Tesla’s operating cash flows is likely to get even bigger if Tesla succeeds in its newest debt issue of $1.5 billion, which it is hoping to place with an interest rate of 5.25%, trying to woo bond buyers with the same pitch of growth and hope that has been so attractive to equity markets. That suggests that those making the pitch either do not understand how bonds work (that bondholders don't get to share much in upside but share fully in the downside) or are convinced that there are enough naive bond buyers out there, who think that interest payments can be made with potential and promise.
But setting aside concerns about bondholders, the debt issuance makes even less sense from Tesla's perspective. Unlike some, I don’t have a kneejerk opposition to the use of debt. In fact, given that the tax code is tilted to benefit debt, it does make sense for many companies to use debt instead of equity. The trade off, though, is a simple one: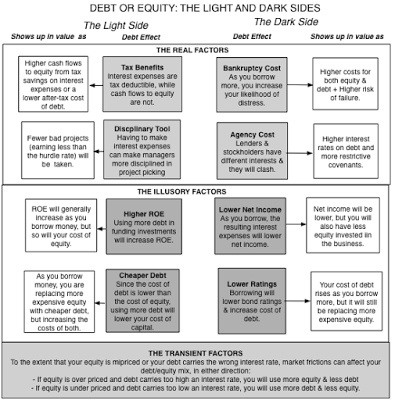
If you look at the trade off, you can see quickly that Tesla is singularly unsuited to using debt. It is a company that is not only still losing money but has carried forward losses of close to $4.3 billion, effectively nullifying any tax benefits from debt for the near future (by my estimates, at least seven years). With Elon Musk, the largest stockholder at the company, at the helm, there is no basis for the argument that debt will make managers more disciplined in their investment decisions. While the benefits from debt are low to non-existent, the costs are immense. The company is still young and losing money, and adding a contractual commitment to make interest payments on top of all of the other capital needs that the company has, strikes me as imprudent, with the possibility that one bad year could its promise at risk. Finally, in a company like Tesla, making large and risky bets in new businesses, the chasm between lenders and equity investors is wide, and lenders will either impose restrictions on the company or price in their fears (as higher interest rates). So, why is Tesla borrowing money? I can think of two reasons and neither reflects well on the finance group at Tesla or the bankers who are providing it with advice.The Dilution Bogeyman: The first is that the company or its investment bankers are so terrified of dilution, that a stock issue is not even on the table. Once the dilution bogeyman enters the decision process, any increase in share count for a company is viewed as bad, and you will do everything in your power to prevent that from happening, even if it means driving the company into bankruptcy. Inertia: Auto companies have generally borrowed money to fund assembly plants and the bankers may be reading the capital raising recipe from that same cookbook for Tesla. That is incongruent with Elon Musk’s own story of Tesla as a company that is more technology than automobile and one that plans to change the way the auto business is run.Tesla’s strengths are vision and potential and while equity investors will accept these as down payments for cash flows in the future, lenders will not and should not. In fact, I cannot think of a better case of a company that is positioned to raise fresh equity to fund growth than Tesla, a company that equity investors love and have shown that love by pushing stock prices to record highs. Issuing shares to fund investment needs will increase the share count at Tesla by about 3-4% (which is what you would expect to see with a $1.5 billion equity issue) but that is a far better choice than borrowing the money and binding yourself to make interest payments. There will be a time and a place for Tesla to borrow money, later in its life cycle, but that time and place is not now. If Tesla is dead set on not raising its share count, there is perhaps one way in which Tesla may be able to eat its cake and have it too, and that is to exploit the dilution bogeyman's blind spot, which is a willingness to overlook potential dilution (from the issuance of convertibles and options). In fact, why not issue long term, really low coupon convertible bonds, very similar to this one from 2014, a bond only in name since almost all of its value came from the conversion option (which is equity with delayed dilution)?
Conclusion
The Tesla story continues to evolve, and there is much in the story that I like. It is changing the automobile business, a feat in itself, and it is starting to deliver on its production promises. The next year may be manufacturing hell, but if the company can make its through that hell and find ways to deliver the tens of thousands of Tesla 3s that it has committed to delivering, it will be well on its way. I still find the stock to be too richly priced, even given its promise and potential, for my liking, but I understand that many of you may disagree. That said, though, I do think that the company's decision to use debt to fund its operations makes no sense, given where it is in the life cycle.
YouTube Video
Previous Blog Posts
Tesla: It's a story stock, but what's the story? (July 2016)
Spreadsheet Attachments
Tesla Valuation: August 2017Tesla Valuation: July 2016
Tesla: The Story Stock
I have been following Tesla for a few years and rather than revisit the entire history, let me go back to just my most recent post on the company in July 2016, where I called Tesla the ultimate story stock. I argued that wide differences between investors on what Tesla is worth can be traced to divergent story lines on the stock. I used the picture below to illustrate the story choices when it comes to Tesla, and how those choices affected the inputs into the valuation.

In that post, I also traced out the effect of story choices on value, by estimating how the numbers vary, depending upon the business, focus and competitive edge that you saw Tesla having in the future:

With my base case story of Tesla being an auto/tech company with revenues pushing towards mass market levels and margins resembling those of tech companies, I estimated a value of about $151 a share for the company and my best case estimate of value was $316.46.
Tesla: Operating Update
If you are invested in or have been following Tesla for the last year, you are certainly aware that the market has blown through my best case scenario, with the stock trading on August 9, at $365 a share, completing a triumphant year in markets:
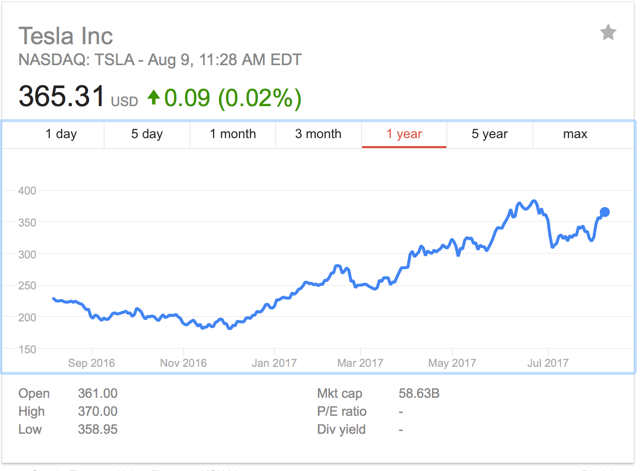
As Tesla's stock price rose, it broke through milestones that guaranteed it publicity along the way. It's market capitalization exceeded that of Ford and General Motors in April 2016, and in June 2016, Tesla leapfrogged BMW to become the fourth largest market cap automaker in the world, though it has dropped back a little since. It now ranks fifth, in market capitalization, among global automobile companies:
 Largest Auto Companies (Market Capitalization) on August 9, 2017While Tesla's market cap has caught up with larger and more established auto makers, its production and revenues are a fraction of theirs, leading some to use metrics like enterprise value per car sold to conclude that Tesla is massively over valued. I don't have much faith in these pricing metrics to begin with, but even less so when comparing a company with massive potential to companies that are in decline, as I think many of the conventional auto companies in this table are currently.
As I noted at the start of the post, it has been an eventful year for Tesla, with the completion of the Solar City acquisition, and the Tesla 3 dominating news, and its financial results reflect its changes as a company. In the twelve months ended June 30, 2017, Tesla's revenues hit $10.07 billion, up from $7 billion in its most recent fiscal year, which ended on December 31, 3016; on an annualized basis, that translates into a revenue growth rate of 107%. That positive news, though, has to be offset at least partially with the bad news, which is that the company continues to lose money, reporting an operating loss of $638 million in the most recent 12 months, with R&D expensed, and a loss of $103 million, with capitalized R&D. The growth in the company can be seen by looking at how quickly its operations have scaled up, over the last few years:
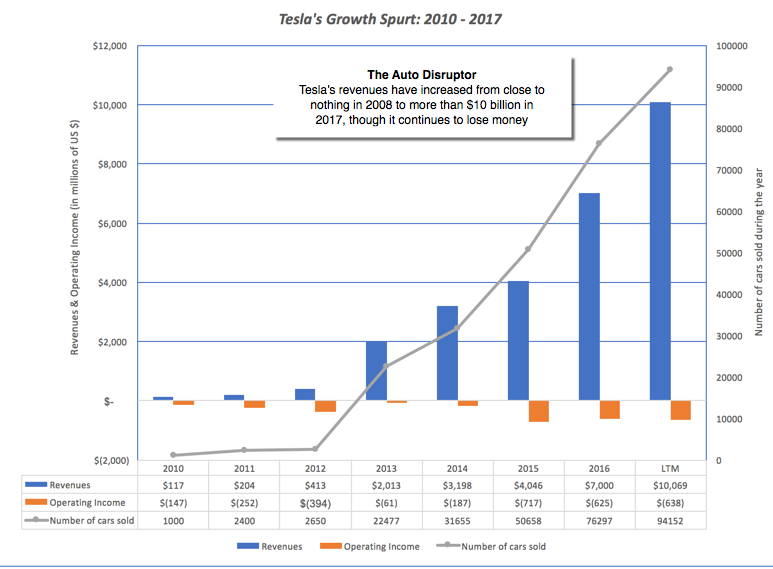
Tesla's growth has not just been in the operating numbers but in its influence on the automobile sector. While it was initially dismissed by the other automobile companies as a newcomer that would learn the facts of life in the sector, as it aged, the reverse has occurred. It is the conventional automobile companies that are, slowly but surely, coming to the recognition that Tesla has changed their long-standing business. Volvo, a Swedish automaker not known for its flair, announced recently that all of its cars would be either electric or hybrid by 2019, and Ford's CEO was displaced for not being more future oriented. A little more than a decade after it burst on to the scene, it is a testimonial to Elon Musk that he has started the disruption of one of the most tradition-bound sectors in business.
Tesla: Valuation Update
The production hiccups notwithstanding, the company continues to move towards production of the Tesla 3, with the delivery of the handful to start the process. There is much that needs to be done, but I consider it a good sign that the company sees a manufacturing crunch approaching, since I would be concerned if they were to claim that they could ramp up production from 94,000 to 500,000 cars effortlessly. My updated story for Tesla is close to the story that I was telling in July 2016, with two minor changes. The first is that the production models of the Tesla 3 confirm that the company is capable of delivering a car that can appeal to a much broader market than prior models, putting it on a pathway to higher revenues. My expected revenues for Tesla in ten years are close to $93 billion, a nine-fold increase from last year's revenues and a higher target than the $81 billion that I projected in my July 2016 valuation. Second, the operating margins, while still negative, have become less so in the most recent period, reducing reinvestment needs for funding growth. The free cash flows are still negative for the next seven years, a cash burn that will require about $15.5 billion in new capital infusions over that period. With those changes, the value per share that I estimate is about $192/share, about 20% higher than my $151 estimate a year ago, but well below the current price per share of $365.
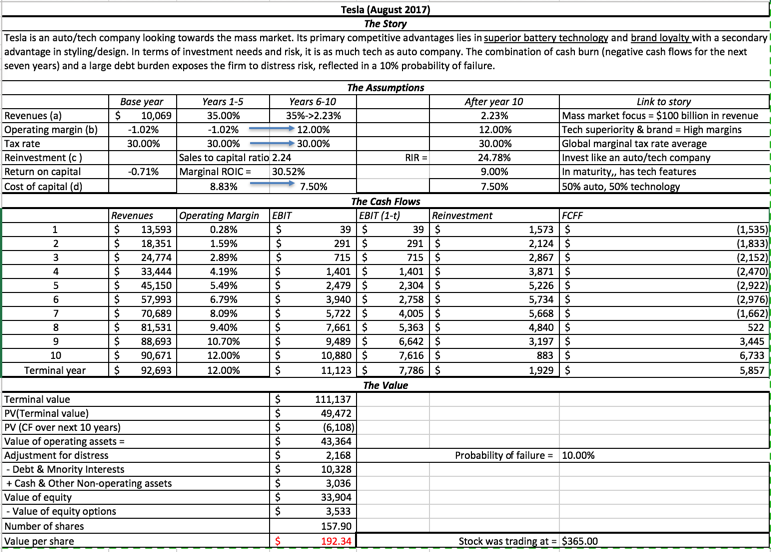 Download spreadsheetAs with every Tesla valuation that I have done, I am sure (and I hope) that you will disagree with me, with some finding me way too pessimistic about Tesla's future, and others, much too optimistic. As always, rather than tell me what you think I am getting wrong, I would encourage you to download the spreadsheet and replace my assumption with yours. I think I am being clear eyed about the challenges that Tesla will face along the way and here are the top three: Can Tesla sell millions of cars? One of Tesla's accomplishments has been exposing the potential of the hybrid/electric car market, even in an era of restrained fuel prices. That is good news for Tesla, but it has also woken up the established automobile companies, as is evidenced by not only the news from Volvo and Ford, but also in increased activity on this front at the other automobile companies. In my valuation, the revenues that I project in 2027 will require Tesla to sell close to 2 million cars, in the face of increased competition.Can it make millions of cars? Tesla's current production capacity is constrained and there are two production tests that Tesla has to meet. The first is timing, since the Tesla 3 deliveries have been promised for the middle of 2018, and the assembly lines have to be humming by then. The second is cost, since a subtext of the Tesla story, reinforced by hints from Elon Musk, is that the company has found new and innovative ways of scaling up production quickly and at much lower costs than conventional automobile companies. Can it generate double digit margins? In my valuation, I assume an operating margin of 12% for Tesla, almost double the average of 6.33% for global auto companies. For Tesla to generate this higher margin, it has to be able to keep production costs low at its existing and new assembly plants and to be able to charge a premium price for its automobiles, perhaps because of its brand name. Tesla has shown a capacity to attract and keep customers and I think it is more than capable of meeting the first challenge, i.e., sell millions of cars, especially since its competition is saddled with legacy costs and image problems. It is the production challenge that is the more daunting one, simply because this has always been Tesla's weakest link. Over the last few years, Tesla has consistently had trouble meeting logistical and delivery targets it has set for itself, and those targets will only get more daunting in the years to come. Furthermore, if its production costs run above expectations, it will be unable to deliver on higher margins. To succeed, Tesla will require vision, focus and operating discipline. With Elon Musk at its helm, the company will never lack vision, but as I argued in my July 2016 post, Mr. Musk may need a chief operating officer at his side to take care of delivery deadlines and supply chains.
 Financing Cash Burn: Tesla's Odd Choice
There is much to admire in the Tesla story but there is one aspect of the story that I find puzzling, and if I were an equity investor, troubling. It is the way in which Tesla has chosen to, and continues to, finance itself. Over the last decade, as Tesla has grown, it has needed substantial capital to finance its growth. That is neither surprising nor unexpected, since cash burn is part of the pathway to glory for companies like Tesla. However, Tesla has chosen to fund its growth with large debt issues, as can be seen in the graph below:

That debt load, already high, given Tesla’s operating cash flows is likely to get even bigger if Tesla succeeds in its newest debt issue of $1.5 billion, which it is hoping to place with an interest rate of 5.25%, trying to woo bond buyers with the same pitch of growth and hope that has been so attractive to equity markets. That suggests that those making the pitch either do not understand how bonds work (that bondholders don't get to share much in upside but share fully in the downside) or are convinced that there are enough naive bond buyers out there, who think that interest payments can be made with potential and promise.
But setting aside concerns about bondholders, the debt issuance makes even less sense from Tesla's perspective. Unlike some, I don’t have a kneejerk opposition to the use of debt. In fact, given that the tax code is tilted to benefit debt, it does make sense for many companies to use debt instead of equity. The trade off, though, is a simple one:

If you look at the trade off, you can see quickly that Tesla is singularly unsuited to using debt. It is a company that is not only still losing money but has carried forward losses of close to $4.3 billion, effectively nullifying any tax benefits from debt for the near future (by my estimates, at least seven years). With Elon Musk, the largest stockholder at the company, at the helm, there is no basis for the argument that debt will make managers more disciplined in their investment decisions. While the benefits from debt are low to non-existent, the costs are immense. The company is still young and losing money, and adding a contractual commitment to make interest payments on top of all of the other capital needs that the company has, strikes me as imprudent, with the possibility that one bad year could its promise at risk. Finally, in a company like Tesla, making large and risky bets in new businesses, the chasm between lenders and equity investors is wide, and lenders will either impose restrictions on the company or price in their fears (as higher interest rates). So, why is Tesla borrowing money? I can think of two reasons and neither reflects well on the finance group at Tesla or the bankers who are providing it with advice.The Dilution Bogeyman: The first is that the company or its investment bankers are so terrified of dilution, that a stock issue is not even on the table. Once the dilution bogeyman enters the decision process, any increase in share count for a company is viewed as bad, and you will do everything in your power to prevent that from happening, even if it means driving the company into bankruptcy. Inertia: Auto companies have generally borrowed money to fund assembly plants and the bankers may be reading the capital raising recipe from that same cookbook for Tesla. That is incongruent with Elon Musk’s own story of Tesla as a company that is more technology than automobile and one that plans to change the way the auto business is run.Tesla’s strengths are vision and potential and while equity investors will accept these as down payments for cash flows in the future, lenders will not and should not. In fact, I cannot think of a better case of a company that is positioned to raise fresh equity to fund growth than Tesla, a company that equity investors love and have shown that love by pushing stock prices to record highs. Issuing shares to fund investment needs will increase the share count at Tesla by about 3-4% (which is what you would expect to see with a $1.5 billion equity issue) but that is a far better choice than borrowing the money and binding yourself to make interest payments. There will be a time and a place for Tesla to borrow money, later in its life cycle, but that time and place is not now. If Tesla is dead set on not raising its share count, there is perhaps one way in which Tesla may be able to eat its cake and have it too, and that is to exploit the dilution bogeyman's blind spot, which is a willingness to overlook potential dilution (from the issuance of convertibles and options). In fact, why not issue long term, really low coupon convertible bonds, very similar to this one from 2014, a bond only in name since almost all of its value came from the conversion option (which is equity with delayed dilution)?
Conclusion
The Tesla story continues to evolve, and there is much in the story that I like. It is changing the automobile business, a feat in itself, and it is starting to deliver on its production promises. The next year may be manufacturing hell, but if the company can make its through that hell and find ways to deliver the tens of thousands of Tesla 3s that it has committed to delivering, it will be well on its way. I still find the stock to be too richly priced, even given its promise and potential, for my liking, but I understand that many of you may disagree. That said, though, I do think that the company's decision to use debt to fund its operations makes no sense, given where it is in the life cycle.
YouTube Video
Previous Blog Posts
Tesla: It's a story stock, but what's the story? (July 2016)
Spreadsheet Attachments
Tesla Valuation: August 2017Tesla Valuation: July 2016
August 1, 2017
The Crypto Currency Debate: Future of Money or Speculative Hype?
When it comes to any finance-related questions, I am fair game, and those questions usually span the spectrum, from what I think about Warren Buffett (or why I don't agree with everything he says) to whether tech stocks are in a bubble (a perennial question for worry warts). In the last few months, though, I have noticed that I have been getting more and more questions about crypto currencies, especially Bitcoin and Ether, and whether the price surges we have seen in these currencies are merited. While I have an old post on bitcoin, I have generally held back from talking about crypto currencies in this blog or in my other teaching for two reasons. First, I find that any conversation about bitcoin quickly devolves into an argument rather than a discussion, since both proponents and critics tend to hold strong views on its use (or uselessness). Second, I find that some of the technical underpinnings of bitcoin, ether and other cryptocurrencies are beyond my limited understanding of block chains and technology and I risk saying something incredibly ill informed. While both reasons still persist, I am going to throw caution to the winds and put down my thoughts about the rise, the mechanics and the future, at least as I see it, of crypto currencies in this post.
The Market BoomAny discussion of crypto currencies has to start with the recognition that the experiment is still young. Satoshi Nakamoto's paper on bitcoin was made public in October 2008 and implemented as open source in January 2009. Less than ten years later, the market capitalization of bitcoin alone is in excess of $40 billion and the success story, at least in terms of bitcoin as an investment, can be seen in the graph below: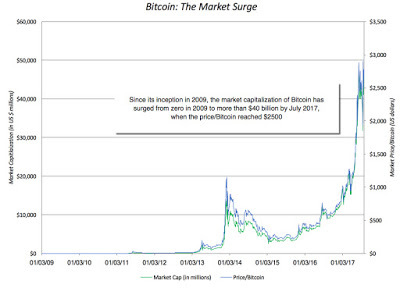
The initial rise could have been a flash in the pan, a fad attracting speculators, but in the last two years, Bitcoin seems to have found new fans, as can be seen below:
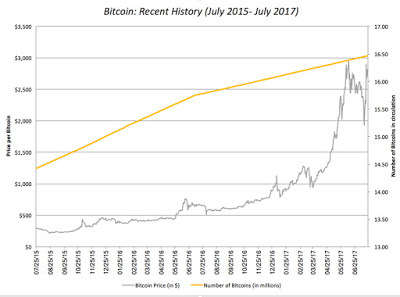
Bitcoin's success, at least in the financial markets, has attracted a host of competitors, with Ethereum (Ether) being the most successful. Ether's rise in market price, since its introduction in 2015 has been even more precipitous that Bitcoin's, though it has pulled back in recent weeks:
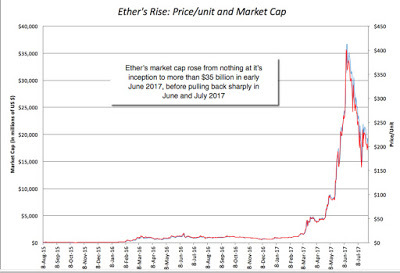
The list of crypto currencies gets added to, by the day, with a complete list available here, with the market caps of each (in US dollars) listed. At least from a market perspective, there is no doubting the fact that crypto currencies have arrived, and enriched a lot of people along the way.
The Mechanics
While the crypto currencies emphasize their differences, the most successful ones share a base architecture, the block chain. A block chain is a shared digital ledger of transactions in an asset where the validation of transactions is decentralized. I know that sounds mystical, but the picture below (using bitcoin to illustrate) should provide a better sense of what's involved:
The key features of a block chain are:
Decentralized verification: The validation and verification of a transaction is sourced to members, called miners in the crypto currency world. Verification usually involves trying different algorithms (hashes) to find the unique one that matches the transaction block, and the successful miner is rewarded, currently with the crypto currency. At least, as I understand it, this process requires more brute force (powerful processors trying different algorithms before you find a match) than intellectual firepower.Complete and open records: Every transaction, once validated and verified, is converted into a block of data that is recorded in the block chain ledger, which is accessible to everyone in the network. If you are worried about privacy, the transaction records do not include personal data but take the form of encrypted data (hashes).Incorruptible: A block chain, once recorded and shared, cannot be changed since those changes are visible to everyone in the network and are quickly tagged as fraudulent. Thus, the ledger, once created, becomes almost incorruptible.In effect, a block chain is a digital intermediation process where transactions are checked by members of the network, and recorded, and once that is done, cannot be altered fraudulently. As you can see from its description, the block chain technology is about far more than crypto currencies. It can be used to record transactions in any asset, from securities in financial markets to physical assets like houses, and do so in a way that replaces the existing intermediaries with decentralized models. It should come as no surprise that banks and stock exchanges, which make the bulk of their money from intermediation, not only see block chains as a threat to their existence but have been early investors in the technology, hoping to co-opt it to their own needs.
The Currency Question
If you define success as a rise in market capitalization and popular interest, crypto currencies have clearly succeeded, perhaps more quickly than its original proponents ever expected it to. But the long term success of any crypto currency has to answer a different question, which is whether it is a "good" currency. Harking back to Money 101, you measure a currency's standing by looking at how well it delivers on its three purposes:Unit of account: A key role for a currency is to operate as a unit of account, allowing you to value not just assets and liabilities, but also goods and services. To be effective as a unit of account, a currency has to be fungible (one unit of the currency is identical to any other unit), divisible and countable. Medium of exchange: Currencies exist to make transactions possible, and this is best accomplished if the currency in question is easily accessible and transportable, and is accepted by buyers and sellers as legal tender. The latter will occur only if people trust that the currency will maintain its value and if transactions costs are low.Store of value: To the extent that you hold some or all of your wealth in a currency, you want to feel secure about leaving it in that currency, knowing that it will not lose its buying power while stored. Given these requirements, you can see why there are no perfect currencies and why every currency has to measured on a continuum from good to bad. Broadly speaking, currencies can take one of three forms, a physical asset (gold, silver, diamonds, shells), a fiat currency (usually taking the form of paper and coins, backed by a government) and crypto currencies. Gold's long tenure as a currency can be attributed to its strength as a store of value, arising from its natural scarcity and durability, though it falls short of fiat currencies, in terms of convenience and acceptance, both as a unit of account and as medium of exchanges. Fiat currencies are backed by sovereign governments and consequently can vary in quality as currencies, depending upon the trust that we have in the issuing governments. Without trust, fiat currency is just paper, and there are some fiat currencies where that paper can become close to worthless. For crypto currencies, the question then becomes how well they deliver on each of the purposes. As units of account, there is no reason to doubt that they can function, since they are fungible, divisible and countable. The weakest link in crypto currencies has been their failure to make deeper inroads as mediums of exchange or as stores of value. Using Bitcoin, to illustrate, it is disappointing that so few retailers still accept it as payment for goods and services. Even the much hyped successes, such as Overstock and Microsoft accepting Bitcoin is illusory, since they do so on limited items, and only with an intermediary who converts the bitcoin into US dollars for them . I certainly would not embark on a long or short trip away from home today, with just bitcoins in my pocket, nor would I be willing to convert all of my liquid savings into bitcoin or any other crypto currency. Would you?
So, why has crypto currency not seen wider acceptance in transactions? There are a few reasons, some of which are more benign than others:
Inertia: Fiat currencies have a had a long run, and it is not surprising that for many people, currency is physical and takes the form of government issued paper and coins. While people may use credit cards and Apple Pay, their thinking is still framed by the past, and it may take a while, especially for older consumers and retailers, to accept a digital currency. That said, the speed with which consumers have adapted to ride sharing services and taken to social media suggests that inertia cannot be the dominant reason holding back the acceptance of crypto currencies.Price volatility: Crypto currencies have seen and continue to see wild swings in prices, not a bad characteristic in a traded asset but definitely not a good one in a currency. A retailer or service provider who prices his or her goods and services in bitcoin will constantly have to reset the price and consumers have little certitude of how much the bitcoin in their wallers will buy a few hours from now.Competing crypto currencies: The crypto currency game is still young and the competing players each claim to have found the "magic bullet" for eventual acceptance. As technologies and tastes evolve, you will see a thinning of the herd, where buyers and sellers will pick winners, perhaps from the current list or maybe something new. It is possible that until this happens, transactors will hold up, for fear of backing the wrong horse in the race.Ultimately, though, I lay some of the blame on the creators of the crypto currencies, for their failure, at least so far, on the transactions front. As I look at the design and listen to the debate about the future of crypto currencies, it seems to me that the focus on marketing crypto currencies has not been on transactors, but on traders in the currency, and it remains an unpleasant reality that what makes crypto currencies so attractive to traders (the wild swings in price, the unpredictability, the excitement) make them unacceptable to transactors.
The Disconnect
You can see the disconnect in how crypto currencies have been greeted, by contrasting the rousing reception that markets have given them with the arms length at which they have been held by merchandisers and consumers. In the graph below, I focus on the divergence between the market price rise of bitcoin and the increase in the number of transactions involving bitcoin:
While the price of bitcoin has increase more than a thousand fold, since the start of 2012, the number of transactions involving bitcoin was only about thirty two times larger in July 2017 than what it was at the start of 2012. In my view, there are three possible explanations for the divergence, and they are not mutually exclusive:
Markets are forward looking: If you are a believer in crypto currencies, the most optimistic explanation is that markets are forward looking and that the rise in the prices of Bitcoin and Ether reflects market expectations that they will succeed as currencies, if not right away, in the near future. Speculative asset: I am second to none in having faith in markets, but there is a simpler and perhaps better explanation for the frenzied price movements in crypto currencies. I have long drawn a distinction between the value game (where you try to attach a value to an asset based upon fundamentals) and the pricing game, where mood and momentum drive the process. I would argue, based upon my limited observations of the crypto currency markets, that these are pure pricing games, where fundamentals have been long since forgotten. If you don't believe me, visit one of the forums where traders in these markets converse and take note of how little talk there is about fundamentals and how much there is about trading indicators.Loss of trust in centralized authorities (governments & central banks): There can be no denying that the creators of Bitcoin and Ether were trying to draw as much inspiration for their design from gold, as they were from fiat currencies. Thus, you have miners in crypto currency markets who do their own version of prospecting when validating transactions and are rewarded with the currency in question. For ages, gold has held a special place in the currency continuum, often being the asset of last resort for people who have lost faith in fiat currencies, either because they don't trust the governments backing them or because of debasement (high inflation). While gold will continue to play this role, I believe that for some people (especially younger and more technologically inclined), bitcoin and ether are playing the same role. As surveys continue to show depleting trust in centralized authorities (governments and central banks), you may see more money flow into crypto currencies. The analogy between gold and crypto currency has one weak link. Gold has held its value through the centuries and is a physical asset. For better or worse, it is unlikely that we will decide a few years from now that gold is worthless. A crypto currency that few people use as currency ultimately will not be able to sustain itself, as shiner and newer versions of it pop up. Ironically, if traders in bitcoin and ether want their investments in the crypto currencies to hold their value, the currencies have to become less exciting and lucrative as investments, and become more accepted as currencies. Since that will not happen by accident, I would suggest that the winning crypto currency or currencies will share the following characteristics;Transaction, not trading, talk: From creators and proponents of the currency, you will hear less talk about how much money you would make by buying and selling the currency and more on its efficacy in transactions.Transaction, not trading, features: The design of the crypto currency will focus on creating features that make it attractive as a currency (for transactions), not as investments. Thus, if you are going to impose a cap (either rigid like Bitcoin or more flexible, as with other currencies), you need to explain to transactors, not traders, why the cap makes sense. Trust in something: I know that we live in an age where trust is a scarce resource and I argued that that the growth in crypto currencies can be attributed, at least partly, to this loss of trust. That said, to be effective as a currency, you do need to be able to trust in something and perhaps accept compromises on privacy and centralized authority (at least on some dimensions of the currency). It is also worth noting that the real tests for crypto currencies will occur when they reach their caps (fixed or flexible). After all, bitcoin and ether miners have been willing to put in the effort to validate transactions because they are rewarded with issues of the currency, feasible now because there is slack in the currency (the current number is below the cap). As the cap becomes a binding constraint, the rewards from miners have to come from transactions costs and serious thought has to go into currency design to keep these costs low. Hand waving and claiming that technological advances will allow this happen are not enough. I know that there are many in the crypto currency world who recognize this challenge, but for the moment, their voices are being drowned out by traders in the currency and that is not a good sign.
If you expected a valuation of bitcoin or ether in this post, you are probably disappointed by it, but here is a simple metric that you could use to determine whether the prices for crypto currencies are "fair". Currencies are priced relative to each other (exchange rates) and there is no reason why the rules that apply to fiat currencies cannot be extended to crypto currencies. A fair exchange rate between two fiat currencies will be on that equalizes their purchasing power, an old, imperfect and powerful theorem. Consequently, the question that you would need to address, if you are paying $2,775 for a bitcoin on August 1, 2017, is whether you can (or even will be able to) but $2,775 worth of goods and services with that bitcoin. If you believe that bitcoin will eventually get wide acceptance as a digital currency, you may be able to justify that price, especially because there is a hard cap on bitcoin, but if you don't believe that bitcoin will ever acquire wide acceptance in transactions, it is time that you were honest with yourself and recognized that is just a lucrative, but dangerous, pricing game with no good ending.
Conclusion
Crypto currencies, with bitcoin and ether leading the pack, have succeeded in financial markets by attracting investors, and in the public discourse by garnering attention, but they have not succeeded (yet) as currencies. I believe that there will be one or more digital currencies competing with fiat currencies for transactions, sooner rather than later, but I am hard pressed to find a winner on the current list, right now, but that could change if the proponents and designers of one of the currencies starts thinking less about it as a speculative asset and more as a transaction medium, and acting accordingly. If that does not happen, we will have to wait for a fresh entrant and the most enduring part of this phase in markets may be the block chain and not the currencies themselves.
YouTube Video
The Market BoomAny discussion of crypto currencies has to start with the recognition that the experiment is still young. Satoshi Nakamoto's paper on bitcoin was made public in October 2008 and implemented as open source in January 2009. Less than ten years later, the market capitalization of bitcoin alone is in excess of $40 billion and the success story, at least in terms of bitcoin as an investment, can be seen in the graph below:

The initial rise could have been a flash in the pan, a fad attracting speculators, but in the last two years, Bitcoin seems to have found new fans, as can be seen below:

Bitcoin's success, at least in the financial markets, has attracted a host of competitors, with Ethereum (Ether) being the most successful. Ether's rise in market price, since its introduction in 2015 has been even more precipitous that Bitcoin's, though it has pulled back in recent weeks:
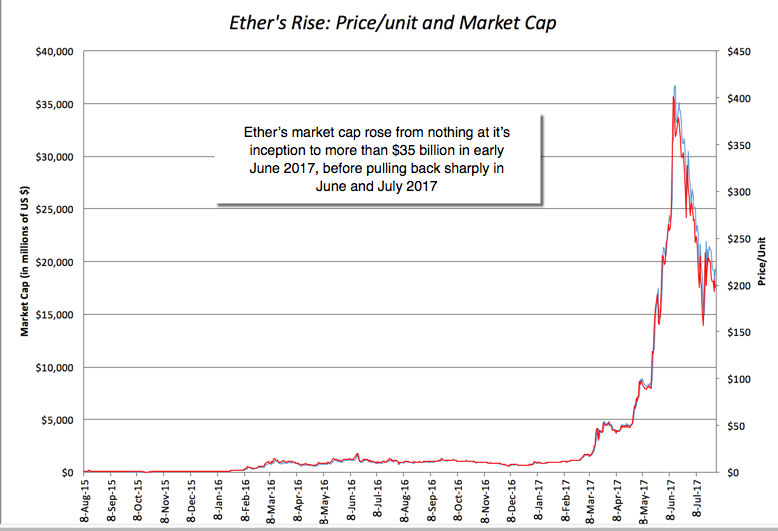
The list of crypto currencies gets added to, by the day, with a complete list available here, with the market caps of each (in US dollars) listed. At least from a market perspective, there is no doubting the fact that crypto currencies have arrived, and enriched a lot of people along the way.
The Mechanics
While the crypto currencies emphasize their differences, the most successful ones share a base architecture, the block chain. A block chain is a shared digital ledger of transactions in an asset where the validation of transactions is decentralized. I know that sounds mystical, but the picture below (using bitcoin to illustrate) should provide a better sense of what's involved:
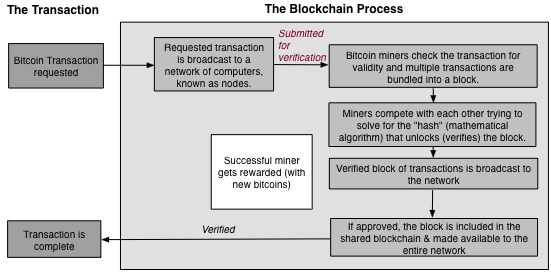
The key features of a block chain are:
Decentralized verification: The validation and verification of a transaction is sourced to members, called miners in the crypto currency world. Verification usually involves trying different algorithms (hashes) to find the unique one that matches the transaction block, and the successful miner is rewarded, currently with the crypto currency. At least, as I understand it, this process requires more brute force (powerful processors trying different algorithms before you find a match) than intellectual firepower.Complete and open records: Every transaction, once validated and verified, is converted into a block of data that is recorded in the block chain ledger, which is accessible to everyone in the network. If you are worried about privacy, the transaction records do not include personal data but take the form of encrypted data (hashes).Incorruptible: A block chain, once recorded and shared, cannot be changed since those changes are visible to everyone in the network and are quickly tagged as fraudulent. Thus, the ledger, once created, becomes almost incorruptible.In effect, a block chain is a digital intermediation process where transactions are checked by members of the network, and recorded, and once that is done, cannot be altered fraudulently. As you can see from its description, the block chain technology is about far more than crypto currencies. It can be used to record transactions in any asset, from securities in financial markets to physical assets like houses, and do so in a way that replaces the existing intermediaries with decentralized models. It should come as no surprise that banks and stock exchanges, which make the bulk of their money from intermediation, not only see block chains as a threat to their existence but have been early investors in the technology, hoping to co-opt it to their own needs.
The Currency Question
If you define success as a rise in market capitalization and popular interest, crypto currencies have clearly succeeded, perhaps more quickly than its original proponents ever expected it to. But the long term success of any crypto currency has to answer a different question, which is whether it is a "good" currency. Harking back to Money 101, you measure a currency's standing by looking at how well it delivers on its three purposes:Unit of account: A key role for a currency is to operate as a unit of account, allowing you to value not just assets and liabilities, but also goods and services. To be effective as a unit of account, a currency has to be fungible (one unit of the currency is identical to any other unit), divisible and countable. Medium of exchange: Currencies exist to make transactions possible, and this is best accomplished if the currency in question is easily accessible and transportable, and is accepted by buyers and sellers as legal tender. The latter will occur only if people trust that the currency will maintain its value and if transactions costs are low.Store of value: To the extent that you hold some or all of your wealth in a currency, you want to feel secure about leaving it in that currency, knowing that it will not lose its buying power while stored. Given these requirements, you can see why there are no perfect currencies and why every currency has to measured on a continuum from good to bad. Broadly speaking, currencies can take one of three forms, a physical asset (gold, silver, diamonds, shells), a fiat currency (usually taking the form of paper and coins, backed by a government) and crypto currencies. Gold's long tenure as a currency can be attributed to its strength as a store of value, arising from its natural scarcity and durability, though it falls short of fiat currencies, in terms of convenience and acceptance, both as a unit of account and as medium of exchanges. Fiat currencies are backed by sovereign governments and consequently can vary in quality as currencies, depending upon the trust that we have in the issuing governments. Without trust, fiat currency is just paper, and there are some fiat currencies where that paper can become close to worthless. For crypto currencies, the question then becomes how well they deliver on each of the purposes. As units of account, there is no reason to doubt that they can function, since they are fungible, divisible and countable. The weakest link in crypto currencies has been their failure to make deeper inroads as mediums of exchange or as stores of value. Using Bitcoin, to illustrate, it is disappointing that so few retailers still accept it as payment for goods and services. Even the much hyped successes, such as Overstock and Microsoft accepting Bitcoin is illusory, since they do so on limited items, and only with an intermediary who converts the bitcoin into US dollars for them . I certainly would not embark on a long or short trip away from home today, with just bitcoins in my pocket, nor would I be willing to convert all of my liquid savings into bitcoin or any other crypto currency. Would you?
So, why has crypto currency not seen wider acceptance in transactions? There are a few reasons, some of which are more benign than others:
Inertia: Fiat currencies have a had a long run, and it is not surprising that for many people, currency is physical and takes the form of government issued paper and coins. While people may use credit cards and Apple Pay, their thinking is still framed by the past, and it may take a while, especially for older consumers and retailers, to accept a digital currency. That said, the speed with which consumers have adapted to ride sharing services and taken to social media suggests that inertia cannot be the dominant reason holding back the acceptance of crypto currencies.Price volatility: Crypto currencies have seen and continue to see wild swings in prices, not a bad characteristic in a traded asset but definitely not a good one in a currency. A retailer or service provider who prices his or her goods and services in bitcoin will constantly have to reset the price and consumers have little certitude of how much the bitcoin in their wallers will buy a few hours from now.Competing crypto currencies: The crypto currency game is still young and the competing players each claim to have found the "magic bullet" for eventual acceptance. As technologies and tastes evolve, you will see a thinning of the herd, where buyers and sellers will pick winners, perhaps from the current list or maybe something new. It is possible that until this happens, transactors will hold up, for fear of backing the wrong horse in the race.Ultimately, though, I lay some of the blame on the creators of the crypto currencies, for their failure, at least so far, on the transactions front. As I look at the design and listen to the debate about the future of crypto currencies, it seems to me that the focus on marketing crypto currencies has not been on transactors, but on traders in the currency, and it remains an unpleasant reality that what makes crypto currencies so attractive to traders (the wild swings in price, the unpredictability, the excitement) make them unacceptable to transactors.
The Disconnect
You can see the disconnect in how crypto currencies have been greeted, by contrasting the rousing reception that markets have given them with the arms length at which they have been held by merchandisers and consumers. In the graph below, I focus on the divergence between the market price rise of bitcoin and the increase in the number of transactions involving bitcoin:
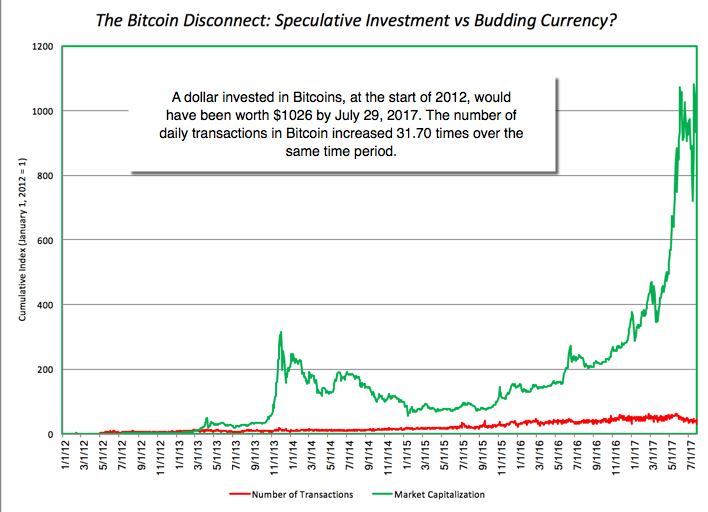
While the price of bitcoin has increase more than a thousand fold, since the start of 2012, the number of transactions involving bitcoin was only about thirty two times larger in July 2017 than what it was at the start of 2012. In my view, there are three possible explanations for the divergence, and they are not mutually exclusive:
Markets are forward looking: If you are a believer in crypto currencies, the most optimistic explanation is that markets are forward looking and that the rise in the prices of Bitcoin and Ether reflects market expectations that they will succeed as currencies, if not right away, in the near future. Speculative asset: I am second to none in having faith in markets, but there is a simpler and perhaps better explanation for the frenzied price movements in crypto currencies. I have long drawn a distinction between the value game (where you try to attach a value to an asset based upon fundamentals) and the pricing game, where mood and momentum drive the process. I would argue, based upon my limited observations of the crypto currency markets, that these are pure pricing games, where fundamentals have been long since forgotten. If you don't believe me, visit one of the forums where traders in these markets converse and take note of how little talk there is about fundamentals and how much there is about trading indicators.Loss of trust in centralized authorities (governments & central banks): There can be no denying that the creators of Bitcoin and Ether were trying to draw as much inspiration for their design from gold, as they were from fiat currencies. Thus, you have miners in crypto currency markets who do their own version of prospecting when validating transactions and are rewarded with the currency in question. For ages, gold has held a special place in the currency continuum, often being the asset of last resort for people who have lost faith in fiat currencies, either because they don't trust the governments backing them or because of debasement (high inflation). While gold will continue to play this role, I believe that for some people (especially younger and more technologically inclined), bitcoin and ether are playing the same role. As surveys continue to show depleting trust in centralized authorities (governments and central banks), you may see more money flow into crypto currencies. The analogy between gold and crypto currency has one weak link. Gold has held its value through the centuries and is a physical asset. For better or worse, it is unlikely that we will decide a few years from now that gold is worthless. A crypto currency that few people use as currency ultimately will not be able to sustain itself, as shiner and newer versions of it pop up. Ironically, if traders in bitcoin and ether want their investments in the crypto currencies to hold their value, the currencies have to become less exciting and lucrative as investments, and become more accepted as currencies. Since that will not happen by accident, I would suggest that the winning crypto currency or currencies will share the following characteristics;Transaction, not trading, talk: From creators and proponents of the currency, you will hear less talk about how much money you would make by buying and selling the currency and more on its efficacy in transactions.Transaction, not trading, features: The design of the crypto currency will focus on creating features that make it attractive as a currency (for transactions), not as investments. Thus, if you are going to impose a cap (either rigid like Bitcoin or more flexible, as with other currencies), you need to explain to transactors, not traders, why the cap makes sense. Trust in something: I know that we live in an age where trust is a scarce resource and I argued that that the growth in crypto currencies can be attributed, at least partly, to this loss of trust. That said, to be effective as a currency, you do need to be able to trust in something and perhaps accept compromises on privacy and centralized authority (at least on some dimensions of the currency). It is also worth noting that the real tests for crypto currencies will occur when they reach their caps (fixed or flexible). After all, bitcoin and ether miners have been willing to put in the effort to validate transactions because they are rewarded with issues of the currency, feasible now because there is slack in the currency (the current number is below the cap). As the cap becomes a binding constraint, the rewards from miners have to come from transactions costs and serious thought has to go into currency design to keep these costs low. Hand waving and claiming that technological advances will allow this happen are not enough. I know that there are many in the crypto currency world who recognize this challenge, but for the moment, their voices are being drowned out by traders in the currency and that is not a good sign.
If you expected a valuation of bitcoin or ether in this post, you are probably disappointed by it, but here is a simple metric that you could use to determine whether the prices for crypto currencies are "fair". Currencies are priced relative to each other (exchange rates) and there is no reason why the rules that apply to fiat currencies cannot be extended to crypto currencies. A fair exchange rate between two fiat currencies will be on that equalizes their purchasing power, an old, imperfect and powerful theorem. Consequently, the question that you would need to address, if you are paying $2,775 for a bitcoin on August 1, 2017, is whether you can (or even will be able to) but $2,775 worth of goods and services with that bitcoin. If you believe that bitcoin will eventually get wide acceptance as a digital currency, you may be able to justify that price, especially because there is a hard cap on bitcoin, but if you don't believe that bitcoin will ever acquire wide acceptance in transactions, it is time that you were honest with yourself and recognized that is just a lucrative, but dangerous, pricing game with no good ending.
Conclusion
Crypto currencies, with bitcoin and ether leading the pack, have succeeded in financial markets by attracting investors, and in the public discourse by garnering attention, but they have not succeeded (yet) as currencies. I believe that there will be one or more digital currencies competing with fiat currencies for transactions, sooner rather than later, but I am hard pressed to find a winner on the current list, right now, but that could change if the proponents and designers of one of the currencies starts thinking less about it as a speculative asset and more as a transaction medium, and acting accordingly. If that does not happen, we will have to wait for a fresh entrant and the most enduring part of this phase in markets may be the block chain and not the currencies themselves.
YouTube Video
Aswath Damodaran's Blog

- Aswath Damodaran's profile
- 725 followers
Aswath Damodaran isn't a Goodreads Author
(yet),
but they
do have a blog,
so here are some recent posts imported from
their feed.

