
Aswath Damodaran's Blog, page 19
May 29, 2018
User and Subscriber Businesses: The Good, the Bad and the Ugly!
In a series of posts over the course of the last year, I argued that you can value users and subscribers at businesses, using first principles in valuation, and have used the approach to value Uber riders, Amazon Prime members and Spotify & Netflix subscribers. With each iteration, I have learned a few things about user value and ways of distinguishing between user bases that can create substantial value from user bases that not only are incapable of creating value but can actively destroy it. I was reminded of these principles this week, first as I wrote about Walmart's $16 billion bid for 77% of Flipkart, a deal at least partially motivated by shopper numbers, then again as I read a news story about MoviePass and the potential demise of its "too good to be true" model, and finally as I tripped over a LimeBike on my walk home.
User Based ValueMy attempt to build a user-based valuation model was triggered by a comment that I got on a valuation that I had done of Uber about a year ago on my blog. In that post, I approached Uber, as I would any other business, and valued it, based upon aggregated revenues, earnings and cash flows, discounted back at a company-wide cost of capital. I was taken to task for applying an old-economy valuation approach to a new-economy company and was told that that the companies of today derive their value from customers, users and subscribers. While my initial response was that you cannot pay dividends with users, I realized that there was a core truth to the critique and that companies are increasingly building their businesses around their members.
Consequently, I went back to valuation first principles, where the value of any asset is a function of its cashflows, growth and risks, and adapted that approach to valuing a user or subscriber: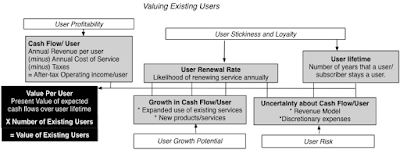
To get from the value of existing users to the value of an entire company, I incorporated the value effect of new users, bringing in the cost of acquiring a new user into the value: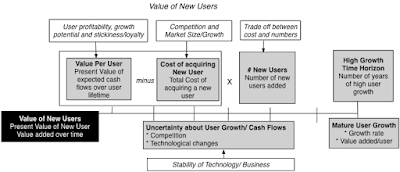
I applied closure by consider all corporate costs that are not directly related to users or subscribers in a corporate cost drag, a drag because it reduces the value of the business: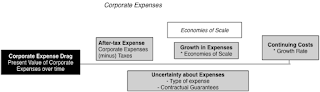 Cumulating the value of existing and new users, and netting out the corporate cost drag yields the value of operating assets, i.e., the same value that you would derive by discounting the free cash flows to the entire business by its overall cost of capital. You would still need to clean up, by adding in cash, netting out debt and dealing with outstanding options, but that process is the same in both models.
I would hasten to add that a user-based value model is not a panacea to any of the valuation challenges that we face with young, user-based companies. In fact, the difficulties with obtaining the raw data needed on user renewal rates and acquisition costs can be so daunting that any potential advantages that you obtain by looking at user-level value can be drowned out by noise. It is also worth emphasizing that its user-focus notwithstanding, this model is grounded in fundamentals, with value coming, as it always does, from cash flows, growth and risk. I am still learning about this model, but I have put down what I have learned over the last year, when valuing Uber, Amazon Prime and Netflix, into a paper that you can download, read and critique.
Good, Bad and Indifferent User-based ModelsOne of the motivations for my user-focused valuation was based upon casual empiricism. In my view, many venture capitalists and public investors are pricing user-based companies on user count, with only a few seriously trying to distinguish between good, indifferent and bad user-based models. One of the bonuses of using a user-based model is that it provides a framework for differentiating between great and mediocre user-based companies.
Drivers of Value A standard critique that old-time value investors have of user-based companies is that they all lose money, but that is not true. There are user-based companies that make money, but it is also true that the user-based model is still in its infancy and that many user-based companies are young, and therefore lose money. That said, there are elements of the cost structure that you can look at, to make judgments on which user-based companies are most likely to grow out of their problems and which ones are just going to grow their problems.
a. Cost Structure: Most young, user-based companies lose money but at the risk of sounding unbalanced, there are good ways to lose money and bad ones, from a value perspective. Servicing Existing Users versus New User Acquisition: From a value perspective, it is far better for a company to be losing money, because it is spending money trying to acquire new users, than it is to be losing money, because it costs so much to service existing users. The latter signals a bad business model, at least for the moment, whereas the former offers a semblance of hope.Fixed versus Variable Costs: For mature companies with established business models, it is better to have a more flexible cost structure (with more variable costs and less fixed costs). With money-losing, high-growth companies, the reverse is true, since it is the fixed cost portion that yields economies of scale, as the company grows.b. Growth: Repeating a value nostrum, growth is not always value-creating and not all growth is created equal.Existing versus New Users: A user-based model, where you can grow cash flows from existing users is more valuable, other things remaining equal, than a user-based model that is dependent on adding new users for growth. The reason is simple. Since a company already has expended resources to get existing users, any added revenue it derives from them is more likely to flow directly to the bottom line. Adding new users is more expensive, partly because it costs money to acquire them, but also because new users may not be as active or lucrative as existing ones.Cost of New User Acquisition: This is a corollary of the first proposition, since the value of a new user is net of user acquisition costs. Consequently, user-based companies that are more cost-efficient in adding new users will be worth more than user-based companies that spend considerable amounts on promotion on marketing, to the same end. This contrast is best illustrated by looking at Netflix and Spotify, both subscriber-based companies, but with very different models for paying for content. Netflix pays for content as a fixed cost, and derives economies of scale, when it adds fresh subscribers, whereas Spotify pays for content, based upon how much subscribers listen to songs, making it a variable and existing user based cost. As a result, Netflix derives much higher value from both existing and new subscribers:
NetflixSpotifyNumber of Subscribers117.671Annual Revenue/Subscriber $ 113.16 $ 77.63 Subscriber Service Expenses (as %)18.90%79.24%CAGR in subscriber count223.93%369.86%
Value per Existing Subscriber $ 508.89 $ 108.65 Cost of acquiring New Subscriber $ 111.01 $ 27.30 Value per New Subscriber $ 397.88 $ 81.35 Value of all Existing Subscribers $ 59,845.86 $ 7,714.28 Value of all New Subscribers $ 137,276.49 $ 20,764.56 - Corporate Cost Drag $ 111,251.70 $ 13,139.75 =Value of Operating Assets $ 85,870.65 $ 15,339.10
c. Revenue Models: There are three user-based models, the first is the subscription-based model (that Netflix uses), the second is the advertising-based model (that Yelp uses) and the third is a transaction-based model (that Uber uses). There are companies that use hybrid versions, with Amazon Prime (membership fees and incremental sales) and Spotify (Subscription plus Advertising) being good examples. Each model comes with its pluses and minuses. Subscription models tend to be stickier (making revenues more predictable) but they offer less upside potential (it is difficult to grow subscription fees at high rates).Advertising models scale up faster, since they require little in capital investment and adding new users is easier (since they free), but revenues are heavily driven by user intensity (how much time you can get users to stay in your ecosystem) and exclusive data (collected in the course of usage).Transaction models are the riskiest, since they require users to use your product or service, but they also offer the most upside, since your upside is less constrained. Amazon Prime's value, in my view, does not stem primarily from the subscription revenues of $99/year but from Amazon's capacity to sell Prime members more products and services.While no model dominates, picking the wrong revenue model can quickly handicap a business. For instance, using a subscription-based model for a transaction business, where usage varies widely across users, can result in self-selection, where the most intense users choose the subscription-based model to save money, and less intense users stay with a transaction-based model.
Differentiating across User-based ModelsWith the user-based framework in place, we can start distinguishing between user-based companies. Using existing user value and new customer acquisition costs as the dimensions, we can derive a matrix of companies that go from user-value stars to user-value dogs.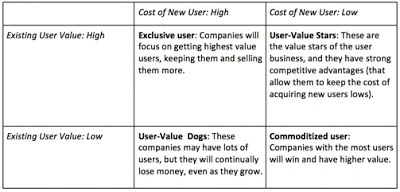
While the combination of high user value with low user acquisition costs may sound like a pipe dream, it is what network benefits and big data, if they exist, promise to deliver. Network benefits refer to the possibility that as you grow bigger, it becomes easier for you to get even bigger, making it less costly to acquire new users. That is the promise of ride sharing, for instance, where as a company gets a larger share of a ride sharing market, both drivers and customers are more likely to switch to it, the former, because they get more customers and the latter, because they find rides more quickly.Big data, in a value framework, offers user-based companies an advantage, since what you learn about your users can be used to either sell them more products or services (if you are a transaction-based company), charge them higher premiums (if you are subscription-based) or direct advertising more effectively (if advertising-based). Many user-based companies aspire to have network benefits and to use data well, but only a few succeed.
The Pricing Game
As I look at user-based companies, some of which are being priced at billions of dollars, I am struck by how few of them are built to be long term businesses and how many of them are being priced on user numbers and buzz words. Using the framework from the last section, I would like to develop some common features that bad user-businesses seems to share in common and use one high profile examples, MoviePass , to make my case.
Mediocre User-based Companies
Given that so many young companies market themselves, based upon user and subscriber numbers, and that some of them can become valuable companies, are there signs that you can look for that separate the good from the mediocre companies? I think so, and here are a few red flags:
All about users, all the time: If the entire sales pitch that a company makes to investors is about its user or subscriber numbers, rather than its operating results (revenues and operating profits/losses), it is a dangerous sign. While large user numbers are a positive, it requires a business model to convert these users into revenues and profits, and that business model will not develop spontaneously. Companies that do not work on developing viable business models go bankrupt with lots of users.Opacity about user data: It is ironic that companies that market themselves to investors, based upon user numbers, are often opaque about key dimensions on users, including renewal (churn) rates, user behavior and side costs related to users. The companies that are most opaque are often the ones that have user models that are not sustainable.Bad business models: If having no business model to convert users to operating results is a bad sign, it is an even worse sign when you have a business model that is designed to deliver losses, not only in its current form, but with no light at the end of the tunnel. That is usually the consequence of having losses that scale up as the company gets bigger, because there are economies of scale. Loose talk about data: The fall back for many user based companies that cannot defend their business models is that they will find a way to use the data that they will collect from their users to make money in the future (from targeted advertising or additional products and services), without any serious attempt to explain why the data will give them an edge.And externalities: Many user based companies argue that their "innovative" twists on an existing business will both expand and alter the business, leading to benefits for other players in that business, who, in turn, will share their benefits with the user based companies.The bottom line is simple. It is easy to build user numbers, if you sell a product or service at way below cost, but if your objective is build a long-standing user-based companies, you need a pathway to profitability that is defined early and worked on continuously.
MoviePass: Too Good to be True? If you subscribe to MoviePass, for a monthly subscription of $10, you get to watch one theatrical movie, every day, for the entire month. Given that the average price of a theater ticket in the US is $9, this sounds like an insanely good deal, and for an avid movie goer, it is, and the service had two million subscribers in May 2018. MoviePass, though, pays the theaters for the tickets, creating a model that is more designed to drive it into bankruptcy than to deliver profits.
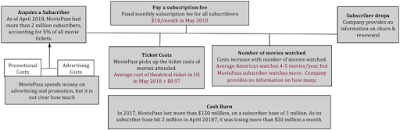 MoviePass EconomicsWhen confronted by the insanity of the business model, Mitch Lowe, the CEO of MoviePass, argued that after an initial burst, where subscribers would see four or five movies a month, they would settle into watching a movie a month, allowing the service to break even. Since Mr. Lowe is a co-founder of Netflix and a former CEO of Redbox, I will concede that he knows a lot more about the movie business than I do, but this is an absurd rationale. If the only way that your service can become viable is if people don't use it very much, it is not much of a service to begin with.
In its early days, MoviePass seemed to be trying to build a viable business model, and acquired some high profile venture capital investors, but it was eventually acquired by Helios and Matheson, a data analytics firm, in a transaction in August 2017. It is Helios and Matheson, intent on giving both data and analysis a bad name, that instituted the $10 a month for a movie-a-day subscription. The subscription worked in delivering users but it, not surprisingly, came with large losses. As MoviePass has continued to burn cash (more than $20 million a month by April 2018), the share price of Helios and Matheson has collapsed, in a belated recognition of its non-viable business model.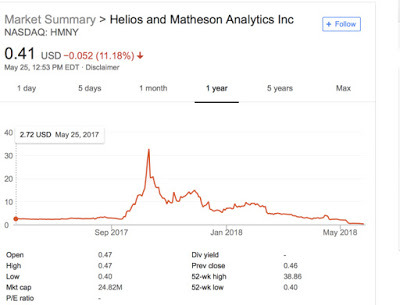
Adding to the sense that no one in this company has a grip on reality, Ted Farnsworth, the CEO of Helios and Matheson, argued that the service would continue and had acquired a $300 million line of credit. Since his backing for this line of credit was that he could issue the remaining authorized shares at the current market price, this indicates either extreme ignorance (potential equity issues don't comprise a line of credit) or unalloyed deception, neither of which is a quality that builds trust. Along the way, there have been other attempts to rationalize the model, including the possibility of using the data collected from subscribers to target advertising and the sharing of additional revenues generated by theaters and studios from more movie going. There is nothing exclusive about the data that will be collected from MoviePass subscribers and it is unlikely that theaters and small studios, already on the brink financially, will be willing to share their revenues. In short, this is a bad business model hurtling to a bad end, and the only question is why it took so long.
The Bottom LineTo build a good user-based business, you have to start with the common sense recognition that users are not the end game, but a means to an end. Unfortunately, as long as venture capitalists and investors reward companies with high pricing, based just upon user count, we will encourage the building of bad businesses with lots of users and no pathways to becoming successful businesses.
YouTube Video
Paper on User Based Value
Going to Pieces: Valuing Users, Subscribers and CustomersBlog Posts on User-based Value
Valuing Uber RidersValuing Amazon Prime MembersValuing Spotify SubscribersValuing Netflix Subscribers
User Based ValueMy attempt to build a user-based valuation model was triggered by a comment that I got on a valuation that I had done of Uber about a year ago on my blog. In that post, I approached Uber, as I would any other business, and valued it, based upon aggregated revenues, earnings and cash flows, discounted back at a company-wide cost of capital. I was taken to task for applying an old-economy valuation approach to a new-economy company and was told that that the companies of today derive their value from customers, users and subscribers. While my initial response was that you cannot pay dividends with users, I realized that there was a core truth to the critique and that companies are increasingly building their businesses around their members.
Consequently, I went back to valuation first principles, where the value of any asset is a function of its cashflows, growth and risks, and adapted that approach to valuing a user or subscriber:

To get from the value of existing users to the value of an entire company, I incorporated the value effect of new users, bringing in the cost of acquiring a new user into the value:

I applied closure by consider all corporate costs that are not directly related to users or subscribers in a corporate cost drag, a drag because it reduces the value of the business:
 Cumulating the value of existing and new users, and netting out the corporate cost drag yields the value of operating assets, i.e., the same value that you would derive by discounting the free cash flows to the entire business by its overall cost of capital. You would still need to clean up, by adding in cash, netting out debt and dealing with outstanding options, but that process is the same in both models.
I would hasten to add that a user-based value model is not a panacea to any of the valuation challenges that we face with young, user-based companies. In fact, the difficulties with obtaining the raw data needed on user renewal rates and acquisition costs can be so daunting that any potential advantages that you obtain by looking at user-level value can be drowned out by noise. It is also worth emphasizing that its user-focus notwithstanding, this model is grounded in fundamentals, with value coming, as it always does, from cash flows, growth and risk. I am still learning about this model, but I have put down what I have learned over the last year, when valuing Uber, Amazon Prime and Netflix, into a paper that you can download, read and critique.
Good, Bad and Indifferent User-based ModelsOne of the motivations for my user-focused valuation was based upon casual empiricism. In my view, many venture capitalists and public investors are pricing user-based companies on user count, with only a few seriously trying to distinguish between good, indifferent and bad user-based models. One of the bonuses of using a user-based model is that it provides a framework for differentiating between great and mediocre user-based companies.
Drivers of Value A standard critique that old-time value investors have of user-based companies is that they all lose money, but that is not true. There are user-based companies that make money, but it is also true that the user-based model is still in its infancy and that many user-based companies are young, and therefore lose money. That said, there are elements of the cost structure that you can look at, to make judgments on which user-based companies are most likely to grow out of their problems and which ones are just going to grow their problems.
a. Cost Structure: Most young, user-based companies lose money but at the risk of sounding unbalanced, there are good ways to lose money and bad ones, from a value perspective. Servicing Existing Users versus New User Acquisition: From a value perspective, it is far better for a company to be losing money, because it is spending money trying to acquire new users, than it is to be losing money, because it costs so much to service existing users. The latter signals a bad business model, at least for the moment, whereas the former offers a semblance of hope.Fixed versus Variable Costs: For mature companies with established business models, it is better to have a more flexible cost structure (with more variable costs and less fixed costs). With money-losing, high-growth companies, the reverse is true, since it is the fixed cost portion that yields economies of scale, as the company grows.b. Growth: Repeating a value nostrum, growth is not always value-creating and not all growth is created equal.Existing versus New Users: A user-based model, where you can grow cash flows from existing users is more valuable, other things remaining equal, than a user-based model that is dependent on adding new users for growth. The reason is simple. Since a company already has expended resources to get existing users, any added revenue it derives from them is more likely to flow directly to the bottom line. Adding new users is more expensive, partly because it costs money to acquire them, but also because new users may not be as active or lucrative as existing ones.Cost of New User Acquisition: This is a corollary of the first proposition, since the value of a new user is net of user acquisition costs. Consequently, user-based companies that are more cost-efficient in adding new users will be worth more than user-based companies that spend considerable amounts on promotion on marketing, to the same end. This contrast is best illustrated by looking at Netflix and Spotify, both subscriber-based companies, but with very different models for paying for content. Netflix pays for content as a fixed cost, and derives economies of scale, when it adds fresh subscribers, whereas Spotify pays for content, based upon how much subscribers listen to songs, making it a variable and existing user based cost. As a result, Netflix derives much higher value from both existing and new subscribers:
NetflixSpotifyNumber of Subscribers117.671Annual Revenue/Subscriber $ 113.16 $ 77.63 Subscriber Service Expenses (as %)18.90%79.24%CAGR in subscriber count223.93%369.86%
Value per Existing Subscriber $ 508.89 $ 108.65 Cost of acquiring New Subscriber $ 111.01 $ 27.30 Value per New Subscriber $ 397.88 $ 81.35 Value of all Existing Subscribers $ 59,845.86 $ 7,714.28 Value of all New Subscribers $ 137,276.49 $ 20,764.56 - Corporate Cost Drag $ 111,251.70 $ 13,139.75 =Value of Operating Assets $ 85,870.65 $ 15,339.10
c. Revenue Models: There are three user-based models, the first is the subscription-based model (that Netflix uses), the second is the advertising-based model (that Yelp uses) and the third is a transaction-based model (that Uber uses). There are companies that use hybrid versions, with Amazon Prime (membership fees and incremental sales) and Spotify (Subscription plus Advertising) being good examples. Each model comes with its pluses and minuses. Subscription models tend to be stickier (making revenues more predictable) but they offer less upside potential (it is difficult to grow subscription fees at high rates).Advertising models scale up faster, since they require little in capital investment and adding new users is easier (since they free), but revenues are heavily driven by user intensity (how much time you can get users to stay in your ecosystem) and exclusive data (collected in the course of usage).Transaction models are the riskiest, since they require users to use your product or service, but they also offer the most upside, since your upside is less constrained. Amazon Prime's value, in my view, does not stem primarily from the subscription revenues of $99/year but from Amazon's capacity to sell Prime members more products and services.While no model dominates, picking the wrong revenue model can quickly handicap a business. For instance, using a subscription-based model for a transaction business, where usage varies widely across users, can result in self-selection, where the most intense users choose the subscription-based model to save money, and less intense users stay with a transaction-based model.
Differentiating across User-based ModelsWith the user-based framework in place, we can start distinguishing between user-based companies. Using existing user value and new customer acquisition costs as the dimensions, we can derive a matrix of companies that go from user-value stars to user-value dogs.

While the combination of high user value with low user acquisition costs may sound like a pipe dream, it is what network benefits and big data, if they exist, promise to deliver. Network benefits refer to the possibility that as you grow bigger, it becomes easier for you to get even bigger, making it less costly to acquire new users. That is the promise of ride sharing, for instance, where as a company gets a larger share of a ride sharing market, both drivers and customers are more likely to switch to it, the former, because they get more customers and the latter, because they find rides more quickly.Big data, in a value framework, offers user-based companies an advantage, since what you learn about your users can be used to either sell them more products or services (if you are a transaction-based company), charge them higher premiums (if you are subscription-based) or direct advertising more effectively (if advertising-based). Many user-based companies aspire to have network benefits and to use data well, but only a few succeed.
The Pricing Game
As I look at user-based companies, some of which are being priced at billions of dollars, I am struck by how few of them are built to be long term businesses and how many of them are being priced on user numbers and buzz words. Using the framework from the last section, I would like to develop some common features that bad user-businesses seems to share in common and use one high profile examples, MoviePass , to make my case.
Mediocre User-based Companies
Given that so many young companies market themselves, based upon user and subscriber numbers, and that some of them can become valuable companies, are there signs that you can look for that separate the good from the mediocre companies? I think so, and here are a few red flags:
All about users, all the time: If the entire sales pitch that a company makes to investors is about its user or subscriber numbers, rather than its operating results (revenues and operating profits/losses), it is a dangerous sign. While large user numbers are a positive, it requires a business model to convert these users into revenues and profits, and that business model will not develop spontaneously. Companies that do not work on developing viable business models go bankrupt with lots of users.Opacity about user data: It is ironic that companies that market themselves to investors, based upon user numbers, are often opaque about key dimensions on users, including renewal (churn) rates, user behavior and side costs related to users. The companies that are most opaque are often the ones that have user models that are not sustainable.Bad business models: If having no business model to convert users to operating results is a bad sign, it is an even worse sign when you have a business model that is designed to deliver losses, not only in its current form, but with no light at the end of the tunnel. That is usually the consequence of having losses that scale up as the company gets bigger, because there are economies of scale. Loose talk about data: The fall back for many user based companies that cannot defend their business models is that they will find a way to use the data that they will collect from their users to make money in the future (from targeted advertising or additional products and services), without any serious attempt to explain why the data will give them an edge.And externalities: Many user based companies argue that their "innovative" twists on an existing business will both expand and alter the business, leading to benefits for other players in that business, who, in turn, will share their benefits with the user based companies.The bottom line is simple. It is easy to build user numbers, if you sell a product or service at way below cost, but if your objective is build a long-standing user-based companies, you need a pathway to profitability that is defined early and worked on continuously.
MoviePass: Too Good to be True? If you subscribe to MoviePass, for a monthly subscription of $10, you get to watch one theatrical movie, every day, for the entire month. Given that the average price of a theater ticket in the US is $9, this sounds like an insanely good deal, and for an avid movie goer, it is, and the service had two million subscribers in May 2018. MoviePass, though, pays the theaters for the tickets, creating a model that is more designed to drive it into bankruptcy than to deliver profits.
 MoviePass EconomicsWhen confronted by the insanity of the business model, Mitch Lowe, the CEO of MoviePass, argued that after an initial burst, where subscribers would see four or five movies a month, they would settle into watching a movie a month, allowing the service to break even. Since Mr. Lowe is a co-founder of Netflix and a former CEO of Redbox, I will concede that he knows a lot more about the movie business than I do, but this is an absurd rationale. If the only way that your service can become viable is if people don't use it very much, it is not much of a service to begin with.
 In its early days, MoviePass seemed to be trying to build a viable business model, and acquired some high profile venture capital investors, but it was eventually acquired by Helios and Matheson, a data analytics firm, in a transaction in August 2017. It is Helios and Matheson, intent on giving both data and analysis a bad name, that instituted the $10 a month for a movie-a-day subscription. The subscription worked in delivering users but it, not surprisingly, came with large losses. As MoviePass has continued to burn cash (more than $20 million a month by April 2018), the share price of Helios and Matheson has collapsed, in a belated recognition of its non-viable business model.

Adding to the sense that no one in this company has a grip on reality, Ted Farnsworth, the CEO of Helios and Matheson, argued that the service would continue and had acquired a $300 million line of credit. Since his backing for this line of credit was that he could issue the remaining authorized shares at the current market price, this indicates either extreme ignorance (potential equity issues don't comprise a line of credit) or unalloyed deception, neither of which is a quality that builds trust. Along the way, there have been other attempts to rationalize the model, including the possibility of using the data collected from subscribers to target advertising and the sharing of additional revenues generated by theaters and studios from more movie going. There is nothing exclusive about the data that will be collected from MoviePass subscribers and it is unlikely that theaters and small studios, already on the brink financially, will be willing to share their revenues. In short, this is a bad business model hurtling to a bad end, and the only question is why it took so long.
The Bottom LineTo build a good user-based business, you have to start with the common sense recognition that users are not the end game, but a means to an end. Unfortunately, as long as venture capitalists and investors reward companies with high pricing, based just upon user count, we will encourage the building of bad businesses with lots of users and no pathways to becoming successful businesses.
YouTube Video
Paper on User Based Value
Going to Pieces: Valuing Users, Subscribers and CustomersBlog Posts on User-based Value
Valuing Uber RidersValuing Amazon Prime MembersValuing Spotify SubscribersValuing Netflix Subscribers


May 22, 2018
Walmart's India (Flipkart) Gambit: Growth Rebirth or Costly Facelift?
On May 9, 2018, Walmart confirmed officially what had been rumored for weeks, and announced that it would pay $16 billion to acquire a 77% stake in Flipkart, an Indian online retail firm, translating into a valuation of more than $21 billion for a firm founded just over ten years ago, with about $10,000 in capital. Investors are debating the what, why and what next on this transaction, with their reactions showing up in a drop in Walmart’s market capitalization of approximately $8 billion. For Indian tech start-ups, the deal looks like the Nirvana that many of them aspire to reach, and this will undoubtedly affirm their hopes that if they build an India presence, there will be large players with deep pockets who will buy them out.
The Players
The place to start, when assessing a merger or an acquisition, is by looking at the companies involved, both acquiring and target, before the deal. It not only provides a baseline for any assessment of benefits, but may provide clues to motives.
a. Flipkart, an Amazon Wannabe?
Of the two players in this deal, we know a lot less about Flipkart than we do about Walmart, because it is not publicly traded, and it provides only snippets of information about itself. That said, we can use that information to draw some conclusions about the company:It has grown quickly: Flipkart was founded in October 2007 by Sachin and Binny Bansal, both ex-Amazon employees and unrelated to each other, with about $6000 in seed capital. The revenues for the company increased from less than $1 million in 2008-09 to $75 million in 2011-12 and accelerated, with multiple acquisitions along the way, to reach $3 billion in 2016-2017. The revenue growth rate in 2016-17 was 29%, down from the 50% revenue growth recorded in the prior fiscal year. Flipkart’s revenues are shown, in Indian rupees, in the graph below: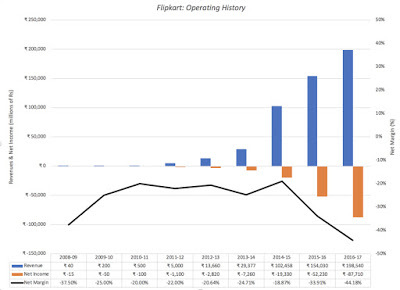 While losing lots of money and burning through cash: As the graph above, not surprisingly, show, Flipkart lost money in its early years, as growth was its priority. More troubling, though, is the fact that the company not only continues to lose money, but that its losses have scaled up with the revenues. In the 2016-17 fiscal year, for instance, the company reported an operating loss of $0.6 billion, giving it an operating margin of minus 40%. The continued losses have resulted in the company burning through much of the $7 billion it has raised in capital over its lifetime from investors. And borrowing money to plug cash flow deficits: Perhaps unwilling to dilute their ownership stake by further seeking equity capital, the founders have borrowed substantial amounts. The costs of financing this debt jumped to $671 million in the 2016-17 fiscal year, pushing overall losses to $1.3 billion. Not only are the finance costs adding to the losses and the cash burn each year, but they put the company’s survival, as a stand-alone company, at risk.It has had issues with governance and transparency along the way: Flipkart has a complex holding structure, with a parent company in Singapore and multiple off shoots, some designed to get around India’s byzantine restrictions on foreign investment and retailing and some reflecting their multiple forays raising venture capital.While the defense that will be offered for the company is that it is still young, the scale of the losses and the dependence on borrowed money would suggest that as a stand-alone business, you would be hard pressed to come up with a justification for a high value for the company and would have serious concerns about survival.
b. Walmart, Aging Giant?
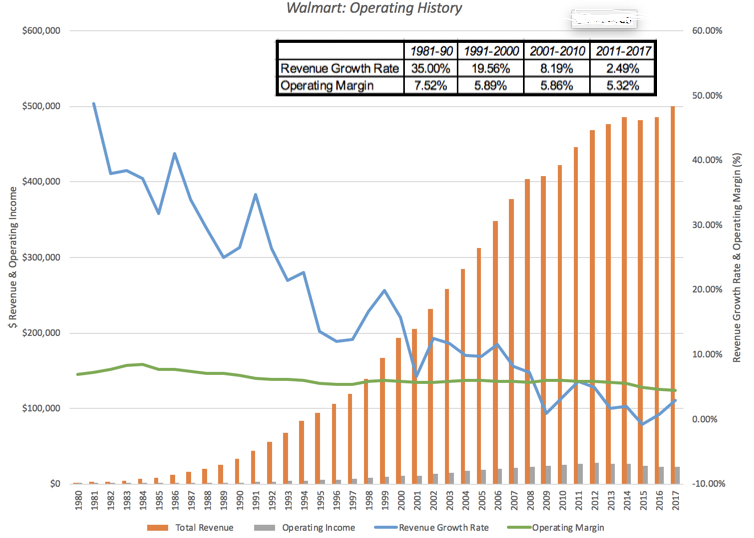
Walmart has been publicly traded for decades and its operating results can be seen in much more detail. Its growth in the 1980s and 1990s from an Arkansas big-box store to a dominant US retailer is captured below:
That operating history includes two decades of stellar growth towards the end of the twentieth century, where Walmart reshaped the retail business in the United States, and the years since, where growth has slowed down and margins have come under pressure. As Walmart stands now, here is what we see:
Growth has slowed to a trickle: Walmart’s growth engine started sputtering more than a decade ago, partly because its revenue base is so overwhelmingly large ($500 billion in 2017) and partly because of saturation in its primary market, which is the United States. And more of it is being acquired: As same store sales growth has leveled off, Walmart has been trying to acquire other companies, with Flipkart just being the most recent (and most expensive) example. But its base business remains big box retailing: While acquiring online retailers like Wayfair and upscale labels like Bonobos represent a change from its original mission, the company still is built around its original models of low price/ high volume and box stores. The margins in that business have been shrinking, albeit gradually, over time.And its global footprint is modest: For much of the last few years, Walmart has seen more than 20% of its revenues come from outside the United States, but that number has not increased over the last few years and a significant portion of the foreign sales come from Mexico and Canada. Looking at the data, it is difficult to see how you can come to any conclusion other than the one that Walmart is not just a mature company, but one that is perhaps on the verge of decline.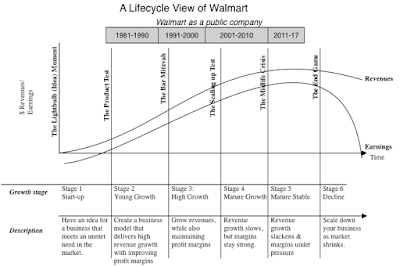
Very few companies age gracefully, with many fighting decline by trying desperately to reinvent themselves, entering new markets and businesses, and trying to acquire growth. A few do succeed and find a new lease on life. If you are a Walmart shareholder, your returns on the company over the next decade will be determined in large part by how it works through the aging process and the Flipkart acquisition is one of the strongest signals that the company does not plan to go into decline, without a fight. That may make for a good movie theme, but it can be very expensive for stockholders.
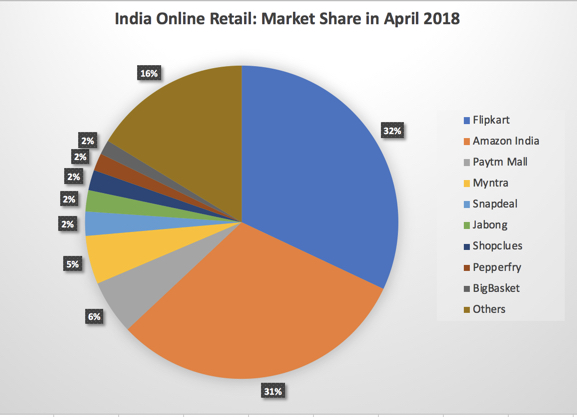
The Common Enemy
Looking at Flipkart and Walmart, it is clear that they are very different companies, at opposite ends of the life cycle. Flipkart is a young company, still struggling with its basic business model, that has proven successful at delivering revenue growth but not profits. Walmart is an aging giant, still profitable but with little growth and margins under pressure. There is one element that they share in common and that is that they are both facing off against perhaps the most feared company in the world, Amazon. a. Amazon versus Flipkart: Over the last few years, Amazon has aggressively pursued growth in India, conceding little to Flipkart, and shown a willingness to prioritize revenues (and market share) over profits: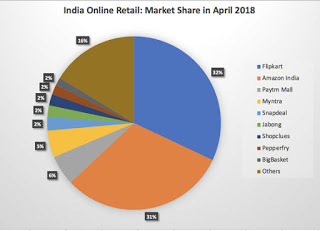 Source: Forrester (through Bloomberg Quint)While Flipkart remains the larger firm, Amazon India has continued to gain market share, almost catching up by April 2018, and more critically, it has contributed to Flipkart’s losses, by being willing to lose money itself. In a prior post, I called Amazon a Field of Dreams company, and argued that patience was built into its DNA and the end game, if Flipkart and Amazon India go head to head is foretold. Flipkart will fold, having run out of cash and capital.b. Amazon versus Walmart: If there is one company in the world that should know how Amazon operates, it has to be Walmart. Over the last twenty years, it has seen Amazon lay waste to the brick and mortar retail business in the United States and while the initial victims may have been department stores and specialty retailers, it is quite clear that Amazon is setting its sights on Walmart and Target, especially after its acquisition of Whole Foods.
It may seem like hyperbole, but a strong argument can be made that while some of Flipkart and Walmart’s problems can be traced to management decision, scaling issues and customer tastes, it is the fear of Amazon that fills their waking moments and drives their decision making.
The Pricing of Flipkart
Walmart is just the latest in a series of high profile investors that Flipkart has attracted over the years. Tiger Global has made multiple investments in the company, starting in 2013, and other international investors have been part of subsequent rounds. The chart below captures the history: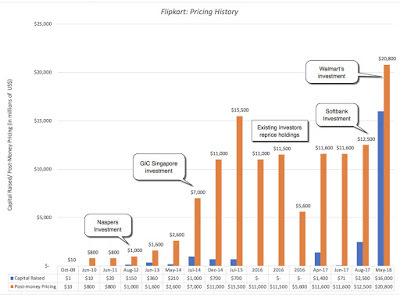 Barring a period between July 2015 and late 2016, where the company was priced down by existing investors, the pricing has risen, with each new capital raise. In April 2017, the company raised $1.4 billion from Microsoft, Tencent and EBay, in an investment round that priced the company at $11 billion, and in August 2017, Softbank invested $2.5 billion in the company, pricing it at closer to $12.5 billion. Walmart’s investment, though, represents a significant jump in the pricing over the last year.
Note that, through this entire section, I have used the word “pricing” and not “valuation”, to describe these VC and private investments, and if you are wondering why, please read this post that I have on the difference between price and value, and why VCs play the pricing game. Why would these venture capitalists, many of whom are old hands at the game, push up the pricing for a company that has not only proved incapable of making money but where there is no light at the end of the tunnel? The answer is simple and cynical. The only justification needed in the pricing game is the expectation that someone will pay a higher price down the road, an expectation that is captured in the use of exit multiples in VC pricing models.
The Why?
So, why did Walmart pay $16 billion for a 70% stake in Flipkart? And will it pay off for the company? There are four possible explanations for the Walmart move and each comes with troubling after thoughts. 1. The Pricing Game: No matter what one thinks of Flipkart’s business model and its valuation, it is true, at least after the Walmart offer, that the game has paid off for earlier entrants. By paying what it did, Walmart has made every investor who entered the pricing chain at Flipkart before it a “success”, vindicating the pricing game, at least for them. If the essence of that game is that you buy at a low price and sell at a higher price, the payoff to playing the pricing game is easiest seen by looking at the Softbank investment made just nine months ago, which has almost doubled in pricing, largely as a consequence of the Walmart deal. In fact, many of the private equity and venture capital firms that became investors in earlier years will be selling their stakes to Walmart, ringing up huge capital gains and moving right along. Is it possible that Walmart is playing the pricing game as well, intending to sell Flipkart to someone else down the road at a higher price? My assessment: Since the company’s stake is overwhelming and it has operating motives, it is difficult to see how Walmart plays the pricing game, or at least plays it to win. There is some talk of investors forcing Walmart to take Flipkart public in a few years, and it is possible that if Walmart is able to bolster Flipkart and make it successful, this exit ramp could open up, but it seems like wishful thinking to me.
2. The Big Market Entrée (Real Options): The Indian retail market is a big one, but for decades it has also proved to be a frustrating one for companies that have tried to enter it for decades. One possible explanation for Walmart’s investment is that they are buying a (very expensive) option to enter a large and potentially lucrative market. The options argument would imply that Walmart can pay a premium over an assessed value for Flipkart, with that premium reflecting the uncertainty and size of the Indian retail market.
My assessment: The size of the Indian retail market, its potential growth and uncertainty about that growth create optionality, but given that Walmart remains a brick and mortar store primarily and that there is multiple paths that can be taken to be in that market, it is not clear that buying Flipkart is a valuable option.
3. Synergy: As with every merger, I am sure that the synergy word will be tossed around, often with wild abandon and generally with nothing to back it up. If the essence of synergy is that a merger will allow the combined entity to take actions (increase growth, lower costs etc.) that the individual entities could not have taken on their own, you would need to think of how acquiring Flipkart will allow Walmart to generate more revenues at its Indian retail stores and conversely, how allowing itself to be acquired by Walmart will make Flipkart grow faster and turn to profitability sooner.
My assessment: Walmart is not a large enough presence in India yet to benefit substantially from the Flipkart acquisition and while Walmart did announce that it would be opening 50 new stores in India, right after the Flipkart deal, I don’t see how owning Flipkart will increase traffic substantially at its brick and mortar stores. At the same time, Walmart has little to offer Flipkart to make it more competitive against Amazon, other than capital to keep it going. In summary, if there is synergy, you have to strain to see it, and it will not be substantial enough or come soon enough to justify the price paid for Flipkart.
4. Defensive Maneuver:Earlier, I noted that both Flipkart and Walmart share a common adversary, Amazon, a competitor masterful at playing the long game. I argued that there is little chance that Flipkart, standing alone, can survive this fight, as capital dries up and existing investors look for exits and that Walmart’s slide into decline in global retailing seems inexorable, as Amazon continues its rise. Given that the Chinese retail market will prove difficult to penetrate, the Indian retail market may be where Walmart makes its stand. Put differently, Walmart’s justification for investing in Flipkart is not they expect to generate a reasonable return on their $16 billion investment but that if they do not make this acquisition, Amazon will be unchecked and that their decline will be more precipitous.
My assessment: Of the four reasons, this, in my view, is the one that best explains the deal. Defensive mergers, though, are a sign of weakness, not strength, and point to a business model under stress. If you are a Walmart shareholder, this is a negative signal and it does not surprise me that Walmart shares have declined in the aftermath. Staying with the life cycle analogy, Walmart is an aging, once-beautiful actress that has paid $16 billion for a very expensive face lift, and like all face lifts, it is only a matter of time before gravity works its magic again.
In summary, I think that the odds are against Walmart on this deal, given what it paid for Flipkart. If the rumors are true that Amazon was interested in buying Flipkart for close to $22 billion, I think that Walmart would have been better served letting Amazon win this battle and fight the local anti-trust enforcers, while playing to its strengths in brick and mortar retailing. I have a sneaking suspicion that Amazon had no intent of ever buying Flipkart and that it has succeeded in goading Walmart into paying way more than it should have to enter the Indian online retail space, where it can expect to lose money for the foreseeable future. Sometimes, you win bidding wars by losing them!
What next?
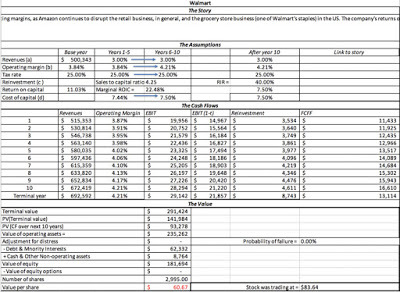
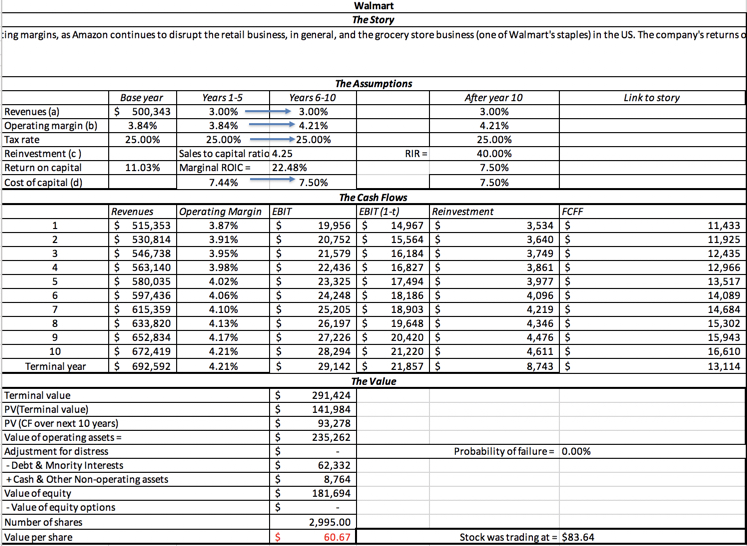
In the long term, this deal may slow the decline at Walmart, but at a price so high, that I don’t see how Walmart’s shareholders benefit from it. I have attached my valuation of Walmart and with my story of continued slow growth and stagnant margins for the company, the value that I obtain for the company is about $61, about 25% below its stock price of $83.64 on May 18, 2018.
 Download spreadsheetIn the short term, I expect this acquisition to a accelerate the already frenetic competition in the Indian retail market, with Flipkart, now backed by Walmart cash, and Amazon India continuing to cut prices and offering supplementary services. That will mean even bigger losses at both firms, and smaller online retailers will fall to the wayside. The winners, though, will be Indian retail customers who, in the words of the Godfather, will be made offers that they cannot refuse!
For start-ups all over India, though, I am afraid that this deal, which rewards the founders of Flipkart and its VC investors for building a money-losing, cash-burning machine, will feed bad behavior. Young companies will go for growth, and still more growth, paying little attention to pathways to profitability or building viable businesses, hoping to be Flipkarted. Venture capitalists will play more pricing games, paying prices for these money losers that have no basis in fundamentals, but justifying them by arguing that they will be Walmarted. In the meantime, if you are an investor who cares about value, I would suggest that you buy some popcorn, and enjoy the entertainment. It will be fun, while it lasts!
YouTube Video
Data Links
Walmart Valuation - May 2018
The Players
The place to start, when assessing a merger or an acquisition, is by looking at the companies involved, both acquiring and target, before the deal. It not only provides a baseline for any assessment of benefits, but may provide clues to motives.
a. Flipkart, an Amazon Wannabe?
Of the two players in this deal, we know a lot less about Flipkart than we do about Walmart, because it is not publicly traded, and it provides only snippets of information about itself. That said, we can use that information to draw some conclusions about the company:It has grown quickly: Flipkart was founded in October 2007 by Sachin and Binny Bansal, both ex-Amazon employees and unrelated to each other, with about $6000 in seed capital. The revenues for the company increased from less than $1 million in 2008-09 to $75 million in 2011-12 and accelerated, with multiple acquisitions along the way, to reach $3 billion in 2016-2017. The revenue growth rate in 2016-17 was 29%, down from the 50% revenue growth recorded in the prior fiscal year. Flipkart’s revenues are shown, in Indian rupees, in the graph below:
 While losing lots of money and burning through cash: As the graph above, not surprisingly, show, Flipkart lost money in its early years, as growth was its priority. More troubling, though, is the fact that the company not only continues to lose money, but that its losses have scaled up with the revenues. In the 2016-17 fiscal year, for instance, the company reported an operating loss of $0.6 billion, giving it an operating margin of minus 40%. The continued losses have resulted in the company burning through much of the $7 billion it has raised in capital over its lifetime from investors. And borrowing money to plug cash flow deficits: Perhaps unwilling to dilute their ownership stake by further seeking equity capital, the founders have borrowed substantial amounts. The costs of financing this debt jumped to $671 million in the 2016-17 fiscal year, pushing overall losses to $1.3 billion. Not only are the finance costs adding to the losses and the cash burn each year, but they put the company’s survival, as a stand-alone company, at risk.It has had issues with governance and transparency along the way: Flipkart has a complex holding structure, with a parent company in Singapore and multiple off shoots, some designed to get around India’s byzantine restrictions on foreign investment and retailing and some reflecting their multiple forays raising venture capital.While the defense that will be offered for the company is that it is still young, the scale of the losses and the dependence on borrowed money would suggest that as a stand-alone business, you would be hard pressed to come up with a justification for a high value for the company and would have serious concerns about survival.
 b. Walmart, Aging Giant?
Walmart has been publicly traded for decades and its operating results can be seen in much more detail. Its growth in the 1980s and 1990s from an Arkansas big-box store to a dominant US retailer is captured below:
That operating history includes two decades of stellar growth towards the end of the twentieth century, where Walmart reshaped the retail business in the United States, and the years since, where growth has slowed down and margins have come under pressure. As Walmart stands now, here is what we see:
Growth has slowed to a trickle: Walmart’s growth engine started sputtering more than a decade ago, partly because its revenue base is so overwhelmingly large ($500 billion in 2017) and partly because of saturation in its primary market, which is the United States. And more of it is being acquired: As same store sales growth has leveled off, Walmart has been trying to acquire other companies, with Flipkart just being the most recent (and most expensive) example. But its base business remains big box retailing: While acquiring online retailers like Wayfair and upscale labels like Bonobos represent a change from its original mission, the company still is built around its original models of low price/ high volume and box stores. The margins in that business have been shrinking, albeit gradually, over time.And its global footprint is modest: For much of the last few years, Walmart has seen more than 20% of its revenues come from outside the United States, but that number has not increased over the last few years and a significant portion of the foreign sales come from Mexico and Canada. Looking at the data, it is difficult to see how you can come to any conclusion other than the one that Walmart is not just a mature company, but one that is perhaps on the verge of decline.

Very few companies age gracefully, with many fighting decline by trying desperately to reinvent themselves, entering new markets and businesses, and trying to acquire growth. A few do succeed and find a new lease on life. If you are a Walmart shareholder, your returns on the company over the next decade will be determined in large part by how it works through the aging process and the Flipkart acquisition is one of the strongest signals that the company does not plan to go into decline, without a fight. That may make for a good movie theme, but it can be very expensive for stockholders.
The Common Enemy
Looking at Flipkart and Walmart, it is clear that they are very different companies, at opposite ends of the life cycle. Flipkart is a young company, still struggling with its basic business model, that has proven successful at delivering revenue growth but not profits. Walmart is an aging giant, still profitable but with little growth and margins under pressure. There is one element that they share in common and that is that they are both facing off against perhaps the most feared company in the world, Amazon. a. Amazon versus Flipkart: Over the last few years, Amazon has aggressively pursued growth in India, conceding little to Flipkart, and shown a willingness to prioritize revenues (and market share) over profits:
 Source: Forrester (through Bloomberg Quint)While Flipkart remains the larger firm, Amazon India has continued to gain market share, almost catching up by April 2018, and more critically, it has contributed to Flipkart’s losses, by being willing to lose money itself. In a prior post, I called Amazon a Field of Dreams company, and argued that patience was built into its DNA and the end game, if Flipkart and Amazon India go head to head is foretold. Flipkart will fold, having run out of cash and capital.b. Amazon versus Walmart: If there is one company in the world that should know how Amazon operates, it has to be Walmart. Over the last twenty years, it has seen Amazon lay waste to the brick and mortar retail business in the United States and while the initial victims may have been department stores and specialty retailers, it is quite clear that Amazon is setting its sights on Walmart and Target, especially after its acquisition of Whole Foods.
 It may seem like hyperbole, but a strong argument can be made that while some of Flipkart and Walmart’s problems can be traced to management decision, scaling issues and customer tastes, it is the fear of Amazon that fills their waking moments and drives their decision making.
The Pricing of Flipkart
Walmart is just the latest in a series of high profile investors that Flipkart has attracted over the years. Tiger Global has made multiple investments in the company, starting in 2013, and other international investors have been part of subsequent rounds. The chart below captures the history:
 Barring a period between July 2015 and late 2016, where the company was priced down by existing investors, the pricing has risen, with each new capital raise. In April 2017, the company raised $1.4 billion from Microsoft, Tencent and EBay, in an investment round that priced the company at $11 billion, and in August 2017, Softbank invested $2.5 billion in the company, pricing it at closer to $12.5 billion. Walmart’s investment, though, represents a significant jump in the pricing over the last year.
 Note that, through this entire section, I have used the word “pricing” and not “valuation”, to describe these VC and private investments, and if you are wondering why, please read this post that I have on the difference between price and value, and why VCs play the pricing game. Why would these venture capitalists, many of whom are old hands at the game, push up the pricing for a company that has not only proved incapable of making money but where there is no light at the end of the tunnel? The answer is simple and cynical. The only justification needed in the pricing game is the expectation that someone will pay a higher price down the road, an expectation that is captured in the use of exit multiples in VC pricing models.
The Why?
So, why did Walmart pay $16 billion for a 70% stake in Flipkart? And will it pay off for the company? There are four possible explanations for the Walmart move and each comes with troubling after thoughts. 1. The Pricing Game: No matter what one thinks of Flipkart’s business model and its valuation, it is true, at least after the Walmart offer, that the game has paid off for earlier entrants. By paying what it did, Walmart has made every investor who entered the pricing chain at Flipkart before it a “success”, vindicating the pricing game, at least for them. If the essence of that game is that you buy at a low price and sell at a higher price, the payoff to playing the pricing game is easiest seen by looking at the Softbank investment made just nine months ago, which has almost doubled in pricing, largely as a consequence of the Walmart deal. In fact, many of the private equity and venture capital firms that became investors in earlier years will be selling their stakes to Walmart, ringing up huge capital gains and moving right along. Is it possible that Walmart is playing the pricing game as well, intending to sell Flipkart to someone else down the road at a higher price? My assessment: Since the company’s stake is overwhelming and it has operating motives, it is difficult to see how Walmart plays the pricing game, or at least plays it to win. There is some talk of investors forcing Walmart to take Flipkart public in a few years, and it is possible that if Walmart is able to bolster Flipkart and make it successful, this exit ramp could open up, but it seems like wishful thinking to me.
2. The Big Market Entrée (Real Options): The Indian retail market is a big one, but for decades it has also proved to be a frustrating one for companies that have tried to enter it for decades. One possible explanation for Walmart’s investment is that they are buying a (very expensive) option to enter a large and potentially lucrative market. The options argument would imply that Walmart can pay a premium over an assessed value for Flipkart, with that premium reflecting the uncertainty and size of the Indian retail market.
My assessment: The size of the Indian retail market, its potential growth and uncertainty about that growth create optionality, but given that Walmart remains a brick and mortar store primarily and that there is multiple paths that can be taken to be in that market, it is not clear that buying Flipkart is a valuable option.
3. Synergy: As with every merger, I am sure that the synergy word will be tossed around, often with wild abandon and generally with nothing to back it up. If the essence of synergy is that a merger will allow the combined entity to take actions (increase growth, lower costs etc.) that the individual entities could not have taken on their own, you would need to think of how acquiring Flipkart will allow Walmart to generate more revenues at its Indian retail stores and conversely, how allowing itself to be acquired by Walmart will make Flipkart grow faster and turn to profitability sooner.
My assessment: Walmart is not a large enough presence in India yet to benefit substantially from the Flipkart acquisition and while Walmart did announce that it would be opening 50 new stores in India, right after the Flipkart deal, I don’t see how owning Flipkart will increase traffic substantially at its brick and mortar stores. At the same time, Walmart has little to offer Flipkart to make it more competitive against Amazon, other than capital to keep it going. In summary, if there is synergy, you have to strain to see it, and it will not be substantial enough or come soon enough to justify the price paid for Flipkart.
4. Defensive Maneuver:Earlier, I noted that both Flipkart and Walmart share a common adversary, Amazon, a competitor masterful at playing the long game. I argued that there is little chance that Flipkart, standing alone, can survive this fight, as capital dries up and existing investors look for exits and that Walmart’s slide into decline in global retailing seems inexorable, as Amazon continues its rise. Given that the Chinese retail market will prove difficult to penetrate, the Indian retail market may be where Walmart makes its stand. Put differently, Walmart’s justification for investing in Flipkart is not they expect to generate a reasonable return on their $16 billion investment but that if they do not make this acquisition, Amazon will be unchecked and that their decline will be more precipitous.
My assessment: Of the four reasons, this, in my view, is the one that best explains the deal. Defensive mergers, though, are a sign of weakness, not strength, and point to a business model under stress. If you are a Walmart shareholder, this is a negative signal and it does not surprise me that Walmart shares have declined in the aftermath. Staying with the life cycle analogy, Walmart is an aging, once-beautiful actress that has paid $16 billion for a very expensive face lift, and like all face lifts, it is only a matter of time before gravity works its magic again.
In summary, I think that the odds are against Walmart on this deal, given what it paid for Flipkart. If the rumors are true that Amazon was interested in buying Flipkart for close to $22 billion, I think that Walmart would have been better served letting Amazon win this battle and fight the local anti-trust enforcers, while playing to its strengths in brick and mortar retailing. I have a sneaking suspicion that Amazon had no intent of ever buying Flipkart and that it has succeeded in goading Walmart into paying way more than it should have to enter the Indian online retail space, where it can expect to lose money for the foreseeable future. Sometimes, you win bidding wars by losing them!
What next?
In the long term, this deal may slow the decline at Walmart, but at a price so high, that I don’t see how Walmart’s shareholders benefit from it. I have attached my valuation of Walmart and with my story of continued slow growth and stagnant margins for the company, the value that I obtain for the company is about $61, about 25% below its stock price of $83.64 on May 18, 2018.
 Download spreadsheetIn the short term, I expect this acquisition to a accelerate the already frenetic competition in the Indian retail market, with Flipkart, now backed by Walmart cash, and Amazon India continuing to cut prices and offering supplementary services. That will mean even bigger losses at both firms, and smaller online retailers will fall to the wayside. The winners, though, will be Indian retail customers who, in the words of the Godfather, will be made offers that they cannot refuse!
 For start-ups all over India, though, I am afraid that this deal, which rewards the founders of Flipkart and its VC investors for building a money-losing, cash-burning machine, will feed bad behavior. Young companies will go for growth, and still more growth, paying little attention to pathways to profitability or building viable businesses, hoping to be Flipkarted. Venture capitalists will play more pricing games, paying prices for these money losers that have no basis in fundamentals, but justifying them by arguing that they will be Walmarted. In the meantime, if you are an investor who cares about value, I would suggest that you buy some popcorn, and enjoy the entertainment. It will be fun, while it lasts!
YouTube Video
Data Links
Walmart Valuation - May 2018
April 26, 2018
Amazon: Glimpses of Shoeless Joe?
It was just over two weeks ago that I started my posts on the FANG stocks, starting with Facebook, which I decided to buy, because I felt that notwithstanding its current pariah status, its user base was too valuable to pass by, at the prevailing market price. I then looked at Netflix, a company that has shown a remarkable ability to adapt to the challenges thrown at it, while changing the entertainment business, but is, at least in my view, in a content cost/user cycle that will be difficult to break out of. With Alphabet, the cash cow that is its advertising business is allowing it to invest in the big new markets of tomorrow, and even with low odds and very little substance today, these bets can make or break the investment. That leaves me with the longest listed and perhaps the most intriguing of the four stocks, Amazon, a company whose reach seems to expand into new markets each year.
Revisiting my Amazon past
I valued Amazon for the first time in 1998, as an online book retailer, and much of what I know about valuing young companies today came from the struggles I went through, modifying what I knew in conventional valuation, for the special challenges of valuing a company with no history, no financials and no peer group. Out of that experience was born a paper on valuing young companies, which is still on my website and the first edition of the Dark Side of Valuation, and if you want to see some horrendously wrong forecasts, at least in hindsight, you can check out my valuation of Amazon in that edition.
While I had a tough time justifying Amazon’s valuation, in its dot-com days, I always admired the company and the way it was managed. When I was put off balance by an Amazon product, service or corporate announcement, I re-read Jeff Bezos’ letter to Amazon shareholders from 1997, because it helped me understand (though not always agree with) how Amazon views the business world. In that letter, Bezos laid out what I called the Field of Dreams story, telling his stockholders that if Amazon built it (revenues), they (the profits and cash flows) would come. In all my years looking at companies, I have never seen a CEO stay so true to a narrative and act as consistently as Amazon has, and it is, in my view, the biggest reason for its market success.
I have valued Amazon about once a year every year over its existence, and I have bought Amazon four times and sold it four times in that period. That said, there are two confessions that I have to make. The first is that I have not owned Amazon since 2012, and have thus missed out on its bull run since then. Second, through all of this time, I have consistently under estimated not only the innovative genius of this company, but also its (and its investors') patience. In fact, there have been occasions when I have wondered, staying true to my Field of Dreams theme, whether Shoeless Joe would ever make his appearance.
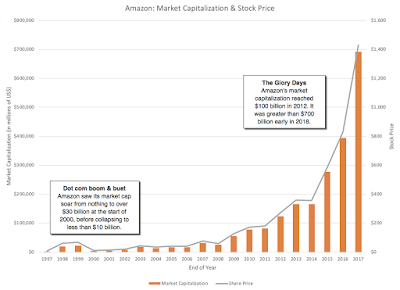
Amazon’s Market Cap Rise
Amazon’s rise in market capitalization has had more ups and downs than either Google or Facebook, but it has been just as impressive, partly because the company came back from a near death experience after the dot-com bust in 2001.
The more remarkable feature of Amazon’s rise has been the debris it has left in its wake, first with brick and mortar retail in the United States, but more recently in almost every business it has entered, from grocery retail to logistics. These graphs, excerpted from a New York Times article earlier this year, tells the story: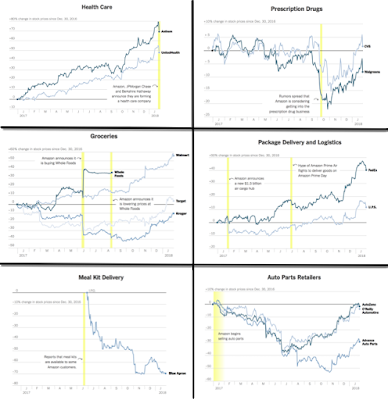
I know that this picture is probably is too compressed for you to read, but suffice to say that no company, no matter how large or established it is is safe, when Amazon enters it's market. Thus, while you can explain away the implosion of Blue Apron, when Amazon entered the meal delivery business, by pointing to its small size and lack of capital, note that the decline in market value at Kroger, Walmart and Target on the date of the Whole Foods acquisition was vastly greater in dollar value terms, and these firms are large and well capitalized. It is also worth noting that the decline in market cap is not permanent and that firms in some of the sectors see a bounce back in the subsequent time periods but generally not to pre-Amazon entry levels. If Amazon represents the light side of disruption, the destruction of the status quo and everything associated with it, in the businesses that it enters, is the dark side.
Amazon: Operating History and ModelRather than provide an involved explanation for why I call Amazon a Field of Dreams company, I will begin with a chart of Amazon's revenues and operating income that will explain it far more succinctly and better:
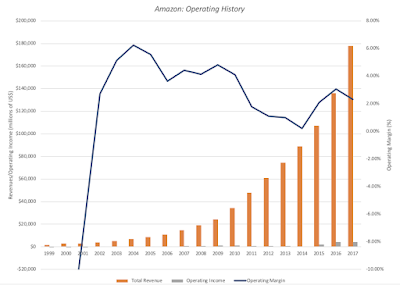 Amazon has clearly delivered on revenue growth, as its revenues have gone from $1.6 billion in 1999 to $177 billion in 2017, but its margins, after an initial improvement, went through an extended period of decline. In most companies, this would be viewed as a sign of a weak business model, but in the case of Amazon, it is a feature of how they do business, not a bug. In effect, Amazon has extended its revenue growth by expanding into new businesses, often selling its products (Kindle, Fire, Prime) at or below cost. That, by itself, is not unique to Amazon, but what makes it different is that it has been able to get the market to go along with its "if we build it, they will come" strategy.
The mild uptick in profitability in the last three years has been fueled by Amazon's web services (AWS) business, offering cloud and other internet related services to other businesses, and that can be seen in the graph below, showing revenues and operating profits broken down by segment: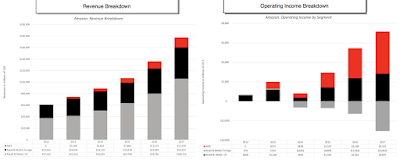 Amazon 10KOver the last five years. AWS has accounted for an increasing slice of revenues for Amazon, but it is still small, accounting for 10% of all revenues in 2017. On operating income, though, it has had a much bigger impact, accounting for all of Amazon's profitability in 2017, with AWS generating $4,331 million in operating profits and the rest of Amazon, reporting an operating loss of $225 million.
To back up my earlier claim that Amazon's low profits are by design, and not an accident, let's look at two expenses that Amazon has incurred over this period that are treated as operating expenses, and are reducing operating profit for the company, but are clearly designed as investments for the future. The first is in technology and content, which include the investments in technology that are driving the growth in the AWS business and content, for the media business. The second is in net shipping costs, the difference between what Amazon collects in shipping fees from its customers and what it pays out, which can be viewed as the investment is making in building up Amazon Prime.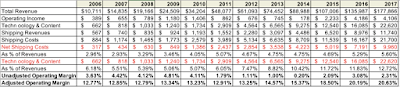 Amazon 10KNot only are the technology/content and net shipping costs a large portion of overall expenses, amounting to 18.32% of revenues in 2017, but they have increased over time. The operating margin for Amazon would have been over 20%, if it had not incurred these expenditures, but with those higher, the company would have had far less revenues, no AWS business and no Amazon Prime today. To value Amazon today, I think it makes sense to break it up into at least three parts, with the first being its retail/media business globally, the second its AWS business and finally, Amazon Prime. In the table below, I attempt to deconstruct Amazon's numbers to estimate how much each of these arms is generated as revenues and created in operating expenses in 2017, as a prelude to valuing them.
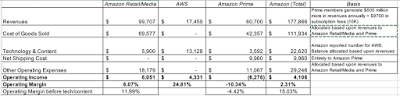 Note that I had to make some estimates and judgment calls in allocating revenues to Amazon Prime, where I have counted only the incremental revenues from Amazon Prime members, and in allocating content costs. For Amazon Prime, for instance, I have used an assumption that Prime members spend $600 more than non-Prime members, to estimate incremental revenues, and added the $9.7 billion in subscription premiums that Amazon reported in 2017. The net shipping costs have been fully allocated to Amazon Prime and all of the operating expenses that Amazon reported for AWS are assumed to be technology and content. The remaining expenses are allocated across AWS and Amazon Retail/Media, in proportion to their revenues. In my judgment, both Amazon Retail/Media and AWS generated operating profits in 2017, but the latter was much more profitable, with a pre-tax operating margin of 24.81%. Amazon Prime was a money loser in 2017, but its margins are less negative than they used to be, and at 100 million members, it may be poised to turn the corner.
Amazon Business ModelIf there are any secrets in Amazon's business model, they are dispensed when you read Amazon's 10K, which is remarkably forthcoming about how the company approaches business. In particular, the company emphasizes three key elements in its business model:Focus on Free Cash Flow: I tend to be cynical when companies talk about free cash flows, since most use self serving definitions, where they add "stuff" to earnings to make their cash flows look more positive. Amazon does not seem to take the same tack. In fact, it not only nets out capital expenditures and working capital needs, as it should, but it even nets out acquisitions (such as the $13.2 billion it spent on Whole Foods) to get to free cash flow.Manage working capital investment: Perhaps remembering times as a start-up when mismanaging inventory brought it to its knees, the company is focused on keeping its investment in working capital as low as possible, though that does sometimes involve strong arming suppliers.Use Operating leverage: Amazon is clearly conscious about its cost structure, recognizing that its revenue growth can give it significant advantages of economies of scale, when it comes to fixed costs.There are two additional features to the company that I would add, from my years observing the company.Patience: I have never seen a company show as much patience with its investments as Amazon has, and while there are some who would argue that this is because of it's large size and access to capital, Amazon was willing to wait for long periods, even when it was a small company, facing a capital crunch. I believe that patience is embedded in the company's DNA and that the Bezos letter in 1997 explains why.Experimentation: In almost every business that Amazon enters, it has been willing to try new things to shake up the status quo, and to abandon experiments that do not work in favor of experiments that do.There is no scarier vision for a company than news that Amazon has entered its business. If you are in that besieged company, how do you survive the Amazon onslaught? We know what does not work:Imitation: You cannot out-Amazon Amazon, by trying to sell below cost and wait patiently. Even if you are a company with deep pockets, Amazon can out-wait you, since it is not only how they do business and they have investors who have accepted them on their terms.Cost Cutting: There are companies, especially in the US brick and mortar retail space, that thought they could cut costs, sell products at Amazon-level prices and survive. By doing so, they speeded their decline, since the poorer service and limited inventory that followed alienated their core customers, who left them for Amazon.Whining: Companies under the Amazon threat often resort to whining not only about fairness (and how Amazon breaks the rules) but also about how society overall will pay a price for Amazon domination. There are seeds of truth in both argument, but they will neither slow nor stop Amazon from continuing to put them out of business.While there is no one template for what works, here are some strategies, drawn from looking at companies that have survived Amazon, that improve your odds:Tilt the game: You can try to get governments and regulators to buy into your warnings of monopoly power and societal demise and to regulate or restrict Amazon in ways that allow you to continue in business. Play to your strengths: If you have succeeded as a company before Amazon came into your business, you had competitive advantages and core customers who generated that success. Nourishing your competitive advantages and bringing your core customers even closer to you is key to survival, but that will require that you live through some financial pain (in the form of higher costs).And to Amazon's weaknesses: Amazon's favored markets have high growth and low capital intensity, and when they get drawn into markets that demand more capital investment, like logistics, it is because they were forced into them. If you can move the terrain to lower growth, higher capital intensity businesses, you can improve your odds of surviving Amazon.None of these choices will guarantee success or even survival, and there are times where you may have to seek partnerships and joint ventures to make it through, and if all else fails, you can try some witchcraft.
Valuing AmazonIn my prior iterations, I tried to value Amazon as a consolidated company, arguing that it was predominantly a retail company with some media businesses. The growth of AWS and the substantial spending on Amazon Prime has led me to conclude that a more prudent path is to value Amazon in pieces, with Amazon Retail/Media, AWS and Amazon Prime, each considered separately.
1. Amazon Retail/Media
To value the heart of Amazon, which still remains its retail and media business, I used the revenues and operating margin that I estimated based upon my allocation at the end of the last section as my starting point, and assumed that Amazon will be able to continue growing revenues at 15% a year for the next five years, while also improving its operating margin (currently 9.09%, with technology and content costs capitalized) to 12%. The revenue growth assumption is built on Amazon's track record of being able to grow and the improved margin reflect expected economies of scale. The resulting value is shown below: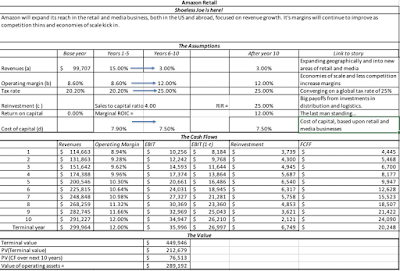 Download spreadsheetBased upon my assumptions, the value that I attach to the retail/media business is about $289 billion. The key driver of value is the operating margin improvement, built into the story.
2. AWSIf Amazon's reported numbers are right, this division is the profit machine for the company, generating an operating margin of close to 25%, while revenues grew 42.88% in 2017. While I believe that this business will stay high growth and profitable, it is also one where Amazon faces strong competitors in Microsoft and Google, just to name two, and both revenue growth rates and margins will come under pressure. I assume revenue growth of 25% a year for the next 5 years, with operating margin declining to 20% over that period. The value is shown below: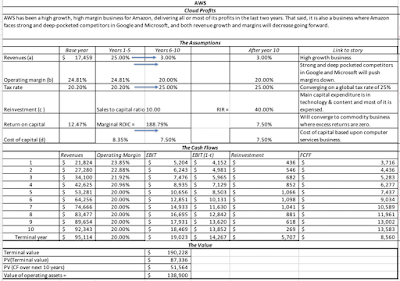 Download spreadsheetThe value that I estimate for AWS is about $139 billion. The key for value creation is finding a mix of revenue growth and operating margin that keeps value up, since going for higher growth with much lower margins will cause value to dissipate.
3. Amazon Prime
To value Amazon Prime, I use the same technique that I used last year to value it, starting with a value of a Prime member, and building up to the value of Prime, by forecasting growth in Prime membership and corporate costs (mostly content). I updated the Prime membership number to 100 million (from the 85 million that I used last August) and used the 2017 financial statements to get more specific on both content costs and on the cost of capital. The value is shown below: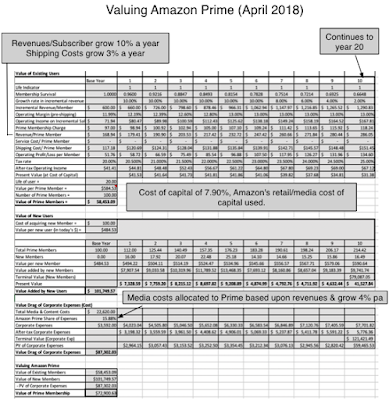 Download spreadsheetBased upon the layers of assumptions that I have made, especially on shipping costs growing at a rate lower than membership rolls, the value that I estimate for Amazon Prime is about $73 billion. The key input here is shipping costs, since failing to keep it in control will cause the value to very quickly spiral down to zero.
Amazon, the CompanyWith all three pieces completed, I bring them together in my valuation of the company, incorporating the total debt outstanding in the company of $42,730 (including capitalized operating leases) and cash of $30.986 million, to arrive at a value per share of $1019.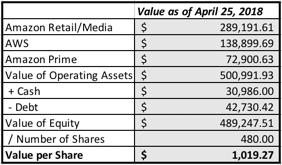
At $1,460/share, on April 25, the stock is clearly out of my reach right now. Given that I have not been able to justify buying the stock at any time in the last five years, as it rose from $250/share to $1500, my suggestion is that you do you don't take my word, and that you make your own judgment. You can download the spreadsheets that I have for Amazon Retail/Media, AWS and Amazon Prime at the end of this post, and change those assumptions of mine that you think are wrong.
Investment Judgment<!-- /* Style Definitions */ p.MsoNormal, li.MsoNormal, div.MsoNormal {mso-style-unhide:no; mso-style-qformat:yes; mso-style-parent:""; margin:0in; margin-bottom:.0001pt; mso-pagination:widow-orphan; font-size:12.0pt; font-family:"Calibri",sans-serif; mso-ascii-font-family:Calibri; mso-ascii-theme-font:minor-latin; mso-fareast-font-family:Calibri; mso-fareast-theme-font:minor-latin; mso-hansi-font-family:Calibri; mso-hansi-theme-font:minor-latin; mso-bidi-font-family:"Times New Roman"; mso-bidi-theme-font:minor-bidi;} p.MsoListParagraph, li.MsoListParagraph, div.MsoListParagraph {mso-style-priority:34; mso-style-unhide:no; mso-style-qformat:yes; margin-top:0in; margin-right:0in; margin-bottom:0in; margin-left:.5in; margin-bottom:.0001pt; mso-add-space:auto; mso-pagination:widow-orphan; font-size:12.0pt; font-family:"Calibri",sans-serif; mso-ascii-font-family:Calibri; mso-ascii-theme-font:minor-latin; mso-fareast-font-family:Calibri; mso-fareast-theme-font:minor-latin; mso-hansi-font-family:Calibri; mso-hansi-theme-font:minor-latin; mso-bidi-font-family:"Times New Roman"; mso-bidi-theme-font:minor-bidi;} p.MsoListParagraphCxSpFirst, li.MsoListParagraphCxSpFirst, div.MsoListParagraphCxSpFirst {mso-style-priority:34; mso-style-unhide:no; mso-style-qformat:yes; mso-style-type:export-only; margin-top:0in; margin-right:0in; margin-bottom:0in; margin-left:.5in; margin-bottom:.0001pt; mso-add-space:auto; mso-pagination:widow-orphan; font-size:12.0pt; font-family:"Calibri",sans-serif; mso-ascii-font-family:Calibri; mso-ascii-theme-font:minor-latin; mso-fareast-font-family:Calibri; mso-fareast-theme-font:minor-latin; mso-hansi-font-family:Calibri; mso-hansi-theme-font:minor-latin; mso-bidi-font-family:"Times New Roman"; mso-bidi-theme-font:minor-bidi;} p.MsoListParagraphCxSpMiddle, li.MsoListParagraphCxSpMiddle, div.MsoListParagraphCxSpMiddle {mso-style-priority:34; mso-style-unhide:no; mso-style-qformat:yes; mso-style-type:export-only; margin-top:0in; margin-right:0in; margin-bottom:0in; margin-left:.5in; margin-bottom:.0001pt; mso-add-space:auto; mso-pagination:widow-orphan; font-size:12.0pt; font-family:"Calibri",sans-serif; mso-ascii-font-family:Calibri; mso-ascii-theme-font:minor-latin; mso-fareast-font-family:Calibri; mso-fareast-theme-font:minor-latin; mso-hansi-font-family:Calibri; mso-hansi-theme-font:minor-latin; mso-bidi-font-family:"Times New Roman"; mso-bidi-theme-font:minor-bidi;} p.MsoListParagraphCxSpLast, li.MsoListParagraphCxSpLast, div.MsoListParagraphCxSpLast {mso-style-priority:34; mso-style-unhide:no; mso-style-qformat:yes; mso-style-type:export-only; margin-top:0in; margin-right:0in; margin-bottom:0in; margin-left:.5in; margin-bottom:.0001pt; mso-add-space:auto; mso-pagination:widow-orphan; font-size:12.0pt; font-family:"Calibri",sans-serif; mso-ascii-font-family:Calibri; mso-ascii-theme-font:minor-latin; mso-fareast-font-family:Calibri; mso-fareast-theme-font:minor-latin; mso-hansi-font-family:Calibri; mso-hansi-theme-font:minor-latin; mso-bidi-font-family:"Times New Roman"; mso-bidi-theme-font:minor-bidi;} .MsoChpDefault {mso-style-type:export-only; mso-default-props:yes; font-family:"Calibri",sans-serif; mso-ascii-font-family:Calibri; mso-ascii-theme-font:minor-latin; mso-fareast-font-family:Calibri; mso-fareast-theme-font:minor-latin; mso-hansi-font-family:Calibri; mso-hansi-theme-font:minor-latin; mso-bidi-font-family:"Times New Roman"; mso-bidi-theme-font:minor-bidi;} @page WordSection1 {size:8.5in 11.0in; margin:1.0in 1.0in 1.0in 1.0in; mso-header-margin:.5in; mso-footer-margin:.5in; mso-paper-source:0;} div.WordSection1 {page:WordSection1;} /* List Definitions */ @list l0 {mso-list-id:1077047395; mso-list-type:hybrid; mso-list-template-ids:361802234 466405722 67698691 67698693 67698689 67698691 67698693 67698689 67698691 67698693;} @list l0:level1 {mso-level-start-at:0; mso-level-number-format:bullet; mso-level-text:-; mso-level-tab-stop:none; mso-level-number-position:left; text-indent:-.25in; font-family:"Calibri",sans-serif; mso-fareast-font-family:Calibri; mso-fareast-theme-font:minor-latin;} @list l0:level2 {mso-level-number-format:bullet; mso-level-text:o; mso-level-tab-stop:none; mso-level-number-position:left; text-indent:-.25in; font-family:"Courier New";} @list l0:level3 {mso-level-number-format:bullet; mso-level-text:; mso-level-tab-stop:none; mso-level-number-position:left; text-indent:-.25in; font-family:Wingdings;} @list l0:level4 {mso-level-number-format:bullet; mso-level-text:; mso-level-tab-stop:none; mso-level-number-position:left; text-indent:-.25in; font-family:Symbol;} @list l0:level5 {mso-level-number-format:bullet; mso-level-text:o; mso-level-tab-stop:none; mso-level-number-position:left; text-indent:-.25in; font-family:"Courier New";} @list l0:level6 {mso-level-number-format:bullet; mso-level-text:; mso-level-tab-stop:none; mso-level-number-position:left; text-indent:-.25in; font-family:Wingdings;} @list l0:level7 {mso-level-number-format:bullet; mso-level-text:; mso-level-tab-stop:none; mso-level-number-position:left; text-indent:-.25in; font-family:Symbol;} @list l0:level8 {mso-level-number-format:bullet; mso-level-text:o; mso-level-tab-stop:none; mso-level-number-position:left; text-indent:-.25in; font-family:"Courier New";} @list l0:level9 {mso-level-number-format:bullet; mso-level-text:; mso-level-tab-stop:none; mso-level-number-position:left; text-indent:-.25in; font-family:Wingdings;} </style></div><div style="text-align: justify;">The FANG stocks represent great companies, but of the four, I think that Amazon has the most fearsome business model, simply because its platform of disruption and patience can be extended to almost any other business, one reason why every company should view Amazon as a potential competitor. I know that the old value adage is that if you buy quality companies and hold them forever, they will pay for themselves, but I don't believe that! There are good companies that can be bad investments and bad companies that can be terrific investments, as I <a href="http://aswathdamodaran.blogspot.com/2... in this post</a>. Amazon has fallen into the first category for much of the last five years and continues to do so, at today's market price. But good things come to those who wait, and I know that there be a time and a price at which it will be back in my portfolio.<br /><br /><span style="color: red;"><i>Post-post Update:</i> I deliberately posted this before the earnings report, and the report that came out about two hours after the post was a blockbuster, with higher revenue growth than expect, a doubling of net income and an increase in the stock price of close to $100/share in the after market. Incorporating the effects into the valuations will have to wait until the full quarterly report is available, but the biggest part of the report, for me, was the increase in Prime Membership fees to $119/year. You can modify the Amazon Prime valuation spreadsheet to reflect the increase in membership feels to $119/year (from $99/year). Doing so increases the value of Prime to almost $116 billion, increasing value per share by almost $100/share.</span></div><br /><b>YouTube Video</b><br /><iframe allow="autoplay; encrypted-media" allowfullscreen="" frameborder="0" height="315" src="https://www.youtube.com/embed/EdRsFU_..." width="560"></iframe><br /><br /><b>Data Links</b><br /><br /><ol style="text-align: left;"><li><a href="http://media.corporate-ir.net/media_f... 10K</a></li><li><a href="http://www.stern.nyu.edu/~adamodar/pc... of Amazon Retail/Media</a></li><li><a href="http://www.stern.nyu.edu/~adamodar/pc... of AWS</a></li><li><a href="http://www.stern.nyu.edu/~adamodar/pc... of Amazon Prime</a></li></ol><div><b>Related Blog Posts</b></div><div><ol style="text-align: left;"><li><a href="http://aswathdamodaran.blogspot.com/2... Amazon Prime (October 2017)</a></li><li><a href="http://aswathdamodaran.blogspot.com/2... a Paradox: Why Good (Bad) Companies can be Bad (Good) Investments!</a></li></ol></div><br /><div style="text-align: justify;"><b>Blog Posts on Tech Takedown</b></div><div><div style="text-align: justify;"><ol><li><a href="http://aswathdamodaran.blogspot.com/2... easy, go easy: The Tech Takedown!</a></li><li><a href="http://aswathdamodaran.blogspot.in/20... Friendless, But Still Formidable!</a></li><li><a href="http://aswathdamodaran.blogspot.in/20... The Future of Entertainment or House of Cards?</a></li><li><a href="https://aswathdamodaran.blogspot.com/... Soup: Google is Alpha, but where are the Bets?</a></li><li><a href="https://aswathdamodaran.blogspot.com/... Glimpses of Shoeless Joe!</a></li></ol></div></div></div>
Revisiting my Amazon past
I valued Amazon for the first time in 1998, as an online book retailer, and much of what I know about valuing young companies today came from the struggles I went through, modifying what I knew in conventional valuation, for the special challenges of valuing a company with no history, no financials and no peer group. Out of that experience was born a paper on valuing young companies, which is still on my website and the first edition of the Dark Side of Valuation, and if you want to see some horrendously wrong forecasts, at least in hindsight, you can check out my valuation of Amazon in that edition.
While I had a tough time justifying Amazon’s valuation, in its dot-com days, I always admired the company and the way it was managed. When I was put off balance by an Amazon product, service or corporate announcement, I re-read Jeff Bezos’ letter to Amazon shareholders from 1997, because it helped me understand (though not always agree with) how Amazon views the business world. In that letter, Bezos laid out what I called the Field of Dreams story, telling his stockholders that if Amazon built it (revenues), they (the profits and cash flows) would come. In all my years looking at companies, I have never seen a CEO stay so true to a narrative and act as consistently as Amazon has, and it is, in my view, the biggest reason for its market success.
I have valued Amazon about once a year every year over its existence, and I have bought Amazon four times and sold it four times in that period. That said, there are two confessions that I have to make. The first is that I have not owned Amazon since 2012, and have thus missed out on its bull run since then. Second, through all of this time, I have consistently under estimated not only the innovative genius of this company, but also its (and its investors') patience. In fact, there have been occasions when I have wondered, staying true to my Field of Dreams theme, whether Shoeless Joe would ever make his appearance.
Amazon’s Market Cap Rise
Amazon’s rise in market capitalization has had more ups and downs than either Google or Facebook, but it has been just as impressive, partly because the company came back from a near death experience after the dot-com bust in 2001.
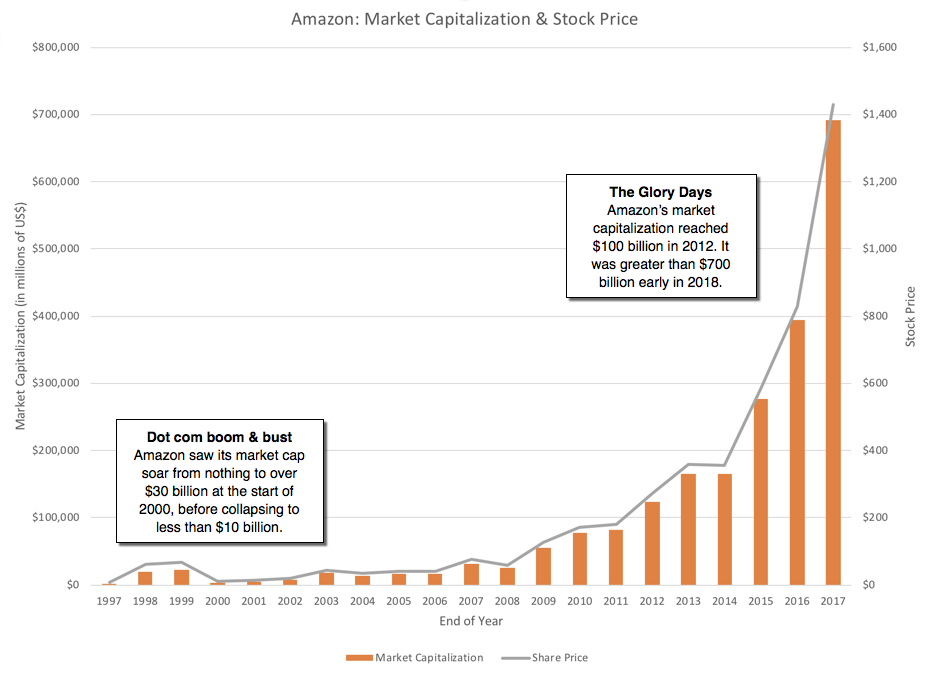
The more remarkable feature of Amazon’s rise has been the debris it has left in its wake, first with brick and mortar retail in the United States, but more recently in almost every business it has entered, from grocery retail to logistics. These graphs, excerpted from a New York Times article earlier this year, tells the story:
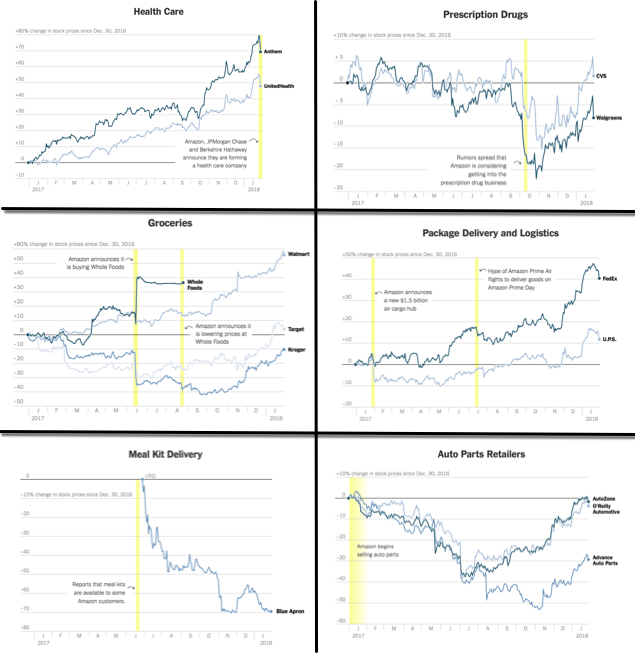
I know that this picture is probably is too compressed for you to read, but suffice to say that no company, no matter how large or established it is is safe, when Amazon enters it's market. Thus, while you can explain away the implosion of Blue Apron, when Amazon entered the meal delivery business, by pointing to its small size and lack of capital, note that the decline in market value at Kroger, Walmart and Target on the date of the Whole Foods acquisition was vastly greater in dollar value terms, and these firms are large and well capitalized. It is also worth noting that the decline in market cap is not permanent and that firms in some of the sectors see a bounce back in the subsequent time periods but generally not to pre-Amazon entry levels. If Amazon represents the light side of disruption, the destruction of the status quo and everything associated with it, in the businesses that it enters, is the dark side.
Amazon: Operating History and ModelRather than provide an involved explanation for why I call Amazon a Field of Dreams company, I will begin with a chart of Amazon's revenues and operating income that will explain it far more succinctly and better:
 Amazon has clearly delivered on revenue growth, as its revenues have gone from $1.6 billion in 1999 to $177 billion in 2017, but its margins, after an initial improvement, went through an extended period of decline. In most companies, this would be viewed as a sign of a weak business model, but in the case of Amazon, it is a feature of how they do business, not a bug. In effect, Amazon has extended its revenue growth by expanding into new businesses, often selling its products (Kindle, Fire, Prime) at or below cost. That, by itself, is not unique to Amazon, but what makes it different is that it has been able to get the market to go along with its "if we build it, they will come" strategy.
The mild uptick in profitability in the last three years has been fueled by Amazon's web services (AWS) business, offering cloud and other internet related services to other businesses, and that can be seen in the graph below, showing revenues and operating profits broken down by segment:
 Amazon 10KOver the last five years. AWS has accounted for an increasing slice of revenues for Amazon, but it is still small, accounting for 10% of all revenues in 2017. On operating income, though, it has had a much bigger impact, accounting for all of Amazon's profitability in 2017, with AWS generating $4,331 million in operating profits and the rest of Amazon, reporting an operating loss of $225 million.
To back up my earlier claim that Amazon's low profits are by design, and not an accident, let's look at two expenses that Amazon has incurred over this period that are treated as operating expenses, and are reducing operating profit for the company, but are clearly designed as investments for the future. The first is in technology and content, which include the investments in technology that are driving the growth in the AWS business and content, for the media business. The second is in net shipping costs, the difference between what Amazon collects in shipping fees from its customers and what it pays out, which can be viewed as the investment is making in building up Amazon Prime.
 Amazon 10KNot only are the technology/content and net shipping costs a large portion of overall expenses, amounting to 18.32% of revenues in 2017, but they have increased over time. The operating margin for Amazon would have been over 20%, if it had not incurred these expenditures, but with those higher, the company would have had far less revenues, no AWS business and no Amazon Prime today. To value Amazon today, I think it makes sense to break it up into at least three parts, with the first being its retail/media business globally, the second its AWS business and finally, Amazon Prime. In the table below, I attempt to deconstruct Amazon's numbers to estimate how much each of these arms is generated as revenues and created in operating expenses in 2017, as a prelude to valuing them.
 Note that I had to make some estimates and judgment calls in allocating revenues to Amazon Prime, where I have counted only the incremental revenues from Amazon Prime members, and in allocating content costs. For Amazon Prime, for instance, I have used an assumption that Prime members spend $600 more than non-Prime members, to estimate incremental revenues, and added the $9.7 billion in subscription premiums that Amazon reported in 2017. The net shipping costs have been fully allocated to Amazon Prime and all of the operating expenses that Amazon reported for AWS are assumed to be technology and content. The remaining expenses are allocated across AWS and Amazon Retail/Media, in proportion to their revenues. In my judgment, both Amazon Retail/Media and AWS generated operating profits in 2017, but the latter was much more profitable, with a pre-tax operating margin of 24.81%. Amazon Prime was a money loser in 2017, but its margins are less negative than they used to be, and at 100 million members, it may be poised to turn the corner.
Amazon Business ModelIf there are any secrets in Amazon's business model, they are dispensed when you read Amazon's 10K, which is remarkably forthcoming about how the company approaches business. In particular, the company emphasizes three key elements in its business model:Focus on Free Cash Flow: I tend to be cynical when companies talk about free cash flows, since most use self serving definitions, where they add "stuff" to earnings to make their cash flows look more positive. Amazon does not seem to take the same tack. In fact, it not only nets out capital expenditures and working capital needs, as it should, but it even nets out acquisitions (such as the $13.2 billion it spent on Whole Foods) to get to free cash flow.Manage working capital investment: Perhaps remembering times as a start-up when mismanaging inventory brought it to its knees, the company is focused on keeping its investment in working capital as low as possible, though that does sometimes involve strong arming suppliers.Use Operating leverage: Amazon is clearly conscious about its cost structure, recognizing that its revenue growth can give it significant advantages of economies of scale, when it comes to fixed costs.There are two additional features to the company that I would add, from my years observing the company.Patience: I have never seen a company show as much patience with its investments as Amazon has, and while there are some who would argue that this is because of it's large size and access to capital, Amazon was willing to wait for long periods, even when it was a small company, facing a capital crunch. I believe that patience is embedded in the company's DNA and that the Bezos letter in 1997 explains why.Experimentation: In almost every business that Amazon enters, it has been willing to try new things to shake up the status quo, and to abandon experiments that do not work in favor of experiments that do.There is no scarier vision for a company than news that Amazon has entered its business. If you are in that besieged company, how do you survive the Amazon onslaught? We know what does not work:Imitation: You cannot out-Amazon Amazon, by trying to sell below cost and wait patiently. Even if you are a company with deep pockets, Amazon can out-wait you, since it is not only how they do business and they have investors who have accepted them on their terms.Cost Cutting: There are companies, especially in the US brick and mortar retail space, that thought they could cut costs, sell products at Amazon-level prices and survive. By doing so, they speeded their decline, since the poorer service and limited inventory that followed alienated their core customers, who left them for Amazon.Whining: Companies under the Amazon threat often resort to whining not only about fairness (and how Amazon breaks the rules) but also about how society overall will pay a price for Amazon domination. There are seeds of truth in both argument, but they will neither slow nor stop Amazon from continuing to put them out of business.While there is no one template for what works, here are some strategies, drawn from looking at companies that have survived Amazon, that improve your odds:Tilt the game: You can try to get governments and regulators to buy into your warnings of monopoly power and societal demise and to regulate or restrict Amazon in ways that allow you to continue in business. Play to your strengths: If you have succeeded as a company before Amazon came into your business, you had competitive advantages and core customers who generated that success. Nourishing your competitive advantages and bringing your core customers even closer to you is key to survival, but that will require that you live through some financial pain (in the form of higher costs).And to Amazon's weaknesses: Amazon's favored markets have high growth and low capital intensity, and when they get drawn into markets that demand more capital investment, like logistics, it is because they were forced into them. If you can move the terrain to lower growth, higher capital intensity businesses, you can improve your odds of surviving Amazon.None of these choices will guarantee success or even survival, and there are times where you may have to seek partnerships and joint ventures to make it through, and if all else fails, you can try some witchcraft.
Valuing AmazonIn my prior iterations, I tried to value Amazon as a consolidated company, arguing that it was predominantly a retail company with some media businesses. The growth of AWS and the substantial spending on Amazon Prime has led me to conclude that a more prudent path is to value Amazon in pieces, with Amazon Retail/Media, AWS and Amazon Prime, each considered separately.
1. Amazon Retail/Media
To value the heart of Amazon, which still remains its retail and media business, I used the revenues and operating margin that I estimated based upon my allocation at the end of the last section as my starting point, and assumed that Amazon will be able to continue growing revenues at 15% a year for the next five years, while also improving its operating margin (currently 9.09%, with technology and content costs capitalized) to 12%. The revenue growth assumption is built on Amazon's track record of being able to grow and the improved margin reflect expected economies of scale. The resulting value is shown below:
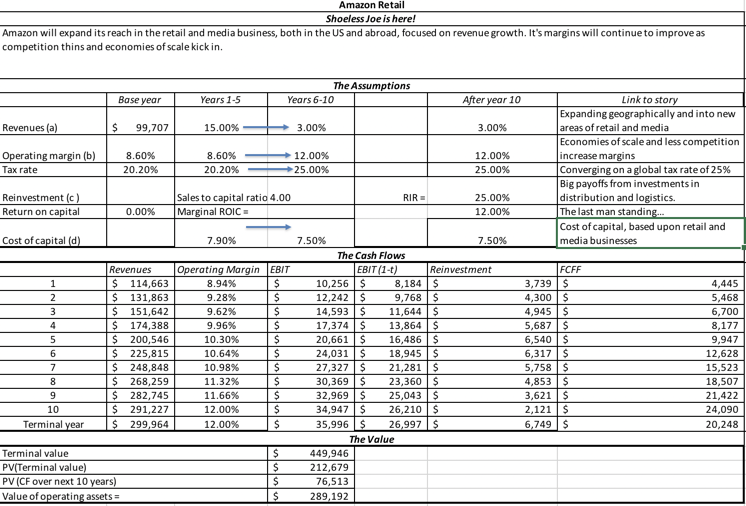 Download spreadsheetBased upon my assumptions, the value that I attach to the retail/media business is about $289 billion. The key driver of value is the operating margin improvement, built into the story.
2. AWSIf Amazon's reported numbers are right, this division is the profit machine for the company, generating an operating margin of close to 25%, while revenues grew 42.88% in 2017. While I believe that this business will stay high growth and profitable, it is also one where Amazon faces strong competitors in Microsoft and Google, just to name two, and both revenue growth rates and margins will come under pressure. I assume revenue growth of 25% a year for the next 5 years, with operating margin declining to 20% over that period. The value is shown below:
 Download spreadsheetThe value that I estimate for AWS is about $139 billion. The key for value creation is finding a mix of revenue growth and operating margin that keeps value up, since going for higher growth with much lower margins will cause value to dissipate.
3. Amazon Prime
To value Amazon Prime, I use the same technique that I used last year to value it, starting with a value of a Prime member, and building up to the value of Prime, by forecasting growth in Prime membership and corporate costs (mostly content). I updated the Prime membership number to 100 million (from the 85 million that I used last August) and used the 2017 financial statements to get more specific on both content costs and on the cost of capital. The value is shown below:
 Download spreadsheetBased upon the layers of assumptions that I have made, especially on shipping costs growing at a rate lower than membership rolls, the value that I estimate for Amazon Prime is about $73 billion. The key input here is shipping costs, since failing to keep it in control will cause the value to very quickly spiral down to zero.
Amazon, the CompanyWith all three pieces completed, I bring them together in my valuation of the company, incorporating the total debt outstanding in the company of $42,730 (including capitalized operating leases) and cash of $30.986 million, to arrive at a value per share of $1019.

At $1,460/share, on April 25, the stock is clearly out of my reach right now. Given that I have not been able to justify buying the stock at any time in the last five years, as it rose from $250/share to $1500, my suggestion is that you do you don't take my word, and that you make your own judgment. You can download the spreadsheets that I have for Amazon Retail/Media, AWS and Amazon Prime at the end of this post, and change those assumptions of mine that you think are wrong.
Investment Judgment<!-- /* Style Definitions */ p.MsoNormal, li.MsoNormal, div.MsoNormal {mso-style-unhide:no; mso-style-qformat:yes; mso-style-parent:""; margin:0in; margin-bottom:.0001pt; mso-pagination:widow-orphan; font-size:12.0pt; font-family:"Calibri",sans-serif; mso-ascii-font-family:Calibri; mso-ascii-theme-font:minor-latin; mso-fareast-font-family:Calibri; mso-fareast-theme-font:minor-latin; mso-hansi-font-family:Calibri; mso-hansi-theme-font:minor-latin; mso-bidi-font-family:"Times New Roman"; mso-bidi-theme-font:minor-bidi;} p.MsoListParagraph, li.MsoListParagraph, div.MsoListParagraph {mso-style-priority:34; mso-style-unhide:no; mso-style-qformat:yes; margin-top:0in; margin-right:0in; margin-bottom:0in; margin-left:.5in; margin-bottom:.0001pt; mso-add-space:auto; mso-pagination:widow-orphan; font-size:12.0pt; font-family:"Calibri",sans-serif; mso-ascii-font-family:Calibri; mso-ascii-theme-font:minor-latin; mso-fareast-font-family:Calibri; mso-fareast-theme-font:minor-latin; mso-hansi-font-family:Calibri; mso-hansi-theme-font:minor-latin; mso-bidi-font-family:"Times New Roman"; mso-bidi-theme-font:minor-bidi;} p.MsoListParagraphCxSpFirst, li.MsoListParagraphCxSpFirst, div.MsoListParagraphCxSpFirst {mso-style-priority:34; mso-style-unhide:no; mso-style-qformat:yes; mso-style-type:export-only; margin-top:0in; margin-right:0in; margin-bottom:0in; margin-left:.5in; margin-bottom:.0001pt; mso-add-space:auto; mso-pagination:widow-orphan; font-size:12.0pt; font-family:"Calibri",sans-serif; mso-ascii-font-family:Calibri; mso-ascii-theme-font:minor-latin; mso-fareast-font-family:Calibri; mso-fareast-theme-font:minor-latin; mso-hansi-font-family:Calibri; mso-hansi-theme-font:minor-latin; mso-bidi-font-family:"Times New Roman"; mso-bidi-theme-font:minor-bidi;} p.MsoListParagraphCxSpMiddle, li.MsoListParagraphCxSpMiddle, div.MsoListParagraphCxSpMiddle {mso-style-priority:34; mso-style-unhide:no; mso-style-qformat:yes; mso-style-type:export-only; margin-top:0in; margin-right:0in; margin-bottom:0in; margin-left:.5in; margin-bottom:.0001pt; mso-add-space:auto; mso-pagination:widow-orphan; font-size:12.0pt; font-family:"Calibri",sans-serif; mso-ascii-font-family:Calibri; mso-ascii-theme-font:minor-latin; mso-fareast-font-family:Calibri; mso-fareast-theme-font:minor-latin; mso-hansi-font-family:Calibri; mso-hansi-theme-font:minor-latin; mso-bidi-font-family:"Times New Roman"; mso-bidi-theme-font:minor-bidi;} p.MsoListParagraphCxSpLast, li.MsoListParagraphCxSpLast, div.MsoListParagraphCxSpLast {mso-style-priority:34; mso-style-unhide:no; mso-style-qformat:yes; mso-style-type:export-only; margin-top:0in; margin-right:0in; margin-bottom:0in; margin-left:.5in; margin-bottom:.0001pt; mso-add-space:auto; mso-pagination:widow-orphan; font-size:12.0pt; font-family:"Calibri",sans-serif; mso-ascii-font-family:Calibri; mso-ascii-theme-font:minor-latin; mso-fareast-font-family:Calibri; mso-fareast-theme-font:minor-latin; mso-hansi-font-family:Calibri; mso-hansi-theme-font:minor-latin; mso-bidi-font-family:"Times New Roman"; mso-bidi-theme-font:minor-bidi;} .MsoChpDefault {mso-style-type:export-only; mso-default-props:yes; font-family:"Calibri",sans-serif; mso-ascii-font-family:Calibri; mso-ascii-theme-font:minor-latin; mso-fareast-font-family:Calibri; mso-fareast-theme-font:minor-latin; mso-hansi-font-family:Calibri; mso-hansi-theme-font:minor-latin; mso-bidi-font-family:"Times New Roman"; mso-bidi-theme-font:minor-bidi;} @page WordSection1 {size:8.5in 11.0in; margin:1.0in 1.0in 1.0in 1.0in; mso-header-margin:.5in; mso-footer-margin:.5in; mso-paper-source:0;} div.WordSection1 {page:WordSection1;} /* List Definitions */ @list l0 {mso-list-id:1077047395; mso-list-type:hybrid; mso-list-template-ids:361802234 466405722 67698691 67698693 67698689 67698691 67698693 67698689 67698691 67698693;} @list l0:level1 {mso-level-start-at:0; mso-level-number-format:bullet; mso-level-text:-; mso-level-tab-stop:none; mso-level-number-position:left; text-indent:-.25in; font-family:"Calibri",sans-serif; mso-fareast-font-family:Calibri; mso-fareast-theme-font:minor-latin;} @list l0:level2 {mso-level-number-format:bullet; mso-level-text:o; mso-level-tab-stop:none; mso-level-number-position:left; text-indent:-.25in; font-family:"Courier New";} @list l0:level3 {mso-level-number-format:bullet; mso-level-text:; mso-level-tab-stop:none; mso-level-number-position:left; text-indent:-.25in; font-family:Wingdings;} @list l0:level4 {mso-level-number-format:bullet; mso-level-text:; mso-level-tab-stop:none; mso-level-number-position:left; text-indent:-.25in; font-family:Symbol;} @list l0:level5 {mso-level-number-format:bullet; mso-level-text:o; mso-level-tab-stop:none; mso-level-number-position:left; text-indent:-.25in; font-family:"Courier New";} @list l0:level6 {mso-level-number-format:bullet; mso-level-text:; mso-level-tab-stop:none; mso-level-number-position:left; text-indent:-.25in; font-family:Wingdings;} @list l0:level7 {mso-level-number-format:bullet; mso-level-text:; mso-level-tab-stop:none; mso-level-number-position:left; text-indent:-.25in; font-family:Symbol;} @list l0:level8 {mso-level-number-format:bullet; mso-level-text:o; mso-level-tab-stop:none; mso-level-number-position:left; text-indent:-.25in; font-family:"Courier New";} @list l0:level9 {mso-level-number-format:bullet; mso-level-text:; mso-level-tab-stop:none; mso-level-number-position:left; text-indent:-.25in; font-family:Wingdings;} </style></div><div style="text-align: justify;">The FANG stocks represent great companies, but of the four, I think that Amazon has the most fearsome business model, simply because its platform of disruption and patience can be extended to almost any other business, one reason why every company should view Amazon as a potential competitor. I know that the old value adage is that if you buy quality companies and hold them forever, they will pay for themselves, but I don't believe that! There are good companies that can be bad investments and bad companies that can be terrific investments, as I <a href="http://aswathdamodaran.blogspot.com/2... in this post</a>. Amazon has fallen into the first category for much of the last five years and continues to do so, at today's market price. But good things come to those who wait, and I know that there be a time and a price at which it will be back in my portfolio.<br /><br /><span style="color: red;"><i>Post-post Update:</i> I deliberately posted this before the earnings report, and the report that came out about two hours after the post was a blockbuster, with higher revenue growth than expect, a doubling of net income and an increase in the stock price of close to $100/share in the after market. Incorporating the effects into the valuations will have to wait until the full quarterly report is available, but the biggest part of the report, for me, was the increase in Prime Membership fees to $119/year. You can modify the Amazon Prime valuation spreadsheet to reflect the increase in membership feels to $119/year (from $99/year). Doing so increases the value of Prime to almost $116 billion, increasing value per share by almost $100/share.</span></div><br /><b>YouTube Video</b><br /><iframe allow="autoplay; encrypted-media" allowfullscreen="" frameborder="0" height="315" src="https://www.youtube.com/embed/EdRsFU_..." width="560"></iframe><br /><br /><b>Data Links</b><br /><br /><ol style="text-align: left;"><li><a href="http://media.corporate-ir.net/media_f... 10K</a></li><li><a href="http://www.stern.nyu.edu/~adamodar/pc... of Amazon Retail/Media</a></li><li><a href="http://www.stern.nyu.edu/~adamodar/pc... of AWS</a></li><li><a href="http://www.stern.nyu.edu/~adamodar/pc... of Amazon Prime</a></li></ol><div><b>Related Blog Posts</b></div><div><ol style="text-align: left;"><li><a href="http://aswathdamodaran.blogspot.com/2... Amazon Prime (October 2017)</a></li><li><a href="http://aswathdamodaran.blogspot.com/2... a Paradox: Why Good (Bad) Companies can be Bad (Good) Investments!</a></li></ol></div><br /><div style="text-align: justify;"><b>Blog Posts on Tech Takedown</b></div><div><div style="text-align: justify;"><ol><li><a href="http://aswathdamodaran.blogspot.com/2... easy, go easy: The Tech Takedown!</a></li><li><a href="http://aswathdamodaran.blogspot.in/20... Friendless, But Still Formidable!</a></li><li><a href="http://aswathdamodaran.blogspot.in/20... The Future of Entertainment or House of Cards?</a></li><li><a href="https://aswathdamodaran.blogspot.com/... Soup: Google is Alpha, but where are the Bets?</a></li><li><a href="https://aswathdamodaran.blogspot.com/... Glimpses of Shoeless Joe!</a></li></ol></div></div></div>
April 19, 2018
Alphabet Soup: Google is Alpha, but where are the Bets?
In my last two posts, I looked first at the turn in the market against the FANG stocks, largely precipitated by the Facebook user data fiasco and then at the effect of the blowback on Facebook's value. I concluded that notwithstanding the likely negative consequences for the company, which include more muted revenue growth, higher costs (lower margins) and potential fines, Facebook looks like a good investment, with a value about 10% higher than its prevailing price. I argued that changes are coming from both outside (regulators and legislation) and inside (to protect data better), and these changes are unlikely to be just directed at Facebook. It is this perception that has probably led the market to mark down other companies that have built business models around user/subscriber data and in these next posts, I would like to look at the rest of the stocks in the FANG bundle and the consequences for their valuations, starting with Google in this one.
The One NumberThe value of a company is driven by a myriad of variables that encompass growth, risk and cash flows, which are the drivers of value. In a typical intrinsic valuation, there are dozens of inputs that drive value but there is one variable, that more than any other, drives value and it is critical to identify that variable early in the valuation process for three reasons:Information Focus: We live in a world where we drown in data and opinion about companies and unfocused data collection can often leave you more confused about the value of a company, rather than less. Knowing the key value driver allows you to focus your information collection around that variable, rather than get distracted by the other inputs into value.Management Questions: If you have the opportunity to question management, your questions can then also be directed at the key variable and what management is doing to deliver on that variable. Disclosure Tracking: If you are invested in a company and are tracking how it is performing, relative to your expectations, it is again easy in today's markets to get lost in the earnings report frenzy and the voluminous disclosures from companies. Having a focus allows you to zero in on the parts of the earnings report that are most relevant to value.In short, knowing what you are looking for makes it much more likely that you will find it. But how do you identify the key driver variable? In my template, I look for two characteristics:Big Value Effects: Changing your key driver variable should have large effects on the value that you estimate for a business. One of the benefits of asking what-if questions about the inputs into a valuation is that it can allow you to gauge this effect. Uncertainty about Input: If an input has large effects on value, but you feel confident about it, it is not a driver variable. Conversely, if you have made an estimate of input and are uncertain about that number, because it can change either due to management decisions or because of external forces, it is more likely to be a driver input.If you accept this characterization, there are two implications that emerge. The first is that the key value driver can and will be different for different companies; a mechanistic focus on the same input variable with every company that you value will lead you astray. The second is that there is a subjective component to your choice, and the key value driver that I identify for a company can be different from the one you choose for the same company, reflecting perhaps the different stories that we may be telling in our valuations. In my just-posted Facebook valuation, I believe that the key variable is the cost that Facebook will face to fix its data privacy problems and it manifests itself in my forecasted operating margin, which I project to fall from almost 58% down to 42%, in the next five years. Note that revenue growth may have a bigger impact on value, but in my judgement, it is the operating margin that I am most uncertain about. I will use this post to value Google and highlight what I believe is the driver variable for the company.
The Alphabet StoryIf Facebook is the wunderkind that has shaken up the online advertising business, Google is the original disruptor of this business and is by far the biggest player in that game today. It is ironic that the disruptor has become the status quo, but until there is another disruption, it is Google's targeted advertising model, in world, and its search engine and ad words that dominate this business. Google has had fewer brushes with controversy, with its data, than Facebook, partly because its data collection occurs across multiple platforms and is less visible and partly because it does have a tighter rein on its data.
1. A Short HistoryGoogle has been a rule breaker, right from its beginnings as a publicly traded company. It used a Dutch auction process for its initial public offering, rather than the more conventional bank-backed offer pricing model, and while it has had a few stumbles, its ascent has been steep: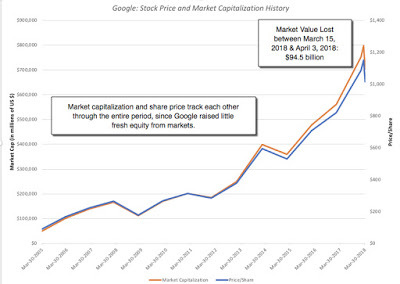
The secrets to its success are neither hard to find, nor unusual. The company has been able to scale up revenues, while preserving its operating margins: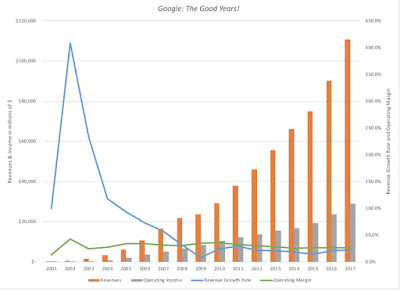
The most impressive feature of Google's operations has been its ability to maintain consistent revenue growth rates and operating margins since 2008, even as the firm more than quadrupled its revenues.
2. The State of the GameTo value Google, we start with the numbers, but in order to build a story we have to assess the landscape that Google faces.A Duopoly: The advertising business, in general, and the digital advertising business, in particular, are becoming a duopoly. In 2017, the total spent on advertising globally was $584 billion, with digital advertising accounting for $228.4 billion. Google's market share in 2017 was 42.2%, and Facebook's market share was 20.9%. Even more ominously for the rest of their competitors, they got bigger during the year, accounting for almost 84% of the increase in digital advertising during the course of the year.Google is everywhere: Google's hold on the game starts with its search engine, but has been enriched by its other products, Gmail, with more than a billion users, YouTube, which dominates the online video space and Android, the dominant smart phone operating system. If you add to this Google Maps, Google shared documents and Google Home products, the company is everywhere that you are, and is harvesting information about you at each step. During the last week, a New York Times reporter downloaded the data that Facebook had on him and while what he found disturbed him, both in terms of magnitude and type, he found that Google had far more data on him than Facebook did.Alphabet is still mostly alpha, very little bet: While Google's decision to rename itself Alphabet was motivated by a desire to let it's non-advertising businesses grow, the numbers, at least so far, indicate limited progress. In fact, if there is growth it has so far come from the apps, cloud and hardware portion of Google, rather than the bets themselves, but Nest (home automation), Waymo (driverless cars), Verily (life sciences) and Google Fiber (broadband internet) are options that may (or may) not pay off big time.
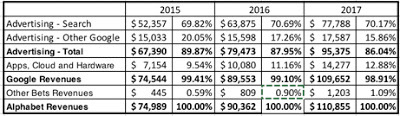 Google 2017 10K
The bottom line is that Google has changed the advertising business and dominates it, with Facebook representing its only serious competition. It's large market share should act as a check on its growth, but Google has been able to sustain double digit growth by growing the digital portion of the advertising business and claiming the lion's share of that growth, again with Facebook. The wild card is whether the data privacy restrictions and regulations that are coming will crimp one or both companies in their pursuit of ad revenues. As digital advertising starts to level off, Google will have to look to its other businesses to provide it a boost.
3. The ValuationAs with Facebook, I was a doubter on the scalability of the Google story, but it has proved me wrong, over and over again. In valuing Google, I will assume that it will continue to grow, but I set the revenue growth rate at 12% for the next five years, below the 15% growth rate registered in the last five, for two reasons. The first is that digital advertising's rise has started to slow, simply because it is now such a large part of the overall advertising market. The second is that data privacy restrictions, if restrictive, will take away one of Google's network benefits. I do think that the profitability of Google's businesses will stay intact over time, with operating margins staying at the 27.87% recorded in 2017. With those key assumptions, I value Google at $970, close to the price of $1030 that it was trading at on April 13.
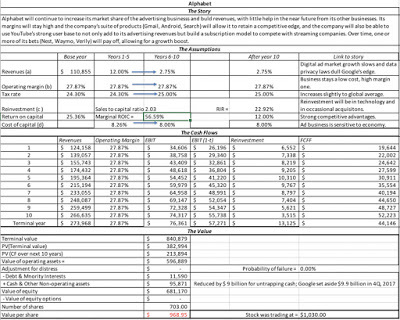 Download spreadsheetAs with my Facebook valuation, each of my key inputs is estimated with error, and capturing that uncertainty in distributions yields the following outcomes:
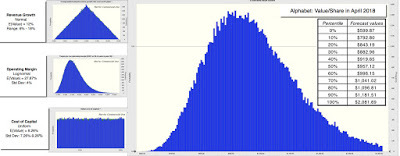 Crystal Ball used in simulationNo surprises here. The median value is about $957 and at a stock price of $1.030, there is a 65% chance that the stock is over valued. As with Facebook, there is a positive skew in the outcomes, and that skew will get only more positive, if you build in a bigger payoff from one of the bets. I have never been a Google shareholder, and that has cost me lost returns over time, but this is as close as I have ever been to owning the stock. My only concern, assuming that Google goes to $950 or lower in the near future would be that since I already own Facebook, I will be over invested in digital advertising's future success
4. The Value DriverGoogle's value is driven by revenue growth and operating margins, and changing one or both inputs has a significant effect on value.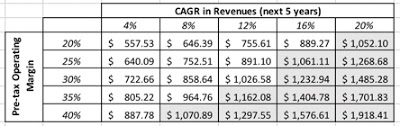 The shaded cells represent the combinations that deliver values higher than the prevailing stock price of $1,030/share. In my judgment, Alphabet's bigger value driver is revenue growth, not margins, and it is on that input, this valuation will rise of fall. It is my view that while data privacy restrictions will translate into much higher costs for Facebook, partly because it has so little structure currently, it will result in lower growth for Alphabet. If the data privacy restrictions handicap Google so badly that it loses a big part of what has allowed it to dominate digital advertising for the next five years, Google's revenue growth and value will drop dramatically. However, Google is just starting to tap the potential in YouTube, and if it is able to position it as a competitor to Spotify, in music streaming, and Netflix, in video streaming, it could discover a new source of revenue growth, with strong operating margins.
YouTube Video
Data LinksGoogle Valuation - April 2018Blog Posts on Tech TakedownCome easy, go easy: The Tech Takedown!Facebook: Friendless, But Still Formidable!Netflix: The Future of Entertainment or House of Cards?Alphabet Soup: Google is Alpha, but where are the Bets?Amazon: Glimpses of Shoeless Joe!
The One NumberThe value of a company is driven by a myriad of variables that encompass growth, risk and cash flows, which are the drivers of value. In a typical intrinsic valuation, there are dozens of inputs that drive value but there is one variable, that more than any other, drives value and it is critical to identify that variable early in the valuation process for three reasons:Information Focus: We live in a world where we drown in data and opinion about companies and unfocused data collection can often leave you more confused about the value of a company, rather than less. Knowing the key value driver allows you to focus your information collection around that variable, rather than get distracted by the other inputs into value.Management Questions: If you have the opportunity to question management, your questions can then also be directed at the key variable and what management is doing to deliver on that variable. Disclosure Tracking: If you are invested in a company and are tracking how it is performing, relative to your expectations, it is again easy in today's markets to get lost in the earnings report frenzy and the voluminous disclosures from companies. Having a focus allows you to zero in on the parts of the earnings report that are most relevant to value.In short, knowing what you are looking for makes it much more likely that you will find it. But how do you identify the key driver variable? In my template, I look for two characteristics:Big Value Effects: Changing your key driver variable should have large effects on the value that you estimate for a business. One of the benefits of asking what-if questions about the inputs into a valuation is that it can allow you to gauge this effect. Uncertainty about Input: If an input has large effects on value, but you feel confident about it, it is not a driver variable. Conversely, if you have made an estimate of input and are uncertain about that number, because it can change either due to management decisions or because of external forces, it is more likely to be a driver input.If you accept this characterization, there are two implications that emerge. The first is that the key value driver can and will be different for different companies; a mechanistic focus on the same input variable with every company that you value will lead you astray. The second is that there is a subjective component to your choice, and the key value driver that I identify for a company can be different from the one you choose for the same company, reflecting perhaps the different stories that we may be telling in our valuations. In my just-posted Facebook valuation, I believe that the key variable is the cost that Facebook will face to fix its data privacy problems and it manifests itself in my forecasted operating margin, which I project to fall from almost 58% down to 42%, in the next five years. Note that revenue growth may have a bigger impact on value, but in my judgement, it is the operating margin that I am most uncertain about. I will use this post to value Google and highlight what I believe is the driver variable for the company.
The Alphabet StoryIf Facebook is the wunderkind that has shaken up the online advertising business, Google is the original disruptor of this business and is by far the biggest player in that game today. It is ironic that the disruptor has become the status quo, but until there is another disruption, it is Google's targeted advertising model, in world, and its search engine and ad words that dominate this business. Google has had fewer brushes with controversy, with its data, than Facebook, partly because its data collection occurs across multiple platforms and is less visible and partly because it does have a tighter rein on its data.
1. A Short HistoryGoogle has been a rule breaker, right from its beginnings as a publicly traded company. It used a Dutch auction process for its initial public offering, rather than the more conventional bank-backed offer pricing model, and while it has had a few stumbles, its ascent has been steep:
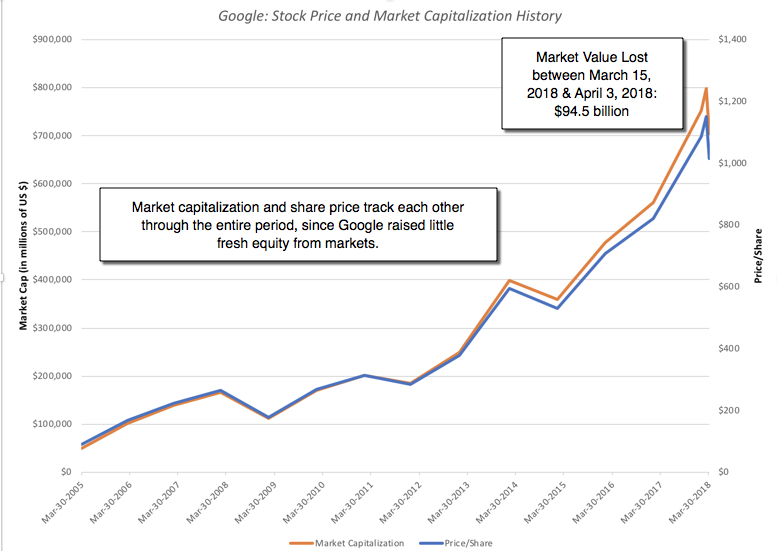
The secrets to its success are neither hard to find, nor unusual. The company has been able to scale up revenues, while preserving its operating margins:
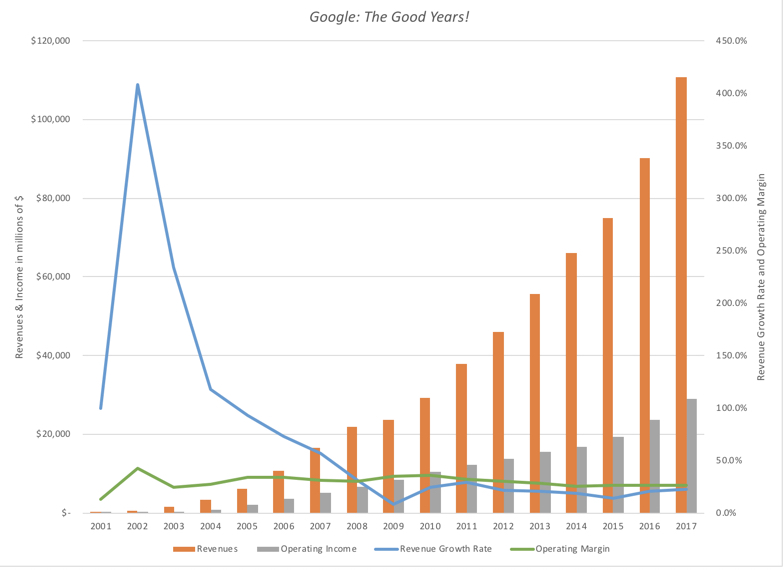
The most impressive feature of Google's operations has been its ability to maintain consistent revenue growth rates and operating margins since 2008, even as the firm more than quadrupled its revenues.
2. The State of the GameTo value Google, we start with the numbers, but in order to build a story we have to assess the landscape that Google faces.A Duopoly: The advertising business, in general, and the digital advertising business, in particular, are becoming a duopoly. In 2017, the total spent on advertising globally was $584 billion, with digital advertising accounting for $228.4 billion. Google's market share in 2017 was 42.2%, and Facebook's market share was 20.9%. Even more ominously for the rest of their competitors, they got bigger during the year, accounting for almost 84% of the increase in digital advertising during the course of the year.Google is everywhere: Google's hold on the game starts with its search engine, but has been enriched by its other products, Gmail, with more than a billion users, YouTube, which dominates the online video space and Android, the dominant smart phone operating system. If you add to this Google Maps, Google shared documents and Google Home products, the company is everywhere that you are, and is harvesting information about you at each step. During the last week, a New York Times reporter downloaded the data that Facebook had on him and while what he found disturbed him, both in terms of magnitude and type, he found that Google had far more data on him than Facebook did.Alphabet is still mostly alpha, very little bet: While Google's decision to rename itself Alphabet was motivated by a desire to let it's non-advertising businesses grow, the numbers, at least so far, indicate limited progress. In fact, if there is growth it has so far come from the apps, cloud and hardware portion of Google, rather than the bets themselves, but Nest (home automation), Waymo (driverless cars), Verily (life sciences) and Google Fiber (broadband internet) are options that may (or may) not pay off big time.
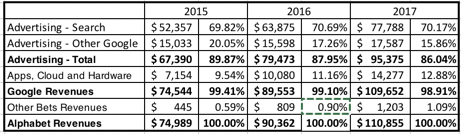 Google 2017 10K
The bottom line is that Google has changed the advertising business and dominates it, with Facebook representing its only serious competition. It's large market share should act as a check on its growth, but Google has been able to sustain double digit growth by growing the digital portion of the advertising business and claiming the lion's share of that growth, again with Facebook. The wild card is whether the data privacy restrictions and regulations that are coming will crimp one or both companies in their pursuit of ad revenues. As digital advertising starts to level off, Google will have to look to its other businesses to provide it a boost.
3. The ValuationAs with Facebook, I was a doubter on the scalability of the Google story, but it has proved me wrong, over and over again. In valuing Google, I will assume that it will continue to grow, but I set the revenue growth rate at 12% for the next five years, below the 15% growth rate registered in the last five, for two reasons. The first is that digital advertising's rise has started to slow, simply because it is now such a large part of the overall advertising market. The second is that data privacy restrictions, if restrictive, will take away one of Google's network benefits. I do think that the profitability of Google's businesses will stay intact over time, with operating margins staying at the 27.87% recorded in 2017. With those key assumptions, I value Google at $970, close to the price of $1030 that it was trading at on April 13.
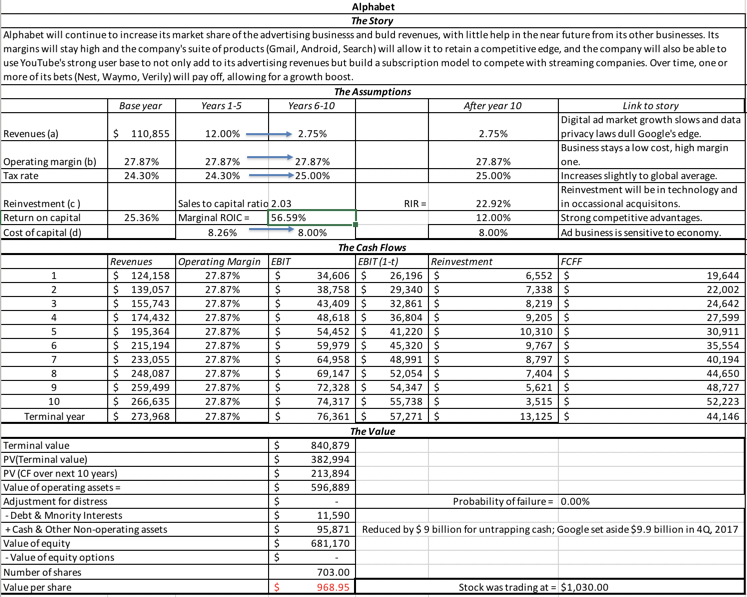 Download spreadsheetAs with my Facebook valuation, each of my key inputs is estimated with error, and capturing that uncertainty in distributions yields the following outcomes:
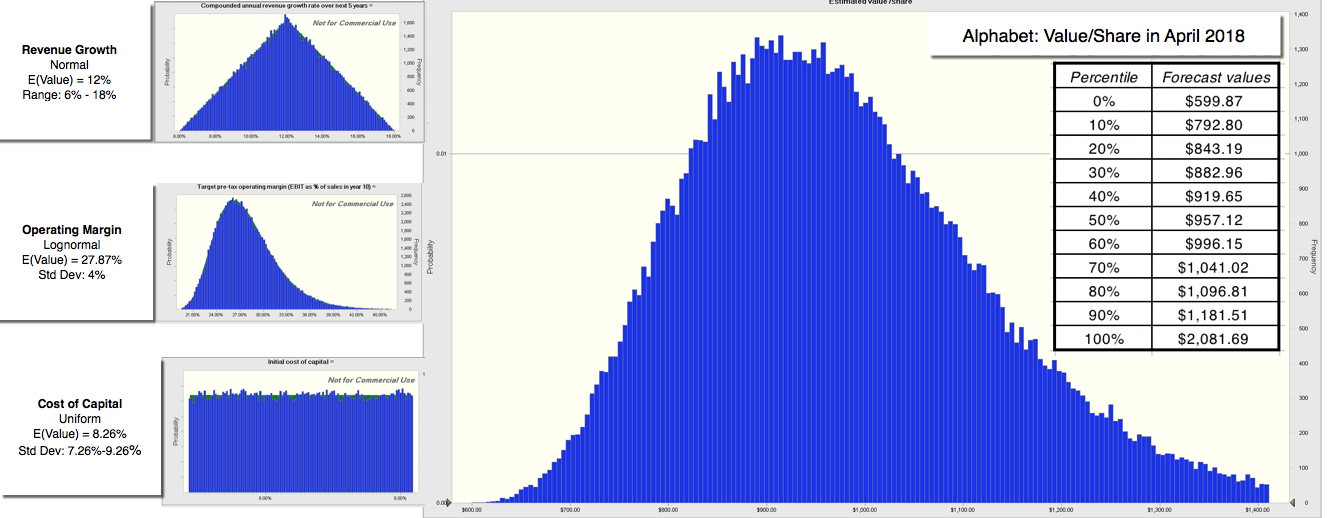 Crystal Ball used in simulationNo surprises here. The median value is about $957 and at a stock price of $1.030, there is a 65% chance that the stock is over valued. As with Facebook, there is a positive skew in the outcomes, and that skew will get only more positive, if you build in a bigger payoff from one of the bets. I have never been a Google shareholder, and that has cost me lost returns over time, but this is as close as I have ever been to owning the stock. My only concern, assuming that Google goes to $950 or lower in the near future would be that since I already own Facebook, I will be over invested in digital advertising's future success
4. The Value DriverGoogle's value is driven by revenue growth and operating margins, and changing one or both inputs has a significant effect on value.
 The shaded cells represent the combinations that deliver values higher than the prevailing stock price of $1,030/share. In my judgment, Alphabet's bigger value driver is revenue growth, not margins, and it is on that input, this valuation will rise of fall. It is my view that while data privacy restrictions will translate into much higher costs for Facebook, partly because it has so little structure currently, it will result in lower growth for Alphabet. If the data privacy restrictions handicap Google so badly that it loses a big part of what has allowed it to dominate digital advertising for the next five years, Google's revenue growth and value will drop dramatically. However, Google is just starting to tap the potential in YouTube, and if it is able to position it as a competitor to Spotify, in music streaming, and Netflix, in video streaming, it could discover a new source of revenue growth, with strong operating margins.
YouTube Video
Data LinksGoogle Valuation - April 2018Blog Posts on Tech TakedownCome easy, go easy: The Tech Takedown!Facebook: Friendless, But Still Formidable!Netflix: The Future of Entertainment or House of Cards?Alphabet Soup: Google is Alpha, but where are the Bets?Amazon: Glimpses of Shoeless Joe!
April 16, 2018
Netflix: The Future of Entertainment or House of Cards?
For better or worse, Netflix has changed not just the entertainment business, but also the way that we (the audience) watch television. In the process, it has also enriched its investors, as its market capitalization climbed to $139 billion in March 2018 and even after the market correction for the FANG stocks, its value is substantial enough to make it one of the largest entertainment company in the world. Among the FANG stocks, with their gigantic market capitalizations, it remains the smallest company on both market value and operating metrics, but it has almost as big an impact on our daily lives as its larger peers.
The History
This may come as a surprise to some, but Netflix has been publicly listed for longer than Facebook or Google. The difference between Netflix and these companies is that it’s climb to stardom has taken more time.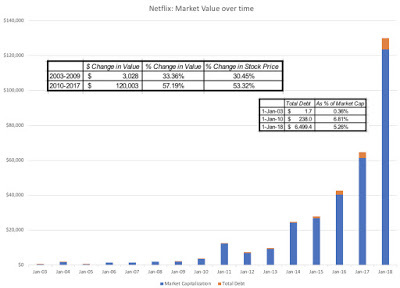
Don't get me wrong! Netflix was a very good investment between 2003 and 2009, increasing its market capitalization by 33.36% a year and its market capitalization by about $3 billion, during that period. However, it became a superstar investment between 2010 and 2017, adding about $120 billion in value over the period, translating into an annual price appreciation of more than 50% a year.
The fuel that Netflix has used to increase its market capitalization is its subscriber base, as with the other FANG stocks, the company seems to have found the secret to be able to scale up, as it gets larger. That subscriber base, in turn, has allowed the company to increase its revenues over time, as can be seen in the picture below, summarizing Netflix’s operating metrics.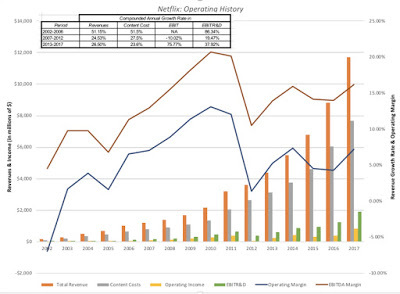
You can accuse me of over analyzing this chart, but it captures to me the essence of the Netflix success story. While Netflix has been able to grow revenues in each of the three consecutive five-year time periods, 2002-2006, 2007-2012 and 2013-2017, that it has been existence, the company has been faced with challenges during each period, and it has adapted. DVDs in the Mail: In the first five-year period, 2002 through 2006, the company mailed out DVDs and videos to its subscribers, challenging the video rental business, where brick and mortar video rental stores represented the status quo, and Blockbuster was the dominant player. The Rise of Streaming: It was between 2007 and 2012, where the company came into its own, as it took advantage of changes in technology and in customer preferences. First, as technology evolved to allow for the streaming of movies, Netflix adapted, with a few rough spots, to the new technology, while its brick and mortar competitors imploded. Second, while Netflix saw a drop in revenue growth that was not unexpected, given its larger base, it also saw its content costs rise at a faster rate than revenues, as content providers (the movie studios) starting charging higher prices for content. The Content Maker: In hindsight, the studios probably wish that they had not squeezed Netflix, because the company reacted by taking more control of its own destiny in the 2013-2017 time period, by shifting to original content, first with television series and later with direct-to-streaming movies. The results have upended the entertainment business, but more critically for Netflix, they show up in a critical statistic. For the first time in its existence, Netflix saw content costs rise at a rate slower than its growth in revenues, with operating profit margins, both before and after R&D reflecting this development. The State of the GameWe can debate whether Netflix is a good or a bad investment, but there is no argument that the way movies and television get made has been changed by the company’s practices. It is the rest of the entertainment business that is trying to adapt to the Netflix streaming model, as evidenced by Disney’s acquisition of BAM Media and Fox Entertainment. If I were to summarize where Netflix stands right now, here would be my key points:1. It's a big spender on content: In 2017, Netflix spent billions on the content that it delivers to its subscribers, and the extent of its spending can be seen in its financial statements. The way that Netflix accounts for its content expenditures does complicate the measurement, since it uses two different accounting standards, one for licensed content and one for productions, but it capitalizes and amortizes both, albeit on different schedules, and based upon viewing patterns. The gap between the accrual (or amortized) cost (shown in the income statement) and the cash spent (shown in the statement of cash flows) on content can be seen in the graph below.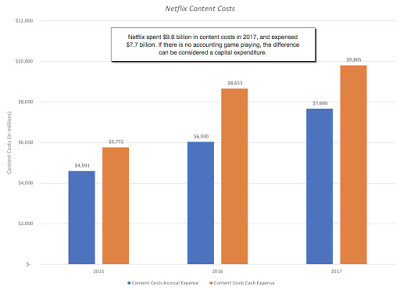 Netflix 10K - 2017In 2017, Netflix spent almost $9.8 billion on content, though it expensed only $7.7 billion in its income statement. If this divergence continues, and there is no reason to believe that it will not, Netflix’s profits will be more positive than their cash flows by a substantial amount. Note that this divergence should not be taken (necessarily) as a sign of deception or accounting game playing. In fact, if Netflix is being reasonable in its amortization judgments, one way to read the difference of $2.14 billion ($9.8 in cash expenses minus $7.66 billion in accrual expenses) is to view it as the equivalent of capital expenditures at Netflix, since it is expense incurred to attract and keep subscribers.2. An increasing amount of that spending goes to original content: The decision by Netflix to produce some of its own content in 2013 triggered a shift towards original content that has picked up speed since that year. In 2017, the company spent $6.3 billion on original content, putting it among the top spenders in the entertainment business:
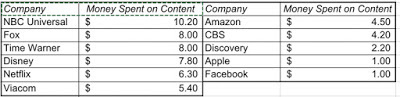 Biggest Spenders on Entertainment Content in 2017The pace is not letting up. In the first quarter of 2018, Netflix introduced 18 new television series and delivered 12 new seasons of existing series, prodigious output by any studio’s standards. There are three reasons for the Netflix move into the content business. The first, referenced in the last section, is to gain more control over content costs and to be less exposed to movie studio price hikes. The second is that Netflix has been using the data that it has on subscriber tastes not only to direct content at them, but to produce new content that is tailored to viewer demands.The third is that it introduces stickiness into their business model, a key reason why new subscribers come to the company and why existing subscribers are reluctant to abandon it, even if subscription fees go up.Netflix has moved beyond television shows to making straight-to-streaming movies, spending $90 million on Bright, a movie that notwithstanding its lackluster reviews, signaled the company’s ambitions to be a major player in the movie business.3. Netflix has been adept at playing the expectations game: One feature that all of the FANG stocks trade is that rather than let equity research analysts frame their stories and measure their success, they have managed to frame their own stories and make investors and analysts play on their terms. Netflix, for instance, has managed to make the expectations game all about subscriber numbers, and every earnings report of the company is framed around these numbers, with less attention paid to content costs, churn rates and negative cash flows. After its most recent earnings report in January, the stock price surged, as the company reported an increase of 8.3 million in subscribers, well above expectations. 4. The company is globalizing: One consequence of making it a numbers game, which is what Netflix has done by keeping the focus on subscribers, is that you have to go where the numbers are, and for better or worse, that has meant that Netflix has had to go global, with Asia being the mother lode.
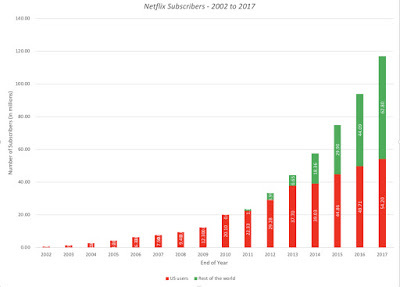 [image error]
At the end of 2017, Netflix had more subscribers outside the US than in the US, and it is bringing its free spending ways and its views on content development to other parts of the world, perhaps bringing Bollywood and Hollywood closer, at least in terms of shared problems.
In summary, Netflix has built a business model of spending immense amounts on content, using that content to attract new subscribers, and then using those new subscribers as its pathway to market value. It is clear that investors have bought into the model, but the model is also one that burns through cash at alarming rates, with no smooth or near term escape hatch.
The Valuation
In keeping with the focus on subscriber numbers that is at the center of the Netflix story, I will value Netflix with the subscriber-based approach that I used to value Spotify a few weeks ago and Uber and Amazon Prime last year.
Cost Breakdown
The key to getting a subscriber-based valuation of Netflix is to first break its overall costs down into (a) costs for servicing existing subscribers, (b) the cost of acquiring new subscribers and (c) a corporate cost that cannot be directly related to either servicing existing subscribers or getting new ones. I started with the Netflix 2017 income statement: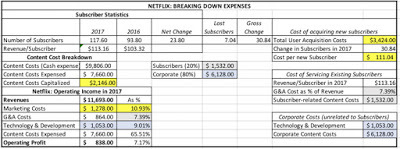
Since Netflix does not break its costs down into my preferred components I made subjective judgments in allocating these costs, treating G&A costs as expenses related to servicing existing subscribers and marketing costs as the costs of acquiring new subscribers. With content costs, I started first with the $2,146 million difference between the cash content cost and expensed content cost and treated it also as part of the cost of acquiring new subscribers. With the expensed content cost of $7,600 million, I assumed that only 20% of these costs are directly related to subscribers and treated that portion as part of the cost of servicing existing subscribers and that the remaining 80% would become part of the corporate cost, in conjunction with the investment in technology and development. One key difference between the Netflix and Spotify cost models is that most of the content costs are fixed corporate costs for Netflix but almost all content costsare variable costs for Spotify, since it pays for content based upon how its subscribers listen to it, rather than as a fixed fee.
Value of an Existing Subscribers
My decision to treat most of the content content costs as a corporate cost has predictable consequences. The costs associated with individual subscribers are only the G&A costs and 20% of content costs, and the number is small, relative to the revenues that Netflix generates per subscriber: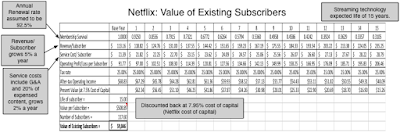 Download spreadsheet[image error]
A strength that Netflix has built, perhaps with its original content, is that it has reduced it's churn rate (the loss of existing customers), each year since 2015. In 2017, the annual renewal rate for a Netflix subscription was about 91%, and that number improved even more across the four quarters. In my subscriber-valuation, I have used a 92.5% renewal rate, for the life of a subscriber, assumed to be 15 years. I will assume that Netflix investments in original content will give it the pricing power to increase annual revenue per subscriber (G&A and the 20% of content costs), which was $113.16 in 2017, at 5% a year, while keeping the growth rate in annual expenses per subscriber at the inflation rate of 2%. I estimate after-tax operating income each year, using a global average tax rate of 25%, and discount it back at a 7.95% cost of capital (estimated for Netflix, based upon its business and geographic mix, and debt ratio) to derive a value of $508.89 subscriber and a total value of $59.8 billion for Netflix’s 117.6 million existing subscribers.
Value of New Subscribers
To value a new subscriber, I first estimated the total cost that Netflix spent on adding new subscribers by adding the total marketing costs of $1,278 million to the capitalized portion of the content costs of $2,142 million, and then divided this amount by the gross increase in the number of subscribers (30.84 million) during 2017, to obtain a cost of $111.01 for acquiring a new subscriber. I then net that number out from the value of an existing subscriber to arrive at a value of $397.88/new subscriber right now; I assume that this value will increase at the inflation rate over time.
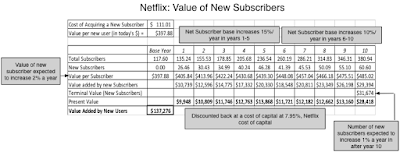 Download spreadsheet[image error]
I assume that Netflix will continue to add new subscribers, adding 15% to its net subscriber rolls, each year for the first five years, and 10% a year for years 6 through 10, before settling into a steady state growth rate of 1% a year. Discounting the value added by new subscribers at a higher cost of capital of 8.5%, reflecting the greater uncertainty associated with new subscribers, yields a total value of $137.3 billion for new subscribers.
The Corporate Drag
The final piece of the puzzle is to bring in the corporate costs that we assumed could not be directly linked with subscriber count. In the case of Netflix, the technology & development costs and 80% of the expensed content, that we put into this corporate cost category amounted to $6.13 billion in 2017 and the path that these costs follow in the future will determine the value that we attach to the company.
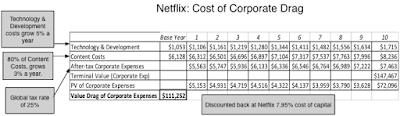 Download spreadsheet
I assume that technology & development costs will grow 5% a year, but it is on the content cost component that I struggled the most to estimate a growth rate. I decided that the accelerated spending that Netflix had in 2017 and continued to have in 2018 reflect Netflix’s attempt to acquire standing in the business, and that while it will continue to spend large amounts on content, the growth rate in this portion of the content costs will drop to 3% a year, for the next 10 years. Note that even with that low growth rate, Netflix will be consistently among the top five spenders in the content business, spending more than $100 billion on original content over the next ten years. Discounting back the after-tax corporate expenses back at the 7.95% cost of capital, yields a corporate cost drag of $111.3 billion.
The Netflix Valuation: The One Number
To value Netflix, I bring together the value of existing and new subscribers and net out the corporate cost drag. I also subtract out the $6.5 billion in debt that the company has outstanding and the value of equity options granted over time to its employees.
 Download spreadsheetThe value per share of $172.82 that I estimate for Netflix is well below the stock price of $275, as of April 14, 2018. My value reflects the story that I am telling about Netflix, as a company that is able to grow at double digit rates for the next decade, with high value added with new users, while bringing its content costs under control. I am sure that your views on the company will diverge from mine, and you are welcome to use my Netflix subscriber valuation template to come to your own conclusions.
It is worth taking a pause, and considering the differences between Netflix and Spotify, both subscription-based business models, that draw their value from immense subscriber bases.
By paying for its content, both licensed and original, and using that content to go after subscribers, Netflix has built a more levered business model, where subscribers, both new and existing, have higher marginal value than at Spotify, where content costs are tied to subscribers listening to music. The Netflix model, which is increasingly built around original rather than licensed content, provides for a stronger competitive edge, which should show up in higher renewal rates and more pricing power, adding to the value per subscriber, both existing and new. The Netflix model will deliver higher value from subscription growth than the Spotify model, but it comes with a greater downside, because a slackening of that growth will leave Netflix much deeper in the hole, with more negative cash flows, than it would Spotify. Now that both companies are listed and traded, it will be interesting to see whether this plays out as much larger market reactions to subscription number surprises, both positive and negative, at Netflix than at Spotify.
In my earlier post on Google, I noted that every company has a value driver, one number that more than any of the others determines value. In the case of Netflix, the key value driver, in my view, is content costs. My value per share is premised not just on high growth in subscribers and continued subscriber value, but also on content costs growing at a much lower rate (of 3%) in the future. To illustrate the sensitivity of value per share to this assumption, I varied the growth rate in content costs and calculated value per share: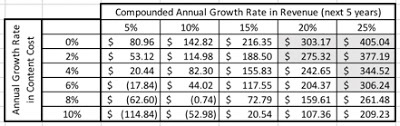 To illustrate the dangers to Netflix of letting content costs grow at high rates, note that the company’s equity value becomes negative (i.e., the company goes bankrupt), if content costs grow at high rates, relative to revenue growth, with double digit growth rates creating catastrophic effects. If Netflix is able to cap the costs at 2017 levels in perpetuity, the estimated value per share is approximately $216, at the base case growth rate of 15%, and if it is able to reduce content costs in absolute terms over time, it is worth even more. In my view, investing in Netflix is less a bet on the company being able to deliver subscriber and/or revenue growth in the future and more one on the future path of content costs at the company.
The Decision
There is no doubt that Netflix has changed the way we watch television and the movies, and it is changing the movie/TV business in significant ways. By competing for talent in the content business, it is pushing up costs for its competitors and with its direct-to-streaming model, putting pressure on movie theaters and distribution. That said, the entertainment business remains a daunting one, because the talent is expensive and unpredictable, and egos run rampant. The history of newcomers who have come into this business with open wallets is that they leave with empty ones. For Netflix to escape this fate, it has to show discipline in controlling content costs, and until I see evidence that it is capable of this discipline, I will remain a subscriber, but not an investor in the company.
YouTube Video
Data LinksValuation of Netflix - April 2018Blog Posts on Tech TakedownCome easy, go easy: The Tech Takedown!Facebook: Friendless, But Still Formidable!Alphabet Soup: Mostly Google, but where are the bets?Amazon: Glimpses of Shoeless Joe!Netflix: Entertainment's Future?
The History
This may come as a surprise to some, but Netflix has been publicly listed for longer than Facebook or Google. The difference between Netflix and these companies is that it’s climb to stardom has taken more time.

Don't get me wrong! Netflix was a very good investment between 2003 and 2009, increasing its market capitalization by 33.36% a year and its market capitalization by about $3 billion, during that period. However, it became a superstar investment between 2010 and 2017, adding about $120 billion in value over the period, translating into an annual price appreciation of more than 50% a year.
The fuel that Netflix has used to increase its market capitalization is its subscriber base, as with the other FANG stocks, the company seems to have found the secret to be able to scale up, as it gets larger. That subscriber base, in turn, has allowed the company to increase its revenues over time, as can be seen in the picture below, summarizing Netflix’s operating metrics.
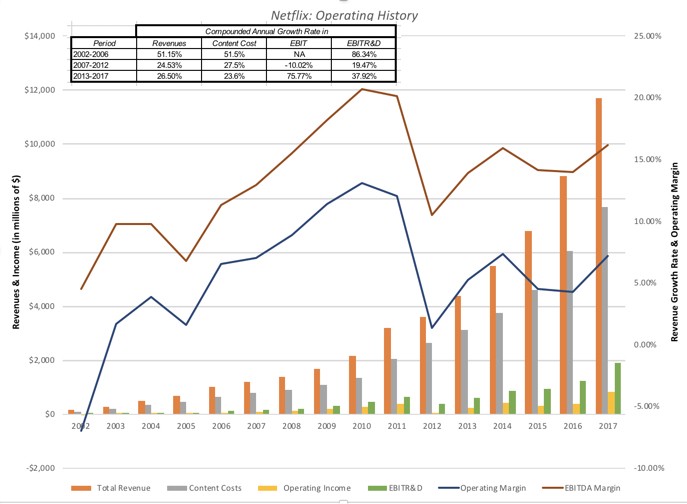
You can accuse me of over analyzing this chart, but it captures to me the essence of the Netflix success story. While Netflix has been able to grow revenues in each of the three consecutive five-year time periods, 2002-2006, 2007-2012 and 2013-2017, that it has been existence, the company has been faced with challenges during each period, and it has adapted. DVDs in the Mail: In the first five-year period, 2002 through 2006, the company mailed out DVDs and videos to its subscribers, challenging the video rental business, where brick and mortar video rental stores represented the status quo, and Blockbuster was the dominant player. The Rise of Streaming: It was between 2007 and 2012, where the company came into its own, as it took advantage of changes in technology and in customer preferences. First, as technology evolved to allow for the streaming of movies, Netflix adapted, with a few rough spots, to the new technology, while its brick and mortar competitors imploded. Second, while Netflix saw a drop in revenue growth that was not unexpected, given its larger base, it also saw its content costs rise at a faster rate than revenues, as content providers (the movie studios) starting charging higher prices for content. The Content Maker: In hindsight, the studios probably wish that they had not squeezed Netflix, because the company reacted by taking more control of its own destiny in the 2013-2017 time period, by shifting to original content, first with television series and later with direct-to-streaming movies. The results have upended the entertainment business, but more critically for Netflix, they show up in a critical statistic. For the first time in its existence, Netflix saw content costs rise at a rate slower than its growth in revenues, with operating profit margins, both before and after R&D reflecting this development. The State of the GameWe can debate whether Netflix is a good or a bad investment, but there is no argument that the way movies and television get made has been changed by the company’s practices. It is the rest of the entertainment business that is trying to adapt to the Netflix streaming model, as evidenced by Disney’s acquisition of BAM Media and Fox Entertainment. If I were to summarize where Netflix stands right now, here would be my key points:1. It's a big spender on content: In 2017, Netflix spent billions on the content that it delivers to its subscribers, and the extent of its spending can be seen in its financial statements. The way that Netflix accounts for its content expenditures does complicate the measurement, since it uses two different accounting standards, one for licensed content and one for productions, but it capitalizes and amortizes both, albeit on different schedules, and based upon viewing patterns. The gap between the accrual (or amortized) cost (shown in the income statement) and the cash spent (shown in the statement of cash flows) on content can be seen in the graph below.
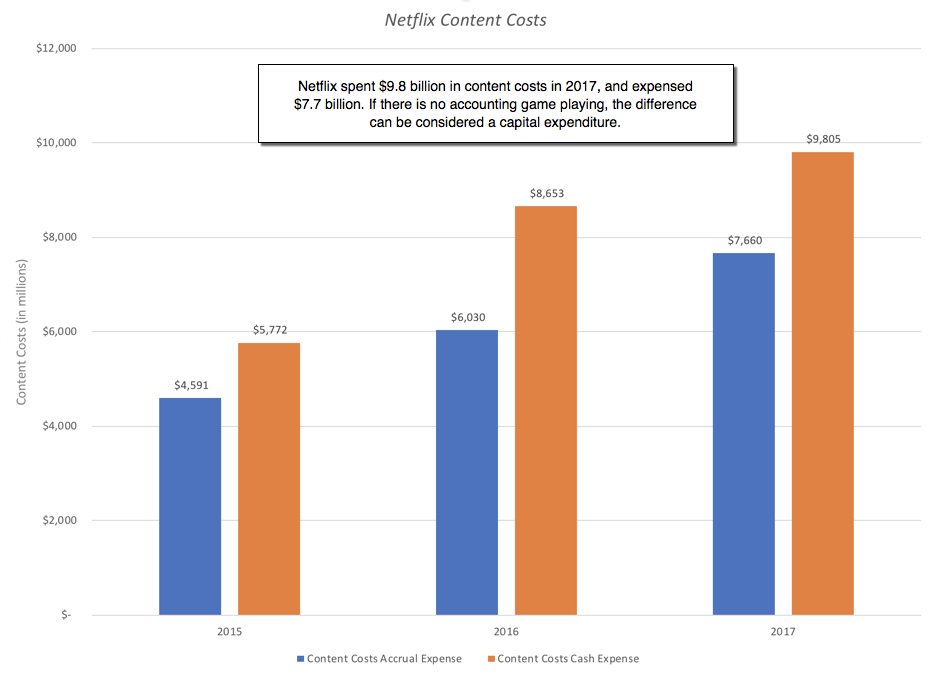 Netflix 10K - 2017In 2017, Netflix spent almost $9.8 billion on content, though it expensed only $7.7 billion in its income statement. If this divergence continues, and there is no reason to believe that it will not, Netflix’s profits will be more positive than their cash flows by a substantial amount. Note that this divergence should not be taken (necessarily) as a sign of deception or accounting game playing. In fact, if Netflix is being reasonable in its amortization judgments, one way to read the difference of $2.14 billion ($9.8 in cash expenses minus $7.66 billion in accrual expenses) is to view it as the equivalent of capital expenditures at Netflix, since it is expense incurred to attract and keep subscribers.2. An increasing amount of that spending goes to original content: The decision by Netflix to produce some of its own content in 2013 triggered a shift towards original content that has picked up speed since that year. In 2017, the company spent $6.3 billion on original content, putting it among the top spenders in the entertainment business:
 Biggest Spenders on Entertainment Content in 2017The pace is not letting up. In the first quarter of 2018, Netflix introduced 18 new television series and delivered 12 new seasons of existing series, prodigious output by any studio’s standards. There are three reasons for the Netflix move into the content business. The first, referenced in the last section, is to gain more control over content costs and to be less exposed to movie studio price hikes. The second is that Netflix has been using the data that it has on subscriber tastes not only to direct content at them, but to produce new content that is tailored to viewer demands.The third is that it introduces stickiness into their business model, a key reason why new subscribers come to the company and why existing subscribers are reluctant to abandon it, even if subscription fees go up.Netflix has moved beyond television shows to making straight-to-streaming movies, spending $90 million on Bright, a movie that notwithstanding its lackluster reviews, signaled the company’s ambitions to be a major player in the movie business.3. Netflix has been adept at playing the expectations game: One feature that all of the FANG stocks trade is that rather than let equity research analysts frame their stories and measure their success, they have managed to frame their own stories and make investors and analysts play on their terms. Netflix, for instance, has managed to make the expectations game all about subscriber numbers, and every earnings report of the company is framed around these numbers, with less attention paid to content costs, churn rates and negative cash flows. After its most recent earnings report in January, the stock price surged, as the company reported an increase of 8.3 million in subscribers, well above expectations. 4. The company is globalizing: One consequence of making it a numbers game, which is what Netflix has done by keeping the focus on subscribers, is that you have to go where the numbers are, and for better or worse, that has meant that Netflix has had to go global, with Asia being the mother lode.
 [image error]
At the end of 2017, Netflix had more subscribers outside the US than in the US, and it is bringing its free spending ways and its views on content development to other parts of the world, perhaps bringing Bollywood and Hollywood closer, at least in terms of shared problems.
In summary, Netflix has built a business model of spending immense amounts on content, using that content to attract new subscribers, and then using those new subscribers as its pathway to market value. It is clear that investors have bought into the model, but the model is also one that burns through cash at alarming rates, with no smooth or near term escape hatch.
The Valuation
In keeping with the focus on subscriber numbers that is at the center of the Netflix story, I will value Netflix with the subscriber-based approach that I used to value Spotify a few weeks ago and Uber and Amazon Prime last year.
Cost Breakdown
The key to getting a subscriber-based valuation of Netflix is to first break its overall costs down into (a) costs for servicing existing subscribers, (b) the cost of acquiring new subscribers and (c) a corporate cost that cannot be directly related to either servicing existing subscribers or getting new ones. I started with the Netflix 2017 income statement:

Since Netflix does not break its costs down into my preferred components I made subjective judgments in allocating these costs, treating G&A costs as expenses related to servicing existing subscribers and marketing costs as the costs of acquiring new subscribers. With content costs, I started first with the $2,146 million difference between the cash content cost and expensed content cost and treated it also as part of the cost of acquiring new subscribers. With the expensed content cost of $7,600 million, I assumed that only 20% of these costs are directly related to subscribers and treated that portion as part of the cost of servicing existing subscribers and that the remaining 80% would become part of the corporate cost, in conjunction with the investment in technology and development. One key difference between the Netflix and Spotify cost models is that most of the content costs are fixed corporate costs for Netflix but almost all content costsare variable costs for Spotify, since it pays for content based upon how its subscribers listen to it, rather than as a fixed fee.
Value of an Existing Subscribers
My decision to treat most of the content content costs as a corporate cost has predictable consequences. The costs associated with individual subscribers are only the G&A costs and 20% of content costs, and the number is small, relative to the revenues that Netflix generates per subscriber:
 Download spreadsheet[image error]
A strength that Netflix has built, perhaps with its original content, is that it has reduced it's churn rate (the loss of existing customers), each year since 2015. In 2017, the annual renewal rate for a Netflix subscription was about 91%, and that number improved even more across the four quarters. In my subscriber-valuation, I have used a 92.5% renewal rate, for the life of a subscriber, assumed to be 15 years. I will assume that Netflix investments in original content will give it the pricing power to increase annual revenue per subscriber (G&A and the 20% of content costs), which was $113.16 in 2017, at 5% a year, while keeping the growth rate in annual expenses per subscriber at the inflation rate of 2%. I estimate after-tax operating income each year, using a global average tax rate of 25%, and discount it back at a 7.95% cost of capital (estimated for Netflix, based upon its business and geographic mix, and debt ratio) to derive a value of $508.89 subscriber and a total value of $59.8 billion for Netflix’s 117.6 million existing subscribers.
Value of New Subscribers
To value a new subscriber, I first estimated the total cost that Netflix spent on adding new subscribers by adding the total marketing costs of $1,278 million to the capitalized portion of the content costs of $2,142 million, and then divided this amount by the gross increase in the number of subscribers (30.84 million) during 2017, to obtain a cost of $111.01 for acquiring a new subscriber. I then net that number out from the value of an existing subscriber to arrive at a value of $397.88/new subscriber right now; I assume that this value will increase at the inflation rate over time.
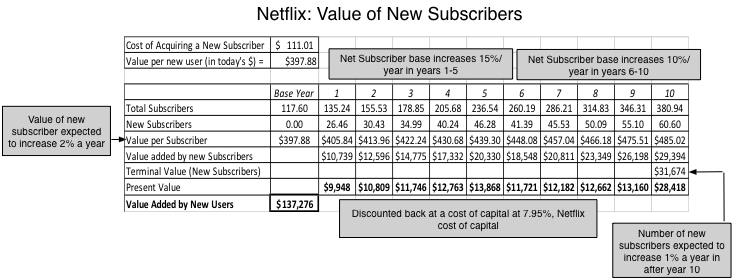 Download spreadsheet[image error]
I assume that Netflix will continue to add new subscribers, adding 15% to its net subscriber rolls, each year for the first five years, and 10% a year for years 6 through 10, before settling into a steady state growth rate of 1% a year. Discounting the value added by new subscribers at a higher cost of capital of 8.5%, reflecting the greater uncertainty associated with new subscribers, yields a total value of $137.3 billion for new subscribers.
The Corporate Drag
The final piece of the puzzle is to bring in the corporate costs that we assumed could not be directly linked with subscriber count. In the case of Netflix, the technology & development costs and 80% of the expensed content, that we put into this corporate cost category amounted to $6.13 billion in 2017 and the path that these costs follow in the future will determine the value that we attach to the company.
 Download spreadsheet
I assume that technology & development costs will grow 5% a year, but it is on the content cost component that I struggled the most to estimate a growth rate. I decided that the accelerated spending that Netflix had in 2017 and continued to have in 2018 reflect Netflix’s attempt to acquire standing in the business, and that while it will continue to spend large amounts on content, the growth rate in this portion of the content costs will drop to 3% a year, for the next 10 years. Note that even with that low growth rate, Netflix will be consistently among the top five spenders in the content business, spending more than $100 billion on original content over the next ten years. Discounting back the after-tax corporate expenses back at the 7.95% cost of capital, yields a corporate cost drag of $111.3 billion.
The Netflix Valuation: The One Number
To value Netflix, I bring together the value of existing and new subscribers and net out the corporate cost drag. I also subtract out the $6.5 billion in debt that the company has outstanding and the value of equity options granted over time to its employees.
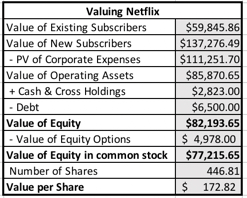 Download spreadsheetThe value per share of $172.82 that I estimate for Netflix is well below the stock price of $275, as of April 14, 2018. My value reflects the story that I am telling about Netflix, as a company that is able to grow at double digit rates for the next decade, with high value added with new users, while bringing its content costs under control. I am sure that your views on the company will diverge from mine, and you are welcome to use my Netflix subscriber valuation template to come to your own conclusions.
 It is worth taking a pause, and considering the differences between Netflix and Spotify, both subscription-based business models, that draw their value from immense subscriber bases.
By paying for its content, both licensed and original, and using that content to go after subscribers, Netflix has built a more levered business model, where subscribers, both new and existing, have higher marginal value than at Spotify, where content costs are tied to subscribers listening to music. The Netflix model, which is increasingly built around original rather than licensed content, provides for a stronger competitive edge, which should show up in higher renewal rates and more pricing power, adding to the value per subscriber, both existing and new. The Netflix model will deliver higher value from subscription growth than the Spotify model, but it comes with a greater downside, because a slackening of that growth will leave Netflix much deeper in the hole, with more negative cash flows, than it would Spotify. Now that both companies are listed and traded, it will be interesting to see whether this plays out as much larger market reactions to subscription number surprises, both positive and negative, at Netflix than at Spotify.
In my earlier post on Google, I noted that every company has a value driver, one number that more than any of the others determines value. In the case of Netflix, the key value driver, in my view, is content costs. My value per share is premised not just on high growth in subscribers and continued subscriber value, but also on content costs growing at a much lower rate (of 3%) in the future. To illustrate the sensitivity of value per share to this assumption, I varied the growth rate in content costs and calculated value per share:
 To illustrate the dangers to Netflix of letting content costs grow at high rates, note that the company’s equity value becomes negative (i.e., the company goes bankrupt), if content costs grow at high rates, relative to revenue growth, with double digit growth rates creating catastrophic effects. If Netflix is able to cap the costs at 2017 levels in perpetuity, the estimated value per share is approximately $216, at the base case growth rate of 15%, and if it is able to reduce content costs in absolute terms over time, it is worth even more. In my view, investing in Netflix is less a bet on the company being able to deliver subscriber and/or revenue growth in the future and more one on the future path of content costs at the company.
The Decision
There is no doubt that Netflix has changed the way we watch television and the movies, and it is changing the movie/TV business in significant ways. By competing for talent in the content business, it is pushing up costs for its competitors and with its direct-to-streaming model, putting pressure on movie theaters and distribution. That said, the entertainment business remains a daunting one, because the talent is expensive and unpredictable, and egos run rampant. The history of newcomers who have come into this business with open wallets is that they leave with empty ones. For Netflix to escape this fate, it has to show discipline in controlling content costs, and until I see evidence that it is capable of this discipline, I will remain a subscriber, but not an investor in the company.
YouTube Video
Data LinksValuation of Netflix - April 2018Blog Posts on Tech TakedownCome easy, go easy: The Tech Takedown!Facebook: Friendless, But Still Formidable!Alphabet Soup: Mostly Google, but where are the bets?Amazon: Glimpses of Shoeless Joe!Netflix: Entertainment's Future?
April 10, 2018
The Facebook Feeding Frenzy: Time for a Pause!
In my last post, I noted that the FANG stocks have been in the spotlight, as tech has taken a beating in the market, but it is Facebook that is at the center of the storm. It was the news story on Cambridge Analytica's misuse of Facebook user data, in mid-March of 2018, that started the ball rolling and in the days since, not only have more unpleasant details emerged about Facebook's culpability, but the rest of the world seems to have decided to unfriend Facebook. More ominously, regulators and politicians have also turned their attention to the company and that attention will be heightened, with Zuckerberg testifying in front of Congress. That is a precipitous fall from grace for a company that only a short while ago epitomized the new economy.
A Personal OdysseyMy interest in Facebook dates back to the year before it went public, when it was already getting attention because of its giant user base and its high private company valuation. In the weeks leading up to its IPO, I valued Facebook at about $29/share, with a story built around it becoming a Google wannabe. If that sounded insulting, it was not meant to be, since having a revenue path and operating margins that mimicked the most successful tech companies in the decade prior is quite a feat.
That initial public offering was among the most mismanaged in recent years and a combination of hubris and poor timing led to an offering day fiasco, where the investment bankers had to step in to support the priced. The first few months after the offering were tough ones for Facebook, with the stock dropping to $19 by September 2012, when I argued that it was time to befriend the company and buy its stock, one of the few times in my life when I have bought a stock at its absolute low.
Much as I would like to tell you that I had the foresight to see Facebook's rise from 2012 through 2017 and that I held on to the stock, I did not, and I sold the stock just as it got to $50, concerned that the advertising business was not big enough to accommodate the players (Google, the social media companies and traditional advertising companies), elbowing for market share. I under estimated how much Google and Facebook would both expand the market and dominate it, but I have no regrets about selling too early. I did what I felt was right, given my assessment and investment philosophy, at the time.
A Numbers UpdateTo undersand how Facebook became the company that it is today, let's start with its most impressive numbers, which are related to its user base. At the start of 2018, Facebook had more than 2.1 billion users, about 30% of the world's population: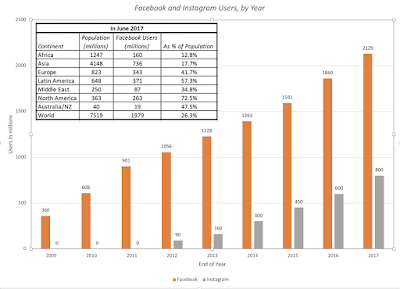
While the user numbers have leveled off in North America, where Facebook already counts 72.5% of the population in its user base, the company continues to grow its user base in the rest of the world, with an added impetus coming from the scaling up of Instagram, Facebook's video arm. These user numbers, while staggering, are made even more so when you consider how much time Facebook users spend on its platforms: Collectively, users spent more than an hour a day on Facebook platforms, and that usage does not reflect the time spent on WhatsApp, also owned by Facebook, by its 1.5 billion users.
If you are a value investor, it would easy to dismiss Facebook as another user-chasing tech company and deliver a cutting remark that you cannot pay dividends with users, but Facebook is an exception. It has managed to to convert its user base into revenues and more critically, operating profits.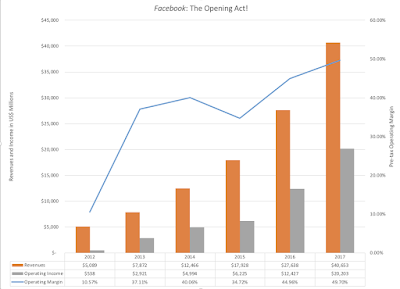
With its operating margin approaching 58%, if you capitalize its technology and content costs, Facebook outshines most of the other companies in the S&P 500, in both growth and profitability:
What makes Facebook's rise even more impressive is that it has been able to deliver these results in a market, where it faces an equally voracious competitor in Google.
In summary, Facebook has had perhaps the most productive opening act in history of any publicly listed company, if you define production in operating results. It promised the moon at the time of its IPO, and has delivered the sun. In my book on connecting stories to value, I pointed to Facebook as a company that seemed to find new ways, with each acquisition, announcement and earning report, to expand and broaden its story, first by conquering mobile and then going global. By the start of 2016, I had changed my story for Facebook from a Google Wannabe to one that would eclipse Google, with added potential from its user base. While the Facebook story has been one of business success, the company, its users and investors have been in denial about central elements in the story. Facebook's users have been trading information on themselves to the company in return for a social media site where they can interact with friends, family and acquaintances, and their complaints about lost privacy ring hollow. Facebook and its investors have been unwilling to face up to the reality that the company's high margins reflect its use of third parties and outsiders to collect and manage data, a business practice that is profitable but that also creates the potential for data leakages.
A Story Break, Twist or Change?If the Facebook story so far sounds like a fairy tale, there has to be a dark twist, and while Facebook's troubles are often traced back to the stories in mid-March 2018, when the current user scandal news cycle began, its problems have been simmering for much longer. Put on the defensive, after the 2016 US presidential elections, for being a purveyor of fake news, Facebook announced in January 2018, that it had changed its news feed to emphasize user interaction over passive consumption of public news feeds. That change, which led to a leveling off in user numbers and a loss of advertising revenues was not well received on Wall Street, with the stock price dropping almost 5%.
If Facebook was trying to preempt its critics with this announcement, the Cambridge Analytica story has knocked them off stride. Specifically, a whistle blower at Cambridge Analytica claimed that the company has not only accessed detailed user data on 50 million Facebook users but had used that data to target voters in political campaigns. In the three weeks since, the story has worsened for Facebook both in terms of numbers (with accessed users increasing to 87 million) and culpability (with Facebook's sloppiness in protecting user data highlighted). As politicians, commentators and competitors have jumped in to exploit the breach, financial markets knocked off $81 billion from Facebook's market capitalization. It is unquestionable that Facebook is mired in a mess and that it deserves market punishment, but from an investing perspective, the question becomes whether the loss in value is merited or not.
The worst case scenario, and some have bought into this, is that the company will lose users, both in numbers and intensity, and that advertisers will pull out. If you add large fines and regulatory restrictions on data usage that may cripple Facebook's capacity to use that data in targeted advertising, you have the makings of a perfect storm, playing out as flat or declining revenues, big increases in operating costs and imploding value. In my view, and I may very well be wrong, I think the effects will be more benign:User loss, in numbers and intensity, will be muted: It is still early in this news cycle, and there may be more damaging revelations to come, but I don't believe that anything that has come out so far is egregious enough to cause large numbers of users to flee. We live in cynical times and many users will probably agree with Mark Snyder, a Facebook user whose data had been accessed by Cambridge Analytica, who is quoted as saying in this New York Times article, "If you sign up for anything and it isn’t immediately obvious how they’re making money, they’re making money off of you.” There is some preliminary evidence that can be gleaned from surveys taken right after the stories broke, which indicate that only about 8% of Facebook users are considering leaving and 19% plan significant cutbacks in usage. If this represents the high water mark, the actual damage will be smaller. I will assume that Facebook's push towards more data protections and its larger base will slow growth in revenues down to about 20% a year, for the next 5 years, from the 51.53% growth rate over the last five years. Source: Raymond James, reported by VarietyAdvertisers will mostly stay on: While a few companies, like Mozilla, Pep Boys and Commerzbank, announced that they were pulling their ads from Facebook, there is little evidence that advertisers are abandoning Facebook in droves, since much of what attracted them to Facebook (its large and intense user base and targeting) still remains in place. Facebook, in an attempt to clean up the platform, may impose restrictions on advertisers that may drive some of them away. For instance, last week, Facebook announced that it would stop accepting political advertisements from anonymous entities and I would not be surprised to see more self-imposed restrictions on advertising. I will assume that there will be more defections in the weeks ahead, mostly from companies that don't feel that their Facebook advertising is effective right now, leading to a loss in revenues of $1.5 billion next year.Data restrictions are coming, and will be costly: There is no doubt that data restrictions are coming, with the question being about how restrictive they will be and what it will cost Facebook to implement them. Data privacy laws, modeled on the EU's format, will require the company to hire more people to oversee data collection and protection. I will assume that these actions will push up costs and reduce the pre-tax operating margin from 57%, after capitalizing technology and content costs, to 42% over the next 5 years. Pre-capitalization of technology and content, I am expecting the operating margin to drop from 49.7% (current) to about 37-38%,There will be fines: This is a wild card in this process, with the possibility that the Federal Trade Commission may impose a fines on the company for violating an agreement reached in 2011, where Facebook agreed to protect user data from unauthorized access. While no one seems to have a clear idea of how much these fines will be, other than that they will be large, there are some who believe that the fines could be as high as a billion dollars. I will assume that the FTC will use Facebook to send a signal to other companies that collect data, by fining it $1 billion.As I see it, the scandal will lead to lost sales in the near term, slow revenue growth in the coming years and increase costs at the company, making the Facebook story a less attractive one. My estimates of how the story changes will play out in the numbers is shown below:
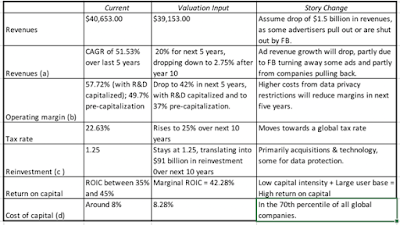 In summary, the story that I have for Facebook is still an upbeat one, albeit one with lower growth and operating margins. The resulting value is shown below:
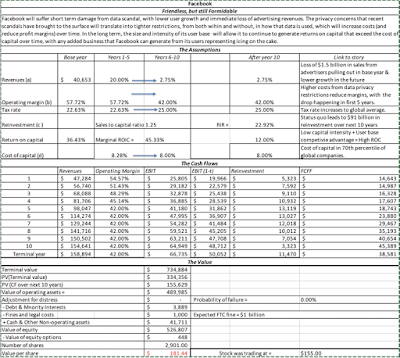 Download spreadsheetThe value per share that I obtain, with my story, is abut $181, and on April 3, the date of the valuation, the stock was trading at $155 a share. As always, I am sure that there are inputs where you will disagree with me, and if you do, you can download the spreadsheet and change the numbers that you disagree with. Some of you may be wondering why I have no margin of safety, but as I noted in this post on the topic from a while back, I believe that there are more effective ways of dealing with uncertainty that adopting an arbitrary margin of safety and sitting on the sidelines. In fact, my favored device is to face up to uncertainty frontally in a simulation, shown below:
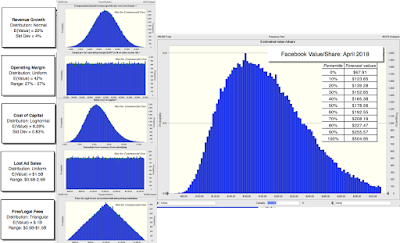 Simulation run with Crystal Ball, in ExcelThis graph reinforces my decision to invest in Facebook. While it is true that there is a 30% chance that the stock is still over valued, there is more upside than downside potential, given my inputs. The median value of $179 is close to my point estimate value, but that should be no surprise since my distributions were centered on my base case assumptions.
Time to Buy?Every corporate scandal becomes a morality play, and the current one that revolves around Facebook is no exception. Facebook has been sloppy with user data, driven partly by greed (to keep costs down and profits up) and partly by arrogance (that its data protections were sufficient), and is and should be held accountable for its mistakes. That said, I don't see Facebook as a villain, and I don't think that the company should not be used as a punching bag for our concerns about politics and society. I am sure that when Mark Zuckerberg delivers his prepared testimony in a couple of hours, senators from both parties will lecture him on Facebook's sins, blissfully blind to their hypocrisy, since I am sure that many of them have had no qualms about using social media data to target their voters. I hear friends and acquaintances wax eloquent about invasion of privacy and how data is sacred, all too often on their favorite social media platforms, while revealing details about their personal lives that would make Kim Kardashian blush. I am an inactive Facebook user, having posted only once on its platform, but to those who would tar and feather the company for its perceived sins, I will paraphrase Shakespeare, and argue that the fault for our loss of privacy is not in our social media, but in how much we share online. I will invest in Facebook, with neither shame nor apology, because I think it remains a good business that I can buy at a reasonable price.
YouTube Video
Data Links
Valuation of Facebook - April 2018
Blog Posts on Tech TakedownCome easy, go easy: The Tech Takedown!Facebook: Friendless, But Still Formidable!Amazon: Glimpses of Shoeless Joe!Netflix: Entertainment's Future?Alphabet: If Google is alpha, where is the "bet"?
A Personal OdysseyMy interest in Facebook dates back to the year before it went public, when it was already getting attention because of its giant user base and its high private company valuation. In the weeks leading up to its IPO, I valued Facebook at about $29/share, with a story built around it becoming a Google wannabe. If that sounded insulting, it was not meant to be, since having a revenue path and operating margins that mimicked the most successful tech companies in the decade prior is quite a feat.
That initial public offering was among the most mismanaged in recent years and a combination of hubris and poor timing led to an offering day fiasco, where the investment bankers had to step in to support the priced. The first few months after the offering were tough ones for Facebook, with the stock dropping to $19 by September 2012, when I argued that it was time to befriend the company and buy its stock, one of the few times in my life when I have bought a stock at its absolute low.
Much as I would like to tell you that I had the foresight to see Facebook's rise from 2012 through 2017 and that I held on to the stock, I did not, and I sold the stock just as it got to $50, concerned that the advertising business was not big enough to accommodate the players (Google, the social media companies and traditional advertising companies), elbowing for market share. I under estimated how much Google and Facebook would both expand the market and dominate it, but I have no regrets about selling too early. I did what I felt was right, given my assessment and investment philosophy, at the time.
A Numbers UpdateTo undersand how Facebook became the company that it is today, let's start with its most impressive numbers, which are related to its user base. At the start of 2018, Facebook had more than 2.1 billion users, about 30% of the world's population:

While the user numbers have leveled off in North America, where Facebook already counts 72.5% of the population in its user base, the company continues to grow its user base in the rest of the world, with an added impetus coming from the scaling up of Instagram, Facebook's video arm. These user numbers, while staggering, are made even more so when you consider how much time Facebook users spend on its platforms:
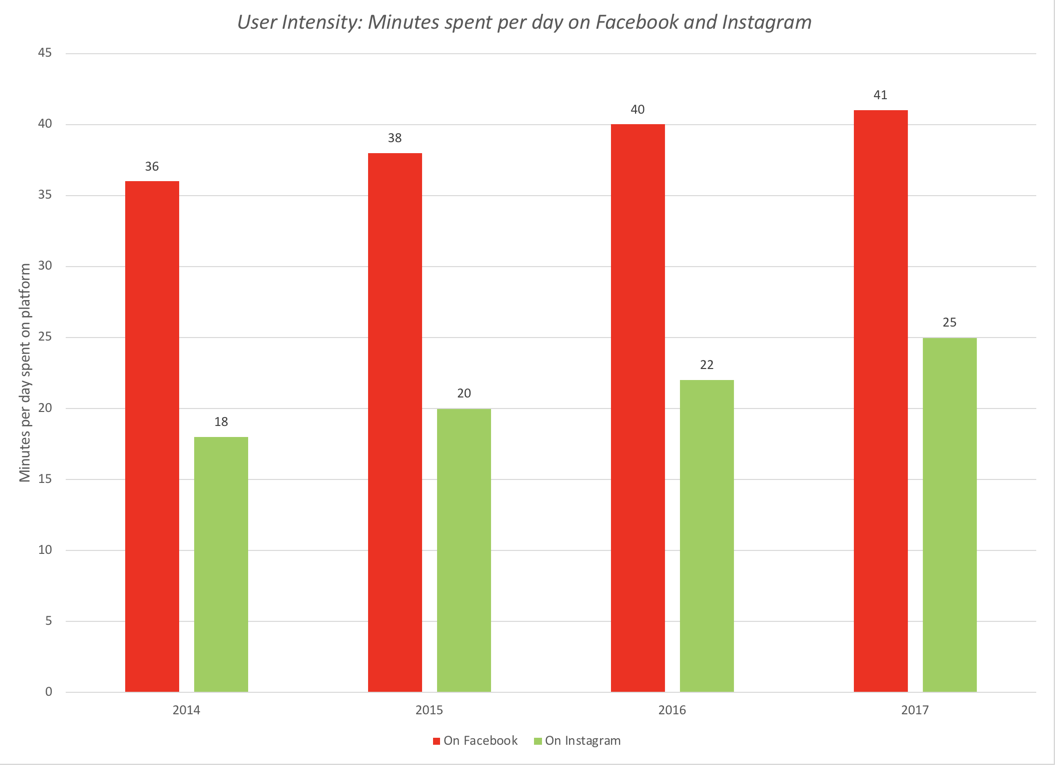 Collectively, users spent more than an hour a day on Facebook platforms, and that usage does not reflect the time spent on WhatsApp, also owned by Facebook, by its 1.5 billion users.
If you are a value investor, it would easy to dismiss Facebook as another user-chasing tech company and deliver a cutting remark that you cannot pay dividends with users, but Facebook is an exception. It has managed to to convert its user base into revenues and more critically, operating profits.

With its operating margin approaching 58%, if you capitalize its technology and content costs, Facebook outshines most of the other companies in the S&P 500, in both growth and profitability:
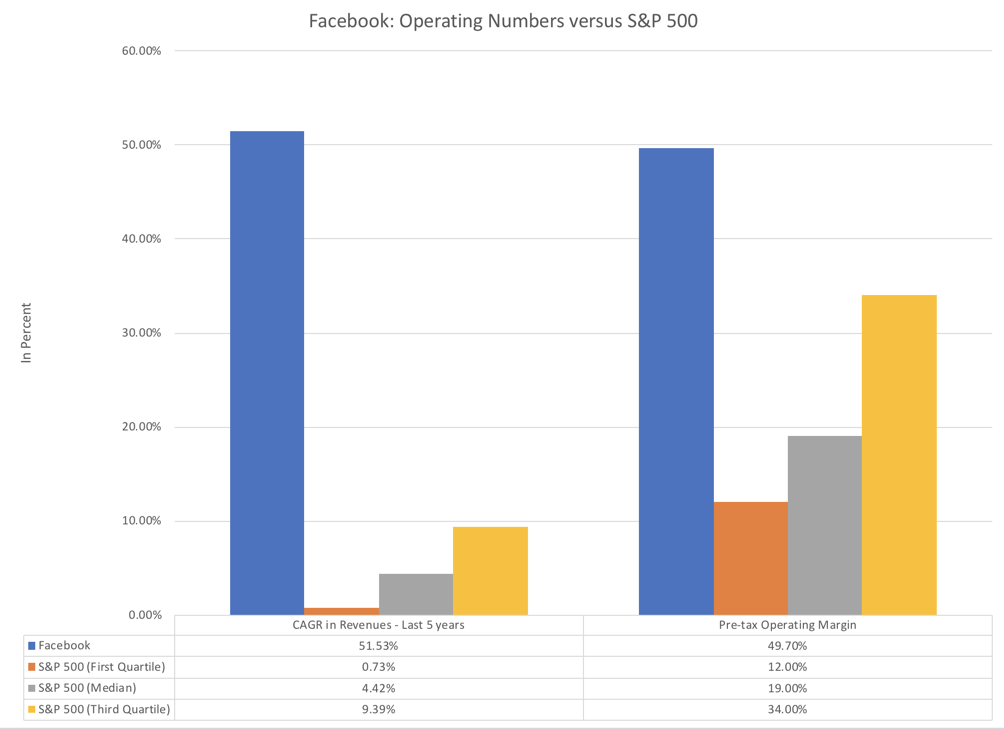
What makes Facebook's rise even more impressive is that it has been able to deliver these results in a market, where it faces an equally voracious competitor in Google.
In summary, Facebook has had perhaps the most productive opening act in history of any publicly listed company, if you define production in operating results. It promised the moon at the time of its IPO, and has delivered the sun. In my book on connecting stories to value, I pointed to Facebook as a company that seemed to find new ways, with each acquisition, announcement and earning report, to expand and broaden its story, first by conquering mobile and then going global. By the start of 2016, I had changed my story for Facebook from a Google Wannabe to one that would eclipse Google, with added potential from its user base. While the Facebook story has been one of business success, the company, its users and investors have been in denial about central elements in the story. Facebook's users have been trading information on themselves to the company in return for a social media site where they can interact with friends, family and acquaintances, and their complaints about lost privacy ring hollow. Facebook and its investors have been unwilling to face up to the reality that the company's high margins reflect its use of third parties and outsiders to collect and manage data, a business practice that is profitable but that also creates the potential for data leakages.
A Story Break, Twist or Change?If the Facebook story so far sounds like a fairy tale, there has to be a dark twist, and while Facebook's troubles are often traced back to the stories in mid-March 2018, when the current user scandal news cycle began, its problems have been simmering for much longer. Put on the defensive, after the 2016 US presidential elections, for being a purveyor of fake news, Facebook announced in January 2018, that it had changed its news feed to emphasize user interaction over passive consumption of public news feeds. That change, which led to a leveling off in user numbers and a loss of advertising revenues was not well received on Wall Street, with the stock price dropping almost 5%.
If Facebook was trying to preempt its critics with this announcement, the Cambridge Analytica story has knocked them off stride. Specifically, a whistle blower at Cambridge Analytica claimed that the company has not only accessed detailed user data on 50 million Facebook users but had used that data to target voters in political campaigns. In the three weeks since, the story has worsened for Facebook both in terms of numbers (with accessed users increasing to 87 million) and culpability (with Facebook's sloppiness in protecting user data highlighted). As politicians, commentators and competitors have jumped in to exploit the breach, financial markets knocked off $81 billion from Facebook's market capitalization. It is unquestionable that Facebook is mired in a mess and that it deserves market punishment, but from an investing perspective, the question becomes whether the loss in value is merited or not.
The worst case scenario, and some have bought into this, is that the company will lose users, both in numbers and intensity, and that advertisers will pull out. If you add large fines and regulatory restrictions on data usage that may cripple Facebook's capacity to use that data in targeted advertising, you have the makings of a perfect storm, playing out as flat or declining revenues, big increases in operating costs and imploding value. In my view, and I may very well be wrong, I think the effects will be more benign:User loss, in numbers and intensity, will be muted: It is still early in this news cycle, and there may be more damaging revelations to come, but I don't believe that anything that has come out so far is egregious enough to cause large numbers of users to flee. We live in cynical times and many users will probably agree with Mark Snyder, a Facebook user whose data had been accessed by Cambridge Analytica, who is quoted as saying in this New York Times article, "If you sign up for anything and it isn’t immediately obvious how they’re making money, they’re making money off of you.” There is some preliminary evidence that can be gleaned from surveys taken right after the stories broke, which indicate that only about 8% of Facebook users are considering leaving and 19% plan significant cutbacks in usage. If this represents the high water mark, the actual damage will be smaller. I will assume that Facebook's push towards more data protections and its larger base will slow growth in revenues down to about 20% a year, for the next 5 years, from the 51.53% growth rate over the last five years.
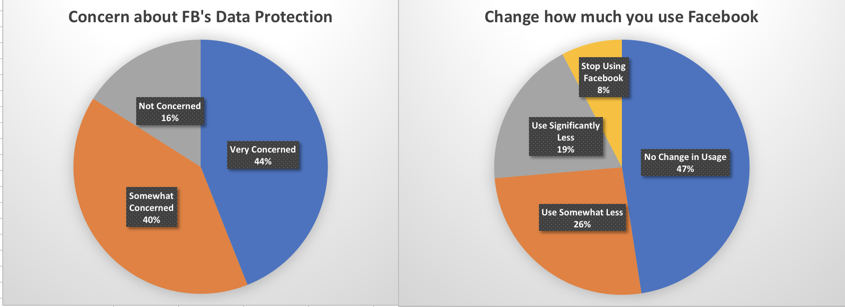 Source: Raymond James, reported by VarietyAdvertisers will mostly stay on: While a few companies, like Mozilla, Pep Boys and Commerzbank, announced that they were pulling their ads from Facebook, there is little evidence that advertisers are abandoning Facebook in droves, since much of what attracted them to Facebook (its large and intense user base and targeting) still remains in place. Facebook, in an attempt to clean up the platform, may impose restrictions on advertisers that may drive some of them away. For instance, last week, Facebook announced that it would stop accepting political advertisements from anonymous entities and I would not be surprised to see more self-imposed restrictions on advertising. I will assume that there will be more defections in the weeks ahead, mostly from companies that don't feel that their Facebook advertising is effective right now, leading to a loss in revenues of $1.5 billion next year.Data restrictions are coming, and will be costly: There is no doubt that data restrictions are coming, with the question being about how restrictive they will be and what it will cost Facebook to implement them. Data privacy laws, modeled on the EU's format, will require the company to hire more people to oversee data collection and protection. I will assume that these actions will push up costs and reduce the pre-tax operating margin from 57%, after capitalizing technology and content costs, to 42% over the next 5 years. Pre-capitalization of technology and content, I am expecting the operating margin to drop from 49.7% (current) to about 37-38%,There will be fines: This is a wild card in this process, with the possibility that the Federal Trade Commission may impose a fines on the company for violating an agreement reached in 2011, where Facebook agreed to protect user data from unauthorized access. While no one seems to have a clear idea of how much these fines will be, other than that they will be large, there are some who believe that the fines could be as high as a billion dollars. I will assume that the FTC will use Facebook to send a signal to other companies that collect data, by fining it $1 billion.As I see it, the scandal will lead to lost sales in the near term, slow revenue growth in the coming years and increase costs at the company, making the Facebook story a less attractive one. My estimates of how the story changes will play out in the numbers is shown below:
 In summary, the story that I have for Facebook is still an upbeat one, albeit one with lower growth and operating margins. The resulting value is shown below:
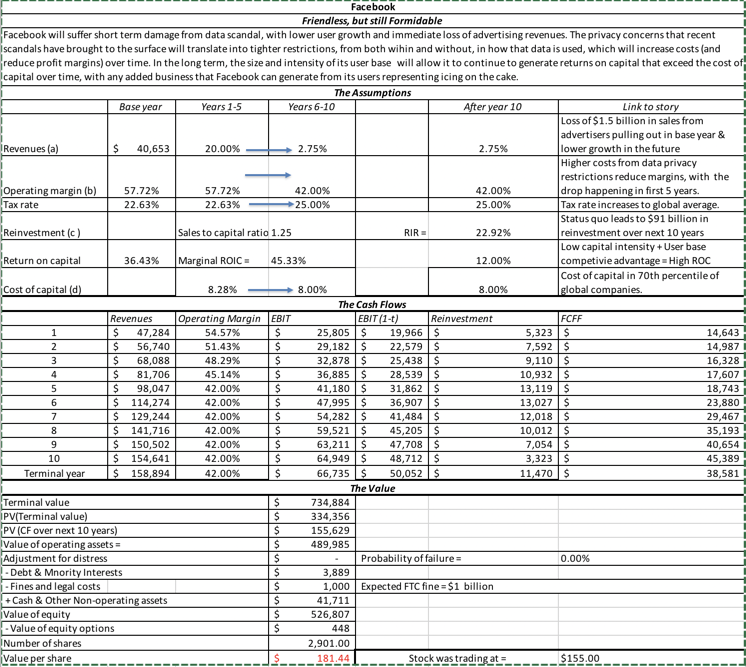 Download spreadsheetThe value per share that I obtain, with my story, is abut $181, and on April 3, the date of the valuation, the stock was trading at $155 a share. As always, I am sure that there are inputs where you will disagree with me, and if you do, you can download the spreadsheet and change the numbers that you disagree with. Some of you may be wondering why I have no margin of safety, but as I noted in this post on the topic from a while back, I believe that there are more effective ways of dealing with uncertainty that adopting an arbitrary margin of safety and sitting on the sidelines. In fact, my favored device is to face up to uncertainty frontally in a simulation, shown below:
 Simulation run with Crystal Ball, in ExcelThis graph reinforces my decision to invest in Facebook. While it is true that there is a 30% chance that the stock is still over valued, there is more upside than downside potential, given my inputs. The median value of $179 is close to my point estimate value, but that should be no surprise since my distributions were centered on my base case assumptions.
Time to Buy?Every corporate scandal becomes a morality play, and the current one that revolves around Facebook is no exception. Facebook has been sloppy with user data, driven partly by greed (to keep costs down and profits up) and partly by arrogance (that its data protections were sufficient), and is and should be held accountable for its mistakes. That said, I don't see Facebook as a villain, and I don't think that the company should not be used as a punching bag for our concerns about politics and society. I am sure that when Mark Zuckerberg delivers his prepared testimony in a couple of hours, senators from both parties will lecture him on Facebook's sins, blissfully blind to their hypocrisy, since I am sure that many of them have had no qualms about using social media data to target their voters. I hear friends and acquaintances wax eloquent about invasion of privacy and how data is sacred, all too often on their favorite social media platforms, while revealing details about their personal lives that would make Kim Kardashian blush. I am an inactive Facebook user, having posted only once on its platform, but to those who would tar and feather the company for its perceived sins, I will paraphrase Shakespeare, and argue that the fault for our loss of privacy is not in our social media, but in how much we share online. I will invest in Facebook, with neither shame nor apology, because I think it remains a good business that I can buy at a reasonable price.
YouTube Video
Data Links
Valuation of Facebook - April 2018
Blog Posts on Tech TakedownCome easy, go easy: The Tech Takedown!Facebook: Friendless, But Still Formidable!Amazon: Glimpses of Shoeless Joe!Netflix: Entertainment's Future?Alphabet: If Google is alpha, where is the "bet"?
April 7, 2018
Come easy, go easy: The Tech Takedown!
If there is one thing that I have learned about markets over the years, it is that they have a way of leveling egos and cutting companies and investors down to size. The last three weeks have been humbling ones for tech companies, especially the big four (Facebook, Amazon, Netflix and Alphabet or FANG) which seemed unstoppable in their pursuit of revenues and ever-rising market capitalizations, and for tech investors, many of whom seem to have mistaken luck for skill. Not surprisingly, some of the cheerleaders who were just a short while ago telling us that nothing could go wrong with these companies are in the midst of a mood shift, where they are convinced that nothing can go right with them. As Mark Zuckerberg gets ready to testify to Congress, amidst calls for both regulating and perhaps even breaking up tech companies, it is time to take a sober look at where we stand with these companies, what the last three weeks have changed and the consequences for investment decisions.
The Rise of Facebook, Amazon, Netflix and Google (FANG)The outsized attention paid to the FANG (Facebook, Amazon, Netflix and Google) stocks sometimes obscures how young these companies are in the public market place. Amazon, a company that I valued as an online, book retailer in 1998, a year after its listing, is the granddaddy of the group. The Google IPO , remembered primarily because of its use of a Dutch auction, instead of a banker, to set its offering price was in 2004, but you probably completely missed the Netflix IPO two years earlier in 2002, and Facebook, the youngest of the four, went public in 2012. The growth in market capitalization at these companies is the stuff of investing legend and the table below shows how they have almost tripled their contribution to the overall market capitalization of the S&P 500 between 2012 and 2017 (with all numbers in billions of US $):

At the end of the 2017, Amazon, Google and Facebook were three of the ten largest market capitalization companies in the world.
The role that the FANG companies have played in driving US equities can be best seen with a different lens, by looking at the total change in the market capitalization of the S&P 500 and how much of that change can be attributed to the rising values of just these four companies: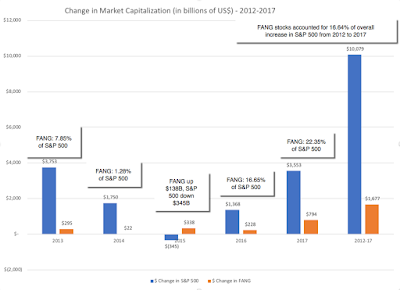
To add weight to these numbers, consider these facts. The four companies that comprise FANG added almost $1.7 trillion in market capitalization over these five years and accounted for one-sixth of the increase in value for the entire index. Put simply, if you were a large-cap US portfolio manager and you held none of these stocks between 2013-2017, it would have been very, very difficult, if not impossible, to beat the S&P 500 over this period.
A Reversal in Fortunes for the FANG stocksIt is the sustained success of these companies that has made the last few weeks so trying for investors in them and so unsettling for market watchers. While these stocks went through the same ups and downs that the rest of the market was going through in February, it was in the middle of March that they became the central story, with the revelations from Cambridge Analytica, a data analytics and consulting firm, that they had harvested data on about 50 million Facebook users (a number that has since been increased to 87 million) for use in political and commercial campaigns. The political firestorm that followed has not only hurt Facebook, but the other three companies as well, and the graph below chronicles the damage in the days since the news story, since the news story was released: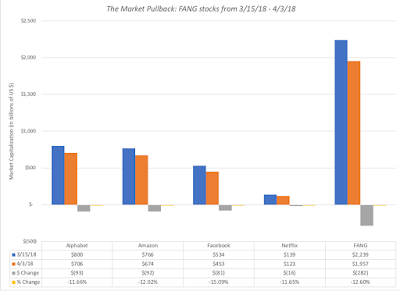
The numbers are staggering, at least in absolute terms. Collectively, the FANG stocks lost $282 billion in market capitalization between March 15 and April 2 and contributed significantly to the drop in US equity markets over that period. To put that in perspective, the market capitalization lost in just these four companies in about two weeks was greater than the total value all crypto currencies (Bitcoin and all its relatives) as of the start of April of 2018, perhaps suggesting that we have been letting ourselves get distracted by penny change, when dollars are at stake. It is also interesting that while much of the attention has been directed at Facebook, which lost 15% of its value in just over two weeks, the three other stocks each lost about 12% of their value.
Speaking of perspective, though, investors in these four stocks should consider another fact before they complain too much about being punished by the market. Even with the losses through April 2 incorporated, the collective market value of these companies remains about $400 billion higher than it was a year ago, on April 3, 2017.
The bottom line is that two weeks of market pull backs cannot take away from the longer term success at these companies. If this is what failure looks like, I would love to see more of it in my portfolio.
The Fang Story LineTo understand both the rise and recent pullback, let's look at what these four companies have in common. As I see it, here are the salient features:Scaling Success: Each of these companies has been able to keep revenue growing rapidly, even as they scale up and acquire larger market share. In effect, they have been able to deliver small company growth rates, while becoming monoliths.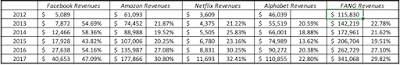 This success of these companies at delivering high growth, as they have become bigger, have some led some to rethink long-held beliefs about the limits of growth.Bigger Slice of a Bigger Pie: All four of these companies have also been able to change the businesses that they have entered, increasing the size of the total market by attracting new customers, while also changing the way business is run to their benefit. With Google and Facebook, that business is advertising, with Netflix, it is entertainment, and with Amazon, it is just about any business it enters, from retailing to entertainment to cloud services. In each of these businesses, they have not only made the pie bigger but also increased their slice of it, quite a feat!Promise of Profitability: Alphabet and Facebook are money-making machines, with very high profit margins; Facebook's margins are among the highest among large market capitalization companies and Google's are in the top decile.
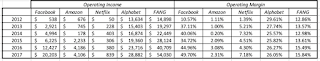 Amazon has lagged on profitability historically, but it seems to be showing progress in the last few years, and Netflix still struggles to generate decent profit margins. The low margins that these companies show are deceptively low because they are after expensing what would be business building or capital expenditures in most other companies - $22.6 billion in technology and content at Amazon and almost $8 billion in content costs at Netflix. If, in 2008, you had described the trajectories that these companies would go through, to get to where they are today, I would have given you long odds on it happening. To the question of how they pulled it off, I would point to three factors;Centralized Power: These companies are more corporate dictatorships, than corporate democracies. All four of these companies continue to be run by founder/CEOs, whose visions and narratives have focused these companies; Brin and Page, at Alphabet, Zuckerberg, at Facebook, Bezos at Amazon and Hastings at Netflix, have unchallenged power at these companies, and the only option that shareholders who disagree with them have is to sell and move on. Big Data: While big data is often a buzz word thrown into conversations where it does not belong, these four companies epitomize how data can be used to create value. In fact, you can argue that what Google learns from our search behavior, Facebook from our social media interactions, Netflix from our video watching choices and Amazon from our shopping carts (and Alexa) is central to these companies being able to scale up successfully and change the businesses they are in. Google and Facebook use what they learn about us to allow companies to target their advertising, Netflix develops content that reflects our watching preferences and Amazon uses our shopping history and Prime membership to run circles around its competitors.Intimidation Factor: There is one final intangible in the mix and that is the perception that these companies have created in regulators, customers and competitors that they are unstoppable. Advertisers facing off against Google and Facebook increasingly settle for crumbs off the table, convinced that they cannot take on either company frontally, the entertainment business which once viewed Netflix as a nuisance has learned not only to live with the company but has adapted itself to the streaming world and Amazon's entry into almost any business seems to lead to a negative reassessment of the status quo in that business.In short, if you were an investor in any of these companies until three weeks ago, the story that you would have used to justify holding them would have been that they were juggernauts headed for global domination, and valued accordingly.
Story Break, Recalibration or Tweak?If you have read my prior posts on valuation, you know that I am a great believer that stories hold together valuations, and that it is changes to stories that change valuation. It is still early, but the question that investors face is whether what has happened in the last three weeks has changed the story dynamics fundamentally at these companies. At the very minimum, we have at least noticed that the strengths that we noted in the last section come with accompanying weaknessesCEO heads cannot roll: Unlike traditional companies facing crises, where CEOs can be offered by a board of director as a sacrificial offering to calm investors, regulators or politicians, the FANG companies and their CEOs are so intertwined, with power entrenched in the current CEOs, this option is off the table. Even if Mark Zuckerberg performs like Valeant's Michael Pearson did in front of a congressional committee next week, he will still be CEO for the foreseeable future, an advantage that having voting shares and controlling more than 50% of the voting rights gives him.The Dark Side of Sharing: I don't know what we, collectively as users of these companies' products and services, thought they were doing with all of the information that we were sharing so willingly with them, but until the last few weeks, we were able to look the other way and assume that it would be used benevolently. The Facebook fiasco with Cambridge Analytica has pushed some of us out of denial and perhaps into a reassessment of how we share data and how that data is used. It has also created a firestorm about data sharing and privacy that may result in restrictions in how the data gets used.No Friends: When other companies feel threatened by your success and growth, it should come as no surprise that many of them are cheering, as you stumble. From Elon Musk shutting down Tesla's Facebook presence] to Tim Cook castigating Google and Facebook for misusing data, there seems to be a desire to pile on. Musk has far bigger problems at Tesla than it's Facebook page, and Cook should be careful about throwing stones from a glass house, but watching the FANG companies squirm is evoking joy in the boardrooms of its competitors.So, what now? As I see it, there are three ways to read the tea leaves, with the effects on value ranging from very negative to non-existent.
Second Thoughts on Sharing: It is possible that the news stories about how exposed we have left ourselves, as a consequence of our sharing, will lead us to all to reassess how much and how we interact online. That would have significant consequences for all of the FANG stocks, since their scaling success and business models depend upon continued user engagement. Tempest in a teapot: At the other end of the spectrum, there are some who argue that after the Zuckerberg testimony, the story will blow over and that not only will the companies revert back to their old ways, but that they will continue to accumulate users and grow revenues, while doing so.Data Protections: The third possibility lies somewhere between the first two. While the news stories may have little effect on how people use these companies' products and services, there may be new restrictions on how the data that is collected from their usage is utilized by the companies. That would include not only privacy restrictions, similar to those already in place in the EU, but also regulations on how the data is collected, stored and shared. In addition, the companies themselves may feel pressure to change current business practices, which while profitable, have left data vulnerabilities. I don't buy into either of the first two scenarios. I think that we are too far gone down the sharing road to reverse field, and that while we will have a few high profile individuals signal their displeasure by abandoning (or claiming to abandon) a platform, most of us are too attached to Google search, our Facebook friends, watching Black Mirror on Netflix and the convenience of Prime to throw them overboard, because our privacy has been breached. In fact, I would not be surprised if Facebook usage has gone up in the days since the crisis, rather than down.
I also think that assuming that these stories will pass with no effect is a mistake, since there are changes coming to these firms, from within and without, that will have value consequences. To illustrate, Facebook has already announced that it will stop using data from third party aggregators to supplement its own data in customer targeting, because of data concerns, and I am sure that there are more changes coming, many of which will increase Facebook's costs and crimp revenue growth, and through those changes, the value that we attach to Facebook. I also believe that you will see more restrictions on the use of data and that these rules will also have an effect on costs, growth and value. Rather than extend this post further, by looking at the impact of these changes, I will be using my next post to update my stories and valuations of Facebook, Amazon, Netflix and Google. If you want a preview, suffice to say that I am back to being a Facebook shareholder, that I am close to becoming a Google shareholder for the first time and that Amazon and Netflix remain out of my reach.
YouTube Video
Blog Posts on Tech TakedownCome easy, go easy: The Tech Takedown!Facebook: Friendless, But Still Formidable!Amazon: Glimpses of Shoeless Joe!Netflix: Entertainment's Future?Alphabet: If Google is alpha, where is the "bet"?
The Rise of Facebook, Amazon, Netflix and Google (FANG)The outsized attention paid to the FANG (Facebook, Amazon, Netflix and Google) stocks sometimes obscures how young these companies are in the public market place. Amazon, a company that I valued as an online, book retailer in 1998, a year after its listing, is the granddaddy of the group. The Google IPO , remembered primarily because of its use of a Dutch auction, instead of a banker, to set its offering price was in 2004, but you probably completely missed the Netflix IPO two years earlier in 2002, and Facebook, the youngest of the four, went public in 2012. The growth in market capitalization at these companies is the stuff of investing legend and the table below shows how they have almost tripled their contribution to the overall market capitalization of the S&P 500 between 2012 and 2017 (with all numbers in billions of US $):
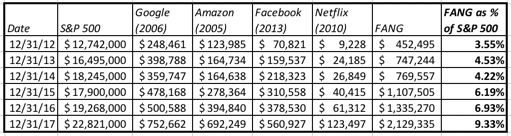
At the end of the 2017, Amazon, Google and Facebook were three of the ten largest market capitalization companies in the world.
The role that the FANG companies have played in driving US equities can be best seen with a different lens, by looking at the total change in the market capitalization of the S&P 500 and how much of that change can be attributed to the rising values of just these four companies:

To add weight to these numbers, consider these facts. The four companies that comprise FANG added almost $1.7 trillion in market capitalization over these five years and accounted for one-sixth of the increase in value for the entire index. Put simply, if you were a large-cap US portfolio manager and you held none of these stocks between 2013-2017, it would have been very, very difficult, if not impossible, to beat the S&P 500 over this period.
A Reversal in Fortunes for the FANG stocksIt is the sustained success of these companies that has made the last few weeks so trying for investors in them and so unsettling for market watchers. While these stocks went through the same ups and downs that the rest of the market was going through in February, it was in the middle of March that they became the central story, with the revelations from Cambridge Analytica, a data analytics and consulting firm, that they had harvested data on about 50 million Facebook users (a number that has since been increased to 87 million) for use in political and commercial campaigns. The political firestorm that followed has not only hurt Facebook, but the other three companies as well, and the graph below chronicles the damage in the days since the news story, since the news story was released:
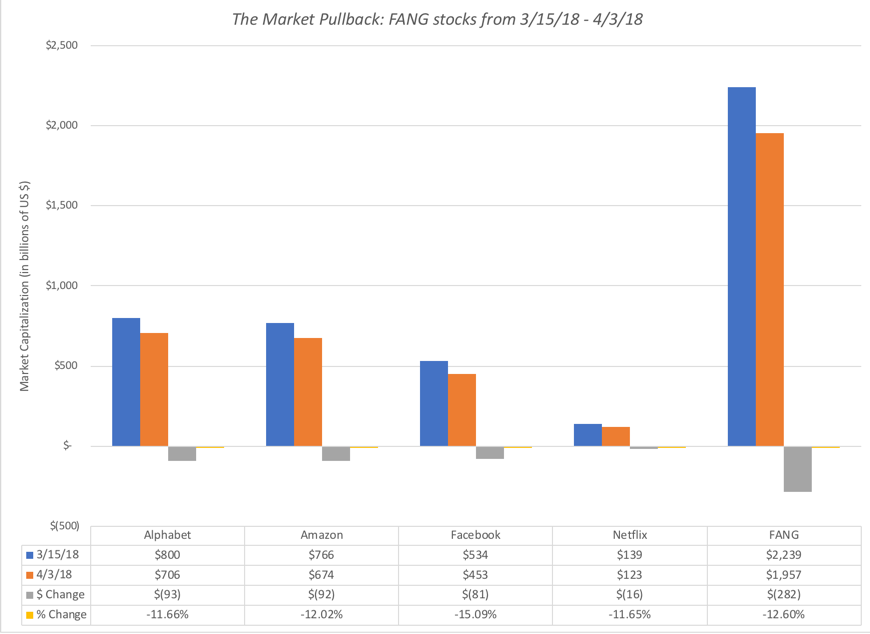
The numbers are staggering, at least in absolute terms. Collectively, the FANG stocks lost $282 billion in market capitalization between March 15 and April 2 and contributed significantly to the drop in US equity markets over that period. To put that in perspective, the market capitalization lost in just these four companies in about two weeks was greater than the total value all crypto currencies (Bitcoin and all its relatives) as of the start of April of 2018, perhaps suggesting that we have been letting ourselves get distracted by penny change, when dollars are at stake. It is also interesting that while much of the attention has been directed at Facebook, which lost 15% of its value in just over two weeks, the three other stocks each lost about 12% of their value.
Speaking of perspective, though, investors in these four stocks should consider another fact before they complain too much about being punished by the market. Even with the losses through April 2 incorporated, the collective market value of these companies remains about $400 billion higher than it was a year ago, on April 3, 2017.
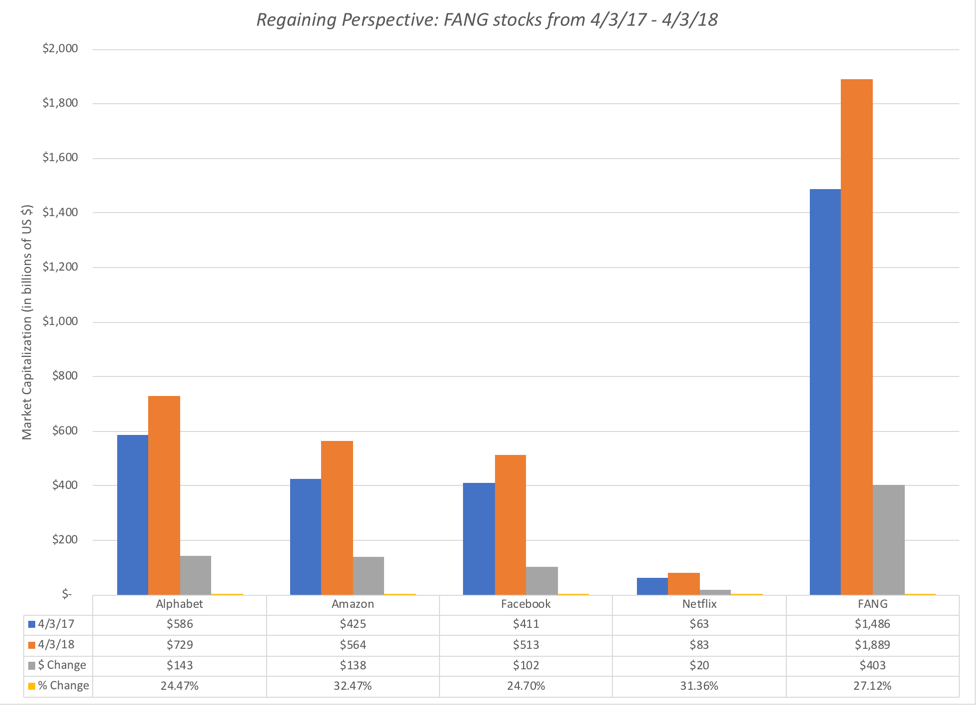
The bottom line is that two weeks of market pull backs cannot take away from the longer term success at these companies. If this is what failure looks like, I would love to see more of it in my portfolio.
The Fang Story LineTo understand both the rise and recent pullback, let's look at what these four companies have in common. As I see it, here are the salient features:Scaling Success: Each of these companies has been able to keep revenue growing rapidly, even as they scale up and acquire larger market share. In effect, they have been able to deliver small company growth rates, while becoming monoliths.
 This success of these companies at delivering high growth, as they have become bigger, have some led some to rethink long-held beliefs about the limits of growth.Bigger Slice of a Bigger Pie: All four of these companies have also been able to change the businesses that they have entered, increasing the size of the total market by attracting new customers, while also changing the way business is run to their benefit. With Google and Facebook, that business is advertising, with Netflix, it is entertainment, and with Amazon, it is just about any business it enters, from retailing to entertainment to cloud services. In each of these businesses, they have not only made the pie bigger but also increased their slice of it, quite a feat!Promise of Profitability: Alphabet and Facebook are money-making machines, with very high profit margins; Facebook's margins are among the highest among large market capitalization companies and Google's are in the top decile.
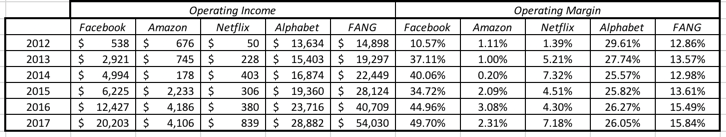 Amazon has lagged on profitability historically, but it seems to be showing progress in the last few years, and Netflix still struggles to generate decent profit margins. The low margins that these companies show are deceptively low because they are after expensing what would be business building or capital expenditures in most other companies - $22.6 billion in technology and content at Amazon and almost $8 billion in content costs at Netflix. If, in 2008, you had described the trajectories that these companies would go through, to get to where they are today, I would have given you long odds on it happening. To the question of how they pulled it off, I would point to three factors;Centralized Power: These companies are more corporate dictatorships, than corporate democracies. All four of these companies continue to be run by founder/CEOs, whose visions and narratives have focused these companies; Brin and Page, at Alphabet, Zuckerberg, at Facebook, Bezos at Amazon and Hastings at Netflix, have unchallenged power at these companies, and the only option that shareholders who disagree with them have is to sell and move on. Big Data: While big data is often a buzz word thrown into conversations where it does not belong, these four companies epitomize how data can be used to create value. In fact, you can argue that what Google learns from our search behavior, Facebook from our social media interactions, Netflix from our video watching choices and Amazon from our shopping carts (and Alexa) is central to these companies being able to scale up successfully and change the businesses they are in. Google and Facebook use what they learn about us to allow companies to target their advertising, Netflix develops content that reflects our watching preferences and Amazon uses our shopping history and Prime membership to run circles around its competitors.Intimidation Factor: There is one final intangible in the mix and that is the perception that these companies have created in regulators, customers and competitors that they are unstoppable. Advertisers facing off against Google and Facebook increasingly settle for crumbs off the table, convinced that they cannot take on either company frontally, the entertainment business which once viewed Netflix as a nuisance has learned not only to live with the company but has adapted itself to the streaming world and Amazon's entry into almost any business seems to lead to a negative reassessment of the status quo in that business.In short, if you were an investor in any of these companies until three weeks ago, the story that you would have used to justify holding them would have been that they were juggernauts headed for global domination, and valued accordingly.
Story Break, Recalibration or Tweak?If you have read my prior posts on valuation, you know that I am a great believer that stories hold together valuations, and that it is changes to stories that change valuation. It is still early, but the question that investors face is whether what has happened in the last three weeks has changed the story dynamics fundamentally at these companies. At the very minimum, we have at least noticed that the strengths that we noted in the last section come with accompanying weaknessesCEO heads cannot roll: Unlike traditional companies facing crises, where CEOs can be offered by a board of director as a sacrificial offering to calm investors, regulators or politicians, the FANG companies and their CEOs are so intertwined, with power entrenched in the current CEOs, this option is off the table. Even if Mark Zuckerberg performs like Valeant's Michael Pearson did in front of a congressional committee next week, he will still be CEO for the foreseeable future, an advantage that having voting shares and controlling more than 50% of the voting rights gives him.The Dark Side of Sharing: I don't know what we, collectively as users of these companies' products and services, thought they were doing with all of the information that we were sharing so willingly with them, but until the last few weeks, we were able to look the other way and assume that it would be used benevolently. The Facebook fiasco with Cambridge Analytica has pushed some of us out of denial and perhaps into a reassessment of how we share data and how that data is used. It has also created a firestorm about data sharing and privacy that may result in restrictions in how the data gets used.No Friends: When other companies feel threatened by your success and growth, it should come as no surprise that many of them are cheering, as you stumble. From Elon Musk shutting down Tesla's Facebook presence] to Tim Cook castigating Google and Facebook for misusing data, there seems to be a desire to pile on. Musk has far bigger problems at Tesla than it's Facebook page, and Cook should be careful about throwing stones from a glass house, but watching the FANG companies squirm is evoking joy in the boardrooms of its competitors.So, what now? As I see it, there are three ways to read the tea leaves, with the effects on value ranging from very negative to non-existent.
Second Thoughts on Sharing: It is possible that the news stories about how exposed we have left ourselves, as a consequence of our sharing, will lead us to all to reassess how much and how we interact online. That would have significant consequences for all of the FANG stocks, since their scaling success and business models depend upon continued user engagement. Tempest in a teapot: At the other end of the spectrum, there are some who argue that after the Zuckerberg testimony, the story will blow over and that not only will the companies revert back to their old ways, but that they will continue to accumulate users and grow revenues, while doing so.Data Protections: The third possibility lies somewhere between the first two. While the news stories may have little effect on how people use these companies' products and services, there may be new restrictions on how the data that is collected from their usage is utilized by the companies. That would include not only privacy restrictions, similar to those already in place in the EU, but also regulations on how the data is collected, stored and shared. In addition, the companies themselves may feel pressure to change current business practices, which while profitable, have left data vulnerabilities. I don't buy into either of the first two scenarios. I think that we are too far gone down the sharing road to reverse field, and that while we will have a few high profile individuals signal their displeasure by abandoning (or claiming to abandon) a platform, most of us are too attached to Google search, our Facebook friends, watching Black Mirror on Netflix and the convenience of Prime to throw them overboard, because our privacy has been breached. In fact, I would not be surprised if Facebook usage has gone up in the days since the crisis, rather than down.
I also think that assuming that these stories will pass with no effect is a mistake, since there are changes coming to these firms, from within and without, that will have value consequences. To illustrate, Facebook has already announced that it will stop using data from third party aggregators to supplement its own data in customer targeting, because of data concerns, and I am sure that there are more changes coming, many of which will increase Facebook's costs and crimp revenue growth, and through those changes, the value that we attach to Facebook. I also believe that you will see more restrictions on the use of data and that these rules will also have an effect on costs, growth and value. Rather than extend this post further, by looking at the impact of these changes, I will be using my next post to update my stories and valuations of Facebook, Amazon, Netflix and Google. If you want a preview, suffice to say that I am back to being a Facebook shareholder, that I am close to becoming a Google shareholder for the first time and that Amazon and Netflix remain out of my reach.
YouTube Video
Blog Posts on Tech TakedownCome easy, go easy: The Tech Takedown!Facebook: Friendless, But Still Formidable!Amazon: Glimpses of Shoeless Joe!Netflix: Entertainment's Future?Alphabet: If Google is alpha, where is the "bet"?
March 23, 2018
Spotify Loose Ends: Pricing, User Value and Big Data!
In my last post, I valued Spotify, using information from its prospectus, and promised to come back to cover three loose ends: (1) a pricing of the company to contrast with my intrinsic valuation, (2) a valuation of a Spotify subscriber and, by extension, a subscriber-based valuation of the company, and (3) the value of big data, seen through the prism of what Spotify can learn about its subscribers from their use of its service, and convert to profits.
1. The Pricing of SpotifyI won't bore you by going through the full details of the contrast that I see between pricing an asset and valuing it, since it has been at the heart of so many of my prior posts (like this, this and this). In short, the value of an asset is determined by its expected cash flows and the risk in these cash flows, which you can estimate imprecisely using a discounted cash flow model. The price of an asset is based on what others are paying for similar assets, requiring judgments on what comprises similar. My last post reflected my attempt to attach an intrinsic value to Spotify, but the pricing questions for Spotify are two fold: the companies that investors in the market will compare it to, to make a pricing judgment, and the metric that they will base the pricing on.
Let's start with the simplest version of pricing, a one-on-one comparison. With Spotify, the two companies that are likeliest to be offered as comparable firms are Pandora, a company that is in the same business (music streaming) as Spotify, deriving its revenues from advertising and subscription, and Netflix, a company that is also subscription-driven, and one that Spotify would like to emulate in terms of market success. Since Spotify and Pandora are reporting operating losses, there are only three metrics that you can scale the pricing of these companies to: the number of subscribers, total revenues and gross profits. I report the numbers for all three companies in the table below, in conjunction with the enterprise values for Pandora and Netflix: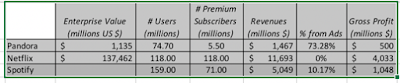 For Pandora and Netflix, the numbers for users and revenues/profits come from their most recent annual reports for the year ending December 31, 2017, and for Spotify, the numbers are from the prospectus covering the same year. To use the numbers to price Spotify, I first estimate pricing multiples for Pandora and Netflix. and then use these multiples on Spotify's metrics:
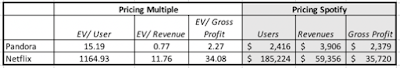 To illustrate the process, I price Spotify, relative to Pandora and based on subscribers, by first computing the enterprise value/subscriber for Pandora (EV/Subscriber= 1135/74.70 = 15.19). I then multiply this value by Pandora's total subscriber count of 159 million to arrive at a pricing of $2,416 million for Spotify. I repeat this process for Netflix, and then repeat it again with both companies, using revenues and gross profit as my scaling variables. The table of pricing estimates that I get for Spotify explains why those who are bullish on the company will try to avoid comparisons to Pandora and encourage comparisons to Netflix. If, as is rumored, Spotify's equity is priced at between $20 and $25 billion, it will look massively over priced, if compared to Pandora, but be a bargain, relative to Netflix. As you can see, each of these comparisons has problems. Spotify not only has a more subscription-based revenue model than Pandora, yielding higher overall revenues, but its more global presence (than Pandora) has insulated it better from competition from Apple Music. Netflix has an entirely subscription-based model and generates more revenues per subscriber, while facing less intense competition. The bottom line is that the pricing range for Spotify is wide, because it depends on the company you compare it to, and the metric you base the pricing on. That may come as no surprise for you, but it will explain why there will wide divergences in pricing opinion when the stock first starts to trade, resulting in wild price swings. If you are not adept at the pricing game, and I am not, you should stay with your value judgment, flawed though it might be. I will consequently stick with my intrinsic value estimate for the equity in the company.
2. A Subscriber-Based Valuation of SpotifyLast year, I did a user-based valuation of Uber and used it to understand the dynamics that determine user value and then to value Amazon Prime. That framework can be easily adapted to value Spotify subscribers, both existing and new. To value Spotify's existing subscribers, I started with the base revenue per subscriber and content costs in 2017, made assumptions about growth in each item and used a renewal rate of 94.5%, based again upon 2017 numbers (all in US dollar terms):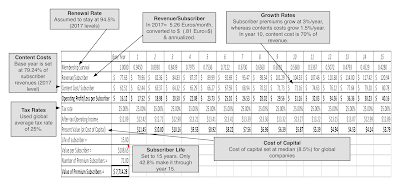 Download spreadsheetNote that revenues/subscriber grow at 3% a year, faster than the growth rate of 1.5%/year in content costs, reducing content costs to 70% of subscriber revenues in year 10, consistent with the assumption I made in the top down valuation in the last post. The value of a premium subscriber, allowing for the churn in subscriptions (only 43% make it through 15 years) and reduced content costs, is $108.65, and the total value of the 71 million premium subscriptions works out to about $7.7 billion.
To estimate the value of new users, I first had to estimate how much Spotify was spending to acquire a new user. To obtain this value, I took the total marketing costs in 2017 (567 million Euros or $700 million) and divided that by the number of new subscribers added in 2017:Cost of acquiring new user = 700 / (71 - 48*.945) = $27.30While the number of premium subscribers grew from 48 million to 71 million, I reduced the former value by the churn reported (5.5% of subscribers canceled in 2017). The value of new users then can be computed, assuming that the number of new users grows 25% a year from years 1-5, 10% a year from years 6-10 and 1% a year thereafter: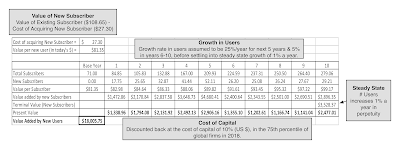 Download spreadsheetIn valuing the cash flows from new users, I use a 10% US$ cost of capital, the 75th percentile of global companies, reflecting the higher risk in this component of Spotify's value, and derive a value of about $18 billion for new users.
Spotify does get about 10% of its revenues from advertising, and I will assume that this component of revenue will persist, albeit growing at a lower rate than premium subscription revenues; the revenues will grow 10% a year for the next ten year and content costs attributable to these revenues will also show the same downward trend that they do with premium subscriptions. The value of the advertising revenues is shown to be about $2.9 billion: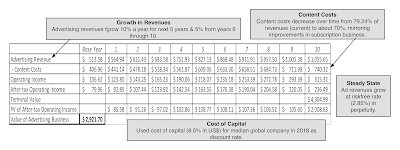 Download spreadsheetThe final component of value is mopping up for costs not captured in the pieces above. Specifically, Spotify has R&D and G&A costs that amounted to 660 million Euros in 2017 (about $815 million), which we assume will grow 5% a year for the next 10 years, well below the growth rate of revenues and operating income, reflecting economies of scale. Allowing for the tax savings, and discounting at the median cost of capital (8.5%) for a global company, I derive a value for this cost drag:
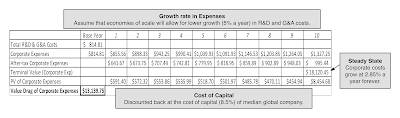 Download spreadsheetThe value for Spotify, on a user-based valuation, can then be calculated, adding in the cash balance (1,5091.81 million Euros or $1,864 million) and a cross holding in Tencent Music that I had overlooked in my DCF (valued at 910 million Euros or $1,123 million), and netting out the equity options outstanding (valued at 1344 million Euros or $1660 million):
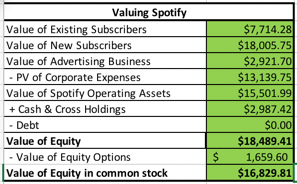 Download spreadsheetThe operating asset value is about $3.6 billion lower than the value that I obtained in my top-down DCF, and there are three reasons for the difference. The first is that I did not incorporate the benefits of the losses that Spotify has to carry forward (approximately $1.7 billion) in my subscriber-based valuation, with the resulting lost tax benefit at a 25% tax rate, of about $300 million. The second reason is that I used a composite cost of capital of 9.24% on all cash flows in top down valuation, whereas I used a lower (8.5%) cost of capital for existing users and a higher (10% cost of capital) for new users; that translates into about $600 million in lower value. The third reason is that I assumed that composite cash flows for Spotify would grow at 2.85% a year forever, while I capped the growth rate in new users to 1%, a more realistic number since inflation cannot help me on user count; using a 2.85% growth rate in the number of users after year 10 adds $2.1 billion in value. The value of equity in common stock, the number that will be most directly comparable to market capitalization on the day of the offering, is $16.8 billion.
3. The Big Data Premium?There is one final component to Spotify's value that I have drawn on only implicitly in my valuations and that is its access to subscriber data. As Spotify adds to its subscriber lists, it is also collecting information on subscriber tastes in music and perhaps even on other dimensions. In an age where big data is often used as a rationale for adding premiums to values across the board, Spotify meets the requirements for a big data payoff, listed in this post from a while back. It has exclusivity at least on the information it collects from its subscribers on their musical tastes & preferences and it can adapt its products and services to take advantage of this knowledge, perhaps in helping artists create new content and customizing its offerings. That said, I do no feel the urge to add a premium to my estimated value for three reasons:It is counted in the valuations already: In both my top down and user-based valuations, I allow Spotify to grow revenues well beyond what the current music market would support and lower content costs as they do so. That combination, I argued, is a direct result of their data advantages, and adding a premium to my estimated valued seems like double counting.Decreasing Marginal Benefits: The big data argument, even if based on exclusivity and adaptive behavior, starts to lose its power as more and more companies exploit it. As Facebook reviews our social media posts and tailors advertising, Amazon uses Prime to get into our shopping carts and Alexa to track us at home, and uses that data to launch new products and services and Netflix keeps track of the movies/TV that we watch, stop watching and would like to watch, there is not as much of us left to discover and exploit.Data Backlash: Much as we would like to claim victimhood in this process, we (collectively) have been willing participants in a trade, offering technology companies data about our private lives in return for social networks, free shipping and tailored entertainment. This week, we did see perhaps the beginnings of a reassessment of where this has led us, with the savaging of Facebook in the market. The big data debate has just begun, and I am not sure how it will end. I personally believe that we are too far gone down this road to go back, but there may be some buyers' remorse that some of us are feeling about having shared too much. If that translates into much stricter regulations on data gathering and a reluctance on our part to share private data, it would be bad news for Spotify, but it would be worse news for Google, Facebook, Netflix and Amazon. Time will tell!YouTube Video
Data LinksSpotify ProspectusSpotify DCF valuationSpotify User-based valuationBlog PostsStream On: An IPO Valuation of Spotify
1. The Pricing of SpotifyI won't bore you by going through the full details of the contrast that I see between pricing an asset and valuing it, since it has been at the heart of so many of my prior posts (like this, this and this). In short, the value of an asset is determined by its expected cash flows and the risk in these cash flows, which you can estimate imprecisely using a discounted cash flow model. The price of an asset is based on what others are paying for similar assets, requiring judgments on what comprises similar. My last post reflected my attempt to attach an intrinsic value to Spotify, but the pricing questions for Spotify are two fold: the companies that investors in the market will compare it to, to make a pricing judgment, and the metric that they will base the pricing on.
Let's start with the simplest version of pricing, a one-on-one comparison. With Spotify, the two companies that are likeliest to be offered as comparable firms are Pandora, a company that is in the same business (music streaming) as Spotify, deriving its revenues from advertising and subscription, and Netflix, a company that is also subscription-driven, and one that Spotify would like to emulate in terms of market success. Since Spotify and Pandora are reporting operating losses, there are only three metrics that you can scale the pricing of these companies to: the number of subscribers, total revenues and gross profits. I report the numbers for all three companies in the table below, in conjunction with the enterprise values for Pandora and Netflix:
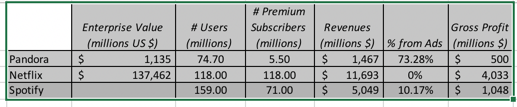 For Pandora and Netflix, the numbers for users and revenues/profits come from their most recent annual reports for the year ending December 31, 2017, and for Spotify, the numbers are from the prospectus covering the same year. To use the numbers to price Spotify, I first estimate pricing multiples for Pandora and Netflix. and then use these multiples on Spotify's metrics:
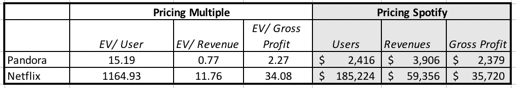 To illustrate the process, I price Spotify, relative to Pandora and based on subscribers, by first computing the enterprise value/subscriber for Pandora (EV/Subscriber= 1135/74.70 = 15.19). I then multiply this value by Pandora's total subscriber count of 159 million to arrive at a pricing of $2,416 million for Spotify. I repeat this process for Netflix, and then repeat it again with both companies, using revenues and gross profit as my scaling variables. The table of pricing estimates that I get for Spotify explains why those who are bullish on the company will try to avoid comparisons to Pandora and encourage comparisons to Netflix. If, as is rumored, Spotify's equity is priced at between $20 and $25 billion, it will look massively over priced, if compared to Pandora, but be a bargain, relative to Netflix. As you can see, each of these comparisons has problems. Spotify not only has a more subscription-based revenue model than Pandora, yielding higher overall revenues, but its more global presence (than Pandora) has insulated it better from competition from Apple Music. Netflix has an entirely subscription-based model and generates more revenues per subscriber, while facing less intense competition. The bottom line is that the pricing range for Spotify is wide, because it depends on the company you compare it to, and the metric you base the pricing on. That may come as no surprise for you, but it will explain why there will wide divergences in pricing opinion when the stock first starts to trade, resulting in wild price swings. If you are not adept at the pricing game, and I am not, you should stay with your value judgment, flawed though it might be. I will consequently stick with my intrinsic value estimate for the equity in the company.
2. A Subscriber-Based Valuation of SpotifyLast year, I did a user-based valuation of Uber and used it to understand the dynamics that determine user value and then to value Amazon Prime. That framework can be easily adapted to value Spotify subscribers, both existing and new. To value Spotify's existing subscribers, I started with the base revenue per subscriber and content costs in 2017, made assumptions about growth in each item and used a renewal rate of 94.5%, based again upon 2017 numbers (all in US dollar terms):
 Download spreadsheetNote that revenues/subscriber grow at 3% a year, faster than the growth rate of 1.5%/year in content costs, reducing content costs to 70% of subscriber revenues in year 10, consistent with the assumption I made in the top down valuation in the last post. The value of a premium subscriber, allowing for the churn in subscriptions (only 43% make it through 15 years) and reduced content costs, is $108.65, and the total value of the 71 million premium subscriptions works out to about $7.7 billion.
To estimate the value of new users, I first had to estimate how much Spotify was spending to acquire a new user. To obtain this value, I took the total marketing costs in 2017 (567 million Euros or $700 million) and divided that by the number of new subscribers added in 2017:Cost of acquiring new user = 700 / (71 - 48*.945) = $27.30While the number of premium subscribers grew from 48 million to 71 million, I reduced the former value by the churn reported (5.5% of subscribers canceled in 2017). The value of new users then can be computed, assuming that the number of new users grows 25% a year from years 1-5, 10% a year from years 6-10 and 1% a year thereafter:
 Download spreadsheetIn valuing the cash flows from new users, I use a 10% US$ cost of capital, the 75th percentile of global companies, reflecting the higher risk in this component of Spotify's value, and derive a value of about $18 billion for new users.
Spotify does get about 10% of its revenues from advertising, and I will assume that this component of revenue will persist, albeit growing at a lower rate than premium subscription revenues; the revenues will grow 10% a year for the next ten year and content costs attributable to these revenues will also show the same downward trend that they do with premium subscriptions. The value of the advertising revenues is shown to be about $2.9 billion:
 Download spreadsheetThe final component of value is mopping up for costs not captured in the pieces above. Specifically, Spotify has R&D and G&A costs that amounted to 660 million Euros in 2017 (about $815 million), which we assume will grow 5% a year for the next 10 years, well below the growth rate of revenues and operating income, reflecting economies of scale. Allowing for the tax savings, and discounting at the median cost of capital (8.5%) for a global company, I derive a value for this cost drag:
 Download spreadsheetThe value for Spotify, on a user-based valuation, can then be calculated, adding in the cash balance (1,5091.81 million Euros or $1,864 million) and a cross holding in Tencent Music that I had overlooked in my DCF (valued at 910 million Euros or $1,123 million), and netting out the equity options outstanding (valued at 1344 million Euros or $1660 million):
 Download spreadsheetThe operating asset value is about $3.6 billion lower than the value that I obtained in my top-down DCF, and there are three reasons for the difference. The first is that I did not incorporate the benefits of the losses that Spotify has to carry forward (approximately $1.7 billion) in my subscriber-based valuation, with the resulting lost tax benefit at a 25% tax rate, of about $300 million. The second reason is that I used a composite cost of capital of 9.24% on all cash flows in top down valuation, whereas I used a lower (8.5%) cost of capital for existing users and a higher (10% cost of capital) for new users; that translates into about $600 million in lower value. The third reason is that I assumed that composite cash flows for Spotify would grow at 2.85% a year forever, while I capped the growth rate in new users to 1%, a more realistic number since inflation cannot help me on user count; using a 2.85% growth rate in the number of users after year 10 adds $2.1 billion in value. The value of equity in common stock, the number that will be most directly comparable to market capitalization on the day of the offering, is $16.8 billion.
3. The Big Data Premium?There is one final component to Spotify's value that I have drawn on only implicitly in my valuations and that is its access to subscriber data. As Spotify adds to its subscriber lists, it is also collecting information on subscriber tastes in music and perhaps even on other dimensions. In an age where big data is often used as a rationale for adding premiums to values across the board, Spotify meets the requirements for a big data payoff, listed in this post from a while back. It has exclusivity at least on the information it collects from its subscribers on their musical tastes & preferences and it can adapt its products and services to take advantage of this knowledge, perhaps in helping artists create new content and customizing its offerings. That said, I do no feel the urge to add a premium to my estimated value for three reasons:It is counted in the valuations already: In both my top down and user-based valuations, I allow Spotify to grow revenues well beyond what the current music market would support and lower content costs as they do so. That combination, I argued, is a direct result of their data advantages, and adding a premium to my estimated valued seems like double counting.Decreasing Marginal Benefits: The big data argument, even if based on exclusivity and adaptive behavior, starts to lose its power as more and more companies exploit it. As Facebook reviews our social media posts and tailors advertising, Amazon uses Prime to get into our shopping carts and Alexa to track us at home, and uses that data to launch new products and services and Netflix keeps track of the movies/TV that we watch, stop watching and would like to watch, there is not as much of us left to discover and exploit.Data Backlash: Much as we would like to claim victimhood in this process, we (collectively) have been willing participants in a trade, offering technology companies data about our private lives in return for social networks, free shipping and tailored entertainment. This week, we did see perhaps the beginnings of a reassessment of where this has led us, with the savaging of Facebook in the market. The big data debate has just begun, and I am not sure how it will end. I personally believe that we are too far gone down this road to go back, but there may be some buyers' remorse that some of us are feeling about having shared too much. If that translates into much stricter regulations on data gathering and a reluctance on our part to share private data, it would be bad news for Spotify, but it would be worse news for Google, Facebook, Netflix and Amazon. Time will tell!YouTube Video
Data LinksSpotify ProspectusSpotify DCF valuationSpotify User-based valuationBlog PostsStream On: An IPO Valuation of Spotify
March 16, 2018
Stream On: An IPO Valuation of Spotify!
In the last few weeks, we have seen two high profile unicorns file for initial public offerings. The first out of the gate was Dropbox, a storage solution for a world where gigabyte files are the rule rather than the exception, with a filing on February 23. Following close after, on February 28, Spotify, positioning itself as the music streaming analog to Netflix, filed its prospectus. With it's larger potential market capitalization and unusual IPO structure, Spotify has attracted more attention than Dropbox, and I would like to focus this post on it.
Spotify: The Back StorySpotify was founded in 2008 in Sweden, by Daniel Ek and Martin Lorentzon, as a music streaming service. The timing was opportune, since the company caught and contributed to a shift in the music business, as users have moved away from paying for physical (records, CDs) to digital, as evidenced in the graph below: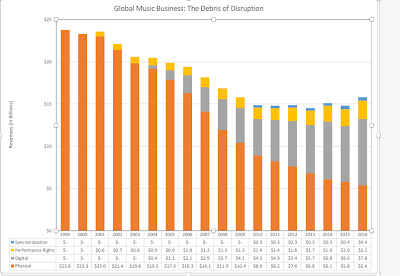 Source: IFPINote that not only has the move towards streaming, in proportional terms, been dramatic, but disruption has come with pain for the music business, with a drop in aggregate revenues from $24 billion in 1999 to about $16 billion in 2016. In a bright spot, revenues have started rising again in 2016 and 2017, and it is possible that the business will rediscover itself, with a new digital model. Spotify was not the first one in the business, being preceded by both Pandora and Soundcloud, but its success is testimonial to the proposition that the spoils seldom go to the first movers in any business disruption.
The Spotify business model is a simple one. Listeners can subscribe to a free version, with limited customization features (playlists, stations etc.) and online ads. Alternatively, they can subscribe to a premium version of the service, paying a monthly fee, in return for a plethora of customization options, and no ads. The company's standard service cost $9.99/month in the United States in 2018, with a family membership, where up to six family members living at the same address, can share a family service for $14.99/month, while preserving individualized playlists and stations. Prices vary globally, ranging from a high of $16.94 in the UK (for standard service) to much lower prices in Eastern Europe and Latin America. (You can check out the variations in this fascinating link that reports the prices across the world for Spotify, in dollar terms.) Spotify pays for its music content, based upon how often a song is streamed, but the rates vary depending on whether it is on the free or premium service and where in the world, creating some complexity in how it is computed. To get a sense of where Spotify stands right now and how it got there, I looked the prospectus, with the intent of catching broad trend lines. I came up with the following:
Explosive Growth: Spotify is coming off a growth burst, especially since 2015, in both number of users and revenues, as can be seen in the graph below. Revenues have increased from 1.94 billion Euros to 4.09 billion Euros, reflecting both a growth in subscribers from 91 million to 159 million, and a change in the composition, with premium members climbing from about 31% of total subscribers in 2015 to 45% of subscribers in 2017.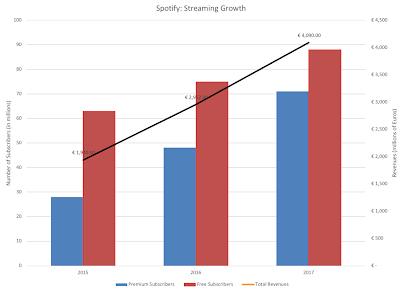 Source: Spotify ProspectusSubscription Revenue dominates Ad Revenue: Spotify's focus on improving its premium subscriptions is explained easiest by looking at the breakdown of revenues each year, where subscription revenues have accounted for 90% of revenues each year from 2015 to 2017. The one discordant note is that average revenue per premium subscriber has dropped over the same period 7.06 Euros/month to 5.24 Euros/month, a change that the company ascribes to family memberships, but a problematic trend nevertheless:
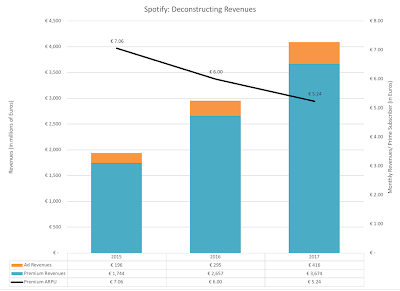 Source: Spotify ProspectusContent Costs are coming down: While Spotify insists that it is not scaling back payouts to music labels and artists, the company has been able to lower its content costs as a percent of revenues each year from 88.7% of revenues in 2015 to 79.2% of revenues in 2017. In fact, Spotify has conveyed to investors that its intent is to earn gross margins of 30%-35%, implying that it sees content costs dropping to 65%-70% of revenues. There is an inherent tension here between what Spotify has to convince its investors it can do and what it tells the music industry it is doing and the tension will only intensify, after the company goes public.
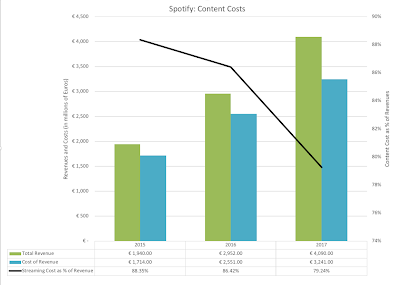 Source: Spotify ProspectusOther costs are trending up: There are three other buckets of cost at Spotify -R&D, Selling & Marketing and G&A- and these costs are not only growing but eating up larger proportion of revenues. If there are economies of scale, as you would expect in most businesses, they are not manifesting themselves in the numbers yet. The collective load of these expenses are creating operating losses, and while margins have become less negative, it is primarily through the content cost controls.
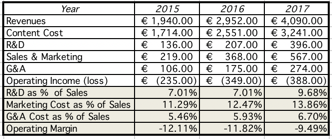 Source: Spotify Prospectus
At this stage of its story, Spotify is a growth company with lots of potential (no irony intended) but lots of rough spots to work out.
The Spotify IPOI have posted ahead of IPOs for many companies in the last decade, ranging from Facebook to Twitter to Alibaba to Snap, but Spotify's IPO is different for two reasons:
No Banks: In a typical IPO, the issuing company seeks out an investment bank, which not only sets an offering price (backed up by a guarantee) but also creates a syndicate with other banks to market the IPO, in roadshows and private client pitches. The Spotify IPO will dispense with the bankers and go directly to the market, letting demand and supply set the price on the opening day.Cashing Out: In most IPOs, the cash that comes in on the offering, from the shares that are bought by the public, is kept in the company, either to retire existing financing that is not advantageous to the firm, or to cover future investment needs. Spotify is aiming to raise about $1 billion from its offering, but none of it will go to company. Instead, existing equity investors in the company will be receiving the cash in return for their holdings.As a potential investor, I am less concerned about the "no banker" part of the IPO than I am by the "cash out:" part of the transaction:
No bankers, no problem: I think that the banking role in IPOs is overstated, especially for a company as high profile as Spotify. Bankers don't value IPOs; they price them, usually with fairly crude pricing metrics, though they often reverse engineer DCFs to back up their pricing. Their guarantee on the offering price is significantly diluted in value by the fact that they set offering prices 10% to 15% below what they think the market will bear, and their marketing efforts are more useful in gauging demand than in selling the securities. From an investor perspective, there is little that I learn from road shows that I could not have learned from reading the prospectus, and there is almost as much disinformation as information meted out as part of the marketing.Control or Growth: I find it odd that a company like Spotify, growing at high rates and losing money while doing so, would turn away a billion in cash that could be used to cover its growth needs for the near future. The cashing out of existing owners sends two negative signals. The first is that they (equity investors who cash out) do not feel that staying on as investors in the company, as a publicly traded entity, is worth it. Since they have access to data that I don't, I would like to know what they see in the company's future. The second is that the structure of the share offering, with voting and non-voting shares, indicates a consolidation of control with the founders, and the offering may provide an opportunity to get rid of dissenting voices.
My Spotify ValuationIn keeping with my view that you need a story to provide a framework for you valuation inputs, and especially so for young companies, I constructed a story for Spotify with the following elements:
Continued (but Slower) Revenue Growth: Spotify's success in scaling up over the last three years also sets the stage for a slowing down of growth in the future, with competition for Apple Music (backed by Apple's deep pockets) contributing to the trend. A combination of increases in subscriber numbers and a leveling off and even a mild increase in subscription per member will translate into a revenue growth of 25% a year for the next five years, scaling down to much lower growth in the years after. Implicit in this story is the assumption that the music business overall has turned the corner and that aggregate revenues will continue to post increases like they did in 2016 and 2017.With Reduced Content Costs: Spotify's entire value proposition rests on improved operating margins and a large portion of the improvement has to come from continuing to reduce content costs as a percent of revenues. Since Spotify pays for its content based upon song streams, those savings have to come from either paying less per stream (which is going to and should create push back from labels and artists) or finding ways to create economies of scale on this cost component. In it's defense, Spotify can point to its track record from 2015 to 2017 in reducing content costs. I assume that they can reduce content costs to 70% of revenues, while finding a way to keep artists and labels happy. That is not going to be an easy balance to maintain, especially with the top artists, as evidenced by Taylor Swift's and Jay-Z's decisions to pull their music from Spotify.And Economies of Scale on Other Costs: Of the three other costs, the marketing expenses are the ones most likely to scale down as growth declines, but for Spotify to deliver solid operating margins, it also has to bring R&D costs and G&A costs under control. I may be over optimistic on this front, but here is what my projected values yield for my target operating margin (ten years from now):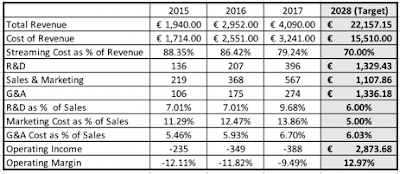 With Limited Capital Investments: Spotify's business model is built for scaling, with little need for capital reinvestment, except for R&D. Consequently, I assume that small capital investments can generate large revenues, using a sales to capital ratio of 4.00 (putting it at the 90th percentile of global companies) to estimate reinvestment.Manageable Operating Risk but Significant Failure Risk: Spotify's subscription based model and low turnover rate among subscribers does lend some stability to revenues, though adding more subscribers and going for growth is a riskier proposition. Overall, allowing for their business mix (90% entertainment, 10% advertising) and their global mix of revenues yields a cost of capital of 9.24%, at the 80th percentile of global companies; the firm is planning to convert much of its debt into equity at the time of the IPO, giving it a equity dominated capital structure. However, the company is still young, losing money and faces deep pocketed competition, suggesting that failure is a very real possibility. I assume a 20% chance of failure, with failure translating into selling the company to the highest bidder at half of its going concern value.Loose Ends: To estimate equity value in common shares, I add the cash balance of the company of 1.5 billion Euros, ignore the proceeds from the IPO because of the cash-out structure and net out the value of 20.82 million options/warrants outstanding, with an average strike price of 42.56 Euros per share. Dividing the equity value by 177.17 million shares (including restricted shares) yields a value per share of 88.26 Euros per share or $108.97. The shares that you will be buying will be non-voting, implying a discount on this number, though how much you discount it will depend on how much you like and trust the company's founders.The entire picture, with the story embedded in it, is shown below. You can also download the spreadsheet here:
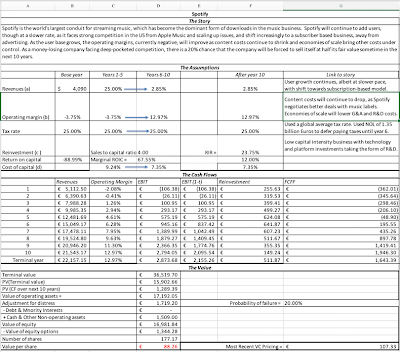 Download spreadsheetIt goes without saying, but I will say it anyway, that I made lots of assumptions to get to my value and that you may (and should) disagree with me or some or even all of these assumptions. You are welcome to download the spreadsheet that contains my valuation of Spotify and make it your own.
Bottom LineThere are three elements missing in this post. First, I have argued in my prior IPO posts that what happens after initial public offerings is more of a pricing game than a value game. To those of you who want to play that game, I don't think that this post is going to be very helpful. In my next post, I will look at how best to price Spotify, why you will hear pessimists about the company talk a lot about Pandora and optimists about Netflix. Second, there is the argument that top down valuations, like the one in this post, are ill equipped to value user or subscriber based companies. I will also use the user-based model that I introduced last year to value an Uber rider and an Amazon Prime member to value a Spotify subscriber. Finally, there is the lurking question of what Spotify is learning about its subscriber music tastes and how that data can be used to not only modify its offerings but perhaps create content that is more closely tailored to these tastes. That too has to wait for the next post.
YouTube
Data LinksSpotify ProspectusSpotify Valuation (Mine)
Spotify: The Back StorySpotify was founded in 2008 in Sweden, by Daniel Ek and Martin Lorentzon, as a music streaming service. The timing was opportune, since the company caught and contributed to a shift in the music business, as users have moved away from paying for physical (records, CDs) to digital, as evidenced in the graph below:
 Source: IFPINote that not only has the move towards streaming, in proportional terms, been dramatic, but disruption has come with pain for the music business, with a drop in aggregate revenues from $24 billion in 1999 to about $16 billion in 2016. In a bright spot, revenues have started rising again in 2016 and 2017, and it is possible that the business will rediscover itself, with a new digital model. Spotify was not the first one in the business, being preceded by both Pandora and Soundcloud, but its success is testimonial to the proposition that the spoils seldom go to the first movers in any business disruption.
The Spotify business model is a simple one. Listeners can subscribe to a free version, with limited customization features (playlists, stations etc.) and online ads. Alternatively, they can subscribe to a premium version of the service, paying a monthly fee, in return for a plethora of customization options, and no ads. The company's standard service cost $9.99/month in the United States in 2018, with a family membership, where up to six family members living at the same address, can share a family service for $14.99/month, while preserving individualized playlists and stations. Prices vary globally, ranging from a high of $16.94 in the UK (for standard service) to much lower prices in Eastern Europe and Latin America. (You can check out the variations in this fascinating link that reports the prices across the world for Spotify, in dollar terms.) Spotify pays for its music content, based upon how often a song is streamed, but the rates vary depending on whether it is on the free or premium service and where in the world, creating some complexity in how it is computed. To get a sense of where Spotify stands right now and how it got there, I looked the prospectus, with the intent of catching broad trend lines. I came up with the following:
Explosive Growth: Spotify is coming off a growth burst, especially since 2015, in both number of users and revenues, as can be seen in the graph below. Revenues have increased from 1.94 billion Euros to 4.09 billion Euros, reflecting both a growth in subscribers from 91 million to 159 million, and a change in the composition, with premium members climbing from about 31% of total subscribers in 2015 to 45% of subscribers in 2017.
 Source: Spotify ProspectusSubscription Revenue dominates Ad Revenue: Spotify's focus on improving its premium subscriptions is explained easiest by looking at the breakdown of revenues each year, where subscription revenues have accounted for 90% of revenues each year from 2015 to 2017. The one discordant note is that average revenue per premium subscriber has dropped over the same period 7.06 Euros/month to 5.24 Euros/month, a change that the company ascribes to family memberships, but a problematic trend nevertheless:
 Source: Spotify ProspectusContent Costs are coming down: While Spotify insists that it is not scaling back payouts to music labels and artists, the company has been able to lower its content costs as a percent of revenues each year from 88.7% of revenues in 2015 to 79.2% of revenues in 2017. In fact, Spotify has conveyed to investors that its intent is to earn gross margins of 30%-35%, implying that it sees content costs dropping to 65%-70% of revenues. There is an inherent tension here between what Spotify has to convince its investors it can do and what it tells the music industry it is doing and the tension will only intensify, after the company goes public.
 Source: Spotify ProspectusOther costs are trending up: There are three other buckets of cost at Spotify -R&D, Selling & Marketing and G&A- and these costs are not only growing but eating up larger proportion of revenues. If there are economies of scale, as you would expect in most businesses, they are not manifesting themselves in the numbers yet. The collective load of these expenses are creating operating losses, and while margins have become less negative, it is primarily through the content cost controls.
 Source: Spotify Prospectus
At this stage of its story, Spotify is a growth company with lots of potential (no irony intended) but lots of rough spots to work out.
The Spotify IPOI have posted ahead of IPOs for many companies in the last decade, ranging from Facebook to Twitter to Alibaba to Snap, but Spotify's IPO is different for two reasons:
No Banks: In a typical IPO, the issuing company seeks out an investment bank, which not only sets an offering price (backed up by a guarantee) but also creates a syndicate with other banks to market the IPO, in roadshows and private client pitches. The Spotify IPO will dispense with the bankers and go directly to the market, letting demand and supply set the price on the opening day.Cashing Out: In most IPOs, the cash that comes in on the offering, from the shares that are bought by the public, is kept in the company, either to retire existing financing that is not advantageous to the firm, or to cover future investment needs. Spotify is aiming to raise about $1 billion from its offering, but none of it will go to company. Instead, existing equity investors in the company will be receiving the cash in return for their holdings.As a potential investor, I am less concerned about the "no banker" part of the IPO than I am by the "cash out:" part of the transaction:
No bankers, no problem: I think that the banking role in IPOs is overstated, especially for a company as high profile as Spotify. Bankers don't value IPOs; they price them, usually with fairly crude pricing metrics, though they often reverse engineer DCFs to back up their pricing. Their guarantee on the offering price is significantly diluted in value by the fact that they set offering prices 10% to 15% below what they think the market will bear, and their marketing efforts are more useful in gauging demand than in selling the securities. From an investor perspective, there is little that I learn from road shows that I could not have learned from reading the prospectus, and there is almost as much disinformation as information meted out as part of the marketing.Control or Growth: I find it odd that a company like Spotify, growing at high rates and losing money while doing so, would turn away a billion in cash that could be used to cover its growth needs for the near future. The cashing out of existing owners sends two negative signals. The first is that they (equity investors who cash out) do not feel that staying on as investors in the company, as a publicly traded entity, is worth it. Since they have access to data that I don't, I would like to know what they see in the company's future. The second is that the structure of the share offering, with voting and non-voting shares, indicates a consolidation of control with the founders, and the offering may provide an opportunity to get rid of dissenting voices.
My Spotify ValuationIn keeping with my view that you need a story to provide a framework for you valuation inputs, and especially so for young companies, I constructed a story for Spotify with the following elements:
Continued (but Slower) Revenue Growth: Spotify's success in scaling up over the last three years also sets the stage for a slowing down of growth in the future, with competition for Apple Music (backed by Apple's deep pockets) contributing to the trend. A combination of increases in subscriber numbers and a leveling off and even a mild increase in subscription per member will translate into a revenue growth of 25% a year for the next five years, scaling down to much lower growth in the years after. Implicit in this story is the assumption that the music business overall has turned the corner and that aggregate revenues will continue to post increases like they did in 2016 and 2017.With Reduced Content Costs: Spotify's entire value proposition rests on improved operating margins and a large portion of the improvement has to come from continuing to reduce content costs as a percent of revenues. Since Spotify pays for its content based upon song streams, those savings have to come from either paying less per stream (which is going to and should create push back from labels and artists) or finding ways to create economies of scale on this cost component. In it's defense, Spotify can point to its track record from 2015 to 2017 in reducing content costs. I assume that they can reduce content costs to 70% of revenues, while finding a way to keep artists and labels happy. That is not going to be an easy balance to maintain, especially with the top artists, as evidenced by Taylor Swift's and Jay-Z's decisions to pull their music from Spotify.And Economies of Scale on Other Costs: Of the three other costs, the marketing expenses are the ones most likely to scale down as growth declines, but for Spotify to deliver solid operating margins, it also has to bring R&D costs and G&A costs under control. I may be over optimistic on this front, but here is what my projected values yield for my target operating margin (ten years from now):
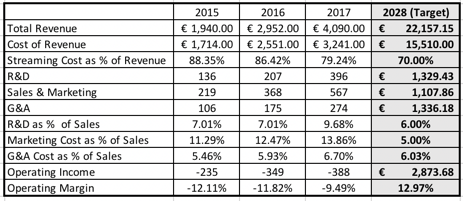 With Limited Capital Investments: Spotify's business model is built for scaling, with little need for capital reinvestment, except for R&D. Consequently, I assume that small capital investments can generate large revenues, using a sales to capital ratio of 4.00 (putting it at the 90th percentile of global companies) to estimate reinvestment.Manageable Operating Risk but Significant Failure Risk: Spotify's subscription based model and low turnover rate among subscribers does lend some stability to revenues, though adding more subscribers and going for growth is a riskier proposition. Overall, allowing for their business mix (90% entertainment, 10% advertising) and their global mix of revenues yields a cost of capital of 9.24%, at the 80th percentile of global companies; the firm is planning to convert much of its debt into equity at the time of the IPO, giving it a equity dominated capital structure. However, the company is still young, losing money and faces deep pocketed competition, suggesting that failure is a very real possibility. I assume a 20% chance of failure, with failure translating into selling the company to the highest bidder at half of its going concern value.Loose Ends: To estimate equity value in common shares, I add the cash balance of the company of 1.5 billion Euros, ignore the proceeds from the IPO because of the cash-out structure and net out the value of 20.82 million options/warrants outstanding, with an average strike price of 42.56 Euros per share. Dividing the equity value by 177.17 million shares (including restricted shares) yields a value per share of 88.26 Euros per share or $108.97. The shares that you will be buying will be non-voting, implying a discount on this number, though how much you discount it will depend on how much you like and trust the company's founders.The entire picture, with the story embedded in it, is shown below. You can also download the spreadsheet here:
 Download spreadsheetIt goes without saying, but I will say it anyway, that I made lots of assumptions to get to my value and that you may (and should) disagree with me or some or even all of these assumptions. You are welcome to download the spreadsheet that contains my valuation of Spotify and make it your own.
Bottom LineThere are three elements missing in this post. First, I have argued in my prior IPO posts that what happens after initial public offerings is more of a pricing game than a value game. To those of you who want to play that game, I don't think that this post is going to be very helpful. In my next post, I will look at how best to price Spotify, why you will hear pessimists about the company talk a lot about Pandora and optimists about Netflix. Second, there is the argument that top down valuations, like the one in this post, are ill equipped to value user or subscriber based companies. I will also use the user-based model that I introduced last year to value an Uber rider and an Amazon Prime member to value a Spotify subscriber. Finally, there is the lurking question of what Spotify is learning about its subscriber music tastes and how that data can be used to not only modify its offerings but perhaps create content that is more closely tailored to these tastes. That too has to wait for the next post.
YouTube
Data LinksSpotify ProspectusSpotify Valuation (Mine)
March 5, 2018
Damodaran Online: There is an App for that!
My posts over the last two months have been heavy, dealing first with my data update from January 2018, and with the market and its volatility in the last few weeks. I felt like taking a break and talking about something lighter and more personal, and giving you an update on my teaching, writing and data plans for this year, with news about an app for the iPhone or iPad that you might (or might not) find useful. I won't fault you if you are not in the least bit interested in what I am doing, and if so, please do skip this post, since it will bore you!
Teaching UpdateAs some of you may know, I have taught at the Stern School of Business at NYU since 1986, teaching two classes, a Corporate Finance class every spring and a Valuation class every fall and spring. If you have been reading this blog for a while, you also know that I invite the rest of the world to join me in these classes, through a multitude of platforms (iTunes U, Online, YouTube). If you are wondering why you have not received an invite to the classes this academic year, the answer is simple.
I am on sabbatical this academic year, living in California, and will not be teaching at Stern at least through September 2018. I am enjoying keeping what I call beach bum hours (8.30 am-12.30 pm), but I have to confess that I miss teaching, and my weeks feel unstructured without my Monday/Wednesday classes, but I love teaching too much to take a complete break from it. I continue to teach my compressed valuation classes, trying to fit in everything in my regular classes into one or two days, with stints coming up in Amsterdam (March 7), London (March 8-10), Mumbai (April 19,20), Manila (May 15-16), Bangkok (May 17-18), Warsaw and Prague (June 2018) just in the next few months.
I am also planning on redoing the investments philosophies class that I have only online, but which is showing its age, in the next three months and adding to the in-practice videos that I supplement my valuation and corporate finance classes.
Research Writing UpdateAfter my most recent post on interest rates and stock prices, I received one response that made me laugh and here is what it said: “Bro, Please stop. get your head out of academia and into reality’. I assume, since I was not this person’s brother, that the “Bro” was an attempt to establish street cred (though I am not sure that it works on this audience), but it was the “academia” part that I found humorous. If I am an academic, I am one in awfully bad standing, since I have not submitted a paper for publication in close to two decades and spend little time at academic conferences. That said, I love to write and I am continuing to do so on my sabbatical, on several fronts.
First, there are my blog posts, which I know are way too long and not very frequent, but I try (though I sometimes fail) to not spout off about things I do not understand or know much about. Second, I spent the last few months of last year finishing the third edition of one my books, The Dark Side of Valuation, the first edition of which was born at the peak of the dot com boom, about valuing difficult-to-value companies from start-ups to banks. The book is in its final printing stages and should be available in bookstores shortly (Amazon link). Third, I am turning my attention to what I hope will be my next project, which I hope will become a book, on the difference between pricing an asset and valuing it, a theme that I have mined for multiple posts over the last few years. Fourth, In a couple of weeks, I hope to post the updated installment of my Equity Risk Premium paper, which I first wrote and posted in 2008 (right after the crisis) and have revisited every March since. (Link to 2017 version). Later this summer, I will update my Country Risk Premium paper, focusing more closely just on country risk. (Link to 2017 version) Finally, during the course of the next few months, I will also be taking the work that I have done on valuing users and converting into a paper. I will keep you updated as each project is complete.
Data & Tools UpdateI maintain a number of data sets on corporate finance and valuation that I update on an annual basis at the start of the year. I wrote a series of posts on what I learned looking at the data this year, in January, and you can read all ten posts, if you are so inclined. January 2018 Data Update 1: Numbers don't lie, or do they?January 2018 Data Update 2: The Buoyancy of US Equities!January 2018 Data Update 3: Taxing Questions on ValueJanuary 2018 Data Update 4: The Currency ConundrumJanuary 2018 Data Update 5: Country Risk UpdateJanuary 2018 Data Update 6: A Cost of Capital PrimerJanuary 2018 Data Update 7: Growth and Value - Investment ReturnsJanuary 2018 Data Update 8: Debt and TaxesJanuary 2018 Data Update 9: Dividends, Buybacks and Cash HoldingsJanuary 2018 Data Update 10: The Price is Right!While I will not update much of this data during the course of the year, I will continue to post my estimates for the equity risk premium for the S&P 500 at the start of every month, continuing a series that started in September 2008.
The tools that I offer are three fold.
First, I have excel spreadsheets for corporate finance and valuatoion, and they are not polished, lacking formatting finesse and macro add-ons, but I view them as raw material that you can mold to your liking. Second, my YouTube videos are classified by playlists into my class videos, tool videos and blog post videos. Finally, I do have an app for the iPhone and iPad called uValue, that I co-developed with Anant Sundaram, professor at Dartmouth, that does intrinsic valuation. Give it a shot!You welcome to use these tools, but please recognize that this is all they are, and it is your insight and common sense that will make them shine.
Interface UpdateAs the material that I have grows, I have struggled with how best to organize it and present it. My website has much of the material but you need to be on a computer, with an internet connection, to access much of it, and finding what you want can be a challenge. I am glad that there are some people who find the material useful and am humbled by their gratitude and their offers to help. To illustrate, a few months ago, I received an email from Taha Maddam, who had used the site, and he offered to create an app that would contain the material. I thanked him, but I pointed out that since the site was not commercial, I could not spend much to make the conversion, but he graciously offered to do it for nothing. Knowing how much work was involved, I did not expect him to follow through, especially since he works full time in Shanghai and has a young family.
Taha surprised me just over a week ago, when he said the app was ready and that I could take it for a spin. I did and I was dazzled, since it contained all the information in my website, on my blog and on YouTube, in one location. If you have an Apple device (iPhone or iPad), you can download the app either from the app store (type in "Damodaran" in the search box, and it should pop up) or by going to the launching page that Taha has created for the app. If you like our app (while the material is mine, this app is Taha’s doing), please pass on the word and compliment Taha for a job well done. If you are an Android user, I am truly sorry that the app does not work on your devices yet, but I will have to wait on the kindness of strangers, for that to happen. In the meantime, if you can think of what we can add on to the app to make it more useful, please let us know.
YouTube
Links
Launching Page for Damodaran Online App (you can download from here)Damodaran Online Website
Aswath Damodaran's Blog

- Aswath Damodaran's profile
- 725 followers
Aswath Damodaran isn't a Goodreads Author
(yet),
but they
do have a blog,
so here are some recent posts imported from
their feed.

