
Aswath Damodaran's Blog, page 14
March 9, 2020
A Viral Market Meltdown Part II: Clues in the Debris!
Update on 3.9/20: In a sign of how volatile times are, over the weekend, oil prices plummeted to close to $30, the treasury bond rate to less than 0.4% and the market looks set to drop substantially. A work in progress indeed....
I wrote a post on how the Corona Virus was playing out in markets on February 26, two days into the market going into convulsions, and while I tried to make an assessment of the value effect, I also said that this analysis was a work in progress, that I would revisit as we learned more about the virus and its economic consequences. Eleven days later, we still don't have clarity on the health or economic effects of the virus, but we do have substantially more data on what the market reaction has been. In this post, I will begin by doing a quick update on the viral spread across the world, but spend more time on the market damage, looking at where it has been greatest, seeking clues for the future.
A Virus UpdateIn the last week and a half, the virus has clearly expanded its global footprint, with Italy and South Korea now in the front lines, in terms of exposure, but with the numbers climbing rapidly across the rest of the world, it is clearly now on its way to becoming a global pandemic. NY Times, as of March 6, 2020
While the word "pandemic" alone is often enough to drive us to panic, it is not the first, nor will it be the last, and it helps to gain perspective to compare it to pandemics in the past, both in terms of contagion and health consequences. This chart from the New York Times reflects what we know about the virus as of February 28, 2020: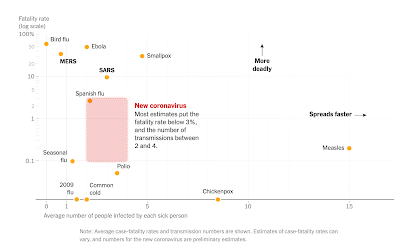 Note that the large band of uncertainty around the fatality rate related to the virus, reflecting how little we know about its potential consequences and how it measures up against other viruses in terms of contagion. Put simply, this is not just the common flu with side effects, as some have argued, but it is perhaps not the deadly killer that others at the other extreme has painted it as. The X factor that makes this virus potentially more difficult to contain and more likely to have global consequences is globalization, one more argument that populists will undoubtedly use to argue against it. The reality is that travel, especially across borders and continents, is not only easier than ever before but also more affordable, as income levels rise in the developing world. Over the next few weeks, it is likely that we will see the case numbers rise dramatically in countries which have been hitherto exposed only lightly to the virus, the fatality numbers will rise among those affected, and health systems around the world will come under pressure.
A Market UpdateOver the last three weeks, we have had a glimpse of how quickly market moods can shift. Looking at the major US equity indices, you can see the euphoria that resulted in the market peaking on February 12, 2020, not only faded quickly but has been replaced with panic and desperation: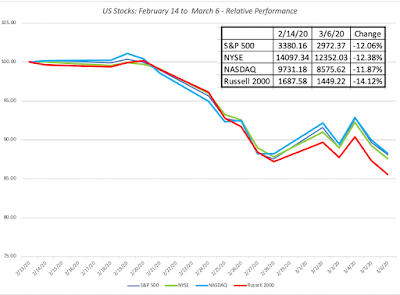 If there is one thing that can be said about markets during this tumultuous period, they were not playing favorites, since all of the indices registered double git drops, with the NASDAQ showing the smallest drop.
a. Melting Away - Dollar Value LostThe focus on the indices can obscure the staggering decline in market values that occurred in a three-week period and in the table below, I chronicle the loss in market value globally, broken down by region.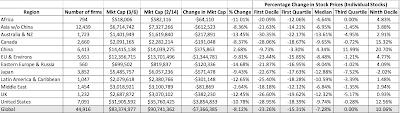 Download spreadsheetThe first four columns look at total market capitalization and the change in both dollar and percentage terms between February 14, 2020 and March 6, 2020. Globally, equity markets lost $7.3 trillion in value over this three-week period, and it is ironic that China, the starting point for the Corona Virus, is the only part of the world where stocks have collectively seen an increase in market capitalization. That can be explained perhaps by the fact that Chinese stocks had already registered drops in the weeks leading into February 14, and that the rest of the world is playing catch up. The last five columns look at the percentage change in individual stocks to illustrate how widely the pain was felt. In ten of the twelve regions, with China and Africa being the exceptions, less than 25% of stocks went up during the three week period. In most of the markets, the percentage change in overall market capitalization is similar to the percentage change in the median stock, indicating that this is not a decline being caused by a subset of stocks being hit with extreme price movements.
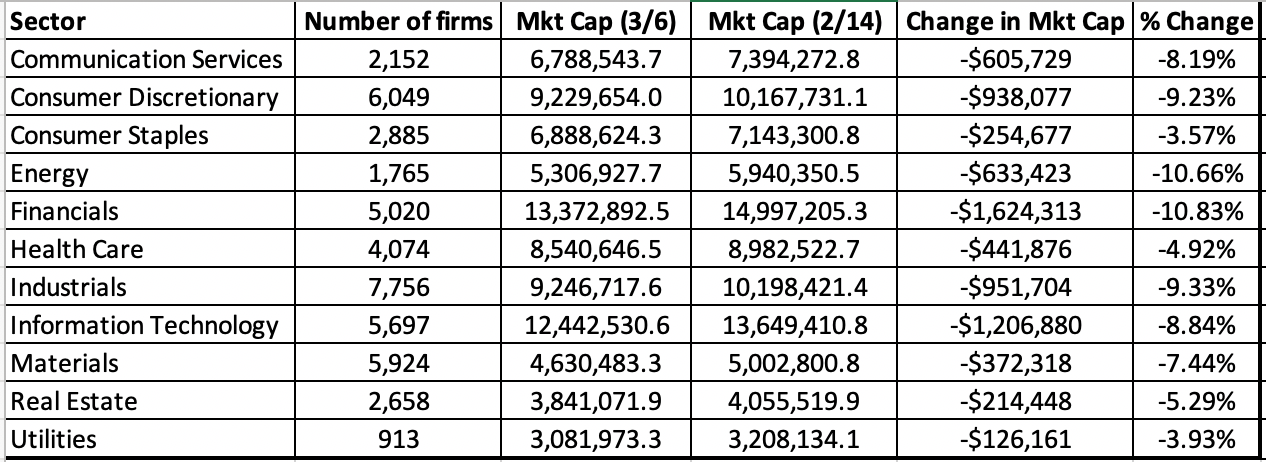
b. The Sector/Industry BreakdownThere is no question that the virus not only has the potential to hurt the global economy, but the hurt will be felt disproportionately by companies in different businesses. To assess how the market has repriced different sectors, I look at the market capitalization lost, in both dollar and percent terms, by sector, for global companies: Download spreadsheetThe biggest losers were energy and financial service companies, and the sectors that performed the best were utilities, health care, real estate and consumer staples. Breaking down the sectors into more detail, I looked at US stocks, by industry, and the following is the list of the five worst and five best performing industries between February 14 and March 6:
 Download spreadsheet
The full list is available for download by clicking here. For anyone who has been following the news stories of airlines scrambling to cancel flights and mollify passengers and hotels dealing with cancellations, it should come as no surprise that aviation and hotel stocks were the worst performing industry groupings, followed by oil, broadcasting and life insurance. The best performing industry grouping also carries no surprises, with precious metal companies benefiting from the rise in gold prices, grocery retailers and tobacco drawing on their strengths as non-discretionary products and biotech companies benefiting from the focus on a solution for the virus.
c. Size ClassesThe conventional wisdom, when there is a market crisis, is that investors move their money to safety. While that has clearly happened with money shifting into US treasuries, the question is whether investors are abandoning smaller companies for larger ones, presumably driven by the perception that smaller companies are riskier than larger ones. To answer this question, I looked at all global companies, broken down by market capitalization into ten classes: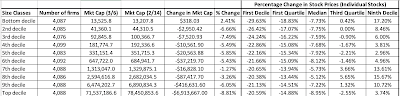 Download spreadsheetThe results don't line up with expectations, as small companies saw a small increase in overall market capitalization and large cap stocks registered the largest decline. It is worth noting that even among the smallest stocks, the median stock lost 7.73%, suggesting that the increase in value is coming from a small percentage of stocks in the group. (Looking at just US stocks, you get very similar results.)
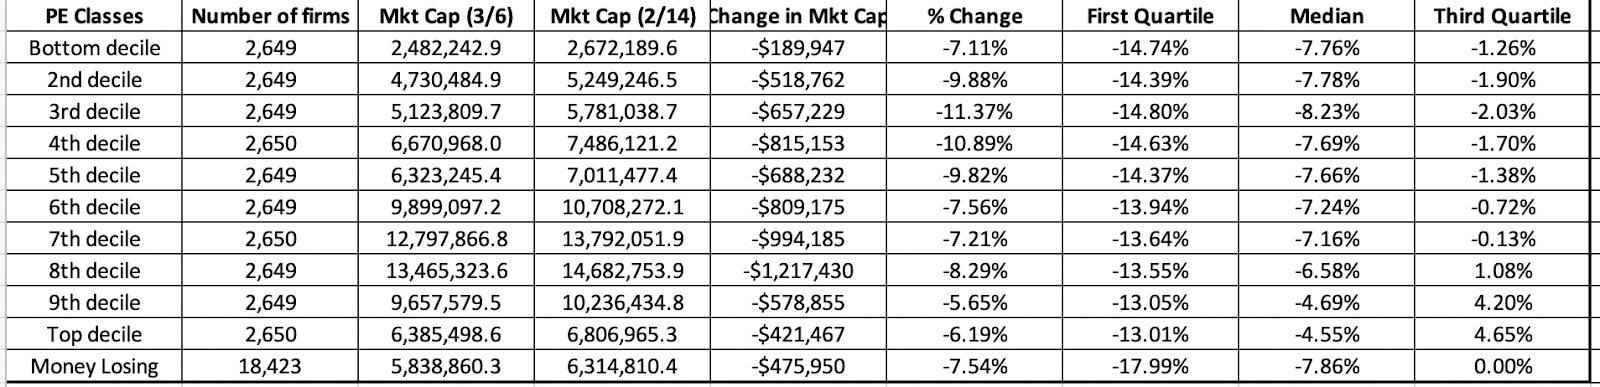
d. Value and Momentum ClassesThe drop in the market has provided some measure of vindication to those who have long been arguing that the market is over priced, but while the fact that the market was priced so richly set it up for a larger fall, breaking down the decline in market cap into classes can provide us some insight into whether the stocks that had gone up the most were the ones that saw the biggest drop off in value between February 14 and March 6. In the table, we break global stocks down into ten classes based upon the price change in the year prior to February 14 and look at the change in market capitalization, by class: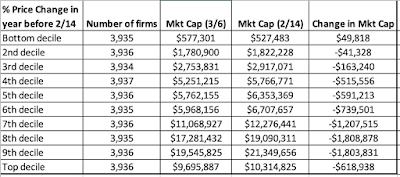 Download spreadsheetIn keeping with the story that what goes up the most must come down the most, you find that stocks that had performed the worst in the year leading into February 14 had an increase in market capitalization, though the median stock was still down, within this group. Using another proxy for rich pricing, I also broke stocks down by PE ratio classes from lowest to highest, based upon market capitalization on February 14, 2020, and looked at the change in market value between February 14 and March 6:
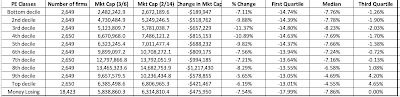 Download spreadsheetHere, the evidence contradicts the market correction hypothesis, since there is no discernible relationship between PE ratios and market value change. In fact, the best performing stocks are in the top two deciles of PE ratios.
e. The Rest of the StoryOne of the perils of getting focused on equity markets is that you can miss all of the action in other markets, and the changes in those markets can not only help augment the story that equities are telling us, but they can yield insight into other facets.
I. US Treasury ratesIf the drop in stock prices over the last three weeks took your breath away, the shifts in the treasury market were even larger and more unsettling: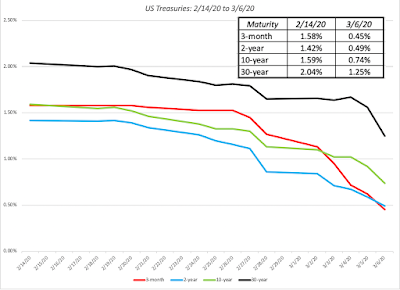
The 10-year US T.Bond dropped below 1% for the first time in history on March 3 and continued trending down to settle at 0.74% on March 6. In tandem, the other treasuries also dropped, bring the US dollar risk free rates closer to the Euro and Yen risk free rates. While some of the decline in rates can be attributed to a flight to safety, there is also a much depressing read of the same drop. To the extent that long term risk free rates are proxies for nominal economic growth, the treasury bond market seems to be signaling not just a shock to near-term economic growth from the Corona virus, but a long term decline. We will get a better sense of what the bond market is expecting, once equities settle in, but if the 10-year rate stays below 1%, it is not a good sign for the economy.
II. Gold and Bitcoin (Millennial Gold)The other asset class that always attracts attention and money during crisis is gold, and for good measure, I will also look at Bitcoin, which some have suggested is the millennial equivalent of gold: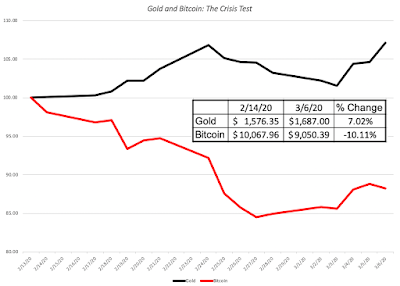
It is perhaps a little unfair to draw a conclusion from just contest, but the fact that Bitcoin has behaved more like stocks than like gold suggests that millennials who have held on to it, as their asset of refuge, may want to rethink their positions.
3. Oil and CommoditiesThe final piece of the market puzzle comes from the commodity markets, with oil as its front runner. In the three weeks which have taken equity markets on a ride and caused US treasuries to hit new lows, oil prices have been on a journey of their own: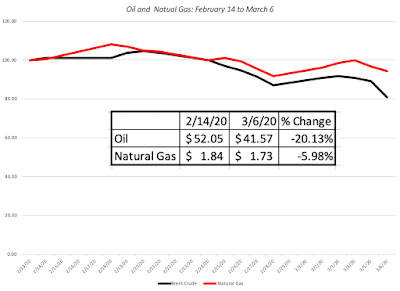
Not only have oil prices dropped 20% during the three weeks, they are plumbing depths seldom seen in this century. The decline in oil prices not only reflect an expectation of global economic slowdown but also how dependent oil and other commodity prices have become on China's continued growth and prosperity. The smaller decline in natural gas prices, much less tied to the Chinese market, reinforces this argument.
Revisiting the Viral ValueWith this long lead in, you might have lost interest already, but if you are still reading, it is time to turn to specifics and look at how what I have learned in the last 12 days has or has not changed my views on the market.
Recapping the DriversVery quickly recapping what I argued were the drivers of the value of stocks, I argued that there were three components to value:Earnings Growth: In my 2/26/20 valuation of the S&P 500 index, I argued that the corona virus is now almost certain to cause earnings effects for companies, and estimated the drop to be 5% (a significant revision down from the 5.52% growth that had been predicted in the index. In the last few days, analysts have started adjusting earnings expectations down for companies, and this snapshot from Zacks today captures some of the adjustment: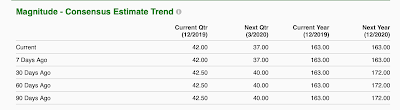 Note that the expected earnings on the index for 2021 has dropped from 172 for next year, two weeks ago, to 163 this week, matching the earnings generated in 2019. That is still better than the 5% drop that I was projecting, but my guess is that I am still undershooting the actual earnings decline and I have increased the expected earnings drop in 2020 to 10%. To complete the assessment of growth, I also need to estimate how much of the earnings drop in 2020 will be recouped in future years. In my valuation on February 26, I had estimated that half of the earnings drop in 2020 would be recouped but that the rest would be lost for the long term. I will continue to hold on to that assumption In addition, since my long term growth rate converges on the US T.Bond rate, the precipitous drop in that rate has lowered my growth rate in perpetuity to 0.74% (to match the T. Bond rate).Cash flow Payout: The second component of value is the cash that companies can return, in dividends and buybacks. I assumed that companies, driven by uncertainty, would scale the percent of the earnings that they return to stockholders from the 92.33% that they were returning prior to the crisis to 85%, more in line with the ten-year average. In the days since, there have been no announcements of dividend cuts or scaling back of already announced buybacks, but I would not be surprised to see that change in the next few weeks. Discount Rate Dynamics: The discount rate dynamics are the trickiest. On the one hand, the lower T.Bond rate will create a lower base from which to build up, but the increase in volatility (actual and expected, as captured in the rise in the VIX over the last three weeks) has pushed equity risk premiums up. I will scale up my ERP to 5.69% to match my implied premium at the start of March 2020.With that combination of assumptions (10% drop in earnings, 50% recoupment between 2022-25, 85% cash return and a 5.69% premium), the value that I derive fo the index Is 2889, and much of the reason for the drop from the value that I estimated on February 26, 2020, can be attributed to the the lower growth rate that I am estimating in the near term and in the long term.
Value DynamicsIn the days to come, there will be more information that comes out about not only how the virus is spreading across the globe but also on its consequences for businesses and economies. To provide a measure of how this will affect stock values, I computed the value of the S&P 500 (which stood at 2972.37 on March 6, 2020) as a function of what I believe are the two big uncertainties; the effect that the virus will have on earnings in 2020 and how much it will affect long term earnings growth:
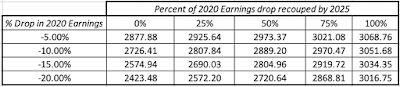 Download valuation spreadsheetNote that the big concern, if you are an investor focused on value, is not how much the Corona virus will affect earnings this year, but how much of that earnings drop is permanent. If you are in the camp that believes that there will be an earning drop, but that it will be fully recouped, stocks look cheap even if earnings drop by 20% in 2020. Conversely, if you believe that this earnings drop is likely to be permanent, with none of the drop being recouped, the value drop will be more closely linked to the earnings drop and suggests that there is more pain ahead for the market.
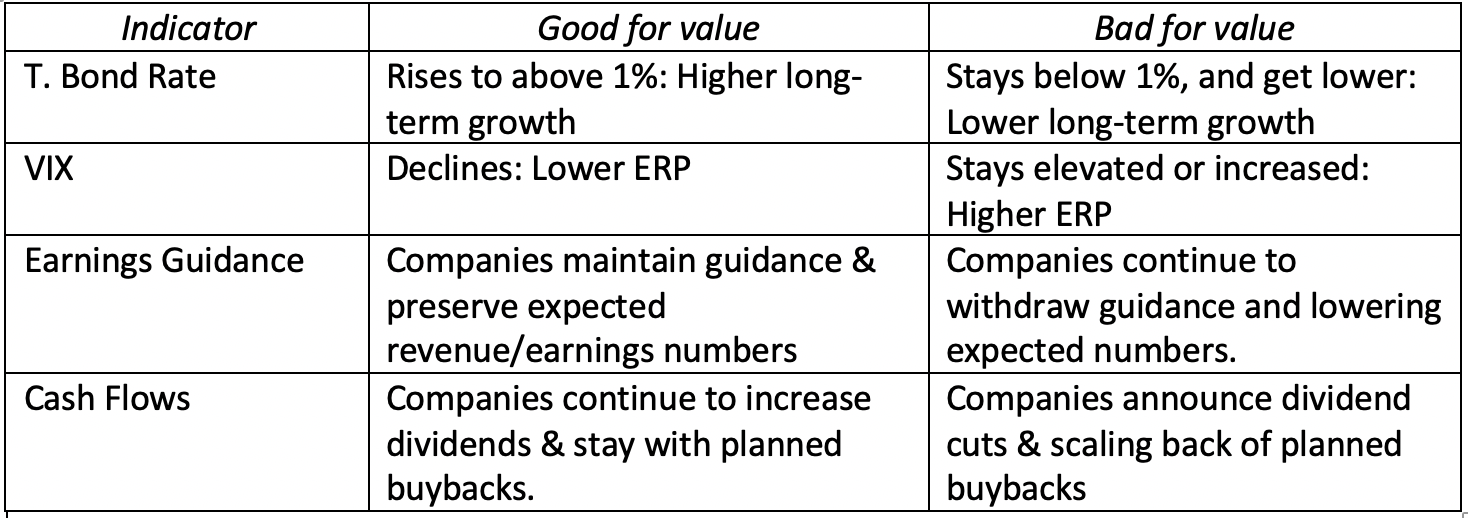
What to watch for..Needless to say, there will be plenty of distractions in the coming weeks, but my suggestion is that you stay honed in on the value determinants, screening news stories for consequences for these determinants. In particular, I plan to watch the following developments: I know that my view that T.Bond rates staying low and getting lower is not a positive but a negative for stocks puts me in the opposite camp from those who believe that the Fed will be the savior. When rates are as low as they are, central banks are more helpless bystanders than powerful trend setters, and the message about future growth that is imputed in low rates more than drowns any short term positive effects.
The Big Things in LifeAs I write this analysis of how the virus can affect stock market values and portfolio returns, I am aware that there is a human toll that it is taking that makes any market effects seem trivial. If I were given the choice, I would trade a large market drop for a small loss of lives and a quick passing of the virus. At times like these, I am reminded again of the fragility of life and the importance of good health and family. Be well, Godspeed and please wash your hands!
YouTube Video
Datasets
Market Damage, by region, sector, industry, size and momentum
Spreadsheets
An Updated S&P Valuation Spreadsheet: March 6, 2020
I wrote a post on how the Corona Virus was playing out in markets on February 26, two days into the market going into convulsions, and while I tried to make an assessment of the value effect, I also said that this analysis was a work in progress, that I would revisit as we learned more about the virus and its economic consequences. Eleven days later, we still don't have clarity on the health or economic effects of the virus, but we do have substantially more data on what the market reaction has been. In this post, I will begin by doing a quick update on the viral spread across the world, but spend more time on the market damage, looking at where it has been greatest, seeking clues for the future.
A Virus UpdateIn the last week and a half, the virus has clearly expanded its global footprint, with Italy and South Korea now in the front lines, in terms of exposure, but with the numbers climbing rapidly across the rest of the world, it is clearly now on its way to becoming a global pandemic.
 NY Times, as of March 6, 2020
While the word "pandemic" alone is often enough to drive us to panic, it is not the first, nor will it be the last, and it helps to gain perspective to compare it to pandemics in the past, both in terms of contagion and health consequences. This chart from the New York Times reflects what we know about the virus as of February 28, 2020:
 Note that the large band of uncertainty around the fatality rate related to the virus, reflecting how little we know about its potential consequences and how it measures up against other viruses in terms of contagion. Put simply, this is not just the common flu with side effects, as some have argued, but it is perhaps not the deadly killer that others at the other extreme has painted it as. The X factor that makes this virus potentially more difficult to contain and more likely to have global consequences is globalization, one more argument that populists will undoubtedly use to argue against it. The reality is that travel, especially across borders and continents, is not only easier than ever before but also more affordable, as income levels rise in the developing world. Over the next few weeks, it is likely that we will see the case numbers rise dramatically in countries which have been hitherto exposed only lightly to the virus, the fatality numbers will rise among those affected, and health systems around the world will come under pressure.
 A Market UpdateOver the last three weeks, we have had a glimpse of how quickly market moods can shift. Looking at the major US equity indices, you can see the euphoria that resulted in the market peaking on February 12, 2020, not only faded quickly but has been replaced with panic and desperation:
 If there is one thing that can be said about markets during this tumultuous period, they were not playing favorites, since all of the indices registered double git drops, with the NASDAQ showing the smallest drop.
a. Melting Away - Dollar Value LostThe focus on the indices can obscure the staggering decline in market values that occurred in a three-week period and in the table below, I chronicle the loss in market value globally, broken down by region.
 Download spreadsheetThe first four columns look at total market capitalization and the change in both dollar and percentage terms between February 14, 2020 and March 6, 2020. Globally, equity markets lost $7.3 trillion in value over this three-week period, and it is ironic that China, the starting point for the Corona Virus, is the only part of the world where stocks have collectively seen an increase in market capitalization. That can be explained perhaps by the fact that Chinese stocks had already registered drops in the weeks leading into February 14, and that the rest of the world is playing catch up. The last five columns look at the percentage change in individual stocks to illustrate how widely the pain was felt. In ten of the twelve regions, with China and Africa being the exceptions, less than 25% of stocks went up during the three week period. In most of the markets, the percentage change in overall market capitalization is similar to the percentage change in the median stock, indicating that this is not a decline being caused by a subset of stocks being hit with extreme price movements.
b. The Sector/Industry BreakdownThere is no question that the virus not only has the potential to hurt the global economy, but the hurt will be felt disproportionately by companies in different businesses. To assess how the market has repriced different sectors, I look at the market capitalization lost, in both dollar and percent terms, by sector, for global companies:
 Download spreadsheetThe biggest losers were energy and financial service companies, and the sectors that performed the best were utilities, health care, real estate and consumer staples. Breaking down the sectors into more detail, I looked at US stocks, by industry, and the following is the list of the five worst and five best performing industries between February 14 and March 6:
 Download spreadsheet
The full list is available for download by clicking here. For anyone who has been following the news stories of airlines scrambling to cancel flights and mollify passengers and hotels dealing with cancellations, it should come as no surprise that aviation and hotel stocks were the worst performing industry groupings, followed by oil, broadcasting and life insurance. The best performing industry grouping also carries no surprises, with precious metal companies benefiting from the rise in gold prices, grocery retailers and tobacco drawing on their strengths as non-discretionary products and biotech companies benefiting from the focus on a solution for the virus.
c. Size ClassesThe conventional wisdom, when there is a market crisis, is that investors move their money to safety. While that has clearly happened with money shifting into US treasuries, the question is whether investors are abandoning smaller companies for larger ones, presumably driven by the perception that smaller companies are riskier than larger ones. To answer this question, I looked at all global companies, broken down by market capitalization into ten classes:
 Download spreadsheetThe results don't line up with expectations, as small companies saw a small increase in overall market capitalization and large cap stocks registered the largest decline. It is worth noting that even among the smallest stocks, the median stock lost 7.73%, suggesting that the increase in value is coming from a small percentage of stocks in the group. (Looking at just US stocks, you get very similar results.)
 d. Value and Momentum ClassesThe drop in the market has provided some measure of vindication to those who have long been arguing that the market is over priced, but while the fact that the market was priced so richly set it up for a larger fall, breaking down the decline in market cap into classes can provide us some insight into whether the stocks that had gone up the most were the ones that saw the biggest drop off in value between February 14 and March 6. In the table, we break global stocks down into ten classes based upon the price change in the year prior to February 14 and look at the change in market capitalization, by class:
 Download spreadsheetIn keeping with the story that what goes up the most must come down the most, you find that stocks that had performed the worst in the year leading into February 14 had an increase in market capitalization, though the median stock was still down, within this group. Using another proxy for rich pricing, I also broke stocks down by PE ratio classes from lowest to highest, based upon market capitalization on February 14, 2020, and looked at the change in market value between February 14 and March 6:
 Download spreadsheetHere, the evidence contradicts the market correction hypothesis, since there is no discernible relationship between PE ratios and market value change. In fact, the best performing stocks are in the top two deciles of PE ratios.
e. The Rest of the StoryOne of the perils of getting focused on equity markets is that you can miss all of the action in other markets, and the changes in those markets can not only help augment the story that equities are telling us, but they can yield insight into other facets.
I. US Treasury ratesIf the drop in stock prices over the last three weeks took your breath away, the shifts in the treasury market were even larger and more unsettling:

The 10-year US T.Bond dropped below 1% for the first time in history on March 3 and continued trending down to settle at 0.74% on March 6. In tandem, the other treasuries also dropped, bring the US dollar risk free rates closer to the Euro and Yen risk free rates. While some of the decline in rates can be attributed to a flight to safety, there is also a much depressing read of the same drop. To the extent that long term risk free rates are proxies for nominal economic growth, the treasury bond market seems to be signaling not just a shock to near-term economic growth from the Corona virus, but a long term decline. We will get a better sense of what the bond market is expecting, once equities settle in, but if the 10-year rate stays below 1%, it is not a good sign for the economy.
II. Gold and Bitcoin (Millennial Gold)The other asset class that always attracts attention and money during crisis is gold, and for good measure, I will also look at Bitcoin, which some have suggested is the millennial equivalent of gold:

It is perhaps a little unfair to draw a conclusion from just contest, but the fact that Bitcoin has behaved more like stocks than like gold suggests that millennials who have held on to it, as their asset of refuge, may want to rethink their positions.
3. Oil and CommoditiesThe final piece of the market puzzle comes from the commodity markets, with oil as its front runner. In the three weeks which have taken equity markets on a ride and caused US treasuries to hit new lows, oil prices have been on a journey of their own:

Not only have oil prices dropped 20% during the three weeks, they are plumbing depths seldom seen in this century. The decline in oil prices not only reflect an expectation of global economic slowdown but also how dependent oil and other commodity prices have become on China's continued growth and prosperity. The smaller decline in natural gas prices, much less tied to the Chinese market, reinforces this argument.
Revisiting the Viral ValueWith this long lead in, you might have lost interest already, but if you are still reading, it is time to turn to specifics and look at how what I have learned in the last 12 days has or has not changed my views on the market.
Recapping the DriversVery quickly recapping what I argued were the drivers of the value of stocks, I argued that there were three components to value:Earnings Growth: In my 2/26/20 valuation of the S&P 500 index, I argued that the corona virus is now almost certain to cause earnings effects for companies, and estimated the drop to be 5% (a significant revision down from the 5.52% growth that had been predicted in the index. In the last few days, analysts have started adjusting earnings expectations down for companies, and this snapshot from Zacks today captures some of the adjustment:
 Note that the expected earnings on the index for 2021 has dropped from 172 for next year, two weeks ago, to 163 this week, matching the earnings generated in 2019. That is still better than the 5% drop that I was projecting, but my guess is that I am still undershooting the actual earnings decline and I have increased the expected earnings drop in 2020 to 10%. To complete the assessment of growth, I also need to estimate how much of the earnings drop in 2020 will be recouped in future years. In my valuation on February 26, I had estimated that half of the earnings drop in 2020 would be recouped but that the rest would be lost for the long term. I will continue to hold on to that assumption In addition, since my long term growth rate converges on the US T.Bond rate, the precipitous drop in that rate has lowered my growth rate in perpetuity to 0.74% (to match the T. Bond rate).Cash flow Payout: The second component of value is the cash that companies can return, in dividends and buybacks. I assumed that companies, driven by uncertainty, would scale the percent of the earnings that they return to stockholders from the 92.33% that they were returning prior to the crisis to 85%, more in line with the ten-year average. In the days since, there have been no announcements of dividend cuts or scaling back of already announced buybacks, but I would not be surprised to see that change in the next few weeks. Discount Rate Dynamics: The discount rate dynamics are the trickiest. On the one hand, the lower T.Bond rate will create a lower base from which to build up, but the increase in volatility (actual and expected, as captured in the rise in the VIX over the last three weeks) has pushed equity risk premiums up. I will scale up my ERP to 5.69% to match my implied premium at the start of March 2020.With that combination of assumptions (10% drop in earnings, 50% recoupment between 2022-25, 85% cash return and a 5.69% premium), the value that I derive fo the index Is 2889, and much of the reason for the drop from the value that I estimated on February 26, 2020, can be attributed to the the lower growth rate that I am estimating in the near term and in the long term.
Value DynamicsIn the days to come, there will be more information that comes out about not only how the virus is spreading across the globe but also on its consequences for businesses and economies. To provide a measure of how this will affect stock values, I computed the value of the S&P 500 (which stood at 2972.37 on March 6, 2020) as a function of what I believe are the two big uncertainties; the effect that the virus will have on earnings in 2020 and how much it will affect long term earnings growth:
 Download valuation spreadsheetNote that the big concern, if you are an investor focused on value, is not how much the Corona virus will affect earnings this year, but how much of that earnings drop is permanent. If you are in the camp that believes that there will be an earning drop, but that it will be fully recouped, stocks look cheap even if earnings drop by 20% in 2020. Conversely, if you believe that this earnings drop is likely to be permanent, with none of the drop being recouped, the value drop will be more closely linked to the earnings drop and suggests that there is more pain ahead for the market.
What to watch for..Needless to say, there will be plenty of distractions in the coming weeks, but my suggestion is that you stay honed in on the value determinants, screening news stories for consequences for these determinants. In particular, I plan to watch the following developments:
 I know that my view that T.Bond rates staying low and getting lower is not a positive but a negative for stocks puts me in the opposite camp from those who believe that the Fed will be the savior. When rates are as low as they are, central banks are more helpless bystanders than powerful trend setters, and the message about future growth that is imputed in low rates more than drowns any short term positive effects.
 The Big Things in LifeAs I write this analysis of how the virus can affect stock market values and portfolio returns, I am aware that there is a human toll that it is taking that makes any market effects seem trivial. If I were given the choice, I would trade a large market drop for a small loss of lives and a quick passing of the virus. At times like these, I am reminded again of the fragility of life and the importance of good health and family. Be well, Godspeed and please wash your hands!
YouTube Video
Datasets
Market Damage, by region, sector, industry, size and momentum
Spreadsheets
An Updated S&P Valuation Spreadsheet: March 6, 2020


February 27, 2020
Data Update 5: Relative Risk and Hurdle Rates
In my last four posts, I focused on the macro variables that we draw on, in both corporate finance and valuation, to estimate required returns or hurdle rates. In data post 3, I looked at how the prices of risk in both the bond market (default spreads) and the equity market (equity risk premiums) dropped in 2019, in the US. In data post 4, I extended the discussion to cover country and currency risk. In this one, I will bring in the micro variables that cause differences in risk across firms, and how to convert them into risk measure.
Relative Risk MeasuresTo get from the macro risk measures to company-level hurdle rates, you need to make judgments on relative risk. Put simply, if you buy into the proposition, like I do, that some companies/investments are riskier than others, you need a measure of relative risk that captures this variation. It is in this context that I think of betas, a loaded concept that carries with it the baggage of modern portfolio theory and efficient markets. If you add to this the standard approach to estimating betas, built on looking at past prices and running regressions against market indices, you have the makings of a perfect storm, designed to drive value investors to apoplexy. I have no desire to re-litigate these arguments, partly because those for and opposed to betas are set in their ways, but let me suggest some compromise propositions. Relative Risk Proposition 1 : You do not need to believe in betas to do financial analysis and valuation. While there are many who seem to tie discounted cash flow valuations to the use of beta or betas, there is nothing inherently in a DCF that requires that you make this leap:

While the discount rate in a DCF is a risk-adjusted number, the approach is agnostic about how you measure risk and adjust discount rates for that risk.Relative Risk Proposition 2: If you don't like to or want to measure relative risk with betas, you can come up with alternate measures that better reflect your view of how risk should be measured. While I do use beta as my proxy for risk, I do so with open eyes, recognizing its many limitations as a risk measure, and I have been always willing to consider competing risk measures. In fact, I have presented alternate measures of risk, drawing on the two building blocks of betas that draw the most pushback. The first is the assumption that marginal investors are diversified, and that the only risk that needs to be measured is the risk that cannot be diversified away. The second is its use of prices (stock and market) to estimate risk, seemingly contradicting intrinsic value's basic precept that market prices are not trustworthy. Since a picture is worth a thousand words, here a few alternative risk measures to consider, if you don't trust betas;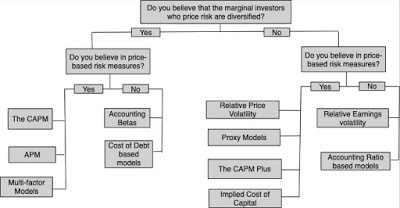 Put simply, if your primary problem with betas is the assumption that marginal investors are diversified, there are total risk measures that are built around measuring the total risk in a company or investment, by looking at either the standard deviation or adding premiums (small cap, company-specific risk) to the traditional risk and return model. If your concern is that past prices are being used to estimate betas, you can switch to using accounting earnings and computing risk measures either from the perspective of diversified investors (accounting beta) or undiversified ones (earnings variability).Relative Risk Proposition 3: The margin of safety is not a competitor to any of the risk measures above, since it is a post-value adjustment for risk.Rather than repeat what I said in a much longer post that I had on the topic, let me summarize the points that I made there. When value investors talk about protecting themselves from risk by using a margin of safety, they are talking about building a buffer between value and price, but to use the margin of safety, you need to value a stock first. To get that value, you need a risk measure, and that brings us back full circle to how you adjust for risk, when valuing companies.
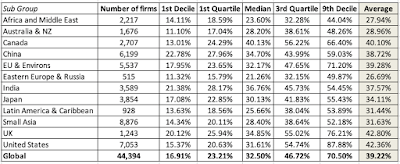
Relative Risk in 2020With that long lead-in, let's take a look at how companies measured up on relative risk measures, at the start of 2020. In keeping with my argument in the last section that you can use alternative risk measures, I will report on three alternative risk measures:Betas: I start with betas, estimated with conventional regressions of returns on the stock against a market index, for each of the companies in my sample. To get a measure of how these betas vary across companies, I have a distribution of betas, broken down globally and for regions of the world: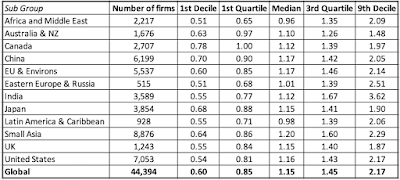 It is worth noting that, at least for public companies, half of all companies have betas between 0.85 and 1.45, globally. If you are wondering why the betas are not higher for companies in riskier parts of the word, it is worth emphasizing that betas are scaled around one, no matter of the world you are in, and are not designed to convey country risk. (The equity risk premiums that I wrote about in my last post carry that weight.)Relative Standard Deviation: For those who do not buy into the notion that the marginal investors are diversified and that the only risk that matters is market risk, I report on the standard deviation in stock prices (using the last two years of data):
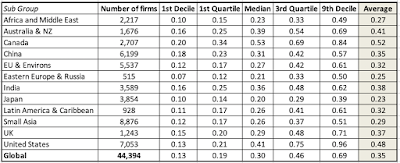
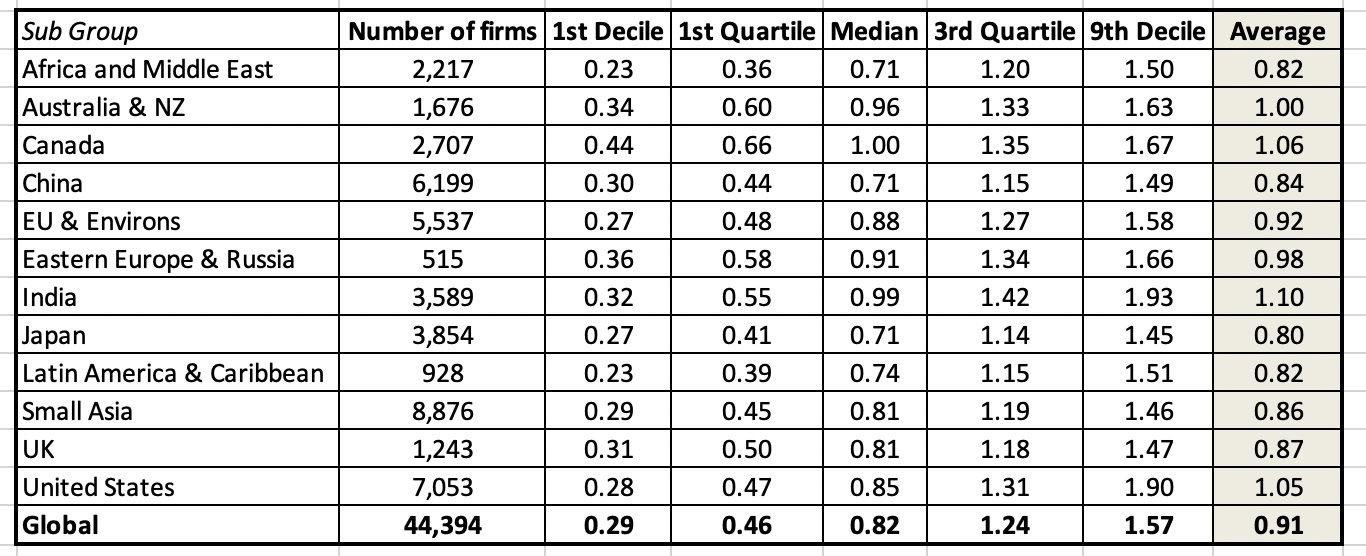
 Note that you can convert these numbers into relative measures, resembling betas, by dividing by the average standard deviation of all stocks. Thus, if you have a US stock with an annualized standard deviation of 35.00% in stock returns, you would divide that number by the average for US equities of 42.36% to arrive a relative standard deviation of 0.826 (=35.00%/42.36%).High-Low Risk: For those who prefer a non-parametric and more intuitive measure of risk, I compute a risk measure by looking at the difference between high and low prices in the most recent year, and dividing by the sum of the two numbers. Thus, for a stock that has a high price of 20 and a low price of 12, during the course of a year, this measure would yield 0.25 ((20-12)/ (20+12)). Note that the bigger the range in prices, the more risky a stock looks on this measure, and this too is broken down globally and by region:
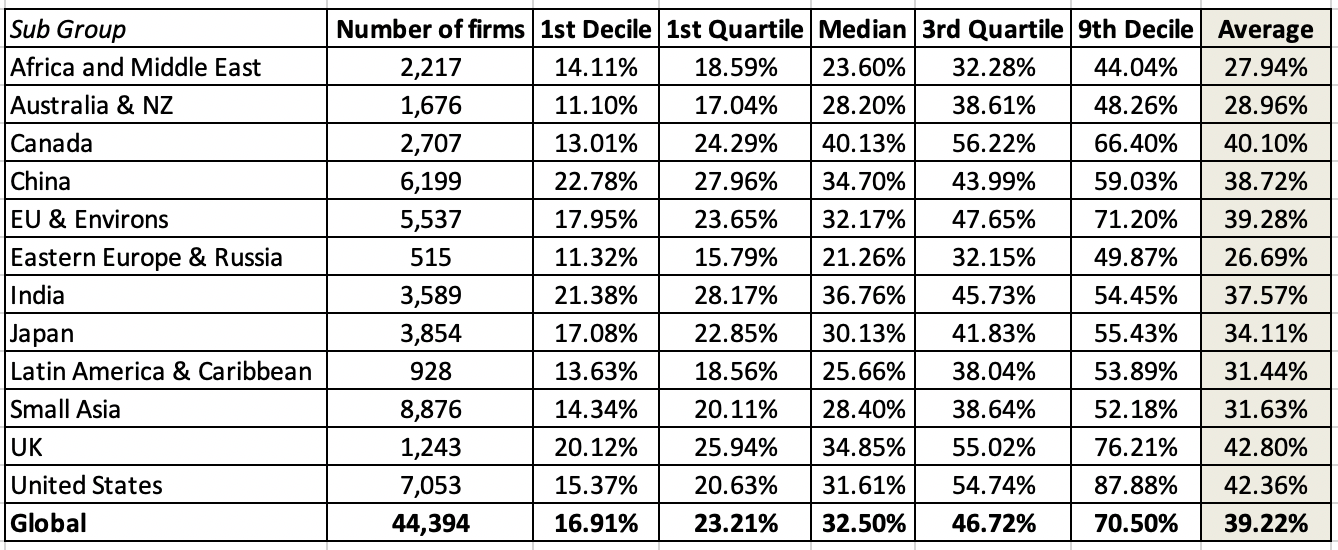
 As with the other risk measures, this too can be converted into a relative risk measure, by dividing by the average.Earnings Variability: Finally, for those who trust accountants more than markets (even though I am not one of them), I have computed a risk measure that is built around earnings variability, computed by looking at the standard deviation in net income over the last 10 years for each firm, and converted into a standardized measure, by dividing by the average net income over the ten years (a coefficient of variation in net income), The global and regional breakdown is below:
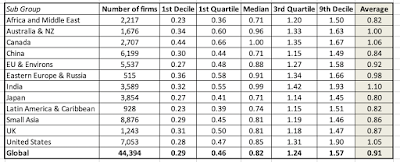 The earnings variability number has a bigger selection bias than the other measures, because it requires a longer history (10 years of data) and positive earnings, cutting the sample size down significantly. Here again, dividing a company's coefficient of variation in net income by the average value across all companies will give you a relative risk measure.I follow up by looking at median values for each of the risk measures by industry grouping. Since I have 94 industry groupings, I will not report them all here, but you can download the data on all of the industry groupings, by clicking here.
Hurdle Rates in 2020The relative risk measures are a means to an end, since the only reason for computing them is to use them to get to required returns. In this section, I begin by looking at the cost of equity, then bring in the cost of debt and close of by looking at the cost of capital.
a. Cost of EquityThere are three ingredients that go into the cost of equity and the last few posts have laid the foundations for the three inputs: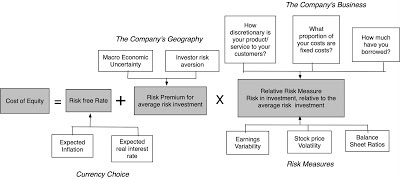
The risk free rate is a function of the currency you choose to compute your hurdle rates in, and will be higher for high-inflation currencies than low-inflations ones. Since I will be comparing and aggregating costs of equity across more than 40,000 firms spread across the world, I will compute their costs of equity in US dollars, using the US T.Bond rate as of January 1, 2020, as the risk free rate. You can convert these into any other currency, using the differential inflation approach that I described in my earlier post from a couple of weeks ago.The equity risk premium for a company is a function of where it does business, and in my last data update post, I described my approach to estimating equity risk premiums for individual countries, and the process of weighting these (using either revenues or production) to get equity risk premiums for companies.For the relative risk measure, I will use betas but as I argued in the last section, I am agnostic about what you prefer to use instead. Thus, if you prefer earnings variabliity as a measure, you can use relative earnings variability as your risk measure.With these inputs, I estimate the costs of equity for all of the companies in my database, and report the distribution in the table below:
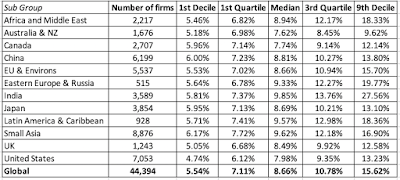 Comparing this distribution to the one for betas, earlier in this post, you will notice a wider spread in the numbers across regions, as we bring in equity risk premium differences into the calculation.
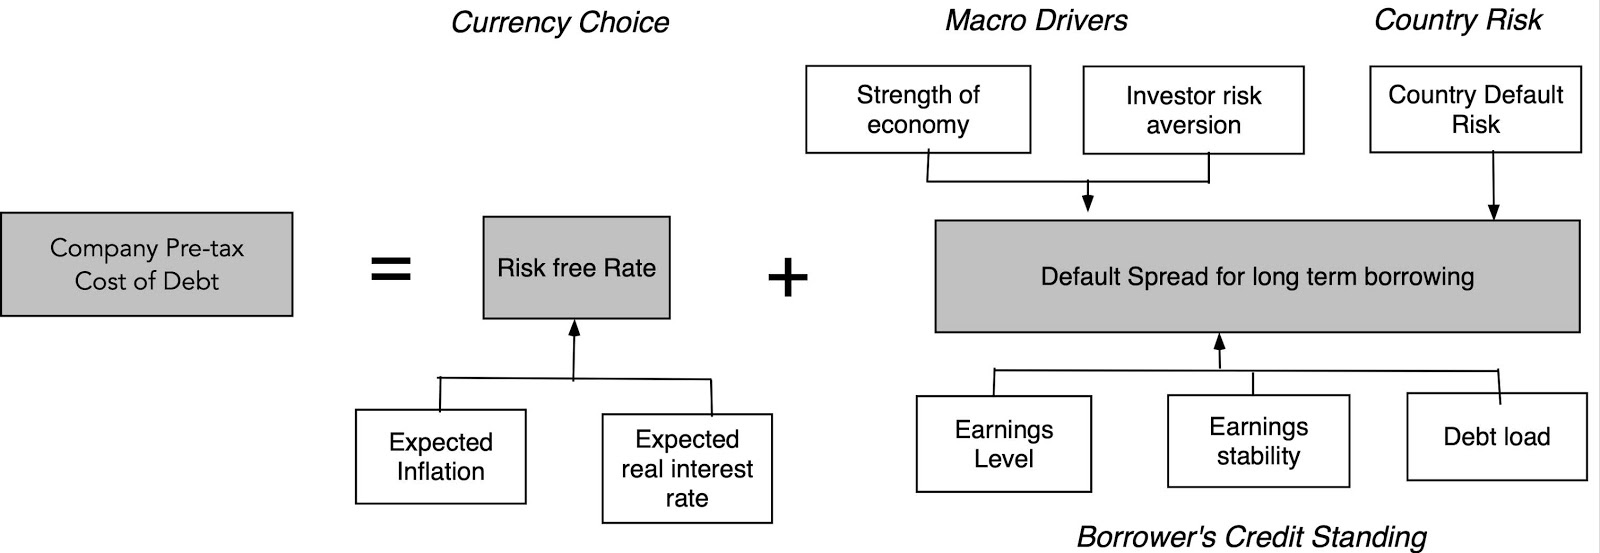
b. Cost of DebtThe cost of debt is a simpler exercise, since it is a measure of the rate at which companies can borrow money today, not a reflection of the rates at which they have borrowed in the past. It is a function of the risk free rate and the default spread: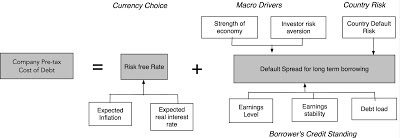 As with the cost of equity, the risk free rate is a function of the currency in which you estimate the cost of debt in, and I will estimate the costs of debt for all companies in US dollars, again to make comparisons across companies. For the default spread, I have little choice but to use bludgeon measures, since I cannot assess credit risk for 40,000 plus companies. For companies that have an S&P bond rating (about 15% of the sample), I use the rating to estimate a default spread. For the rest, I estimate synthetic bond ratings based on financial ratios (interest coverage and debt ratios). The US $ pre-tax cost of debt distribution is below:
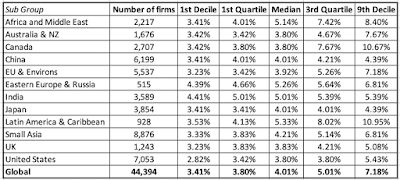
Since these costs are all in US dollars, the differences across regions reflect difference in country default risk and reflect wide divergences. It is worth noting that the tax law tilt towards debt, represented in the fact that interest expenses are tax deductible and cash flows to equity (dividends and buybacks) have to come from after-tax cash flows, is not just a phenomenon for the US, but true over much of the world, with the Middle East representing the holdout. This tax benefit shows up in the cost of capital, through the conversion of the pre-tax cost of debt into an after-tax cost, using the marginal tax rate to make the adjustment:After-tax cost of debt = Pre-tax cost of debt (1 - Marginal Tax Rate)In my sample, I use the marginal tax rate of the country in which a company is incorporated. You can find these marginal tax rates, which KPMG should be credited for collecting, also on my website for download.
c. Debt Ratios and Costs of CapitalThe final piece of the puzzle in computing the cost of capital is the mix of debt and equity that companies use in funding their operations. In keeping with the cost of capital being a measure of what companies have to pay for their debt and equity today, I use the market values of equity and debt, with leases converted into debt and included in the latter, to compute the cost of capital. While I will talk in more detail about debt loads and choices in a future post, you can sense of the debt load at companies, as a percent of capital (in market value terms) in the table below below: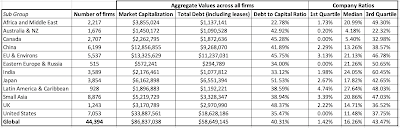
With these debt ratios, and using the costs of equity and debt also shown above, I compute costs of capital, in US dollar terms, for all publicly traded companies and the resulting distribution is below: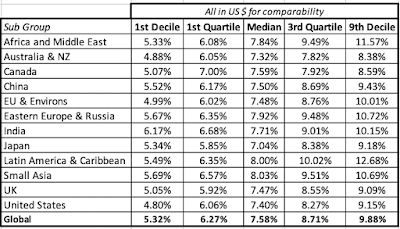
This is a table that I will use, and have already put to use, in valuing companies since it provides a quick and effective way to estimate discount rates for companies, without losing yourself in the details. Thus, when valuing a young, money-losing public company in the US (like Casper, the only mattress-maker that went public last week), I will use a cost of capital of 9.15%, representing the 90th percentile of US firms, whereas to value a slow-growing European company in a stable business, like Heineken, my cost of capital will be 6.02%, the 25th percentile of European companies. For all companies, the median cost of capital of 7.58% is a good proxy for the number that all companies will converge towards, as they approach maturity. If all of these numbers look low to you, that is because they reflect a risk free rate, in US dollars, that is low, and if it does rise, it will carry these numbers upwards. As with the risk measures, I have estimated costs of equity, debt and capital, by industry group and you can download them for all companies globally, as well as regionally (US, Emerging Markets, Europe, Japan and Australia/Canada) and for India and China, separately.
YouTube Video
Downloadable Data
Industry Average Risk Measures at start of 2020Betas, by industry (Global, US, Emerging Markets, Europe, Japan, Australia/Canada, India, China)Costs of Debt, Equity and Capital, by industry (Global, US, Emerging Markets, Europe, Japan, Australia/Canada, India, China)Marginal tax rates, by country, for 2020
Relative Risk MeasuresTo get from the macro risk measures to company-level hurdle rates, you need to make judgments on relative risk. Put simply, if you buy into the proposition, like I do, that some companies/investments are riskier than others, you need a measure of relative risk that captures this variation. It is in this context that I think of betas, a loaded concept that carries with it the baggage of modern portfolio theory and efficient markets. If you add to this the standard approach to estimating betas, built on looking at past prices and running regressions against market indices, you have the makings of a perfect storm, designed to drive value investors to apoplexy. I have no desire to re-litigate these arguments, partly because those for and opposed to betas are set in their ways, but let me suggest some compromise propositions. Relative Risk Proposition 1 : You do not need to believe in betas to do financial analysis and valuation. While there are many who seem to tie discounted cash flow valuations to the use of beta or betas, there is nothing inherently in a DCF that requires that you make this leap:

While the discount rate in a DCF is a risk-adjusted number, the approach is agnostic about how you measure risk and adjust discount rates for that risk.Relative Risk Proposition 2: If you don't like to or want to measure relative risk with betas, you can come up with alternate measures that better reflect your view of how risk should be measured. While I do use beta as my proxy for risk, I do so with open eyes, recognizing its many limitations as a risk measure, and I have been always willing to consider competing risk measures. In fact, I have presented alternate measures of risk, drawing on the two building blocks of betas that draw the most pushback. The first is the assumption that marginal investors are diversified, and that the only risk that needs to be measured is the risk that cannot be diversified away. The second is its use of prices (stock and market) to estimate risk, seemingly contradicting intrinsic value's basic precept that market prices are not trustworthy. Since a picture is worth a thousand words, here a few alternative risk measures to consider, if you don't trust betas;
 Put simply, if your primary problem with betas is the assumption that marginal investors are diversified, there are total risk measures that are built around measuring the total risk in a company or investment, by looking at either the standard deviation or adding premiums (small cap, company-specific risk) to the traditional risk and return model. If your concern is that past prices are being used to estimate betas, you can switch to using accounting earnings and computing risk measures either from the perspective of diversified investors (accounting beta) or undiversified ones (earnings variability).Relative Risk Proposition 3: The margin of safety is not a competitor to any of the risk measures above, since it is a post-value adjustment for risk.Rather than repeat what I said in a much longer post that I had on the topic, let me summarize the points that I made there. When value investors talk about protecting themselves from risk by using a margin of safety, they are talking about building a buffer between value and price, but to use the margin of safety, you need to value a stock first. To get that value, you need a risk measure, and that brings us back full circle to how you adjust for risk, when valuing companies.
Relative Risk in 2020With that long lead-in, let's take a look at how companies measured up on relative risk measures, at the start of 2020. In keeping with my argument in the last section that you can use alternative risk measures, I will report on three alternative risk measures:Betas: I start with betas, estimated with conventional regressions of returns on the stock against a market index, for each of the companies in my sample. To get a measure of how these betas vary across companies, I have a distribution of betas, broken down globally and for regions of the world:
 It is worth noting that, at least for public companies, half of all companies have betas between 0.85 and 1.45, globally. If you are wondering why the betas are not higher for companies in riskier parts of the word, it is worth emphasizing that betas are scaled around one, no matter of the world you are in, and are not designed to convey country risk. (The equity risk premiums that I wrote about in my last post carry that weight.)Relative Standard Deviation: For those who do not buy into the notion that the marginal investors are diversified and that the only risk that matters is market risk, I report on the standard deviation in stock prices (using the last two years of data):
 Note that you can convert these numbers into relative measures, resembling betas, by dividing by the average standard deviation of all stocks. Thus, if you have a US stock with an annualized standard deviation of 35.00% in stock returns, you would divide that number by the average for US equities of 42.36% to arrive a relative standard deviation of 0.826 (=35.00%/42.36%).High-Low Risk: For those who prefer a non-parametric and more intuitive measure of risk, I compute a risk measure by looking at the difference between high and low prices in the most recent year, and dividing by the sum of the two numbers. Thus, for a stock that has a high price of 20 and a low price of 12, during the course of a year, this measure would yield 0.25 ((20-12)/ (20+12)). Note that the bigger the range in prices, the more risky a stock looks on this measure, and this too is broken down globally and by region:
 As with the other risk measures, this too can be converted into a relative risk measure, by dividing by the average.Earnings Variability: Finally, for those who trust accountants more than markets (even though I am not one of them), I have computed a risk measure that is built around earnings variability, computed by looking at the standard deviation in net income over the last 10 years for each firm, and converted into a standardized measure, by dividing by the average net income over the ten years (a coefficient of variation in net income), The global and regional breakdown is below:
 The earnings variability number has a bigger selection bias than the other measures, because it requires a longer history (10 years of data) and positive earnings, cutting the sample size down significantly. Here again, dividing a company's coefficient of variation in net income by the average value across all companies will give you a relative risk measure.I follow up by looking at median values for each of the risk measures by industry grouping. Since I have 94 industry groupings, I will not report them all here, but you can download the data on all of the industry groupings, by clicking here.
Hurdle Rates in 2020The relative risk measures are a means to an end, since the only reason for computing them is to use them to get to required returns. In this section, I begin by looking at the cost of equity, then bring in the cost of debt and close of by looking at the cost of capital.
a. Cost of EquityThere are three ingredients that go into the cost of equity and the last few posts have laid the foundations for the three inputs:

The risk free rate is a function of the currency you choose to compute your hurdle rates in, and will be higher for high-inflation currencies than low-inflations ones. Since I will be comparing and aggregating costs of equity across more than 40,000 firms spread across the world, I will compute their costs of equity in US dollars, using the US T.Bond rate as of January 1, 2020, as the risk free rate. You can convert these into any other currency, using the differential inflation approach that I described in my earlier post from a couple of weeks ago.The equity risk premium for a company is a function of where it does business, and in my last data update post, I described my approach to estimating equity risk premiums for individual countries, and the process of weighting these (using either revenues or production) to get equity risk premiums for companies.For the relative risk measure, I will use betas but as I argued in the last section, I am agnostic about what you prefer to use instead. Thus, if you prefer earnings variabliity as a measure, you can use relative earnings variability as your risk measure.With these inputs, I estimate the costs of equity for all of the companies in my database, and report the distribution in the table below:
 Comparing this distribution to the one for betas, earlier in this post, you will notice a wider spread in the numbers across regions, as we bring in equity risk premium differences into the calculation.
b. Cost of DebtThe cost of debt is a simpler exercise, since it is a measure of the rate at which companies can borrow money today, not a reflection of the rates at which they have borrowed in the past. It is a function of the risk free rate and the default spread:
 As with the cost of equity, the risk free rate is a function of the currency in which you estimate the cost of debt in, and I will estimate the costs of debt for all companies in US dollars, again to make comparisons across companies. For the default spread, I have little choice but to use bludgeon measures, since I cannot assess credit risk for 40,000 plus companies. For companies that have an S&P bond rating (about 15% of the sample), I use the rating to estimate a default spread. For the rest, I estimate synthetic bond ratings based on financial ratios (interest coverage and debt ratios). The US $ pre-tax cost of debt distribution is below:

Since these costs are all in US dollars, the differences across regions reflect difference in country default risk and reflect wide divergences. It is worth noting that the tax law tilt towards debt, represented in the fact that interest expenses are tax deductible and cash flows to equity (dividends and buybacks) have to come from after-tax cash flows, is not just a phenomenon for the US, but true over much of the world, with the Middle East representing the holdout. This tax benefit shows up in the cost of capital, through the conversion of the pre-tax cost of debt into an after-tax cost, using the marginal tax rate to make the adjustment:After-tax cost of debt = Pre-tax cost of debt (1 - Marginal Tax Rate)In my sample, I use the marginal tax rate of the country in which a company is incorporated. You can find these marginal tax rates, which KPMG should be credited for collecting, also on my website for download.
c. Debt Ratios and Costs of CapitalThe final piece of the puzzle in computing the cost of capital is the mix of debt and equity that companies use in funding their operations. In keeping with the cost of capital being a measure of what companies have to pay for their debt and equity today, I use the market values of equity and debt, with leases converted into debt and included in the latter, to compute the cost of capital. While I will talk in more detail about debt loads and choices in a future post, you can sense of the debt load at companies, as a percent of capital (in market value terms) in the table below below:

With these debt ratios, and using the costs of equity and debt also shown above, I compute costs of capital, in US dollar terms, for all publicly traded companies and the resulting distribution is below:

This is a table that I will use, and have already put to use, in valuing companies since it provides a quick and effective way to estimate discount rates for companies, without losing yourself in the details. Thus, when valuing a young, money-losing public company in the US (like Casper, the only mattress-maker that went public last week), I will use a cost of capital of 9.15%, representing the 90th percentile of US firms, whereas to value a slow-growing European company in a stable business, like Heineken, my cost of capital will be 6.02%, the 25th percentile of European companies. For all companies, the median cost of capital of 7.58% is a good proxy for the number that all companies will converge towards, as they approach maturity. If all of these numbers look low to you, that is because they reflect a risk free rate, in US dollars, that is low, and if it does rise, it will carry these numbers upwards. As with the risk measures, I have estimated costs of equity, debt and capital, by industry group and you can download them for all companies globally, as well as regionally (US, Emerging Markets, Europe, Japan and Australia/Canada) and for India and China, separately.
YouTube Video
Downloadable Data
Industry Average Risk Measures at start of 2020Betas, by industry (Global, US, Emerging Markets, Europe, Japan, Australia/Canada, India, China)Costs of Debt, Equity and Capital, by industry (Global, US, Emerging Markets, Europe, Japan, Australia/Canada, India, China)Marginal tax rates, by country, for 2020
February 26, 2020
A Viral Market Meltdown: Fear or Fundamentals?
It has become almost a rite of passage for investors, at least since 2008, that they will be tested by a market crisis precipitated sometimes by political developments (Brexit), sometimes by governments (trade wars), sometimes by war and terrorism (the US/Iran standoff) and sometimes by economics (Greek default). With each one, the question that you face about whether this is the “big one”, a market meltdown that you have to respond to by selling everything and fleeing for safety (or the closest thing you can find to it) or just another bump in the road, where markets claw back what they gave up, and then gain more. After yesterday’s global meltdown in equity markets, I think it is safe to say that we are back in crisis mode, with old questions returning about the global economic strength and market valuations. I have neither the stomach nor the expertise to play market guru, but I will go through my playbook for coping.
Start at the source
This crisis has an uncommon source, insofar as it is one of the few that is not man-made (at least based upon what we know now) and is thus more difficult to predict, in terms of how it will play out. As a novice in infectious diseases, here is what I know at the moment:The virus (COVID-19) had its origins in China, though what caused it to spread into the human population is still unclear and rife with conspiracy theories. In an attempt to keep the populace from panicking and to give the impress of being in control, the Chinese government initially went into crisis mode, trying to control the information that is being made public and that has created both confusion and skepticism about official claims.Within China, the virus has had its biggest impact in the Wuhan province, but it has affected other parts, though there is still not clear by how much or how many. The count, which is obviously a moving target, is that there are more than 80,000 cases of the virus, with more than 2700 fatalities so far. The latest reports from China is that new infections are falling, and if true, this would suggest that the spread is being controlled. The most immediate spread has been to the neighboring Asian countries, with Singapore being an early casualty and South Korea a recent-add on. It has jumped borders and is showing up in more distant parts of the world, mostly in occasional cases. Over the weekend, though, the Italian government set alarm bells ringing with an announcement of a large cluster of cases in the country, which suggests that earlier assessments that the virus was not easily communicable may need to be rethought, and it was this news that seems to have precipitated this week’s sell off. On February 25, the CDS warned Americans that the disease could make significant inroads in the United States and suggested that states prepare cautionary measures.There is no cure or vaccine yet for the virus, but the mortality rate from the virus seems to vary across the population, with the very young and the very old being the most likely to die from it, and across geographies, with more deaths in Asia than in Europe or the United States. The overall mortality rate is low ( about 3%), but it is higher for people who are hospitalized with complications. In short, there is a lot more that we do not know about COVID-19, than we do, at least at the moment. While it has not been labeled a pandemic yet, it seems to have the potential to become one, and we do not yet have a clear idea of how quickly it will spread, how many people will be affected and what will push it into dormancy. It is also clear that much of this uncertainty will get resolved by real-time developments, not by collecting data or by listening to experts to tell us what will happen.
Get perspective
There is no denying that the last week has been a rocky one for investors, and a 1800-point drop for the Dow over two days (February 24 &25) is bound to add to the sense of foreboding. Since the first casualty of a crisis is perspective, it may be worth stepping back and looking at the market through wider lens. After the drop yesterday (February 24), the S&P 500 was at 3225.89, slightly above where it started this month (February 2020) at. In short, investors in the index were back where they were 18 trading days ago. Bringing in February 25 into the picture does put you below that level, but it still way above what it was a year ago: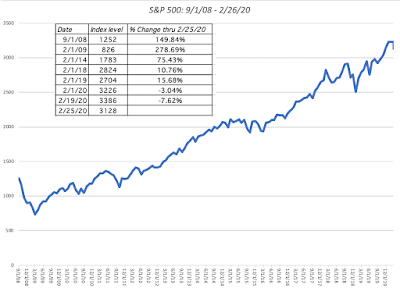
In fact, extending the comparison to longer time periods only makes the hand wringing over the last week’s losses look even more absurd. This is both good and bad news. The good news is that, if you are a diversified investor, your portfolio should not look dramatically different from what it looked like at the start of the year and much, much healthier than it looked a year ago, five years ago or ten years ago. The bad news is that the big run-up in stocks over the last decade has left you exposed to more and bigger losses to come. The bottom line is that your concern should not be about the damage to your portfolio from the last week’s developments, but the damage that is yet to come.
Have a frameworkWith perspective in place, I am now in a position to look to the future, since that should govern how we react to last week’s developments. Given my investment philosophy of trusting fundamentals and value, I have to go back to my basic framework for valuation, which is to tie the value of an investment to its cashflows, growth and risk. When valuing the overall market, here is what it looks like: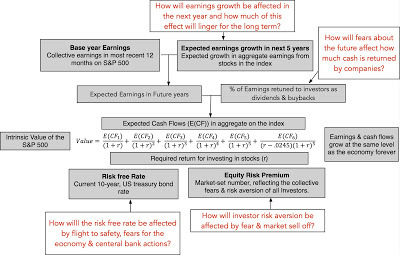
With my value framework, the effects of the Corona Virus will play out in my forward-looking numbers in the following inputs:
1. Earnings Growth: Even at this early stage in this crisis, it is clear that the virus is having an effect on corporate operations. With some companies like hotels and airlines, the effect that the virus has had on global travel has clearly had an effect on revenues and operations, and it should come as no surprise that United Airlines announced, after close of trading on February 24, 2020, that it was withdrawing its guidance for revenues this year, as it was waiting for more information. With others, it is concern about supply chain disruptions, especially with Chinese facilities, and how this will affect operations in the rest of the world. The follow up question then becomes one of specifics:Drop in 2020 Earnings: This is the number that will reflect how you see Corona Virus affect the collective earnings on stocks in 2020. This will include not only earnings declines caused by lower revenues growth at companies like United Airlines, but also the earnings decline caused by higher costs faced by companies due to virus related problems (supply chain breakdowns). The wider the swath of companies that are affected, the bigger will be the earnings effect. As to how big this effect will be on overall earnings, we can only guess, given where we are in this process. To provide some perspective, the 2008 banking crisis caused an earnings implosion, with earnings dropping almost 40% in 2008, from 2007, but the World Trade Center attacks in September 2001 barely made an impact on overall S&P 500 earnings in the last quarter of 2001.Drop in long term Earnings: In previous crises, where consumers and workers stayed home, either for health reasons or because of fear, the business that was lost as a result of the peril was made up for, when it passed. If consumption is just deferred or delayed, the growth in subsequent quarters will be higher, to compensate for the lost business in the crisis quarter. If consumption is lost, the drop in earnings in the crisis quarter will never be made up. To illustrate the point, I look at how three different perspectives on growth will play out in growth rates, based upon how much of the drop in earnings this year is recovered over the following years:[image error]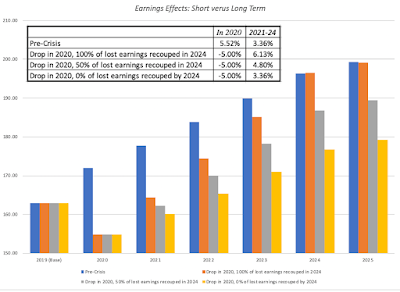
Note that the first series is the unadjusted earnings, prior to the corona virus scare and that in all three of the scenarios, there is a drop in earnings of 5% in 2020, putting earnings well below expected values for 2020, but the difference arises in how earnings recover after that. If none of the drop in earnings in 2020 is recouped in the following years, the earnings in 2025 is 179.22, well below the pre-virus estimate of 199.28. If only half of the earnings drop is recouped, the earnings in 2025 is 189.41 and if all of the earnings drop is recouped, the earnings in 2025, even with the virus effect, matches up to the original estimates.
2. Cash Returned: In 2019, US companies returned 92.33% of earnings as cash to stockholders, with a big chunk (about 60%) coming from buybacks. That high number reflects not only the cash that many US companies had on hand, but a confidence that they could maintain earnings and continue to pay out cash flows. To the extent that this confidence is shaken by the virus, you may see a pull back in this number to perhaps something closer to the 85.24% that is the average for the last decade.
3. Risk and Discount Rates: Finally, the required return on stocks will be impacted, with one of the effects being explicit and visible in markets, in the form of the US treasury bond rate and the other being implicit, taking the form of an equity risk premium. If investors become more risk averse, they will demand a higher ERP, though as the fear factor fades, this number will fall back as well, but perhaps not to what it was prior to the crisis. The fact that the equity risk premium is already at the higher end of the historical norms, at about 5.50% on February 25, 2020, does indicate limits, but there could be a short-term jump in the number, at least until there is less uncertainty.
Using this framework on the S&P 500, you can see how each of these variables play out in value.[image error]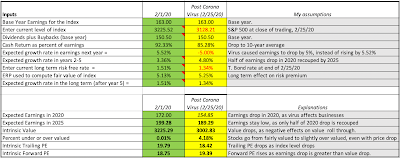 Download spreadsheetI am not an expert on infectious diseases, and the health and economic impacts of this virus are likely to play out as developments in real time, requiring that I revisit this framework frequently. Based upon my estimates of how this virus will affect the numbers, the value that I get for the index is 3003, about 4.14% less than the index level of 3128.21 at the close of trading on February 25, 2020, which, in turn, represents a significant drop from the level of the index a week ago. To the question of whether a virus can cause this much damage to the markets, the answer is yes, though whether it is an overreaction or not will depend on how it plays out in the numbers. For the moment, though, if you are tempted to buy on what looks like a dip, I would suggest caution just as I would argue for slowing down to someone who wants to do the opposite and sell. As you look at my assumptions about how the virus will play out in earnings (both short term and long term), cash flows and risk premiums, some of you may disagree (and perhaps even strongly) and you can use this spreadsheet to arrive at your own valuation of the index, and use it to drive your actions.
To thine own self, be true...It is entirely possible that I am underestimating the impact of this virus on economic growth and earnings and that I should be panicking more, but it is also plausible that I am over adjusting my numbers too much. The bottom line with my calculations is that I am inclined to do very little, at the moment. I don’t feel the urge to buy the market, because there is a plausible case to be made that the adjustment in value, steep and sudden, was merited. I feel little need to sell either, because I don’t see an over valuation large enough to trigger action. As for whether I should be reducing my exposure to companies that are directly affected by the virus (hotels and airlines) and increasing my exposure to companies that are more insulated, I don’t believe there will be any segment of the market that is fully protected from the consequences, no matter how far you get from China and from travel-oriented companies. In fact, if there is a segment of the market where you are likely to see over reaction, it is likely to be in airline, travel and energy stocks, precisely because they are in the center of the storm. Do I now wish that I had bought Zoom before this crisis reached full blown status? Yes, but I am not sure buying it now will do much for me. I am loath to offer advice, but my only suggestion is that rather than listen to the experts on either side of this debate tell you what to do, you should make your own best judgments, recognizing that they can and will change as more facts emerge, and act accordingly.
YouTube Video
Spreadsheets
Spreadsheet to value Corona Virus Effects on S&P 500 (February 25, 2020)<!-- /* Style Definitions */ p.MsoNormal, li.MsoNormal, div.MsoNormal {mso-style-unhide:no; mso-style-qformat:yes; mso-style-parent:""; margin:0in; margin-bottom:.0001pt; mso-pagination:widow-orphan; font-size:12.0pt; font-family:"Calibri",sans-serif; mso-ascii-font-family:Calibri; mso-ascii-theme-font:minor-latin; mso-fareast-font-family:Calibri; mso-fareast-theme-font:minor-latin; mso-hansi-font-family:Calibri; mso-hansi-theme-font:minor-latin; mso-bidi-font-family:"Times New Roman"; mso-bidi-theme-font:minor-bidi;} p.MsoListParagraph, li.MsoListParagraph, div.MsoListParagraph {mso-style-priority:34; mso-style-unhide:no; mso-style-qformat:yes; margin-top:0in; margin-right:0in; margin-bottom:0in; margin-left:.5in; margin-bottom:.0001pt; mso-add-space:auto; mso-pagination:widow-orphan; font-size:12.0pt; font-family:"Calibri",sans-serif; mso-ascii-font-family:Calibri; mso-ascii-theme-font:minor-latin; mso-fareast-font-family:Calibri; mso-fareast-theme-font:minor-latin; mso-hansi-font-family:Calibri; mso-hansi-theme-font:minor-latin; mso-bidi-font-family:"Times New Roman"; mso-bidi-theme-font:minor-bidi;} p.MsoListParagraphCxSpFirst, li.MsoListParagraphCxSpFirst, div.MsoListParagraphCxSpFirst {mso-style-priority:34; mso-style-unhide:no; mso-style-qformat:yes; mso-style-type:export-only; margin-top:0in; margin-right:0in; margin-bottom:0in; margin-left:.5in; margin-bottom:.0001pt; mso-add-space:auto; mso-pagination:widow-orphan; font-size:12.0pt; font-family:"Calibri",sans-serif; mso-ascii-font-family:Calibri; mso-ascii-theme-font:minor-latin; mso-fareast-font-family:Calibri; mso-fareast-theme-font:minor-latin; mso-hansi-font-family:Calibri; mso-hansi-theme-font:minor-latin; mso-bidi-font-family:"Times New Roman"; mso-bidi-theme-font:minor-bidi;} p.MsoListParagraphCxSpMiddle, li.MsoListParagraphCxSpMiddle, div.MsoListParagraphCxSpMiddle {mso-style-priority:34; mso-style-unhide:no; mso-style-qformat:yes; mso-style-type:export-only; margin-top:0in; margin-right:0in; margin-bottom:0in; margin-left:.5in; margin-bottom:.0001pt; mso-add-space:auto; mso-pagination:widow-orphan; font-size:12.0pt; font-family:"Calibri",sans-serif; mso-ascii-font-family:Calibri; mso-ascii-theme-font:minor-latin; mso-fareast-font-family:Calibri; mso-fareast-theme-font:minor-latin; mso-hansi-font-family:Calibri; mso-hansi-theme-font:minor-latin; mso-bidi-font-family:"Times New Roman"; mso-bidi-theme-font:minor-bidi;} p.MsoListParagraphCxSpLast, li.MsoListParagraphCxSpLast, div.MsoListParagraphCxSpLast {mso-style-priority:34; mso-style-unhide:no; mso-style-qformat:yes; mso-style-type:export-only; margin-top:0in; margin-right:0in; margin-bottom:0in; margin-left:.5in; margin-bottom:.0001pt; mso-add-space:auto; mso-pagination:widow-orphan; font-size:12.0pt; font-family:"Calibri",sans-serif; mso-ascii-font-family:Calibri; mso-ascii-theme-font:minor-latin; mso-fareast-font-family:Calibri; mso-fareast-theme-font:minor-latin; mso-hansi-font-family:Calibri; mso-hansi-theme-font:minor-latin; mso-bidi-font-family:"Times New Roman"; mso-bidi-theme-font:minor-bidi;} .MsoChpDefault {mso-style-type:export-only; mso-default-props:yes; font-family:"Calibri",sans-serif; mso-ascii-font-family:Calibri; mso-ascii-theme-font:minor-latin; mso-fareast-font-family:Calibri; mso-fareast-theme-font:minor-latin; mso-hansi-font-family:Calibri; mso-hansi-theme-font:minor-latin; mso-bidi-font-family:"Times New Roman"; mso-bidi-theme-font:minor-bidi;} @page WordSection1 {size:8.5in 11.0in; margin:1.0in 1.0in 1.0in 1.0in; mso-header-margin:.5in; mso-footer-margin:.5in; mso-paper-source:0;} div.WordSection1 {page:WordSection1;} /* List Definitions */ @list l0 {mso-list-id:688219898; mso-list-type:hybrid; mso-list-template-ids:-2069615104 67698703 67698713 67698715 67698703 67698713 67698715 67698703 67698713 67698715;} @list l0:level1 {mso-level-tab-stop:none; mso-level-number-position:left; text-indent:-.25in;} @list l0:level2 {mso-level-number-format:alpha-lower; mso-level-tab-stop:none; mso-level-number-position:left; text-indent:-.25in;} @list l0:level3 {mso-level-number-format:roman-lower; mso-level-tab-stop:none; mso-level-number-position:right; text-indent:-9.0pt;} @list l0:level4 {mso-level-tab-stop:none; mso-level-number-position:left; text-indent:-.25in;} @list l0:level5 {mso-level-number-format:alpha-lower; mso-level-tab-stop:none; mso-level-number-position:left; text-indent:-.25in;} @list l0:level6 {mso-level-number-format:roman-lower; mso-level-tab-stop:none; mso-level-number-position:right; text-indent:-9.0pt;} @list l0:level7 {mso-level-tab-stop:none; mso-level-number-position:left; text-indent:-.25in;} @list l0:level8 {mso-level-number-format:alpha-lower; mso-level-tab-stop:none; mso-level-number-position:left; text-indent:-.25in;} @list l0:level9 {mso-level-number-format:roman-lower; mso-level-tab-stop:none; mso-level-number-position:right; text-indent:-9.0pt;} @list l1 {mso-list-id:1484274615; mso-list-type:hybrid; mso-list-template-ids:973501718 67698703 67698713 67698715 67698703 67698713 67698715 67698703 67698713 67698715;} @list l1:level1 {mso-level-tab-stop:none; mso-level-number-position:left; text-indent:-.25in;} @list l1:level2 {mso-level-number-format:alpha-lower; mso-level-tab-stop:none; mso-level-number-position:left; text-indent:-.25in;} @list l1:level3 {mso-level-number-format:roman-lower; mso-level-tab-stop:none; mso-level-number-position:right; text-indent:-9.0pt;} @list l1:level4 {mso-level-tab-stop:none; mso-level-number-position:left; text-indent:-.25in;} @list l1:level5 {mso-level-number-format:alpha-lower; mso-level-tab-stop:none; mso-level-number-position:left; text-indent:-.25in;} @list l1:level6 {mso-level-number-format:roman-lower; mso-level-tab-stop:none; mso-level-number-position:right; text-indent:-9.0pt;} @list l1:level7 {mso-level-tab-stop:none; mso-level-number-position:left; text-indent:-.25in;} @list l1:level8 {mso-level-number-format:alpha-lower; mso-level-tab-stop:none; mso-level-number-position:left; text-indent:-.25in;} @list l1:level9 {mso-level-number-format:roman-lower; mso-level-tab-stop:none; mso-level-number-position:right; text-indent:-9.0pt;} </style> --></div>
Start at the source
This crisis has an uncommon source, insofar as it is one of the few that is not man-made (at least based upon what we know now) and is thus more difficult to predict, in terms of how it will play out. As a novice in infectious diseases, here is what I know at the moment:The virus (COVID-19) had its origins in China, though what caused it to spread into the human population is still unclear and rife with conspiracy theories. In an attempt to keep the populace from panicking and to give the impress of being in control, the Chinese government initially went into crisis mode, trying to control the information that is being made public and that has created both confusion and skepticism about official claims.Within China, the virus has had its biggest impact in the Wuhan province, but it has affected other parts, though there is still not clear by how much or how many. The count, which is obviously a moving target, is that there are more than 80,000 cases of the virus, with more than 2700 fatalities so far. The latest reports from China is that new infections are falling, and if true, this would suggest that the spread is being controlled. The most immediate spread has been to the neighboring Asian countries, with Singapore being an early casualty and South Korea a recent-add on. It has jumped borders and is showing up in more distant parts of the world, mostly in occasional cases. Over the weekend, though, the Italian government set alarm bells ringing with an announcement of a large cluster of cases in the country, which suggests that earlier assessments that the virus was not easily communicable may need to be rethought, and it was this news that seems to have precipitated this week’s sell off. On February 25, the CDS warned Americans that the disease could make significant inroads in the United States and suggested that states prepare cautionary measures.There is no cure or vaccine yet for the virus, but the mortality rate from the virus seems to vary across the population, with the very young and the very old being the most likely to die from it, and across geographies, with more deaths in Asia than in Europe or the United States. The overall mortality rate is low ( about 3%), but it is higher for people who are hospitalized with complications. In short, there is a lot more that we do not know about COVID-19, than we do, at least at the moment. While it has not been labeled a pandemic yet, it seems to have the potential to become one, and we do not yet have a clear idea of how quickly it will spread, how many people will be affected and what will push it into dormancy. It is also clear that much of this uncertainty will get resolved by real-time developments, not by collecting data or by listening to experts to tell us what will happen.
Get perspective
There is no denying that the last week has been a rocky one for investors, and a 1800-point drop for the Dow over two days (February 24 &25) is bound to add to the sense of foreboding. Since the first casualty of a crisis is perspective, it may be worth stepping back and looking at the market through wider lens. After the drop yesterday (February 24), the S&P 500 was at 3225.89, slightly above where it started this month (February 2020) at. In short, investors in the index were back where they were 18 trading days ago. Bringing in February 25 into the picture does put you below that level, but it still way above what it was a year ago:

In fact, extending the comparison to longer time periods only makes the hand wringing over the last week’s losses look even more absurd. This is both good and bad news. The good news is that, if you are a diversified investor, your portfolio should not look dramatically different from what it looked like at the start of the year and much, much healthier than it looked a year ago, five years ago or ten years ago. The bad news is that the big run-up in stocks over the last decade has left you exposed to more and bigger losses to come. The bottom line is that your concern should not be about the damage to your portfolio from the last week’s developments, but the damage that is yet to come.
Have a frameworkWith perspective in place, I am now in a position to look to the future, since that should govern how we react to last week’s developments. Given my investment philosophy of trusting fundamentals and value, I have to go back to my basic framework for valuation, which is to tie the value of an investment to its cashflows, growth and risk. When valuing the overall market, here is what it looks like:

With my value framework, the effects of the Corona Virus will play out in my forward-looking numbers in the following inputs:
1. Earnings Growth: Even at this early stage in this crisis, it is clear that the virus is having an effect on corporate operations. With some companies like hotels and airlines, the effect that the virus has had on global travel has clearly had an effect on revenues and operations, and it should come as no surprise that United Airlines announced, after close of trading on February 24, 2020, that it was withdrawing its guidance for revenues this year, as it was waiting for more information. With others, it is concern about supply chain disruptions, especially with Chinese facilities, and how this will affect operations in the rest of the world. The follow up question then becomes one of specifics:Drop in 2020 Earnings: This is the number that will reflect how you see Corona Virus affect the collective earnings on stocks in 2020. This will include not only earnings declines caused by lower revenues growth at companies like United Airlines, but also the earnings decline caused by higher costs faced by companies due to virus related problems (supply chain breakdowns). The wider the swath of companies that are affected, the bigger will be the earnings effect. As to how big this effect will be on overall earnings, we can only guess, given where we are in this process. To provide some perspective, the 2008 banking crisis caused an earnings implosion, with earnings dropping almost 40% in 2008, from 2007, but the World Trade Center attacks in September 2001 barely made an impact on overall S&P 500 earnings in the last quarter of 2001.Drop in long term Earnings: In previous crises, where consumers and workers stayed home, either for health reasons or because of fear, the business that was lost as a result of the peril was made up for, when it passed. If consumption is just deferred or delayed, the growth in subsequent quarters will be higher, to compensate for the lost business in the crisis quarter. If consumption is lost, the drop in earnings in the crisis quarter will never be made up. To illustrate the point, I look at how three different perspectives on growth will play out in growth rates, based upon how much of the drop in earnings this year is recovered over the following years:[image error]

Note that the first series is the unadjusted earnings, prior to the corona virus scare and that in all three of the scenarios, there is a drop in earnings of 5% in 2020, putting earnings well below expected values for 2020, but the difference arises in how earnings recover after that. If none of the drop in earnings in 2020 is recouped in the following years, the earnings in 2025 is 179.22, well below the pre-virus estimate of 199.28. If only half of the earnings drop is recouped, the earnings in 2025 is 189.41 and if all of the earnings drop is recouped, the earnings in 2025, even with the virus effect, matches up to the original estimates.
2. Cash Returned: In 2019, US companies returned 92.33% of earnings as cash to stockholders, with a big chunk (about 60%) coming from buybacks. That high number reflects not only the cash that many US companies had on hand, but a confidence that they could maintain earnings and continue to pay out cash flows. To the extent that this confidence is shaken by the virus, you may see a pull back in this number to perhaps something closer to the 85.24% that is the average for the last decade.
3. Risk and Discount Rates: Finally, the required return on stocks will be impacted, with one of the effects being explicit and visible in markets, in the form of the US treasury bond rate and the other being implicit, taking the form of an equity risk premium. If investors become more risk averse, they will demand a higher ERP, though as the fear factor fades, this number will fall back as well, but perhaps not to what it was prior to the crisis. The fact that the equity risk premium is already at the higher end of the historical norms, at about 5.50% on February 25, 2020, does indicate limits, but there could be a short-term jump in the number, at least until there is less uncertainty.
Using this framework on the S&P 500, you can see how each of these variables play out in value.[image error]
 Download spreadsheetI am not an expert on infectious diseases, and the health and economic impacts of this virus are likely to play out as developments in real time, requiring that I revisit this framework frequently. Based upon my estimates of how this virus will affect the numbers, the value that I get for the index is 3003, about 4.14% less than the index level of 3128.21 at the close of trading on February 25, 2020, which, in turn, represents a significant drop from the level of the index a week ago. To the question of whether a virus can cause this much damage to the markets, the answer is yes, though whether it is an overreaction or not will depend on how it plays out in the numbers. For the moment, though, if you are tempted to buy on what looks like a dip, I would suggest caution just as I would argue for slowing down to someone who wants to do the opposite and sell. As you look at my assumptions about how the virus will play out in earnings (both short term and long term), cash flows and risk premiums, some of you may disagree (and perhaps even strongly) and you can use this spreadsheet to arrive at your own valuation of the index, and use it to drive your actions.
 To thine own self, be true...It is entirely possible that I am underestimating the impact of this virus on economic growth and earnings and that I should be panicking more, but it is also plausible that I am over adjusting my numbers too much. The bottom line with my calculations is that I am inclined to do very little, at the moment. I don’t feel the urge to buy the market, because there is a plausible case to be made that the adjustment in value, steep and sudden, was merited. I feel little need to sell either, because I don’t see an over valuation large enough to trigger action. As for whether I should be reducing my exposure to companies that are directly affected by the virus (hotels and airlines) and increasing my exposure to companies that are more insulated, I don’t believe there will be any segment of the market that is fully protected from the consequences, no matter how far you get from China and from travel-oriented companies. In fact, if there is a segment of the market where you are likely to see over reaction, it is likely to be in airline, travel and energy stocks, precisely because they are in the center of the storm. Do I now wish that I had bought Zoom before this crisis reached full blown status? Yes, but I am not sure buying it now will do much for me. I am loath to offer advice, but my only suggestion is that rather than listen to the experts on either side of this debate tell you what to do, you should make your own best judgments, recognizing that they can and will change as more facts emerge, and act accordingly.
YouTube Video
Spreadsheets
Spreadsheet to value Corona Virus Effects on S&P 500 (February 25, 2020)<!-- /* Style Definitions */ p.MsoNormal, li.MsoNormal, div.MsoNormal {mso-style-unhide:no; mso-style-qformat:yes; mso-style-parent:""; margin:0in; margin-bottom:.0001pt; mso-pagination:widow-orphan; font-size:12.0pt; font-family:"Calibri",sans-serif; mso-ascii-font-family:Calibri; mso-ascii-theme-font:minor-latin; mso-fareast-font-family:Calibri; mso-fareast-theme-font:minor-latin; mso-hansi-font-family:Calibri; mso-hansi-theme-font:minor-latin; mso-bidi-font-family:"Times New Roman"; mso-bidi-theme-font:minor-bidi;} p.MsoListParagraph, li.MsoListParagraph, div.MsoListParagraph {mso-style-priority:34; mso-style-unhide:no; mso-style-qformat:yes; margin-top:0in; margin-right:0in; margin-bottom:0in; margin-left:.5in; margin-bottom:.0001pt; mso-add-space:auto; mso-pagination:widow-orphan; font-size:12.0pt; font-family:"Calibri",sans-serif; mso-ascii-font-family:Calibri; mso-ascii-theme-font:minor-latin; mso-fareast-font-family:Calibri; mso-fareast-theme-font:minor-latin; mso-hansi-font-family:Calibri; mso-hansi-theme-font:minor-latin; mso-bidi-font-family:"Times New Roman"; mso-bidi-theme-font:minor-bidi;} p.MsoListParagraphCxSpFirst, li.MsoListParagraphCxSpFirst, div.MsoListParagraphCxSpFirst {mso-style-priority:34; mso-style-unhide:no; mso-style-qformat:yes; mso-style-type:export-only; margin-top:0in; margin-right:0in; margin-bottom:0in; margin-left:.5in; margin-bottom:.0001pt; mso-add-space:auto; mso-pagination:widow-orphan; font-size:12.0pt; font-family:"Calibri",sans-serif; mso-ascii-font-family:Calibri; mso-ascii-theme-font:minor-latin; mso-fareast-font-family:Calibri; mso-fareast-theme-font:minor-latin; mso-hansi-font-family:Calibri; mso-hansi-theme-font:minor-latin; mso-bidi-font-family:"Times New Roman"; mso-bidi-theme-font:minor-bidi;} p.MsoListParagraphCxSpMiddle, li.MsoListParagraphCxSpMiddle, div.MsoListParagraphCxSpMiddle {mso-style-priority:34; mso-style-unhide:no; mso-style-qformat:yes; mso-style-type:export-only; margin-top:0in; margin-right:0in; margin-bottom:0in; margin-left:.5in; margin-bottom:.0001pt; mso-add-space:auto; mso-pagination:widow-orphan; font-size:12.0pt; font-family:"Calibri",sans-serif; mso-ascii-font-family:Calibri; mso-ascii-theme-font:minor-latin; mso-fareast-font-family:Calibri; mso-fareast-theme-font:minor-latin; mso-hansi-font-family:Calibri; mso-hansi-theme-font:minor-latin; mso-bidi-font-family:"Times New Roman"; mso-bidi-theme-font:minor-bidi;} p.MsoListParagraphCxSpLast, li.MsoListParagraphCxSpLast, div.MsoListParagraphCxSpLast {mso-style-priority:34; mso-style-unhide:no; mso-style-qformat:yes; mso-style-type:export-only; margin-top:0in; margin-right:0in; margin-bottom:0in; margin-left:.5in; margin-bottom:.0001pt; mso-add-space:auto; mso-pagination:widow-orphan; font-size:12.0pt; font-family:"Calibri",sans-serif; mso-ascii-font-family:Calibri; mso-ascii-theme-font:minor-latin; mso-fareast-font-family:Calibri; mso-fareast-theme-font:minor-latin; mso-hansi-font-family:Calibri; mso-hansi-theme-font:minor-latin; mso-bidi-font-family:"Times New Roman"; mso-bidi-theme-font:minor-bidi;} .MsoChpDefault {mso-style-type:export-only; mso-default-props:yes; font-family:"Calibri",sans-serif; mso-ascii-font-family:Calibri; mso-ascii-theme-font:minor-latin; mso-fareast-font-family:Calibri; mso-fareast-theme-font:minor-latin; mso-hansi-font-family:Calibri; mso-hansi-theme-font:minor-latin; mso-bidi-font-family:"Times New Roman"; mso-bidi-theme-font:minor-bidi;} @page WordSection1 {size:8.5in 11.0in; margin:1.0in 1.0in 1.0in 1.0in; mso-header-margin:.5in; mso-footer-margin:.5in; mso-paper-source:0;} div.WordSection1 {page:WordSection1;} /* List Definitions */ @list l0 {mso-list-id:688219898; mso-list-type:hybrid; mso-list-template-ids:-2069615104 67698703 67698713 67698715 67698703 67698713 67698715 67698703 67698713 67698715;} @list l0:level1 {mso-level-tab-stop:none; mso-level-number-position:left; text-indent:-.25in;} @list l0:level2 {mso-level-number-format:alpha-lower; mso-level-tab-stop:none; mso-level-number-position:left; text-indent:-.25in;} @list l0:level3 {mso-level-number-format:roman-lower; mso-level-tab-stop:none; mso-level-number-position:right; text-indent:-9.0pt;} @list l0:level4 {mso-level-tab-stop:none; mso-level-number-position:left; text-indent:-.25in;} @list l0:level5 {mso-level-number-format:alpha-lower; mso-level-tab-stop:none; mso-level-number-position:left; text-indent:-.25in;} @list l0:level6 {mso-level-number-format:roman-lower; mso-level-tab-stop:none; mso-level-number-position:right; text-indent:-9.0pt;} @list l0:level7 {mso-level-tab-stop:none; mso-level-number-position:left; text-indent:-.25in;} @list l0:level8 {mso-level-number-format:alpha-lower; mso-level-tab-stop:none; mso-level-number-position:left; text-indent:-.25in;} @list l0:level9 {mso-level-number-format:roman-lower; mso-level-tab-stop:none; mso-level-number-position:right; text-indent:-9.0pt;} @list l1 {mso-list-id:1484274615; mso-list-type:hybrid; mso-list-template-ids:973501718 67698703 67698713 67698715 67698703 67698713 67698715 67698703 67698713 67698715;} @list l1:level1 {mso-level-tab-stop:none; mso-level-number-position:left; text-indent:-.25in;} @list l1:level2 {mso-level-number-format:alpha-lower; mso-level-tab-stop:none; mso-level-number-position:left; text-indent:-.25in;} @list l1:level3 {mso-level-number-format:roman-lower; mso-level-tab-stop:none; mso-level-number-position:right; text-indent:-9.0pt;} @list l1:level4 {mso-level-tab-stop:none; mso-level-number-position:left; text-indent:-.25in;} @list l1:level5 {mso-level-number-format:alpha-lower; mso-level-tab-stop:none; mso-level-number-position:left; text-indent:-.25in;} @list l1:level6 {mso-level-number-format:roman-lower; mso-level-tab-stop:none; mso-level-number-position:right; text-indent:-9.0pt;} @list l1:level7 {mso-level-tab-stop:none; mso-level-number-position:left; text-indent:-.25in;} @list l1:level8 {mso-level-number-format:alpha-lower; mso-level-tab-stop:none; mso-level-number-position:left; text-indent:-.25in;} @list l1:level9 {mso-level-number-format:roman-lower; mso-level-tab-stop:none; mso-level-number-position:right; text-indent:-9.0pt;} </style> --></div>
February 19, 2020
Data Update 4: Country Risk and Currency Questions!
In my last post, I looked at the risk premiums in US markets, and you may have found that focus to be a little parochial, since as an investor, you could invest in Europe, Asia, Africa or Latin America, if you believed that you would receive a better risk-return trade off. For some investors, in countries with investment restrictions, the only investment options are domestic, and US investment options may not be within their reach. In this post, I will address country risk, and how it affects investment decisions not only on the part of individual investors but also of companies, and then look at the currency question, which is often mixed in with country risk, but has a very different set of fundamentals and consequences.
Country RiskThere should be little debate that investing or operating in some countries will expose you to more risk than in other countries, for a number of reasons, ranging from politics to economics to location. As globalization pushes investors and companies to look outside of their domestic markets, they find themselves drawn to some of the riskiest parts of the world because that is where their growth lies.
Drivers and Determinants In a post in early August 2019, I laid out in detail the sources of country risk. Specifically, I listed and provided measures of four ingredients:Life Cycle: As companies go through the life cycle, their risk profiles changes with risk dampening as they mature. Countries go through their own version of the life cycle, with developed and more mature markets having more settled risk profiles than emerging economies which are still growing, changing and generally more risky. High growth economies tend to also have higher volatility in growth than low growth economies. Political Risk: A political structure that is unstable adds to economic risk, by making regulatory and tax law volatile, and adding unpredictable costs to businesses. While there are some investors and businesses that believe autocracies and dictatorships offer more stability than democracies, I would argue for nuance. I believe that autocracies do offer more temporal stability but they are also more exposed to more jarring, discontinuous change. Legal Risk: Businesses and investments are heavily dependent on legal systems that enforce contracts and ownership rights. Countries with dysfunctional legal systems will create more risk for investors than countries where the legal systems works well and in a timely fashion.Economic Structure: Some countries have more risk exposure simply because they are overly dependent on an industry or commodity for their prosperity, and an industry downturn or a commodity price drop can send their economies into a tailspin. Any businesses that operate in these countries are consequently exposed to this volatility.The bottom line, if you consider all four of these risks, is that some countries are riskier than others, and it behooves us to factor this risk in, when investing in these countries, either directly as a business or indirectly as an investor in that business.
Measures If you accept the proposition that some countries are riskier than others, the next step is measuring this country risk and there are three ways you can approach the task:a. Country Risk Scores: There are services that measure country risk with scores, trying to capture exposure to all of the risks listed above. The scores are subjective judgments and are not quite comparable across services, because each service scales risk differently. The World Bank provides an array of governance indicators (from corruption to political stability) for 214 countries (https://databank.worldbank.org/source/worldwide-governance-indicators#) , whereas Political Risk Services (PRS) measures a composite risk score for each country, with low (high) scores corresponding to high (low) country risk. b. Default Risk: The most widely accessible measure of country risk markets in financial markets is country default risk, measured with a sovereign rating by Moody’s, S&P and other ratings agencies for about 140 countries and a market-based measure (Sovereign CDS) for about 72 countries. The picture below provides sovereign ratings and sovereign CDS spreads across the globe at the start of 2020:
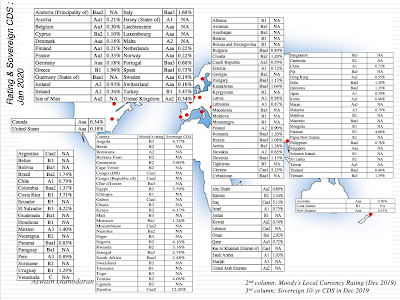 Download spreadsheetc. Equity Risk: While there are some who use the country default spreads as proxies for additional equity risk in countries, I scale up the default spread for the higher risk in equities, using the ratio of volatility in an emerging market equity index to an emerging market bond index to estimate the added risk premium for countries:
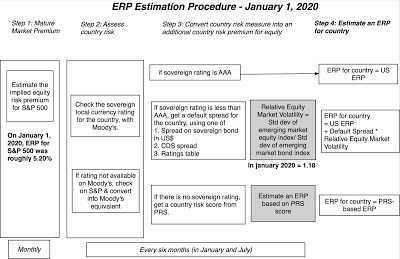
Note that the base premium for a mature equity market at the start of 2020 is set to the implied equity risk premium of 5.20% that we estimated for the S&P 500 at the start of 2020. The picture below shows equity risk premiums, by country, at the start of 2020: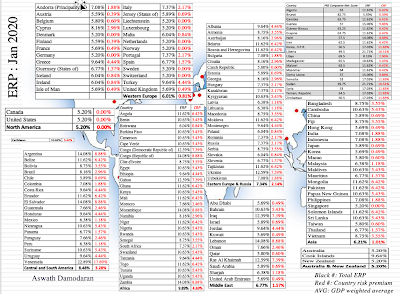 Download spreadsheetLooking back at these equity risk premiums for countries going back to 1992, and comparing the country ERP at the start of 2020 to my estimates at the start of 2019, you see a significant drop off, reflecting a decline in sovereign default spreads of about 20-25% across default classes in 2019 and a drop in the equity risk, relative to bonds.
Company Risk Exposure to Country Risk The conventional practice in valuation, which seems to be ascribe to all countries incorporated and listed in a country, the country risk premium for that country, is both sloppy and wrong. A company’s risk comes from where and how it operates its businesses, not where it is incorporated and traded. A German company that manufactures its products in Poland and sells them in China is German only in name and is exposed to Polish and Chinese country risk. One reason that I estimate the equity risk premiums for as many countries as I need them in both valuation and corporate finance, even if every company I analyze is a US company.
Valuing Companies If you accept my proposition that to value a company, you have to incorporate the risk of where it does business into the analysis, the equity risk premium that you use for a company should reflect where it operates. The open question is whether it is better to measure operating risk exposure with where a company generates its revenues, where its production is located or a mix of the two. For companies like Coca Cola, where the production costs are a fraction of revenues and moveable, I think it makes sense to use revenues. Using the company’s 2018-19 revenue breakdown, for instance, the equity risk premium for the country is: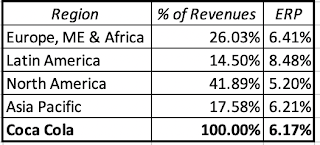
For companies where production costs are higher and facilities are less moveable, your weights for countries should at least partially based on production. At the limit, with natural resource companies, the operating exposure should be based upon where it produces those resources. Thus, Aramco’s equity risk premium should be entirely based on Saudi Arabia’s, since it extracts all its oil there, but Royal Dutch’s will reflect its more diverse production base:
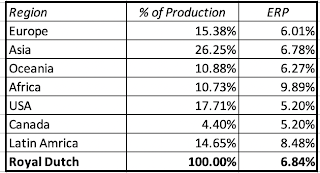
Put simply, the exposure to country risk does not come from where a company is incorporated or where it is traded, but from its operations.
Analyzing Projects/Investments If equity risk premiums are a critical ingredient for valuation, they are just as important in corporate finance, determining what hurdle rates multinationals should use, when considering projects in foreign markets. With L’Oreal, for instance, a project for expansion in Brazil should carry the equity risk premium for Brazil, whereas a project in India should carry the Indian equity risk premium. The notion of a corporate cost of capital that you use on every project is both absurd and dangerous, and becomes even more so when you are in multiple businesses.
The Currency EffectWhen the discussion turns to country risk, it almost always veers off into currency risk, with many conflating the two, in their discussions. While there are conditions where the two are correlated and draw from the same fundamentals, it is good to keep the two risks separate, since how you deal with them can also be very different.
Decoding Currencies: Interest Rates and Exchange Rates When analyzing currencies, it is very easy to get distracted by experts with macro views, providing their forecasts with absolute certainty, and distractions galore, from governments keeping their currencies stronger or weaker and speculative trading. To get past this noise, I will draw on the intrinsic interest rate equation that I used in my last post to explain why interest rates in the United States have stayed low for the last decade, Intrinsic Riskfree Rate = Inflation + Real GDP GrowthThat identity can be used to both explain why interest rates vary across currencies as well as variation in exchange rates over time.
Risk free RatesIf you accept the proposition that the interest rate in a currency is the sum of the expected inflation in that currency and a real interest that stands in for real growth, it follows that risk free rates will vary across currencies. Getting those currency-specific risk rates can range from trivial (looking up a government bond rate) to difficult (where the government bond rate provides a starting point, but needs cleaning up) to complex (where you have to construct a risk free rate out of what seems like thin air).
1. Government Bond RatesThere are a few dozen governments that issue ten-year bonds in their local currencies, and the search for risk free rates starts there. To the extent that these government bonds are liquid and you perceive no default risk in the government, you can use the government bond rate as your risk free rate. It is that rationale that we use to justify using the Swiss Government’s Swiss Franc 10-year rate as the risk free rate in Swiss Francs and the Norwegian government’s ten-year Krone rate as the riskfree rate in Krone. It is still the rationale, though you are likely to start to get some pushback, in using the US treasury bond rate as the risk free rate in dollars and the German 10-year Euro as the risk free rate in Euros. The pushback will come from some who argue that the US treasury can choose to default and that the German government does not really control the printing of the Euro and could default as well. While I can defend the practice of using the government bond rate as the risk free rate in these scenarios, arguing that you can use the Nigerian government’s Naira bond rate or the Brazilian government’s Reai bond rate as risk free is much more difficult to do. In fact, these are government’s where ratings agencies perceive significant risk even in the local currency bonds and attach ratings that reflect that risk. Moody’s rates Brazil’s local currency bonds at Ba2 and India’s local currency bonds at Baa2. In my pursuit of a risk free rate in currencies like these (where there is no Aaa-rated entity issung a bond), I compute a risk free rate by netting out the default spread:Riskfree Rate in currency = Government bond rate – Default Spread for sovereign local-currency ratingUsing this approach on the Indian rupee and the Brazilian reai,Riskfree Rate in Rupees on January 1, 2020 = Indian Government Rupee Bond rate on January 1, 2020 – Default spread based on Baa2 rating = 6.56% - 1.59% = 4.95%Riskfree Rate in Brazilian $R = Brazilian Government $R Bond rate on January 1, 2020 – Default spread based on Ba2 rating = 6.77% - 2.51% = 4.26%Extending this approach to all countries where a local currency government bond is available, we get the following risk free rates: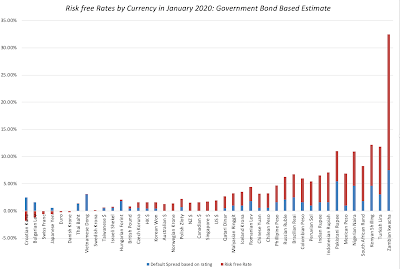 Download spreadsheetNote that these estimates are only as good as the three data inputs that go into them. First, the government bond rates reported have to reflect a traded and liquid bond, clearly not an issue with the US treasury or German Euro bond, but a stretch for the Zambian kwacha bond. Second, the local currency rating is a good measure of the default risk, a challenge when ratings agencies are biased or late in adjusting. Third, the default spread, given the ratings class, is estimated without bias and reflects the market at the time of the assessment.
2. Synthetic Risk free RatesIf you have doubts about one or more of three assumptions needed to use the government-bond approach to getting to risk free rates, don’t fear, because there is an alternative that I will call my synthetic risk free rate. To use this approach, let’s start with a currency in which you feel comfortable estimating a risk free rate, say the US dollar. If the key driver of risk free rates is expected inflation, the risk free rate in any other currency can be estimated using the differential inflation between that currency and the US dollar. In the short cut, you add the differential inflation to the US T.Bond rate to get a risk free rate:
Local Currency Risk free rate = US T.Bond Rate + (Inflation rate in local currency - Inflation rate in US dollars)
In the full calculation, you incorporate the compounding effects of the differential inflation This approach can be used in almost any setting to estimate a local currency risk free rate, including the following:Currencies with no government bonds outstanding: There are more than 120 currencies, where there are no government bonds in the local currency; the country borrows from banks and the IMF, not from markets. Without a government bond rate, the approach described above becomes moot.Currencies where the government bond rate is not trustworthy: There are currencies where there is a government bond, with a rate, but an absence of liquidity and/or the presence of institutions being forced to buy the bond by the government that may make the rates untrustworthy. I don't mean to cast aspersions, but I seriously doubt that the Zambian Kwacha bond, whose rate I specified in the last section, has a deep or wide market.Pegged Currencies: There are some currencies that have been pegged to the US dollar, either for convenience (much of the Middle East) or stability (Ecuador). While analysts in these markets often use the US T.Bond rate as the risk free rate, there is a very real danger that what is pegged today may be unpegged in the future, especially when the fundamentals don't support the peg. Specifically, if the local inflation rate is much higher than the inflation rate in the US, it may be more prudent to use the synthetic risk free rate instead of the US T.Bond rate as the risk free rate.The key inputs here are the expected inflation rate in the US dollar and the expected inflation rate in the local currency. The former can be obtained from market data, using the difference between the US T.Bond rate and the TIPs rate, but the latter is more difficult. While you can always use last year’s inflation rate, but that number is not only backward looking but subject to manipulation. I prefer the forecasts of inflation that you can get from the IMF, and I have used those to get expected risk free rates in other currencies, using the US T.Bond rate as my base risk free rate, and you can find them at this link.
Currency Choice Having belabored the reasons for why riskfree rates vary across currencies, let’s talk about how to pick a currency to use in valuing a company. The key word is choice, since you can value any company in any currency, though it may be easiest to get financial information on the company, in a local currency. An Indian company can be valued in US dollars, Indian Rupees or Euros, or even in real terms, and if you are consistent about dealing with inflation in your valuation, the value should be the same in every currency. At first sight, that may sound odd, since the risk free rate in US dollars is much lower than the risk free rate in Indian rupees, but the answer lies in looking at all of the inputs into value, not just the discount rate. In fact, inflation affects all of your numbers: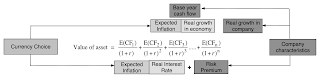
With high inflation currencies, the damage wrought by the higher discount rates that they bring into the process are offset by the higher nominal growth you will have in your cash flows, and the effects will cancel out. With low inflation currencies, any benefits you get from the lower discount rates that come with them will be given back when you use the lower nominal growth rates that go with them. In practice, there is perhaps no other aspect of valuation where you are more likely to be see consistency errors than with currencies, and here are some scenarios:Casual Dollarization: In casual dollarization, you start by estimating your costs of equity and capital in US dollars, partly because you do not want to or cannot estimate risk free rates in a local currency. You then convert your expected future cash flows in the local currency and convert them to dollars using the current exchange rate. That represents a fatal step, since the inflation differentials that cause risk free rates to be different will also cause exchange rates to change over time. Purchasing power parity may be a crude approximation of reality, but it is a reality that will eventually hold, and ignoring can lead to valuation errors that are huge.Corporate hurdle rates: I have long argued against computing a corporate cost of capital and using it as a hurdle rate on investments and acquisitions, and that argument gets even stronger, when the investments or acquisitions are cross-border and in different currencies. If a European company takes its Euro cost of capital and uses it to value Hungarian, Polish or Russian companies, not correcting for either country risk or currency differentials, it will find a lot of “bargains”.Mismatched Currency Frames of Reference: We all have frames of reference that are built into our thinking, based upon where we live and the currencies we deal with. Having lived in the US for 40 years and dealt with more US companies than companies in any other market, I tend to think in US dollar terms, when I think of reasonable, high or low growth rates. While that is understandable, I have to remember that when conversing with an Indian analyst in Mumbai, whose day-to-day dealings in rupees, the growth rates that he or she provides me for a company will be in rupees. Consequently, it behooves both of us to be explicit about currencies (my expected growth rate for Infosys, in US dollars, is 4.5% or my cost of capital, in Indian rupees, is 10%) when making statements, even though it is cumbersome.One of the side costs of globalization is that you can no longer assume, especially if you are a US investor or analysts, that the conversations that you will be having will always be on your currency terms (presumably dollars). Understanding how currencies are measurement tools, not instruments of risk or asset classes, will make that transition easier.
ConclusionIn this post, I looked at two variables, country and currency, that are often conflated in valuation, perhaps because risky countries tend to have volatile currencies, and separated the discussion to examine the determinants of each, and why they should not be lumped together. I can invest in a company in a risky country, and I can choose to do the valuation in US dollars, but only if I recognize that the currency choice cannot make the country risk go away. In other words, a Russian or Brazilian company will stay risky, even if you value it in US dollars, and a company that gets all of its revenues in Northern Europe will stay safe, even if you value it in Russian Rubles.<!-- /* Style Definitions */ p.MsoNormal, li.MsoNormal, div.MsoNormal {mso-style-unhide:no; mso-style-qformat:yes; mso-style-parent:""; margin:0in; margin-bottom:.0001pt; mso-pagination:widow-orphan; font-size:12.0pt; font-family:"Calibri",sans-serif; mso-ascii-font-family:Calibri; mso-ascii-theme-font:minor-latin; mso-fareast-font-family:Calibri; mso-fareast-theme-font:minor-latin; mso-hansi-font-family:Calibri; mso-hansi-theme-font:minor-latin; mso-bidi-font-family:"Times New Roman"; mso-bidi-theme-font:minor-bidi;} a:link, span.MsoHyperlink {mso-style-priority:99; color:#0563C1; mso-themecolor:hyperlink; text-decoration:underline; text-underline:single;} a:visited, span.MsoHyperlinkFollowed {mso-style-noshow:yes; mso-style-priority:99; color:#954F72; mso-themecolor:followedhyperlink; text-decoration:underline; text-underline:single;} p.MsoListParagraph, li.MsoListParagraph, div.MsoListParagraph {mso-style-priority:34; mso-style-unhide:no; mso-style-qformat:yes; margin-top:0in; margin-right:0in; margin-bottom:0in; margin-left:.5in; margin-bottom:.0001pt; mso-add-space:auto; mso-pagination:widow-orphan; font-size:12.0pt; font-family:"Calibri",sans-serif; mso-ascii-font-family:Calibri; mso-ascii-theme-font:minor-latin; mso-fareast-font-family:Calibri; mso-fareast-theme-font:minor-latin; mso-hansi-font-family:Calibri; mso-hansi-theme-font:minor-latin; mso-bidi-font-family:"Times New Roman"; mso-bidi-theme-font:minor-bidi;} p.MsoListParagraphCxSpFirst, li.MsoListParagraphCxSpFirst, div.MsoListParagraphCxSpFirst {mso-style-priority:34; mso-style-unhide:no; mso-style-qformat:yes; mso-style-type:export-only; margin-top:0in; margin-right:0in; margin-bottom:0in; margin-left:.5in; margin-bottom:.0001pt; mso-add-space:auto; mso-pagination:widow-orphan; font-size:12.0pt; font-family:"Calibri",sans-serif; mso-ascii-font-family:Calibri; mso-ascii-theme-font:minor-latin; mso-fareast-font-family:Calibri; mso-fareast-theme-font:minor-latin; mso-hansi-font-family:Calibri; mso-hansi-theme-font:minor-latin; mso-bidi-font-family:"Times New Roman"; mso-bidi-theme-font:minor-bidi;} p.MsoListParagraphCxSpMiddle, li.MsoListParagraphCxSpMiddle, div.MsoListParagraphCxSpMiddle {mso-style-priority:34; mso-style-unhide:no; mso-style-qformat:yes; mso-style-type:export-only; margin-top:0in; margin-right:0in; margin-bottom:0in; margin-left:.5in; margin-bottom:.0001pt; mso-add-space:auto; mso-pagination:widow-orphan; font-size:12.0pt; font-family:"Calibri",sans-serif; mso-ascii-font-family:Calibri; mso-ascii-theme-font:minor-latin; mso-fareast-font-family:Calibri; mso-fareast-theme-font:minor-latin; mso-hansi-font-family:Calibri; mso-hansi-theme-font:minor-latin; mso-bidi-font-family:"Times New Roman"; mso-bidi-theme-font:minor-bidi;} p.MsoListParagraphCxSpLast, li.MsoListParagraphCxSpLast, div.MsoListParagraphCxSpLast {mso-style-priority:34; mso-style-unhide:no; mso-style-qformat:yes; mso-style-type:export-only; margin-top:0in; margin-right:0in; margin-bottom:0in; margin-left:.5in; margin-bottom:.0001pt; mso-add-space:auto; mso-pagination:widow-orphan; font-size:12.0pt; font-family:"Calibri",sans-serif; mso-ascii-font-family:Calibri; mso-ascii-theme-font:minor-latin; mso-fareast-font-family:Calibri; mso-fareast-theme-font:minor-latin; mso-hansi-font-family:Calibri; mso-hansi-theme-font:minor-latin; mso-bidi-font-family:"Times New Roman"; mso-bidi-theme-font:minor-bidi;} .MsoChpDefault {mso-style-type:export-only; mso-default-props:yes; font-family:"Calibri",sans-serif; mso-ascii-font-family:Calibri; mso-ascii-theme-font:minor-latin; mso-fareast-font-family:Calibri; mso-fareast-theme-font:minor-latin; mso-hansi-font-family:Calibri; mso-hansi-theme-font:minor-latin; mso-bidi-font-family:"Times New Roman"; mso-bidi-theme-font:minor-bidi;} @page WordSection1 {size:8.5in 11.0in; margin:1.0in 1.0in 1.0in 1.0in; mso-header-margin:.5in; mso-footer-margin:.5in; mso-paper-source:0;} div.WordSection1 {page:WordSection1;} /* List Definitions */ @list l0 {mso-list-id:225725268; mso-list-type:hybrid; mso-list-template-ids:-1664981610 67698713 67698713 67698715 67698703 67698713 67698715 67698703 67698713 67698715;} @list l0:level1 {mso-level-number-format:alpha-lower; mso-level-tab-stop:none; mso-level-number-position:left; text-indent:-.25in;} @list l0:level2 {mso-level-number-format:alpha-lower; mso-level-tab-stop:none; mso-level-number-position:left; text-indent:-.25in;} @list l0:level3 {mso-level-number-format:roman-lower; mso-level-tab-stop:none; mso-level-number-position:right; text-indent:-9.0pt;} @list l0:level4 {mso-level-tab-stop:none; mso-level-number-position:left; text-indent:-.25in;} @list l0:level5 {mso-level-number-format:alpha-lower; mso-level-tab-stop:none; mso-level-number-position:left; text-indent:-.25in;} @list l0:level6 {mso-level-number-format:roman-lower; mso-level-tab-stop:none; mso-level-number-position:right; text-indent:-9.0pt;} @list l0:level7 {mso-level-tab-stop:none; mso-level-number-position:left; text-indent:-.25in;} @list l0:level8 {mso-level-number-format:alpha-lower; mso-level-tab-stop:none; mso-level-number-position:left; text-indent:-.25in;} @list l0:level9 {mso-level-number-format:roman-lower; mso-level-tab-stop:none; mso-level-number-position:right; text-indent:-9.0pt;} @list l1 {mso-list-id:704251167; mso-list-type:hybrid; mso-list-template-ids:-436047092 67698713 67698713 67698715 67698703 67698713 67698715 67698703 67698713 67698715;} @list l1:level1 {mso-level-number-format:alpha-lower; mso-level-tab-stop:none; mso-level-number-position:left; text-indent:-.25in;} @list l1:level2 {mso-level-number-format:alpha-lower; mso-level-tab-stop:none; mso-level-number-position:left; text-indent:-.25in;} @list l1:level3 {mso-level-number-format:roman-lower; mso-level-tab-stop:none; mso-level-number-position:right; text-indent:-9.0pt;} @list l1:level4 {mso-level-tab-stop:none; mso-level-number-position:left; text-indent:-.25in;} @list l1:level5 {mso-level-number-format:alpha-lower; mso-level-tab-stop:none; mso-level-number-position:left; text-indent:-.25in;} @list l1:level6 {mso-level-number-format:roman-lower; mso-level-tab-stop:none; mso-level-number-position:right; text-indent:-9.0pt;} @list l1:level7 {mso-level-tab-stop:none; mso-level-number-position:left; text-indent:-.25in;} @list l1:level8 {mso-level-number-format:alpha-lower; mso-level-tab-stop:none; mso-level-number-position:left; text-indent:-.25in;} @list l1:level9 {mso-level-number-format:roman-lower; mso-level-tab-stop:none; mso-level-number-position:right; text-indent:-9.0pt;} @list l2 {mso-list-id:1572615270; mso-list-type:hybrid; mso-list-template-ids:-918238414 67698713 67698713 67698715 67698703 67698713 67698715 67698703 67698713 67698715;} @list l2:level1 {mso-level-number-format:alpha-lower; mso-level-tab-stop:none; mso-level-number-position:left; text-indent:-.25in;} @list l2:level2 {mso-level-number-format:alpha-lower; mso-level-tab-stop:none; mso-level-number-position:left; text-indent:-.25in;} @list l2:level3 {mso-level-number-format:roman-lower; mso-level-tab-stop:none; mso-level-number-position:right; text-indent:-9.0pt;} @list l2:level4 {mso-level-tab-stop:none; mso-level-number-position:left; text-indent:-.25in;} @list l2:level5 {mso-level-number-format:alpha-lower; mso-level-tab-stop:none; mso-level-number-position:left; text-indent:-.25in;} @list l2:level6 {mso-level-number-format:roman-lower; mso-level-tab-stop:none; mso-level-number-position:right; text-indent:-9.0pt;} @list l2:level7 {mso-level-tab-stop:none; mso-level-number-position:left; text-indent:-.25in;} @list l2:level8 {mso-level-number-format:alpha-lower; mso-level-tab-stop:none; mso-level-number-position:left; text-indent:-.25in;} @list l2:level9 {mso-level-number-format:roman-lower; mso-level-tab-stop:none; mso-level-number-position:right; text-indent:-9.0pt;} @list l3 {mso-list-id:1668626712; mso-list-type:hybrid; mso-list-template-ids:609640616 67698713 67698713 67698715 67698703 67698713 67698715 67698703 67698713 67698715;} @list l3:level1 {mso-level-number-format:alpha-lower; mso-level-tab-stop:none; mso-level-number-position:left; text-indent:-.25in;} @list l3:level2 {mso-level-number-format:alpha-lower; mso-level-tab-stop:none; mso-level-number-position:left; text-indent:-.25in;} @list l3:level3 {mso-level-number-format:roman-lower; mso-level-tab-stop:none; mso-level-number-position:right; text-indent:-9.0pt;} @list l3:level4 {mso-level-tab-stop:none; mso-level-number-position:left; text-indent:-.25in;} @list l3:level5 {mso-level-number-format:alpha-lower; mso-level-tab-stop:none; mso-level-number-position:left; text-indent:-.25in;} @list l3:level6 {mso-level-number-format:roman-lower; mso-level-tab-stop:none; mso-level-number-position:right; text-indent:-9.0pt;} @list l3:level7 {mso-level-tab-stop:none; mso-level-number-position:left; text-indent:-.25in;} @list l3:level8 {mso-level-number-format:alpha-lower; mso-level-tab-stop:none; mso-level-number-position:left; text-indent:-.25in;} @list l3:level9 {mso-level-number-format:roman-lower; mso-level-tab-stop:none; mso-level-number-position:right; text-indent:-9.0pt;} @list l4 {mso-list-id:1797991945; mso-list-type:hybrid; mso-list-template-ids:-101010710 67698713 67698713 67698715 67698703 67698713 67698715 67698703 67698713 67698715;} @list l4:level1 {mso-level-number-format:alpha-lower; mso-level-tab-stop:none; mso-level-number-position:left; text-indent:-.25in;} @list l4:level2 {mso-level-number-format:alpha-lower; mso-level-tab-stop:none; mso-level-number-position:left; text-indent:-.25in;} @list l4:level3 {mso-level-number-format:roman-lower; mso-level-tab-stop:none; mso-level-number-position:right; text-indent:-9.0pt;} @list l4:level4 {mso-level-tab-stop:none; mso-level-number-position:left; text-indent:-.25in;} @list l4:level5 {mso-level-number-format:alpha-lower; mso-level-tab-stop:none; mso-level-number-position:left; text-indent:-.25in;} @list l4:level6 {mso-level-number-format:roman-lower; mso-level-tab-stop:none; mso-level-number-position:right; text-indent:-9.0pt;} @list l4:level7 {mso-level-tab-stop:none; mso-level-number-position:left; text-indent:-.25in;} @list l4:level8 {mso-level-number-format:alpha-lower; mso-level-tab-stop:none; mso-level-number-position:left; text-indent:-.25in;} @list l4:level9 {mso-level-number-format:roman-lower; mso-level-tab-stop:none; mso-level-number-position:right; text-indent:-9.0pt;} </style> <br /><b>YouTube Video</b><br /><iframe allow="accelerometer; autoplay; encrypted-media; gyroscope; picture-in-picture" allowfullscreen="" frameborder="0" height="315" src="https://www.youtube.com/embed/S_bq0D5..." width="560"></iframe><br /><b><br /></b><b>Data Links</b><br /><br /><ol style="text-align: left;"><li><a href="http://www.stern.nyu.edu/~adamodar/pc... and Sovereign CDS spreads, by country (January 2020)</a></li><li><a href="http://www.stern.nyu.edu/~adamodar/pc... Equity Risk Premiums in January 2020</a></li><li><a href="http://www.stern.nyu.edu/~adamodar/pc... Bond Rates and Riskfree Rates by Currency in January 2020</a></li><li><a href="http://www.stern.nyu.edu/~adamodar/pc... Riskfree Rates in 2020 (with inflation rates by currency)</a></li></ol><br /><b>Data Update Posts</b><br /><ol style="text-align: justify;"><li><a href="https://aswathdamodaran.blogspot.com/... Update 1 for 2020: Setting the Table</a></li><li><a href="https://aswathdamodaran.blogspot.com/... Update 2 for 2020: Retrospective on a Disruptive Decade</a></li><li><a href="https://aswathdamodaran.blogspot.com/... Update 3 for 2020: The Price of Risk!</a></li><li>Data Update 4 for 2020: Country and Currency Effects</li></ol><br /><div class="MsoNormal" style="font-size: medium; text-align: justify;"><br /></div></div>
Country RiskThere should be little debate that investing or operating in some countries will expose you to more risk than in other countries, for a number of reasons, ranging from politics to economics to location. As globalization pushes investors and companies to look outside of their domestic markets, they find themselves drawn to some of the riskiest parts of the world because that is where their growth lies.
Drivers and Determinants In a post in early August 2019, I laid out in detail the sources of country risk. Specifically, I listed and provided measures of four ingredients:Life Cycle: As companies go through the life cycle, their risk profiles changes with risk dampening as they mature. Countries go through their own version of the life cycle, with developed and more mature markets having more settled risk profiles than emerging economies which are still growing, changing and generally more risky. High growth economies tend to also have higher volatility in growth than low growth economies. Political Risk: A political structure that is unstable adds to economic risk, by making regulatory and tax law volatile, and adding unpredictable costs to businesses. While there are some investors and businesses that believe autocracies and dictatorships offer more stability than democracies, I would argue for nuance. I believe that autocracies do offer more temporal stability but they are also more exposed to more jarring, discontinuous change. Legal Risk: Businesses and investments are heavily dependent on legal systems that enforce contracts and ownership rights. Countries with dysfunctional legal systems will create more risk for investors than countries where the legal systems works well and in a timely fashion.Economic Structure: Some countries have more risk exposure simply because they are overly dependent on an industry or commodity for their prosperity, and an industry downturn or a commodity price drop can send their economies into a tailspin. Any businesses that operate in these countries are consequently exposed to this volatility.The bottom line, if you consider all four of these risks, is that some countries are riskier than others, and it behooves us to factor this risk in, when investing in these countries, either directly as a business or indirectly as an investor in that business.
Measures If you accept the proposition that some countries are riskier than others, the next step is measuring this country risk and there are three ways you can approach the task:a. Country Risk Scores: There are services that measure country risk with scores, trying to capture exposure to all of the risks listed above. The scores are subjective judgments and are not quite comparable across services, because each service scales risk differently. The World Bank provides an array of governance indicators (from corruption to political stability) for 214 countries (https://databank.worldbank.org/source/worldwide-governance-indicators#) , whereas Political Risk Services (PRS) measures a composite risk score for each country, with low (high) scores corresponding to high (low) country risk. b. Default Risk: The most widely accessible measure of country risk markets in financial markets is country default risk, measured with a sovereign rating by Moody’s, S&P and other ratings agencies for about 140 countries and a market-based measure (Sovereign CDS) for about 72 countries. The picture below provides sovereign ratings and sovereign CDS spreads across the globe at the start of 2020:
 Download spreadsheetc. Equity Risk: While there are some who use the country default spreads as proxies for additional equity risk in countries, I scale up the default spread for the higher risk in equities, using the ratio of volatility in an emerging market equity index to an emerging market bond index to estimate the added risk premium for countries:
Note that the base premium for a mature equity market at the start of 2020 is set to the implied equity risk premium of 5.20% that we estimated for the S&P 500 at the start of 2020. The picture below shows equity risk premiums, by country, at the start of 2020:
 Download spreadsheetLooking back at these equity risk premiums for countries going back to 1992, and comparing the country ERP at the start of 2020 to my estimates at the start of 2019, you see a significant drop off, reflecting a decline in sovereign default spreads of about 20-25% across default classes in 2019 and a drop in the equity risk, relative to bonds.
Company Risk Exposure to Country Risk The conventional practice in valuation, which seems to be ascribe to all countries incorporated and listed in a country, the country risk premium for that country, is both sloppy and wrong. A company’s risk comes from where and how it operates its businesses, not where it is incorporated and traded. A German company that manufactures its products in Poland and sells them in China is German only in name and is exposed to Polish and Chinese country risk. One reason that I estimate the equity risk premiums for as many countries as I need them in both valuation and corporate finance, even if every company I analyze is a US company.
Valuing Companies If you accept my proposition that to value a company, you have to incorporate the risk of where it does business into the analysis, the equity risk premium that you use for a company should reflect where it operates. The open question is whether it is better to measure operating risk exposure with where a company generates its revenues, where its production is located or a mix of the two. For companies like Coca Cola, where the production costs are a fraction of revenues and moveable, I think it makes sense to use revenues. Using the company’s 2018-19 revenue breakdown, for instance, the equity risk premium for the country is:

For companies where production costs are higher and facilities are less moveable, your weights for countries should at least partially based on production. At the limit, with natural resource companies, the operating exposure should be based upon where it produces those resources. Thus, Aramco’s equity risk premium should be entirely based on Saudi Arabia’s, since it extracts all its oil there, but Royal Dutch’s will reflect its more diverse production base:

Put simply, the exposure to country risk does not come from where a company is incorporated or where it is traded, but from its operations.
Analyzing Projects/Investments If equity risk premiums are a critical ingredient for valuation, they are just as important in corporate finance, determining what hurdle rates multinationals should use, when considering projects in foreign markets. With L’Oreal, for instance, a project for expansion in Brazil should carry the equity risk premium for Brazil, whereas a project in India should carry the Indian equity risk premium. The notion of a corporate cost of capital that you use on every project is both absurd and dangerous, and becomes even more so when you are in multiple businesses.
The Currency EffectWhen the discussion turns to country risk, it almost always veers off into currency risk, with many conflating the two, in their discussions. While there are conditions where the two are correlated and draw from the same fundamentals, it is good to keep the two risks separate, since how you deal with them can also be very different.
Decoding Currencies: Interest Rates and Exchange Rates When analyzing currencies, it is very easy to get distracted by experts with macro views, providing their forecasts with absolute certainty, and distractions galore, from governments keeping their currencies stronger or weaker and speculative trading. To get past this noise, I will draw on the intrinsic interest rate equation that I used in my last post to explain why interest rates in the United States have stayed low for the last decade, Intrinsic Riskfree Rate = Inflation + Real GDP GrowthThat identity can be used to both explain why interest rates vary across currencies as well as variation in exchange rates over time.
Risk free RatesIf you accept the proposition that the interest rate in a currency is the sum of the expected inflation in that currency and a real interest that stands in for real growth, it follows that risk free rates will vary across currencies. Getting those currency-specific risk rates can range from trivial (looking up a government bond rate) to difficult (where the government bond rate provides a starting point, but needs cleaning up) to complex (where you have to construct a risk free rate out of what seems like thin air).
1. Government Bond RatesThere are a few dozen governments that issue ten-year bonds in their local currencies, and the search for risk free rates starts there. To the extent that these government bonds are liquid and you perceive no default risk in the government, you can use the government bond rate as your risk free rate. It is that rationale that we use to justify using the Swiss Government’s Swiss Franc 10-year rate as the risk free rate in Swiss Francs and the Norwegian government’s ten-year Krone rate as the riskfree rate in Krone. It is still the rationale, though you are likely to start to get some pushback, in using the US treasury bond rate as the risk free rate in dollars and the German 10-year Euro as the risk free rate in Euros. The pushback will come from some who argue that the US treasury can choose to default and that the German government does not really control the printing of the Euro and could default as well. While I can defend the practice of using the government bond rate as the risk free rate in these scenarios, arguing that you can use the Nigerian government’s Naira bond rate or the Brazilian government’s Reai bond rate as risk free is much more difficult to do. In fact, these are government’s where ratings agencies perceive significant risk even in the local currency bonds and attach ratings that reflect that risk. Moody’s rates Brazil’s local currency bonds at Ba2 and India’s local currency bonds at Baa2. In my pursuit of a risk free rate in currencies like these (where there is no Aaa-rated entity issung a bond), I compute a risk free rate by netting out the default spread:Riskfree Rate in currency = Government bond rate – Default Spread for sovereign local-currency ratingUsing this approach on the Indian rupee and the Brazilian reai,Riskfree Rate in Rupees on January 1, 2020 = Indian Government Rupee Bond rate on January 1, 2020 – Default spread based on Baa2 rating = 6.56% - 1.59% = 4.95%Riskfree Rate in Brazilian $R = Brazilian Government $R Bond rate on January 1, 2020 – Default spread based on Ba2 rating = 6.77% - 2.51% = 4.26%Extending this approach to all countries where a local currency government bond is available, we get the following risk free rates:
 Download spreadsheetNote that these estimates are only as good as the three data inputs that go into them. First, the government bond rates reported have to reflect a traded and liquid bond, clearly not an issue with the US treasury or German Euro bond, but a stretch for the Zambian kwacha bond. Second, the local currency rating is a good measure of the default risk, a challenge when ratings agencies are biased or late in adjusting. Third, the default spread, given the ratings class, is estimated without bias and reflects the market at the time of the assessment.
 2. Synthetic Risk free RatesIf you have doubts about one or more of three assumptions needed to use the government-bond approach to getting to risk free rates, don’t fear, because there is an alternative that I will call my synthetic risk free rate. To use this approach, let’s start with a currency in which you feel comfortable estimating a risk free rate, say the US dollar. If the key driver of risk free rates is expected inflation, the risk free rate in any other currency can be estimated using the differential inflation between that currency and the US dollar. In the short cut, you add the differential inflation to the US T.Bond rate to get a risk free rate:
Local Currency Risk free rate = US T.Bond Rate + (Inflation rate in local currency - Inflation rate in US dollars)
In the full calculation, you incorporate the compounding effects of the differential inflation
 This approach can be used in almost any setting to estimate a local currency risk free rate, including the following:Currencies with no government bonds outstanding: There are more than 120 currencies, where there are no government bonds in the local currency; the country borrows from banks and the IMF, not from markets. Without a government bond rate, the approach described above becomes moot.Currencies where the government bond rate is not trustworthy: There are currencies where there is a government bond, with a rate, but an absence of liquidity and/or the presence of institutions being forced to buy the bond by the government that may make the rates untrustworthy. I don't mean to cast aspersions, but I seriously doubt that the Zambian Kwacha bond, whose rate I specified in the last section, has a deep or wide market.Pegged Currencies: There are some currencies that have been pegged to the US dollar, either for convenience (much of the Middle East) or stability (Ecuador). While analysts in these markets often use the US T.Bond rate as the risk free rate, there is a very real danger that what is pegged today may be unpegged in the future, especially when the fundamentals don't support the peg. Specifically, if the local inflation rate is much higher than the inflation rate in the US, it may be more prudent to use the synthetic risk free rate instead of the US T.Bond rate as the risk free rate.The key inputs here are the expected inflation rate in the US dollar and the expected inflation rate in the local currency. The former can be obtained from market data, using the difference between the US T.Bond rate and the TIPs rate, but the latter is more difficult. While you can always use last year’s inflation rate, but that number is not only backward looking but subject to manipulation. I prefer the forecasts of inflation that you can get from the IMF, and I have used those to get expected risk free rates in other currencies, using the US T.Bond rate as my base risk free rate, and you can find them at this link.
Currency Choice Having belabored the reasons for why riskfree rates vary across currencies, let’s talk about how to pick a currency to use in valuing a company. The key word is choice, since you can value any company in any currency, though it may be easiest to get financial information on the company, in a local currency. An Indian company can be valued in US dollars, Indian Rupees or Euros, or even in real terms, and if you are consistent about dealing with inflation in your valuation, the value should be the same in every currency. At first sight, that may sound odd, since the risk free rate in US dollars is much lower than the risk free rate in Indian rupees, but the answer lies in looking at all of the inputs into value, not just the discount rate. In fact, inflation affects all of your numbers:

With high inflation currencies, the damage wrought by the higher discount rates that they bring into the process are offset by the higher nominal growth you will have in your cash flows, and the effects will cancel out. With low inflation currencies, any benefits you get from the lower discount rates that come with them will be given back when you use the lower nominal growth rates that go with them. In practice, there is perhaps no other aspect of valuation where you are more likely to be see consistency errors than with currencies, and here are some scenarios:Casual Dollarization: In casual dollarization, you start by estimating your costs of equity and capital in US dollars, partly because you do not want to or cannot estimate risk free rates in a local currency. You then convert your expected future cash flows in the local currency and convert them to dollars using the current exchange rate. That represents a fatal step, since the inflation differentials that cause risk free rates to be different will also cause exchange rates to change over time. Purchasing power parity may be a crude approximation of reality, but it is a reality that will eventually hold, and ignoring can lead to valuation errors that are huge.Corporate hurdle rates: I have long argued against computing a corporate cost of capital and using it as a hurdle rate on investments and acquisitions, and that argument gets even stronger, when the investments or acquisitions are cross-border and in different currencies. If a European company takes its Euro cost of capital and uses it to value Hungarian, Polish or Russian companies, not correcting for either country risk or currency differentials, it will find a lot of “bargains”.Mismatched Currency Frames of Reference: We all have frames of reference that are built into our thinking, based upon where we live and the currencies we deal with. Having lived in the US for 40 years and dealt with more US companies than companies in any other market, I tend to think in US dollar terms, when I think of reasonable, high or low growth rates. While that is understandable, I have to remember that when conversing with an Indian analyst in Mumbai, whose day-to-day dealings in rupees, the growth rates that he or she provides me for a company will be in rupees. Consequently, it behooves both of us to be explicit about currencies (my expected growth rate for Infosys, in US dollars, is 4.5% or my cost of capital, in Indian rupees, is 10%) when making statements, even though it is cumbersome.One of the side costs of globalization is that you can no longer assume, especially if you are a US investor or analysts, that the conversations that you will be having will always be on your currency terms (presumably dollars). Understanding how currencies are measurement tools, not instruments of risk or asset classes, will make that transition easier.
ConclusionIn this post, I looked at two variables, country and currency, that are often conflated in valuation, perhaps because risky countries tend to have volatile currencies, and separated the discussion to examine the determinants of each, and why they should not be lumped together. I can invest in a company in a risky country, and I can choose to do the valuation in US dollars, but only if I recognize that the currency choice cannot make the country risk go away. In other words, a Russian or Brazilian company will stay risky, even if you value it in US dollars, and a company that gets all of its revenues in Northern Europe will stay safe, even if you value it in Russian Rubles.<!-- /* Style Definitions */ p.MsoNormal, li.MsoNormal, div.MsoNormal {mso-style-unhide:no; mso-style-qformat:yes; mso-style-parent:""; margin:0in; margin-bottom:.0001pt; mso-pagination:widow-orphan; font-size:12.0pt; font-family:"Calibri",sans-serif; mso-ascii-font-family:Calibri; mso-ascii-theme-font:minor-latin; mso-fareast-font-family:Calibri; mso-fareast-theme-font:minor-latin; mso-hansi-font-family:Calibri; mso-hansi-theme-font:minor-latin; mso-bidi-font-family:"Times New Roman"; mso-bidi-theme-font:minor-bidi;} a:link, span.MsoHyperlink {mso-style-priority:99; color:#0563C1; mso-themecolor:hyperlink; text-decoration:underline; text-underline:single;} a:visited, span.MsoHyperlinkFollowed {mso-style-noshow:yes; mso-style-priority:99; color:#954F72; mso-themecolor:followedhyperlink; text-decoration:underline; text-underline:single;} p.MsoListParagraph, li.MsoListParagraph, div.MsoListParagraph {mso-style-priority:34; mso-style-unhide:no; mso-style-qformat:yes; margin-top:0in; margin-right:0in; margin-bottom:0in; margin-left:.5in; margin-bottom:.0001pt; mso-add-space:auto; mso-pagination:widow-orphan; font-size:12.0pt; font-family:"Calibri",sans-serif; mso-ascii-font-family:Calibri; mso-ascii-theme-font:minor-latin; mso-fareast-font-family:Calibri; mso-fareast-theme-font:minor-latin; mso-hansi-font-family:Calibri; mso-hansi-theme-font:minor-latin; mso-bidi-font-family:"Times New Roman"; mso-bidi-theme-font:minor-bidi;} p.MsoListParagraphCxSpFirst, li.MsoListParagraphCxSpFirst, div.MsoListParagraphCxSpFirst {mso-style-priority:34; mso-style-unhide:no; mso-style-qformat:yes; mso-style-type:export-only; margin-top:0in; margin-right:0in; margin-bottom:0in; margin-left:.5in; margin-bottom:.0001pt; mso-add-space:auto; mso-pagination:widow-orphan; font-size:12.0pt; font-family:"Calibri",sans-serif; mso-ascii-font-family:Calibri; mso-ascii-theme-font:minor-latin; mso-fareast-font-family:Calibri; mso-fareast-theme-font:minor-latin; mso-hansi-font-family:Calibri; mso-hansi-theme-font:minor-latin; mso-bidi-font-family:"Times New Roman"; mso-bidi-theme-font:minor-bidi;} p.MsoListParagraphCxSpMiddle, li.MsoListParagraphCxSpMiddle, div.MsoListParagraphCxSpMiddle {mso-style-priority:34; mso-style-unhide:no; mso-style-qformat:yes; mso-style-type:export-only; margin-top:0in; margin-right:0in; margin-bottom:0in; margin-left:.5in; margin-bottom:.0001pt; mso-add-space:auto; mso-pagination:widow-orphan; font-size:12.0pt; font-family:"Calibri",sans-serif; mso-ascii-font-family:Calibri; mso-ascii-theme-font:minor-latin; mso-fareast-font-family:Calibri; mso-fareast-theme-font:minor-latin; mso-hansi-font-family:Calibri; mso-hansi-theme-font:minor-latin; mso-bidi-font-family:"Times New Roman"; mso-bidi-theme-font:minor-bidi;} p.MsoListParagraphCxSpLast, li.MsoListParagraphCxSpLast, div.MsoListParagraphCxSpLast {mso-style-priority:34; mso-style-unhide:no; mso-style-qformat:yes; mso-style-type:export-only; margin-top:0in; margin-right:0in; margin-bottom:0in; margin-left:.5in; margin-bottom:.0001pt; mso-add-space:auto; mso-pagination:widow-orphan; font-size:12.0pt; font-family:"Calibri",sans-serif; mso-ascii-font-family:Calibri; mso-ascii-theme-font:minor-latin; mso-fareast-font-family:Calibri; mso-fareast-theme-font:minor-latin; mso-hansi-font-family:Calibri; mso-hansi-theme-font:minor-latin; mso-bidi-font-family:"Times New Roman"; mso-bidi-theme-font:minor-bidi;} .MsoChpDefault {mso-style-type:export-only; mso-default-props:yes; font-family:"Calibri",sans-serif; mso-ascii-font-family:Calibri; mso-ascii-theme-font:minor-latin; mso-fareast-font-family:Calibri; mso-fareast-theme-font:minor-latin; mso-hansi-font-family:Calibri; mso-hansi-theme-font:minor-latin; mso-bidi-font-family:"Times New Roman"; mso-bidi-theme-font:minor-bidi;} @page WordSection1 {size:8.5in 11.0in; margin:1.0in 1.0in 1.0in 1.0in; mso-header-margin:.5in; mso-footer-margin:.5in; mso-paper-source:0;} div.WordSection1 {page:WordSection1;} /* List Definitions */ @list l0 {mso-list-id:225725268; mso-list-type:hybrid; mso-list-template-ids:-1664981610 67698713 67698713 67698715 67698703 67698713 67698715 67698703 67698713 67698715;} @list l0:level1 {mso-level-number-format:alpha-lower; mso-level-tab-stop:none; mso-level-number-position:left; text-indent:-.25in;} @list l0:level2 {mso-level-number-format:alpha-lower; mso-level-tab-stop:none; mso-level-number-position:left; text-indent:-.25in;} @list l0:level3 {mso-level-number-format:roman-lower; mso-level-tab-stop:none; mso-level-number-position:right; text-indent:-9.0pt;} @list l0:level4 {mso-level-tab-stop:none; mso-level-number-position:left; text-indent:-.25in;} @list l0:level5 {mso-level-number-format:alpha-lower; mso-level-tab-stop:none; mso-level-number-position:left; text-indent:-.25in;} @list l0:level6 {mso-level-number-format:roman-lower; mso-level-tab-stop:none; mso-level-number-position:right; text-indent:-9.0pt;} @list l0:level7 {mso-level-tab-stop:none; mso-level-number-position:left; text-indent:-.25in;} @list l0:level8 {mso-level-number-format:alpha-lower; mso-level-tab-stop:none; mso-level-number-position:left; text-indent:-.25in;} @list l0:level9 {mso-level-number-format:roman-lower; mso-level-tab-stop:none; mso-level-number-position:right; text-indent:-9.0pt;} @list l1 {mso-list-id:704251167; mso-list-type:hybrid; mso-list-template-ids:-436047092 67698713 67698713 67698715 67698703 67698713 67698715 67698703 67698713 67698715;} @list l1:level1 {mso-level-number-format:alpha-lower; mso-level-tab-stop:none; mso-level-number-position:left; text-indent:-.25in;} @list l1:level2 {mso-level-number-format:alpha-lower; mso-level-tab-stop:none; mso-level-number-position:left; text-indent:-.25in;} @list l1:level3 {mso-level-number-format:roman-lower; mso-level-tab-stop:none; mso-level-number-position:right; text-indent:-9.0pt;} @list l1:level4 {mso-level-tab-stop:none; mso-level-number-position:left; text-indent:-.25in;} @list l1:level5 {mso-level-number-format:alpha-lower; mso-level-tab-stop:none; mso-level-number-position:left; text-indent:-.25in;} @list l1:level6 {mso-level-number-format:roman-lower; mso-level-tab-stop:none; mso-level-number-position:right; text-indent:-9.0pt;} @list l1:level7 {mso-level-tab-stop:none; mso-level-number-position:left; text-indent:-.25in;} @list l1:level8 {mso-level-number-format:alpha-lower; mso-level-tab-stop:none; mso-level-number-position:left; text-indent:-.25in;} @list l1:level9 {mso-level-number-format:roman-lower; mso-level-tab-stop:none; mso-level-number-position:right; text-indent:-9.0pt;} @list l2 {mso-list-id:1572615270; mso-list-type:hybrid; mso-list-template-ids:-918238414 67698713 67698713 67698715 67698703 67698713 67698715 67698703 67698713 67698715;} @list l2:level1 {mso-level-number-format:alpha-lower; mso-level-tab-stop:none; mso-level-number-position:left; text-indent:-.25in;} @list l2:level2 {mso-level-number-format:alpha-lower; mso-level-tab-stop:none; mso-level-number-position:left; text-indent:-.25in;} @list l2:level3 {mso-level-number-format:roman-lower; mso-level-tab-stop:none; mso-level-number-position:right; text-indent:-9.0pt;} @list l2:level4 {mso-level-tab-stop:none; mso-level-number-position:left; text-indent:-.25in;} @list l2:level5 {mso-level-number-format:alpha-lower; mso-level-tab-stop:none; mso-level-number-position:left; text-indent:-.25in;} @list l2:level6 {mso-level-number-format:roman-lower; mso-level-tab-stop:none; mso-level-number-position:right; text-indent:-9.0pt;} @list l2:level7 {mso-level-tab-stop:none; mso-level-number-position:left; text-indent:-.25in;} @list l2:level8 {mso-level-number-format:alpha-lower; mso-level-tab-stop:none; mso-level-number-position:left; text-indent:-.25in;} @list l2:level9 {mso-level-number-format:roman-lower; mso-level-tab-stop:none; mso-level-number-position:right; text-indent:-9.0pt;} @list l3 {mso-list-id:1668626712; mso-list-type:hybrid; mso-list-template-ids:609640616 67698713 67698713 67698715 67698703 67698713 67698715 67698703 67698713 67698715;} @list l3:level1 {mso-level-number-format:alpha-lower; mso-level-tab-stop:none; mso-level-number-position:left; text-indent:-.25in;} @list l3:level2 {mso-level-number-format:alpha-lower; mso-level-tab-stop:none; mso-level-number-position:left; text-indent:-.25in;} @list l3:level3 {mso-level-number-format:roman-lower; mso-level-tab-stop:none; mso-level-number-position:right; text-indent:-9.0pt;} @list l3:level4 {mso-level-tab-stop:none; mso-level-number-position:left; text-indent:-.25in;} @list l3:level5 {mso-level-number-format:alpha-lower; mso-level-tab-stop:none; mso-level-number-position:left; text-indent:-.25in;} @list l3:level6 {mso-level-number-format:roman-lower; mso-level-tab-stop:none; mso-level-number-position:right; text-indent:-9.0pt;} @list l3:level7 {mso-level-tab-stop:none; mso-level-number-position:left; text-indent:-.25in;} @list l3:level8 {mso-level-number-format:alpha-lower; mso-level-tab-stop:none; mso-level-number-position:left; text-indent:-.25in;} @list l3:level9 {mso-level-number-format:roman-lower; mso-level-tab-stop:none; mso-level-number-position:right; text-indent:-9.0pt;} @list l4 {mso-list-id:1797991945; mso-list-type:hybrid; mso-list-template-ids:-101010710 67698713 67698713 67698715 67698703 67698713 67698715 67698703 67698713 67698715;} @list l4:level1 {mso-level-number-format:alpha-lower; mso-level-tab-stop:none; mso-level-number-position:left; text-indent:-.25in;} @list l4:level2 {mso-level-number-format:alpha-lower; mso-level-tab-stop:none; mso-level-number-position:left; text-indent:-.25in;} @list l4:level3 {mso-level-number-format:roman-lower; mso-level-tab-stop:none; mso-level-number-position:right; text-indent:-9.0pt;} @list l4:level4 {mso-level-tab-stop:none; mso-level-number-position:left; text-indent:-.25in;} @list l4:level5 {mso-level-number-format:alpha-lower; mso-level-tab-stop:none; mso-level-number-position:left; text-indent:-.25in;} @list l4:level6 {mso-level-number-format:roman-lower; mso-level-tab-stop:none; mso-level-number-position:right; text-indent:-9.0pt;} @list l4:level7 {mso-level-tab-stop:none; mso-level-number-position:left; text-indent:-.25in;} @list l4:level8 {mso-level-number-format:alpha-lower; mso-level-tab-stop:none; mso-level-number-position:left; text-indent:-.25in;} @list l4:level9 {mso-level-number-format:roman-lower; mso-level-tab-stop:none; mso-level-number-position:right; text-indent:-9.0pt;} </style> <br /><b>YouTube Video</b><br /><iframe allow="accelerometer; autoplay; encrypted-media; gyroscope; picture-in-picture" allowfullscreen="" frameborder="0" height="315" src="https://www.youtube.com/embed/S_bq0D5..." width="560"></iframe><br /><b><br /></b><b>Data Links</b><br /><br /><ol style="text-align: left;"><li><a href="http://www.stern.nyu.edu/~adamodar/pc... and Sovereign CDS spreads, by country (January 2020)</a></li><li><a href="http://www.stern.nyu.edu/~adamodar/pc... Equity Risk Premiums in January 2020</a></li><li><a href="http://www.stern.nyu.edu/~adamodar/pc... Bond Rates and Riskfree Rates by Currency in January 2020</a></li><li><a href="http://www.stern.nyu.edu/~adamodar/pc... Riskfree Rates in 2020 (with inflation rates by currency)</a></li></ol><br /><b>Data Update Posts</b><br /><ol style="text-align: justify;"><li><a href="https://aswathdamodaran.blogspot.com/... Update 1 for 2020: Setting the Table</a></li><li><a href="https://aswathdamodaran.blogspot.com/... Update 2 for 2020: Retrospective on a Disruptive Decade</a></li><li><a href="https://aswathdamodaran.blogspot.com/... Update 3 for 2020: The Price of Risk!</a></li><li>Data Update 4 for 2020: Country and Currency Effects</li></ol><br /><div class="MsoNormal" style="font-size: medium; text-align: justify;"><br /></div></div>
February 10, 2020
Data Update 3 for 2020: The Price of Risk!
When investing, risk is a given and if you choose to avoid it, at any cost, you will and in the last decade, you have borne a staggering cost in terms of returns unearned. At the other extreme, seeking out risk for the sake of taking risk is more suited to casinos than to financial markets, and as in casinos, the end game is almost always disastrous. The middle ground on risk is to accept that it is part and parcel of investing, to try to gauge how exposed you are to it and to make sure that your expected return is high enough to compensate you for taking that risk. Put simply, you are charging a price to take risk, and that price will reflect not only your history and experiences as an investor, but how risk averse you are, as an individual. In this post, rather than focus on your or my price of risk. I want to talk about the market price of risk, as assessed by all investors, and how that price changed in 2019.
The Price of Risk
There are almost as many definitions of risk, as there are investors, but I find many of them wanting. There is, of course, the definition of risk as uncertainty, a circular play on words, since it just replaces one nebulous word (risk) with another. There is the definition of risk as encompassing all the bad outcomes you can have on an investment, which by making risk into a negative and something to be avoided, leads you right into the arms of those selling your protection against it (in the form of hedging). In finance, we have become so used to measuring risk in statistical terms (standard deviation, variance, covariance etc.) that we have taken to defining risk with these measures, an arid and antiseptic view of risk. The truth is that risk, at least in business, is neither a good nor a bad, but a given. It is a combination of danger (the likelihood that bad things will happen to you) and opportunity (often emerging from exposing yourself to danger, and I think that the Chinese symbol for crisis captures its essence perfectly: (I know! I know! I have been corrected and recorrected on both the symbols and the definition by people who know far more Chinese than I do, which is pretty much everyone in the world… So, please cut me some slack!) It is this definition of risk that allows us to frame the risk/return trade off that lies at the heart of investing. While you can choose a pathway of taking no risk and earning guaranteed returns, those returns in today’s markets would be close to zero in the United States and Europe. If you want to earn higher returns, you have no choice but to expose yourself to risk, and when you do, the key question becomes whether you are being compensated sufficiently for taking that risk. When you invest in fixed income securities (bonds), your compensation takes the form of a default spread, i.e., what you charge over and above the risk free rate to invest in that bond.· When you invest in equities, the payoff to taking risk comes in the form of an equity risk premium, i.e., the premium you demand over and above the risk free rate for investing in equities as an asset class.Both the default spread and the equity risk premium are market-set numbers and are driven by demand and supply. The default spread is a function of what investors believe is the likelihood that borrowers will fail to make their contractually obligated payments, and it will rise and fall with the economy. The equity risk premium is a more complex number and I think of it as the receptacle for everything from changes in investor risk aversion to perceptions of economic growth and stability to corporate choices on leverage and cash return to global flash points (war, health scares etc.).
The Default SpreadThe default spread is the premium that investors demand on a bond to compensate for default risk, and not surprisingly, it varies across bond issuers, with safer (riskier) borrowers being charged less (more) to borrow money. One assessment of corporate default risk is a bond rating, a measure of default risk computed by ratings agencies. While ratings agencies have been criticized for bias and delay, these bond ratings are still widely used, and are a convenient proxy not only for measuring default risk, but also for estimating default spreads. In the graph below, I have listed the default spreads at the start of 2020 and compared them to default spreads that I had estimated at the start of 2019, by ratings class: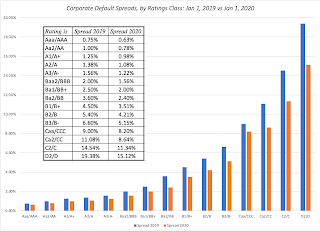 Source: Damodaran OnlineThe first conclusion, and a completely unsurprising one, is that companies that are lower rated (and thus perceived to have more default risk) have larger default spreads than companies that are highly rated; a BBB (Baa) rated bond, at the cusp of investment grade and junk bonds, for instance, saw its default spread drop from 2.00% at the start of 2019 to 1.56% at the start of 2020. To get some longer-term perspective on how much default spreads change over time, the default spread on the investment grade (BBB, Baa) rated bond is graphed below from 1980 to 2019:
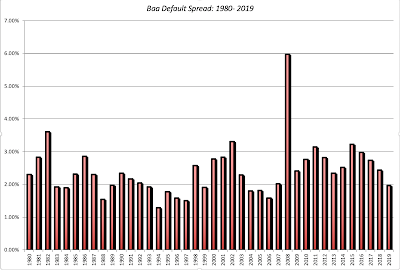 Source: FRED (Federal Reserve St. Louis)At the risk of stating the obvious, the default spreads on bonds change over time, decreasing when times are good and investors are sanguine, and increasing during economic downturns and market crises.
The US Equity Risk PremiumIn my last data update post, where I looked at markets over the last decade, I also posted a table that reported historical equity risk premiums, i.e., the premiums earned by stocks over treasury bills and bonds over long periods, ranging from a decade to 92 years.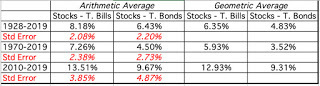 Source: Damodaran OnlineThere are many practitioners, who use these historical equity risk premiums as the best estimates for what you will earn in the future, using mean reversion as their basic argument. I have already made clear my problems with using a backward-looking number with a large estimation error (see the standard errors in the table above) as an expectation for the future, but it cuts against the very essence of an equity risk premium as a number that should be dynamic and constantly changing, as new information comes into markets. For almost three decades, I have computed an implied equity risk premium, a forward-looking value computed by looking at what investors are paying for stocks today, and the expected cash flows on those stocks. Specifically, I take an approach that is used with bonds to compute a yield to maturity to stocks, computing an IRR for stocks and then subtracting out the risk free rate. At the start of 2020, the implied equity risk premium for the S&P 500 was 5.20% and the calculations are in the graph below:
 Download spreadsheet
Since I have been computing this number at the start of each month, since September 2008, I can look at how this number moved in the twelve months of 2019: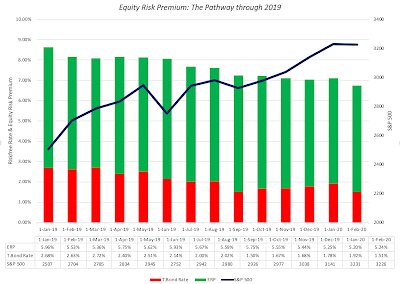 Damodaran OnlineDuring the course of the year, the implied equity risk premium has increased from 5.96% to 5.20%, driven down by increasing stock prices and lower interest rates.
I am fascinated by the implied equity risk premium because it captures the market’s current standing in one number and frames debates about the overall market. A contention that markets are overvalued, or in a bubble, is equivalent to claiming that the equity risk premium is too low, relative to what you believe is a reasonable value. In contrast, a bullish assessment of the entire equity market can be viewed as a statement about equity risk premiums being too high, again relative to reasonable values. But what is a reasonable value? I have no idea, since I am not a market timer, but to help you make your own assessment, I have reproduced the implied equity risk premium for the S&P 500 going back to 1960: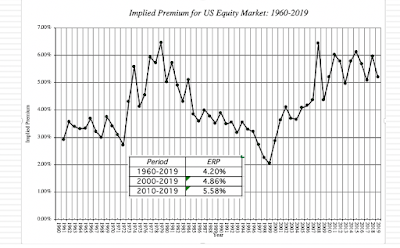 Download spreadsheetYou could use the computed averages embedded in the graph as your basis for reasonable, and using that comparison, the market looks closer to under than overpriced, since the ERP on January 1, 2020 was 5.20%, higher than the average for the last 60 years (4.20%) or the last 20 years (4.86%). Even with a 10-year average, the market is only very mildly overpriced. It is true that the current implied ERP of 5.20% is being earned on a riskfree rate of 1.92%, low by historical standards, yielding an expected return of 7.12% and that may be too low for some. I will let you make your own assessment, but this is a healthier one that just looking at PE ratios (Shiller, trailing, forward) or other market metrics.
A Real Estate Risk Premium?If default spreads measure the price of risk in bond markets and equity risk premiums measure the risk for investing in stocks, what is the price of risk of investing in other asset classes? It may be more difficult to assess what this value is in other risky markets, but it exists without a doubt, and one way of evaluating how much of your portfolio to allocate to these asset classes is to compare their risk premiums to the risk premiums of bonds and stocks. To get a sense of how this would play out, consider the real estate market, perhaps the biggest asset class outside of stocks and bonds. Investors in commercial real estate attach prices to properties, based upon their expectations of income from the properties and capitalization rates. Thus, a property with expected income of $10 million and a capitalization rate of 8% will be valued at $125 million = $10/.08. Since the capitalization rate is effectively a measure of expected return on real estate, subtracting out the risk free rate should yield a measure of the risk premium in real estate. Risk Premium for Real Estate = Cap Rate – Risk free rateIn the graph below, I have estimated the real estate risk premium and provided a comparison to the equity risk premium and default spread, over time: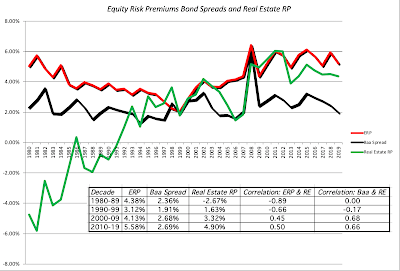
Note that the real estate risk premium in the 1980s was not only well below the equity risk premium and the default spread, it was sometimes negative. While that may strike you as odd, it makes sense if you think of real estate as an asset class that is not only uncorrelated with financial asset returns but also provides insurance against inflation. As real estate was securitized in the 1990s and fears of inflation receded, the real estate risk premium has started behaving like the risk premiums in stock and bond markets, and the rising correlation between them reflects that co-movement. Put simply, we live in a world, where the real estate you own (often your house or apartment) will tend to move with, rather than against, your financial assets, and in the next market crisis, as the stocks and bonds that you own plummet in value, you should expect the value of your house to drop as well!
ConclusionThe debate about equity risk premiums is not an abstract one, since which side of the debate you come down upon (whether risk premiums today are too high or low) is going to drive your asset allocation judgments. If you are a bear, you believe that equity risk premiums should be higher, either for fundamental reasons or by instinct, and you should put less of your wealth into stocks than you normally would, given your age, liquidity needs and risk aversion. The challenge that you will face is in deciding where you will invest your money until you think that the ERP becomes more reasonable, since bonds are likely to also be overpriced (according to your view of the world) and real assets will often be no better. If you are a market bull, your story has to be one of equity risk premiums declining in the future, perhaps because you believe in your own version of mean reversion or because of continued economic growth. For both market bulls and bears, the perils with then bringing these views into every valuation that you do is that every company you value will then jointly both your views about the company and the overall market. It is for this reason that I think it makes sense to revert back to a market neutral view, when valuing individual companies, even if you have strong market views. Since my market timing skills are non-existent, I prefer to stay market neutral, and stick to valuing companies using the prevailing equity risk premiums.
YouTube Video
SpreadsheetsImplied Equity Risk Premium on January 1, 2020DatasetsHistorical Equity Risk Premiums for the US - 1960 to 2019Historical Default Spreads on Baa Rated Bond - 1980 to 2019Default Spreads on Bond Ratings Classes (my estimates) in January 2020Data Update PostsData Update 1 for 2020: Setting the TableData Update 2 for 2020: Retrospective on a Disruptive DecadeData Update 3 for 2020: The Price of Risk!
<!-- /* Style Definitions */ p.MsoNormal, li.MsoNormal, div.MsoNormal {mso-style-unhide:no; mso-style-qformat:yes; mso-style-parent:""; margin:0in; margin-bottom:.0001pt; mso-pagination:widow-orphan; font-size:12.0pt; font-family:"Calibri",sans-serif; mso-ascii-font-family:Calibri; mso-ascii-theme-font:minor-latin; mso-fareast-font-family:Calibri; mso-fareast-theme-font:minor-latin; mso-hansi-font-family:Calibri; mso-hansi-theme-font:minor-latin; mso-bidi-font-family:"Times New Roman"; mso-bidi-theme-font:minor-bidi;} p.MsoListParagraph, li.MsoListParagraph, div.MsoListParagraph {mso-style-priority:34; mso-style-unhide:no; mso-style-qformat:yes; margin-top:0in; margin-right:0in; margin-bottom:0in; margin-left:.5in; margin-bottom:.0001pt; mso-add-space:auto; mso-pagination:widow-orphan; font-size:12.0pt; font-family:"Calibri",sans-serif; mso-ascii-font-family:Calibri; mso-ascii-theme-font:minor-latin; mso-fareast-font-family:Calibri; mso-fareast-theme-font:minor-latin; mso-hansi-font-family:Calibri; mso-hansi-theme-font:minor-latin; mso-bidi-font-family:"Times New Roman"; mso-bidi-theme-font:minor-bidi;} p.MsoListParagraphCxSpFirst, li.MsoListParagraphCxSpFirst, div.MsoListParagraphCxSpFirst {mso-style-priority:34; mso-style-unhide:no; mso-style-qformat:yes; mso-style-type:export-only; margin-top:0in; margin-right:0in; margin-bottom:0in; margin-left:.5in; margin-bottom:.0001pt; mso-add-space:auto; mso-pagination:widow-orphan; font-size:12.0pt; font-family:"Calibri",sans-serif; mso-ascii-font-family:Calibri; mso-ascii-theme-font:minor-latin; mso-fareast-font-family:Calibri; mso-fareast-theme-font:minor-latin; mso-hansi-font-family:Calibri; mso-hansi-theme-font:minor-latin; mso-bidi-font-family:"Times New Roman"; mso-bidi-theme-font:minor-bidi;} p.MsoListParagraphCxSpMiddle, li.MsoListParagraphCxSpMiddle, div.MsoListParagraphCxSpMiddle {mso-style-priority:34; mso-style-unhide:no; mso-style-qformat:yes; mso-style-type:export-only; margin-top:0in; margin-right:0in; margin-bottom:0in; margin-left:.5in; margin-bottom:.0001pt; mso-add-space:auto; mso-pagination:widow-orphan; font-size:12.0pt; font-family:"Calibri",sans-serif; mso-ascii-font-family:Calibri; mso-ascii-theme-font:minor-latin; mso-fareast-font-family:Calibri; mso-fareast-theme-font:minor-latin; mso-hansi-font-family:Calibri; mso-hansi-theme-font:minor-latin; mso-bidi-font-family:"Times New Roman"; mso-bidi-theme-font:minor-bidi;} p.MsoListParagraphCxSpLast, li.MsoListParagraphCxSpLast, div.MsoListParagraphCxSpLast {mso-style-priority:34; mso-style-unhide:no; mso-style-qformat:yes; mso-style-type:export-only; margin-top:0in; margin-right:0in; margin-bottom:0in; margin-left:.5in; margin-bottom:.0001pt; mso-add-space:auto; mso-pagination:widow-orphan; font-size:12.0pt; font-family:"Calibri",sans-serif; mso-ascii-font-family:Calibri; mso-ascii-theme-font:minor-latin; mso-fareast-font-family:Calibri; mso-fareast-theme-font:minor-latin; mso-hansi-font-family:Calibri; mso-hansi-theme-font:minor-latin; mso-bidi-font-family:"Times New Roman"; mso-bidi-theme-font:minor-bidi;} .MsoChpDefault {mso-style-type:export-only; mso-default-props:yes; font-family:"Calibri",sans-serif; mso-ascii-font-family:Calibri; mso-ascii-theme-font:minor-latin; mso-fareast-font-family:Calibri; mso-fareast-theme-font:minor-latin; mso-hansi-font-family:Calibri; mso-hansi-theme-font:minor-latin; mso-bidi-font-family:"Times New Roman"; mso-bidi-theme-font:minor-bidi;} @page WordSection1 {size:8.5in 11.0in; margin:1.0in 1.0in 1.0in 1.0in; mso-header-margin:.5in; mso-footer-margin:.5in; mso-paper-source:0;} div.WordSection1 {page:WordSection1;} /* List Definitions */ @list l0 {mso-list-id:1673332347; mso-list-type:hybrid; mso-list-template-ids:-1134628678 67698689 67698691 67698693 67698689 67698691 67698693 67698689 67698691 67698693;} @list l0:level1 {mso-level-number-format:bullet; mso-level-text:; mso-level-tab-stop:none; mso-level-number-position:left; text-indent:-.25in; font-family:Symbol;} @list l0:level2 {mso-level-number-format:bullet; mso-level-text:o; mso-level-tab-stop:none; mso-level-number-position:left; text-indent:-.25in; font-family:"Courier New";} @list l0:level3 {mso-level-number-format:bullet; mso-level-text:; mso-level-tab-stop:none; mso-level-number-position:left; text-indent:-.25in; font-family:Wingdings;} @list l0:level4 {mso-level-number-format:bullet; mso-level-text:; mso-level-tab-stop:none; mso-level-number-position:left; text-indent:-.25in; font-family:Symbol;} @list l0:level5 {mso-level-number-format:bullet; mso-level-text:o; mso-level-tab-stop:none; mso-level-number-position:left; text-indent:-.25in; font-family:"Courier New";} @list l0:level6 {mso-level-number-format:bullet; mso-level-text:; mso-level-tab-stop:none; mso-level-number-position:left; text-indent:-.25in; font-family:Wingdings;} @list l0:level7 {mso-level-number-format:bullet; mso-level-text:; mso-level-tab-stop:none; mso-level-number-position:left; text-indent:-.25in; font-family:Symbol;} @list l0:level8 {mso-level-number-format:bullet; mso-level-text:o; mso-level-tab-stop:none; mso-level-number-position:left; text-indent:-.25in; font-family:"Courier New";} @list l0:level9 {mso-level-number-format:bullet; mso-level-text:; mso-level-tab-stop:none; mso-level-number-position:left; text-indent:-.25in; font-family:Wingdings;} </style></div>--><style class="WebKit-mso-list-quirks-style"><!-- /* Style Definitions */ p.MsoNormal, li.MsoNormal, div.MsoNormal {mso-style-unhide:no; mso-style-qformat:yes; mso-style-parent:""; margin:0in; margin-bottom:.0001pt; mso-pagination:widow-orphan; font-size:12.0pt; font-family:"Calibri",sans-serif; mso-ascii-font-family:Calibri; mso-ascii-theme-font:minor-latin; mso-fareast-font-family:Calibri; mso-fareast-theme-font:minor-latin; mso-hansi-font-family:Calibri; mso-hansi-theme-font:minor-latin; mso-bidi-font-family:"Times New Roman"; mso-bidi-theme-font:minor-bidi;} p.MsoListParagraph, li.MsoListParagraph, div.MsoListParagraph {mso-style-priority:34; mso-style-unhide:no; mso-style-qformat:yes; margin-top:0in; margin-right:0in; margin-bottom:0in; margin-left:.5in; margin-bottom:.0001pt; mso-add-space:auto; mso-pagination:widow-orphan; font-size:12.0pt; font-family:"Calibri",sans-serif; mso-ascii-font-family:Calibri; mso-ascii-theme-font:minor-latin; mso-fareast-font-family:Calibri; mso-fareast-theme-font:minor-latin; mso-hansi-font-family:Calibri; mso-hansi-theme-font:minor-latin; mso-bidi-font-family:"Times New Roman"; mso-bidi-theme-font:minor-bidi;} p.MsoListParagraphCxSpFirst, li.MsoListParagraphCxSpFirst, div.MsoListParagraphCxSpFirst {mso-style-priority:34; mso-style-unhide:no; mso-style-qformat:yes; mso-style-type:export-only; margin-top:0in; margin-right:0in; margin-bottom:0in; margin-left:.5in; margin-bottom:.0001pt; mso-add-space:auto; mso-pagination:widow-orphan; font-size:12.0pt; font-family:"Calibri",sans-serif; mso-ascii-font-family:Calibri; mso-ascii-theme-font:minor-latin; mso-fareast-font-family:Calibri; mso-fareast-theme-font:minor-latin; mso-hansi-font-family:Calibri; mso-hansi-theme-font:minor-latin; mso-bidi-font-family:"Times New Roman"; mso-bidi-theme-font:minor-bidi;} p.MsoListParagraphCxSpMiddle, li.MsoListParagraphCxSpMiddle, div.MsoListParagraphCxSpMiddle {mso-style-priority:34; mso-style-unhide:no; mso-style-qformat:yes; mso-style-type:export-only; margin-top:0in; margin-right:0in; margin-bottom:0in; margin-left:.5in; margin-bottom:.0001pt; mso-add-space:auto; mso-pagination:widow-orphan; font-size:12.0pt; font-family:"Calibri",sans-serif; mso-ascii-font-family:Calibri; mso-ascii-theme-font:minor-latin; mso-fareast-font-family:Calibri; mso-fareast-theme-font:minor-latin; mso-hansi-font-family:Calibri; mso-hansi-theme-font:minor-latin; mso-bidi-font-family:"Times New Roman"; mso-bidi-theme-font:minor-bidi;} p.MsoListParagraphCxSpLast, li.MsoListParagraphCxSpLast, div.MsoListParagraphCxSpLast {mso-style-priority:34; mso-style-unhide:no; mso-style-qformat:yes; mso-style-type:export-only; margin-top:0in; margin-right:0in; margin-bottom:0in; margin-left:.5in; margin-bottom:.0001pt; mso-add-space:auto; mso-pagination:widow-orphan; font-size:12.0pt; font-family:"Calibri",sans-serif; mso-ascii-font-family:Calibri; mso-ascii-theme-font:minor-latin; mso-fareast-font-family:Calibri; mso-fareast-theme-font:minor-latin; mso-hansi-font-family:Calibri; mso-hansi-theme-font:minor-latin; mso-bidi-font-family:"Times New Roman"; mso-bidi-theme-font:minor-bidi;} .MsoChpDefault {mso-style-type:export-only; mso-default-props:yes; font-family:"Calibri",sans-serif; mso-ascii-font-family:Calibri; mso-ascii-theme-font:minor-latin; mso-fareast-font-family:Calibri; mso-fareast-theme-font:minor-latin; mso-hansi-font-family:Calibri; mso-hansi-theme-font:minor-latin; mso-bidi-font-family:"Times New Roman"; mso-bidi-theme-font:minor-bidi;} @page WordSection1 {size:8.5in 11.0in; margin:1.0in 1.0in 1.0in 1.0in; mso-header-margin:.5in; mso-footer-margin:.5in; mso-paper-source:0;} div.WordSection1 {page:WordSection1;} /* List Definitions */ @list l0 {mso-list-id:1673332347; mso-list-type:hybrid; mso-list-template-ids:-1134628678 67698689 67698691 67698693 67698689 67698691 67698693 67698689 67698691 67698693;} @list l0:level1 {mso-level-number-format:bullet; mso-level-text:; mso-level-tab-stop:none; mso-level-number-position:left; text-indent:-.25in; font-family:Symbol;} @list l0:level2 {mso-level-number-format:bullet; mso-level-text:o; mso-level-tab-stop:none; mso-level-number-position:left; text-indent:-.25in; font-family:"Courier New";} @list l0:level3 {mso-level-number-format:bullet; mso-level-text:; mso-level-tab-stop:none; mso-level-number-position:left; text-indent:-.25in; font-family:Wingdings;} @list l0:level4 {mso-level-number-format:bullet; mso-level-text:; mso-level-tab-stop:none; mso-level-number-position:left; text-indent:-.25in; font-family:Symbol;} @list l0:level5 {mso-level-number-format:bullet; mso-level-text:o; mso-level-tab-stop:none; mso-level-number-position:left; text-indent:-.25in; font-family:"Courier New";} @list l0:level6 {mso-level-number-format:bullet; mso-level-text:; mso-level-tab-stop:none; mso-level-number-position:left; text-indent:-.25in; font-family:Wingdings;} @list l0:level7 {mso-level-number-format:bullet; mso-level-text:; mso-level-tab-stop:none; mso-level-number-position:left; text-indent:-.25in; font-family:Symbol;} @list l0:level8 {mso-level-number-format:bullet; mso-level-text:o; mso-level-tab-stop:none; mso-level-number-position:left; text-indent:-.25in; font-family:"Courier New";} @list l0:level9 {mso-level-number-format:bullet; mso-level-text:; mso-level-tab-stop:none; mso-level-number-position:left; text-indent:-.25in; font-family:Wingdings;} </style>--></div>
The Price of Risk
There are almost as many definitions of risk, as there are investors, but I find many of them wanting. There is, of course, the definition of risk as uncertainty, a circular play on words, since it just replaces one nebulous word (risk) with another. There is the definition of risk as encompassing all the bad outcomes you can have on an investment, which by making risk into a negative and something to be avoided, leads you right into the arms of those selling your protection against it (in the form of hedging). In finance, we have become so used to measuring risk in statistical terms (standard deviation, variance, covariance etc.) that we have taken to defining risk with these measures, an arid and antiseptic view of risk. The truth is that risk, at least in business, is neither a good nor a bad, but a given. It is a combination of danger (the likelihood that bad things will happen to you) and opportunity (often emerging from exposing yourself to danger, and I think that the Chinese symbol for crisis captures its essence perfectly:
 (I know! I know! I have been corrected and recorrected on both the symbols and the definition by people who know far more Chinese than I do, which is pretty much everyone in the world… So, please cut me some slack!) It is this definition of risk that allows us to frame the risk/return trade off that lies at the heart of investing. While you can choose a pathway of taking no risk and earning guaranteed returns, those returns in today’s markets would be close to zero in the United States and Europe. If you want to earn higher returns, you have no choice but to expose yourself to risk, and when you do, the key question becomes whether you are being compensated sufficiently for taking that risk. When you invest in fixed income securities (bonds), your compensation takes the form of a default spread, i.e., what you charge over and above the risk free rate to invest in that bond.· When you invest in equities, the payoff to taking risk comes in the form of an equity risk premium, i.e., the premium you demand over and above the risk free rate for investing in equities as an asset class.Both the default spread and the equity risk premium are market-set numbers and are driven by demand and supply. The default spread is a function of what investors believe is the likelihood that borrowers will fail to make their contractually obligated payments, and it will rise and fall with the economy. The equity risk premium is a more complex number and I think of it as the receptacle for everything from changes in investor risk aversion to perceptions of economic growth and stability to corporate choices on leverage and cash return to global flash points (war, health scares etc.).
The Default SpreadThe default spread is the premium that investors demand on a bond to compensate for default risk, and not surprisingly, it varies across bond issuers, with safer (riskier) borrowers being charged less (more) to borrow money. One assessment of corporate default risk is a bond rating, a measure of default risk computed by ratings agencies. While ratings agencies have been criticized for bias and delay, these bond ratings are still widely used, and are a convenient proxy not only for measuring default risk, but also for estimating default spreads. In the graph below, I have listed the default spreads at the start of 2020 and compared them to default spreads that I had estimated at the start of 2019, by ratings class:
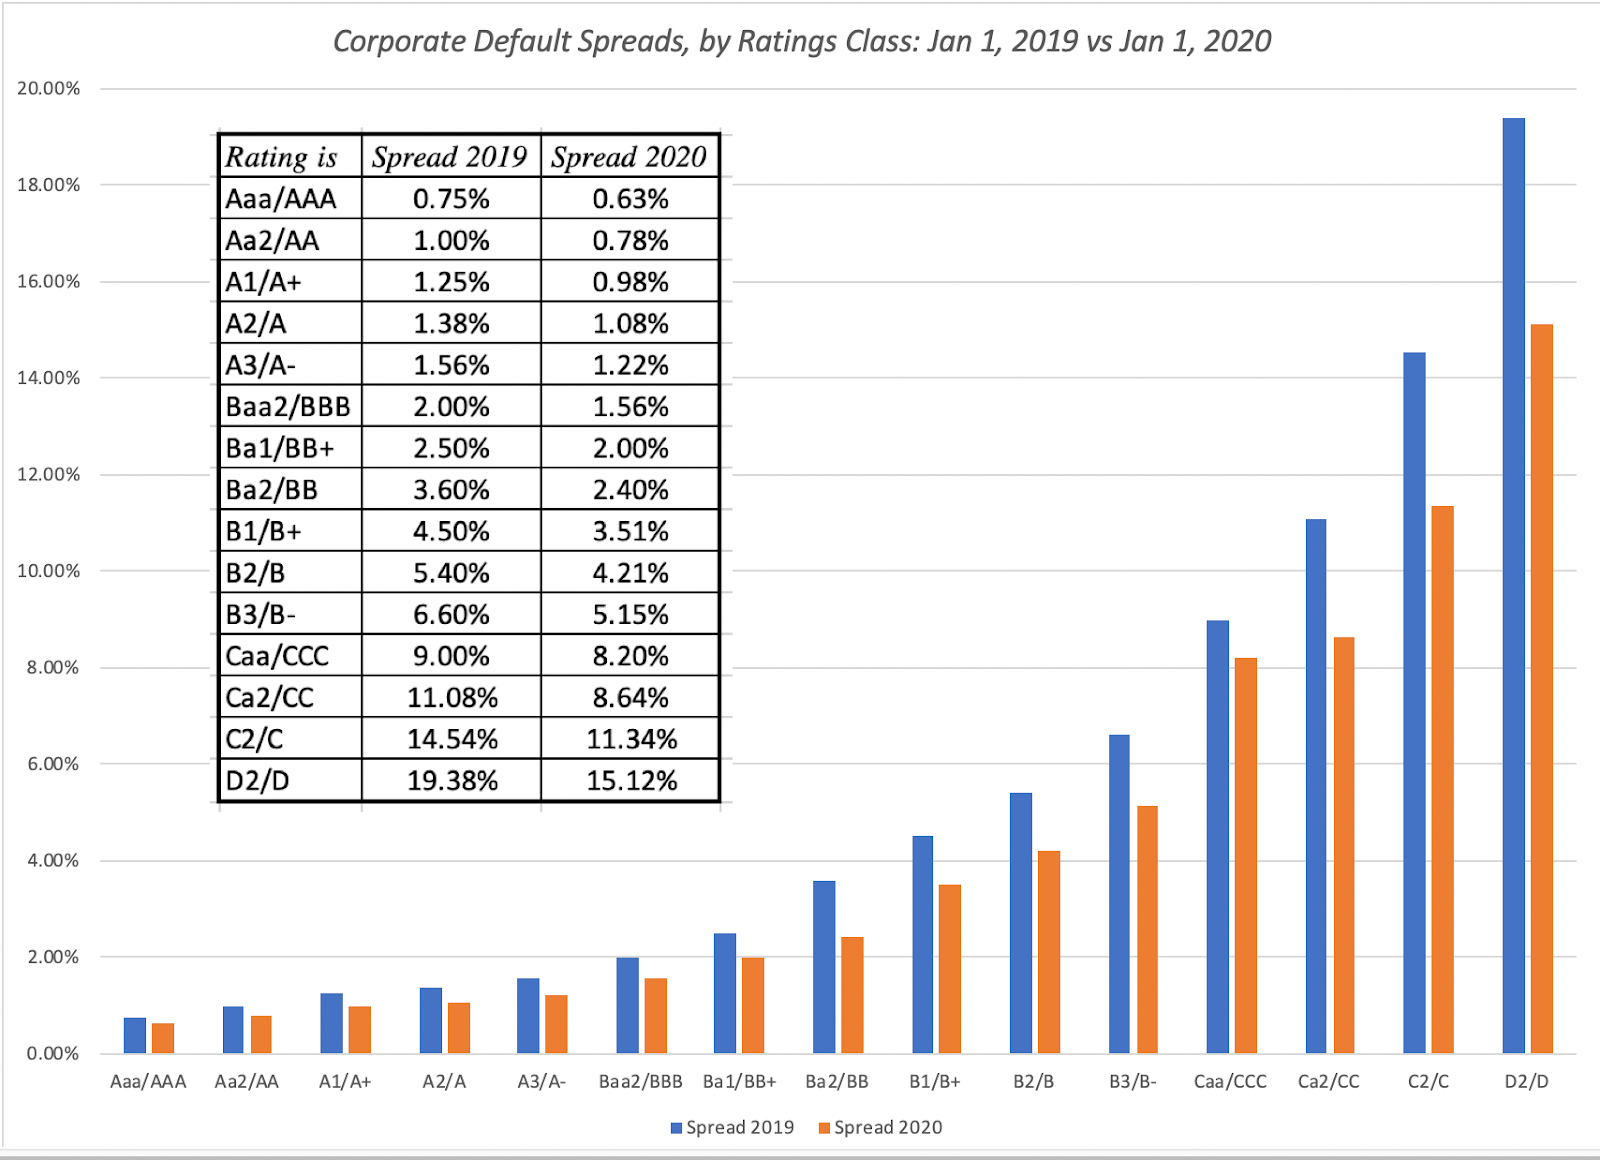 Source: Damodaran OnlineThe first conclusion, and a completely unsurprising one, is that companies that are lower rated (and thus perceived to have more default risk) have larger default spreads than companies that are highly rated; a BBB (Baa) rated bond, at the cusp of investment grade and junk bonds, for instance, saw its default spread drop from 2.00% at the start of 2019 to 1.56% at the start of 2020. To get some longer-term perspective on how much default spreads change over time, the default spread on the investment grade (BBB, Baa) rated bond is graphed below from 1980 to 2019:
 Source: FRED (Federal Reserve St. Louis)At the risk of stating the obvious, the default spreads on bonds change over time, decreasing when times are good and investors are sanguine, and increasing during economic downturns and market crises.
The US Equity Risk PremiumIn my last data update post, where I looked at markets over the last decade, I also posted a table that reported historical equity risk premiums, i.e., the premiums earned by stocks over treasury bills and bonds over long periods, ranging from a decade to 92 years.
 Source: Damodaran OnlineThere are many practitioners, who use these historical equity risk premiums as the best estimates for what you will earn in the future, using mean reversion as their basic argument. I have already made clear my problems with using a backward-looking number with a large estimation error (see the standard errors in the table above) as an expectation for the future, but it cuts against the very essence of an equity risk premium as a number that should be dynamic and constantly changing, as new information comes into markets. For almost three decades, I have computed an implied equity risk premium, a forward-looking value computed by looking at what investors are paying for stocks today, and the expected cash flows on those stocks. Specifically, I take an approach that is used with bonds to compute a yield to maturity to stocks, computing an IRR for stocks and then subtracting out the risk free rate. At the start of 2020, the implied equity risk premium for the S&P 500 was 5.20% and the calculations are in the graph below:
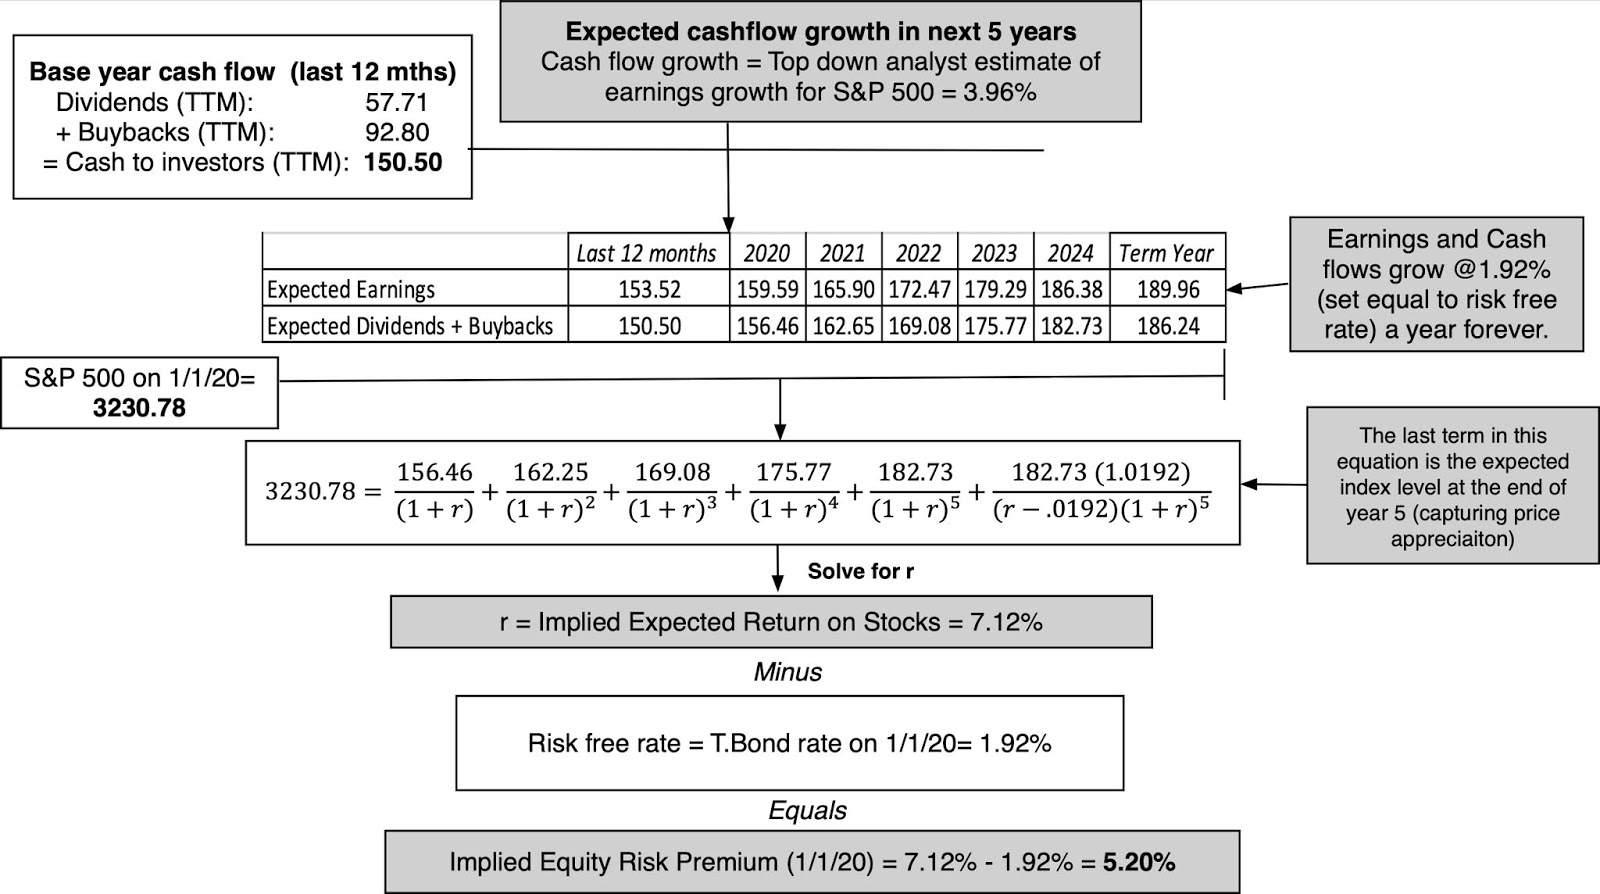 Download spreadsheet
Since I have been computing this number at the start of each month, since September 2008, I can look at how this number moved in the twelve months of 2019:
 Damodaran OnlineDuring the course of the year, the implied equity risk premium has increased from 5.96% to 5.20%, driven down by increasing stock prices and lower interest rates.
I am fascinated by the implied equity risk premium because it captures the market’s current standing in one number and frames debates about the overall market. A contention that markets are overvalued, or in a bubble, is equivalent to claiming that the equity risk premium is too low, relative to what you believe is a reasonable value. In contrast, a bullish assessment of the entire equity market can be viewed as a statement about equity risk premiums being too high, again relative to reasonable values. But what is a reasonable value? I have no idea, since I am not a market timer, but to help you make your own assessment, I have reproduced the implied equity risk premium for the S&P 500 going back to 1960:
 Download spreadsheetYou could use the computed averages embedded in the graph as your basis for reasonable, and using that comparison, the market looks closer to under than overpriced, since the ERP on January 1, 2020 was 5.20%, higher than the average for the last 60 years (4.20%) or the last 20 years (4.86%). Even with a 10-year average, the market is only very mildly overpriced. It is true that the current implied ERP of 5.20% is being earned on a riskfree rate of 1.92%, low by historical standards, yielding an expected return of 7.12% and that may be too low for some. I will let you make your own assessment, but this is a healthier one that just looking at PE ratios (Shiller, trailing, forward) or other market metrics.
A Real Estate Risk Premium?If default spreads measure the price of risk in bond markets and equity risk premiums measure the risk for investing in stocks, what is the price of risk of investing in other asset classes? It may be more difficult to assess what this value is in other risky markets, but it exists without a doubt, and one way of evaluating how much of your portfolio to allocate to these asset classes is to compare their risk premiums to the risk premiums of bonds and stocks. To get a sense of how this would play out, consider the real estate market, perhaps the biggest asset class outside of stocks and bonds. Investors in commercial real estate attach prices to properties, based upon their expectations of income from the properties and capitalization rates. Thus, a property with expected income of $10 million and a capitalization rate of 8% will be valued at $125 million = $10/.08. Since the capitalization rate is effectively a measure of expected return on real estate, subtracting out the risk free rate should yield a measure of the risk premium in real estate. Risk Premium for Real Estate = Cap Rate – Risk free rateIn the graph below, I have estimated the real estate risk premium and provided a comparison to the equity risk premium and default spread, over time:

Note that the real estate risk premium in the 1980s was not only well below the equity risk premium and the default spread, it was sometimes negative. While that may strike you as odd, it makes sense if you think of real estate as an asset class that is not only uncorrelated with financial asset returns but also provides insurance against inflation. As real estate was securitized in the 1990s and fears of inflation receded, the real estate risk premium has started behaving like the risk premiums in stock and bond markets, and the rising correlation between them reflects that co-movement. Put simply, we live in a world, where the real estate you own (often your house or apartment) will tend to move with, rather than against, your financial assets, and in the next market crisis, as the stocks and bonds that you own plummet in value, you should expect the value of your house to drop as well!
ConclusionThe debate about equity risk premiums is not an abstract one, since which side of the debate you come down upon (whether risk premiums today are too high or low) is going to drive your asset allocation judgments. If you are a bear, you believe that equity risk premiums should be higher, either for fundamental reasons or by instinct, and you should put less of your wealth into stocks than you normally would, given your age, liquidity needs and risk aversion. The challenge that you will face is in deciding where you will invest your money until you think that the ERP becomes more reasonable, since bonds are likely to also be overpriced (according to your view of the world) and real assets will often be no better. If you are a market bull, your story has to be one of equity risk premiums declining in the future, perhaps because you believe in your own version of mean reversion or because of continued economic growth. For both market bulls and bears, the perils with then bringing these views into every valuation that you do is that every company you value will then jointly both your views about the company and the overall market. It is for this reason that I think it makes sense to revert back to a market neutral view, when valuing individual companies, even if you have strong market views. Since my market timing skills are non-existent, I prefer to stay market neutral, and stick to valuing companies using the prevailing equity risk premiums.
YouTube Video
SpreadsheetsImplied Equity Risk Premium on January 1, 2020DatasetsHistorical Equity Risk Premiums for the US - 1960 to 2019Historical Default Spreads on Baa Rated Bond - 1980 to 2019Default Spreads on Bond Ratings Classes (my estimates) in January 2020Data Update PostsData Update 1 for 2020: Setting the TableData Update 2 for 2020: Retrospective on a Disruptive DecadeData Update 3 for 2020: The Price of Risk!
<!-- /* Style Definitions */ p.MsoNormal, li.MsoNormal, div.MsoNormal {mso-style-unhide:no; mso-style-qformat:yes; mso-style-parent:""; margin:0in; margin-bottom:.0001pt; mso-pagination:widow-orphan; font-size:12.0pt; font-family:"Calibri",sans-serif; mso-ascii-font-family:Calibri; mso-ascii-theme-font:minor-latin; mso-fareast-font-family:Calibri; mso-fareast-theme-font:minor-latin; mso-hansi-font-family:Calibri; mso-hansi-theme-font:minor-latin; mso-bidi-font-family:"Times New Roman"; mso-bidi-theme-font:minor-bidi;} p.MsoListParagraph, li.MsoListParagraph, div.MsoListParagraph {mso-style-priority:34; mso-style-unhide:no; mso-style-qformat:yes; margin-top:0in; margin-right:0in; margin-bottom:0in; margin-left:.5in; margin-bottom:.0001pt; mso-add-space:auto; mso-pagination:widow-orphan; font-size:12.0pt; font-family:"Calibri",sans-serif; mso-ascii-font-family:Calibri; mso-ascii-theme-font:minor-latin; mso-fareast-font-family:Calibri; mso-fareast-theme-font:minor-latin; mso-hansi-font-family:Calibri; mso-hansi-theme-font:minor-latin; mso-bidi-font-family:"Times New Roman"; mso-bidi-theme-font:minor-bidi;} p.MsoListParagraphCxSpFirst, li.MsoListParagraphCxSpFirst, div.MsoListParagraphCxSpFirst {mso-style-priority:34; mso-style-unhide:no; mso-style-qformat:yes; mso-style-type:export-only; margin-top:0in; margin-right:0in; margin-bottom:0in; margin-left:.5in; margin-bottom:.0001pt; mso-add-space:auto; mso-pagination:widow-orphan; font-size:12.0pt; font-family:"Calibri",sans-serif; mso-ascii-font-family:Calibri; mso-ascii-theme-font:minor-latin; mso-fareast-font-family:Calibri; mso-fareast-theme-font:minor-latin; mso-hansi-font-family:Calibri; mso-hansi-theme-font:minor-latin; mso-bidi-font-family:"Times New Roman"; mso-bidi-theme-font:minor-bidi;} p.MsoListParagraphCxSpMiddle, li.MsoListParagraphCxSpMiddle, div.MsoListParagraphCxSpMiddle {mso-style-priority:34; mso-style-unhide:no; mso-style-qformat:yes; mso-style-type:export-only; margin-top:0in; margin-right:0in; margin-bottom:0in; margin-left:.5in; margin-bottom:.0001pt; mso-add-space:auto; mso-pagination:widow-orphan; font-size:12.0pt; font-family:"Calibri",sans-serif; mso-ascii-font-family:Calibri; mso-ascii-theme-font:minor-latin; mso-fareast-font-family:Calibri; mso-fareast-theme-font:minor-latin; mso-hansi-font-family:Calibri; mso-hansi-theme-font:minor-latin; mso-bidi-font-family:"Times New Roman"; mso-bidi-theme-font:minor-bidi;} p.MsoListParagraphCxSpLast, li.MsoListParagraphCxSpLast, div.MsoListParagraphCxSpLast {mso-style-priority:34; mso-style-unhide:no; mso-style-qformat:yes; mso-style-type:export-only; margin-top:0in; margin-right:0in; margin-bottom:0in; margin-left:.5in; margin-bottom:.0001pt; mso-add-space:auto; mso-pagination:widow-orphan; font-size:12.0pt; font-family:"Calibri",sans-serif; mso-ascii-font-family:Calibri; mso-ascii-theme-font:minor-latin; mso-fareast-font-family:Calibri; mso-fareast-theme-font:minor-latin; mso-hansi-font-family:Calibri; mso-hansi-theme-font:minor-latin; mso-bidi-font-family:"Times New Roman"; mso-bidi-theme-font:minor-bidi;} .MsoChpDefault {mso-style-type:export-only; mso-default-props:yes; font-family:"Calibri",sans-serif; mso-ascii-font-family:Calibri; mso-ascii-theme-font:minor-latin; mso-fareast-font-family:Calibri; mso-fareast-theme-font:minor-latin; mso-hansi-font-family:Calibri; mso-hansi-theme-font:minor-latin; mso-bidi-font-family:"Times New Roman"; mso-bidi-theme-font:minor-bidi;} @page WordSection1 {size:8.5in 11.0in; margin:1.0in 1.0in 1.0in 1.0in; mso-header-margin:.5in; mso-footer-margin:.5in; mso-paper-source:0;} div.WordSection1 {page:WordSection1;} /* List Definitions */ @list l0 {mso-list-id:1673332347; mso-list-type:hybrid; mso-list-template-ids:-1134628678 67698689 67698691 67698693 67698689 67698691 67698693 67698689 67698691 67698693;} @list l0:level1 {mso-level-number-format:bullet; mso-level-text:; mso-level-tab-stop:none; mso-level-number-position:left; text-indent:-.25in; font-family:Symbol;} @list l0:level2 {mso-level-number-format:bullet; mso-level-text:o; mso-level-tab-stop:none; mso-level-number-position:left; text-indent:-.25in; font-family:"Courier New";} @list l0:level3 {mso-level-number-format:bullet; mso-level-text:; mso-level-tab-stop:none; mso-level-number-position:left; text-indent:-.25in; font-family:Wingdings;} @list l0:level4 {mso-level-number-format:bullet; mso-level-text:; mso-level-tab-stop:none; mso-level-number-position:left; text-indent:-.25in; font-family:Symbol;} @list l0:level5 {mso-level-number-format:bullet; mso-level-text:o; mso-level-tab-stop:none; mso-level-number-position:left; text-indent:-.25in; font-family:"Courier New";} @list l0:level6 {mso-level-number-format:bullet; mso-level-text:; mso-level-tab-stop:none; mso-level-number-position:left; text-indent:-.25in; font-family:Wingdings;} @list l0:level7 {mso-level-number-format:bullet; mso-level-text:; mso-level-tab-stop:none; mso-level-number-position:left; text-indent:-.25in; font-family:Symbol;} @list l0:level8 {mso-level-number-format:bullet; mso-level-text:o; mso-level-tab-stop:none; mso-level-number-position:left; text-indent:-.25in; font-family:"Courier New";} @list l0:level9 {mso-level-number-format:bullet; mso-level-text:; mso-level-tab-stop:none; mso-level-number-position:left; text-indent:-.25in; font-family:Wingdings;} </style></div>--><style class="WebKit-mso-list-quirks-style"><!-- /* Style Definitions */ p.MsoNormal, li.MsoNormal, div.MsoNormal {mso-style-unhide:no; mso-style-qformat:yes; mso-style-parent:""; margin:0in; margin-bottom:.0001pt; mso-pagination:widow-orphan; font-size:12.0pt; font-family:"Calibri",sans-serif; mso-ascii-font-family:Calibri; mso-ascii-theme-font:minor-latin; mso-fareast-font-family:Calibri; mso-fareast-theme-font:minor-latin; mso-hansi-font-family:Calibri; mso-hansi-theme-font:minor-latin; mso-bidi-font-family:"Times New Roman"; mso-bidi-theme-font:minor-bidi;} p.MsoListParagraph, li.MsoListParagraph, div.MsoListParagraph {mso-style-priority:34; mso-style-unhide:no; mso-style-qformat:yes; margin-top:0in; margin-right:0in; margin-bottom:0in; margin-left:.5in; margin-bottom:.0001pt; mso-add-space:auto; mso-pagination:widow-orphan; font-size:12.0pt; font-family:"Calibri",sans-serif; mso-ascii-font-family:Calibri; mso-ascii-theme-font:minor-latin; mso-fareast-font-family:Calibri; mso-fareast-theme-font:minor-latin; mso-hansi-font-family:Calibri; mso-hansi-theme-font:minor-latin; mso-bidi-font-family:"Times New Roman"; mso-bidi-theme-font:minor-bidi;} p.MsoListParagraphCxSpFirst, li.MsoListParagraphCxSpFirst, div.MsoListParagraphCxSpFirst {mso-style-priority:34; mso-style-unhide:no; mso-style-qformat:yes; mso-style-type:export-only; margin-top:0in; margin-right:0in; margin-bottom:0in; margin-left:.5in; margin-bottom:.0001pt; mso-add-space:auto; mso-pagination:widow-orphan; font-size:12.0pt; font-family:"Calibri",sans-serif; mso-ascii-font-family:Calibri; mso-ascii-theme-font:minor-latin; mso-fareast-font-family:Calibri; mso-fareast-theme-font:minor-latin; mso-hansi-font-family:Calibri; mso-hansi-theme-font:minor-latin; mso-bidi-font-family:"Times New Roman"; mso-bidi-theme-font:minor-bidi;} p.MsoListParagraphCxSpMiddle, li.MsoListParagraphCxSpMiddle, div.MsoListParagraphCxSpMiddle {mso-style-priority:34; mso-style-unhide:no; mso-style-qformat:yes; mso-style-type:export-only; margin-top:0in; margin-right:0in; margin-bottom:0in; margin-left:.5in; margin-bottom:.0001pt; mso-add-space:auto; mso-pagination:widow-orphan; font-size:12.0pt; font-family:"Calibri",sans-serif; mso-ascii-font-family:Calibri; mso-ascii-theme-font:minor-latin; mso-fareast-font-family:Calibri; mso-fareast-theme-font:minor-latin; mso-hansi-font-family:Calibri; mso-hansi-theme-font:minor-latin; mso-bidi-font-family:"Times New Roman"; mso-bidi-theme-font:minor-bidi;} p.MsoListParagraphCxSpLast, li.MsoListParagraphCxSpLast, div.MsoListParagraphCxSpLast {mso-style-priority:34; mso-style-unhide:no; mso-style-qformat:yes; mso-style-type:export-only; margin-top:0in; margin-right:0in; margin-bottom:0in; margin-left:.5in; margin-bottom:.0001pt; mso-add-space:auto; mso-pagination:widow-orphan; font-size:12.0pt; font-family:"Calibri",sans-serif; mso-ascii-font-family:Calibri; mso-ascii-theme-font:minor-latin; mso-fareast-font-family:Calibri; mso-fareast-theme-font:minor-latin; mso-hansi-font-family:Calibri; mso-hansi-theme-font:minor-latin; mso-bidi-font-family:"Times New Roman"; mso-bidi-theme-font:minor-bidi;} .MsoChpDefault {mso-style-type:export-only; mso-default-props:yes; font-family:"Calibri",sans-serif; mso-ascii-font-family:Calibri; mso-ascii-theme-font:minor-latin; mso-fareast-font-family:Calibri; mso-fareast-theme-font:minor-latin; mso-hansi-font-family:Calibri; mso-hansi-theme-font:minor-latin; mso-bidi-font-family:"Times New Roman"; mso-bidi-theme-font:minor-bidi;} @page WordSection1 {size:8.5in 11.0in; margin:1.0in 1.0in 1.0in 1.0in; mso-header-margin:.5in; mso-footer-margin:.5in; mso-paper-source:0;} div.WordSection1 {page:WordSection1;} /* List Definitions */ @list l0 {mso-list-id:1673332347; mso-list-type:hybrid; mso-list-template-ids:-1134628678 67698689 67698691 67698693 67698689 67698691 67698693 67698689 67698691 67698693;} @list l0:level1 {mso-level-number-format:bullet; mso-level-text:; mso-level-tab-stop:none; mso-level-number-position:left; text-indent:-.25in; font-family:Symbol;} @list l0:level2 {mso-level-number-format:bullet; mso-level-text:o; mso-level-tab-stop:none; mso-level-number-position:left; text-indent:-.25in; font-family:"Courier New";} @list l0:level3 {mso-level-number-format:bullet; mso-level-text:; mso-level-tab-stop:none; mso-level-number-position:left; text-indent:-.25in; font-family:Wingdings;} @list l0:level4 {mso-level-number-format:bullet; mso-level-text:; mso-level-tab-stop:none; mso-level-number-position:left; text-indent:-.25in; font-family:Symbol;} @list l0:level5 {mso-level-number-format:bullet; mso-level-text:o; mso-level-tab-stop:none; mso-level-number-position:left; text-indent:-.25in; font-family:"Courier New";} @list l0:level6 {mso-level-number-format:bullet; mso-level-text:; mso-level-tab-stop:none; mso-level-number-position:left; text-indent:-.25in; font-family:Wingdings;} @list l0:level7 {mso-level-number-format:bullet; mso-level-text:; mso-level-tab-stop:none; mso-level-number-position:left; text-indent:-.25in; font-family:Symbol;} @list l0:level8 {mso-level-number-format:bullet; mso-level-text:o; mso-level-tab-stop:none; mso-level-number-position:left; text-indent:-.25in; font-family:"Courier New";} @list l0:level9 {mso-level-number-format:bullet; mso-level-text:; mso-level-tab-stop:none; mso-level-number-position:left; text-indent:-.25in; font-family:Wingdings;} </style>--></div>
February 6, 2020
A Do-it-yourself (DIY) Valuation of Tesla: Of Investment Regrets and Disagreements!
I was hoping to move on from Tesla to my data update posts, but my last post on Tesla drew some attention, in good and bad ways, partly because of its timing. Right after I sold my shares for $640, last week (January 30), the stock took off, climbing to more than $900/share in the matter of days. As always, there were people on both sides of the great Tesla divide commenting on my valuation, with bears accusing me of wearing rose-colored glasses and making unrealistically optimistic assumptions, and bulls pointing to inputs that they felt under estimated the company’s potential. I wish that I had been clearer in my writing that the numbers that I was using did not represent “the” valuation of Tesla but that this was “my” valuation of the company, and that I not only expect disagreement, but I think it is part and parcel of a healthy market. Rather than leave that view as an abstraction, I thought I would revisit the valuation and present it in a different format, one in which you can choose your story for Tesla and estimate the value for yourself.
The Key Levers of ValueIn my earlier post, I valued Tesla and presented my valuation in a picture, where I connected the story that I was telling about the company to my estimated value per share of roughly $427 per share: Download spreadsheetIf you find the numbers off putting or overwhelming, the value is determined by four key levers:The Growth Lever: The revenue growth rate controls how much and how quickly the firm will be able to grow its revenues from autos, software, solar panels and anything else that you believe the company will be selling. Rather than focus on the growth rate, I would suggest looking at the estimated revenues in 2030 (ten years out). In my Tesla story (valuation), I have estimated revenues of $125 billion in 2030, a five-fold increase over the 2019 revenues.The Profitability Lever: The target (pre-tax) operating margin determines how profitable you think the company will be, once its growth days start to scale down. Since these are operating margins, not gross or net margins, they are after all operating expenses (cost of goods sold, SG&A etc.) but before any financial expenses (interest expenses). In keeping with my view that R&D is really a capital expense, I capitalize R&D, which improves Tesla’s profitability, and target an operating margin of 12% by 2025.The Investment Efficiency Lever: To grow, companies have to invest in production capacity and the sales to invested capital drives how efficiently investment is done, with higher sales to capital ratios reflecting more efficiency. With Tesla, I assume that every dollar of investment (in new factories, technology and new R&D) in the first 5 years generates $3 in revenues, as it utilizes excess capacity in the early years, and that this efficiency drops back by a third, as capacity constraints hit.The Risk lever: There are two inputs in this valuation that incorporate risk. The first is the cost of capital that I start the valuation with, a reflection of risk as seen through the eyes of a diversified investor in the company. The second is the likelihood of failure (or distress), where the company has to liquidate assets and lose the additional value that it could have generated as a going concern. With Tesla, I set this cost of capital at 7% and assume that given its marginal profitability and significant debt load, the chance of failure is 10%.The value per share of $427 comes out of these assumptions and is driving my investment decisions. Since this is my story and valuation, I expect and welcome disagreement on any and all of these inputs. After all, I don’t have a crystal ball to forecast the future or a monopoly on the right estimates
A DIY Valuation of TeslaIn the rest of this post, rather than force my story on your, I would like you to make your choices on the growth, profitability, investment and risk dimensions future for Tesla, and just in case you need some help, I will offer data perspective, on each of those choices.
The Growth Lever To make your judgment on how much revenue Tesla will have in a decade, it may help to take a look at the overall auto business. In 2019, the collective revenues of all publicly traded auto companies in the world was about $2.46 trillion and the the compounded average growth rate in those revenues over the last decade has been about 3.5%: Source data: S&P Capital IQPut simply, this is a big market, but the overall market is in slow growth. To provide some perspective on what the bigger auto companies generate in revenues, I have listed the 20 largest auto companies, in terms of revenues in the table below:
 Source data: S&P Capital IQTesla does make the list, coming in at the very bottom of the list, and its compounded annual growth rate between 2010 and 2019 stands out, partly the base revenues for the company, in 2010, were tiny. Since one of the Tesla stories told by optimistic is that it is a tech company, It may help in your estimation to see what large tech companies look like, and to make this assessment, I decided to focus on the giants on top of the tech heap in the FAANG stocks, with Microsoft thrown in for full measure:
 Note that while the tech companies are substantially more profitable than the auto companies, in terms of margins and dollar operating income, their revenues tend to be more muted, reflecting the pricing of their products and services. Apple, the largest market cap company in the world, had revenues of $ 260 billion in 2019, and Microsoft, the largest software company in the world, by far, had revenues of $129 billion, and both companies lagged Toyota and Volkswagen, on total revenues.
With this background, I think that you have the ammunition you need to make your own revenue judgments for Tesla in a decade, differentiating your story from mine, where revenues in 2030 for Tesla are roughly $125 billion. So, with no further ado, here are your choices (pick one): Download spreadsheetSince Tesla’s revenue stream includes not just autos but also software, batteries and solar panels, your story may augment revenues to reflect these, but remember that these streams cannot deliver the same revenue heft as selling cars, though they may be more profitable.
The Profitability LeverTo make your judgment on operating profitability, take a look at both the largest auto company tables and the one for FAANG stocks in the last section. There is not a single large auto company with double digit margins, and across all auto companies listed publicly, the profit picture is even more bleak: Source: S&P Capital IQThe picture is brighter for the FAANG stocks, where the aggregate operating margin across all five stocks is 19.87%, well above auto industry averages. That margin, though, is delivered on smaller revenues and with business models where production costs are a smaller fraction of selling prices. The marginal cost of producing an extra unit for Microsoft is close to zero on both its Office and Cloud business, and even for Apple, which derives a large chunk of its revenues from the iPhone, the cost of making the iPhone is about about 40% of the price it charges.
This information should provide a basis for you to make a choice on a target operating margin for Tesla in the future, keeping in mind that its current operating margin is miniscule and barely positive. Download spreadsheetAs you make this choice, it is important that you tie it back to your earlier growth story. While Tesla sales of software/tech will have higher margins, it the auto sales that are responsible for the bulking up of revenues over time. Thus, if your argument is that Tesla will become predominantly a soft services company, you can give it higher margins, but your revenue expectations may have to be reduced.
The Investment Efficiency LeverThe investment efficiency lever is one of the trickiest to navigate. Again, the place to start is with automobile companies, and the table below presents the distribution of sales to invested capital across all auto firms, at the start of 2020.
Looking across global auto companies, the median company generates $1.37 in sales for every dollar of capital invested, and at the 75th percentile, the more capital-efficient auto companies generate $2.42 in revenues for every dollar of capital invested. In fact, my estimate of $3 in revenues for every dollar of capital invested reflects an optimistic view of Tesla’s capacity to bring technological innovation to its production processes, and reduce the capital needed to fund those processes. Since Tesla, in 2019, generates $1.32 in revenue for every dollar of capital invested, my estimate is more aspirational than based on observable efficiencies, right now. Tesla bulls will counter with the tech company story, and to help the estimation process, I estimated the sales to invested capital at tech firms generally, just software firms and finally at just the FAANG stocks. None of these groups had sales to invested capital that were higher than my estimate. With that data to provide perspective, it is time to make your own judgment on investment efficiency: Download spreadsheetThis choice will drive not only how much Tesla will have to reinvest to grow, but the extent to which it will be dependent on external capital for that growth.
The Risk LeverThe first component in the risk lever is the cost of capital, and to provide a sense of what costs of capital look like around the world at the start of 2020, let me start with a cost of capital distribution for all publicly traded companies: Download spreadsheetNote that the median cost of capital across all firms globally is 7.58%, and that 50% of all publicly traded firms have costs of capital that fall between 6.27% and 8.71%. It is true that costs of capital vary across different industries, and while you can get the entire list on my website, the median cost of capital for auto firms is 6.94% and for tech firms, it is 8.86%. While I used 7% as my cost of capital, you may disagree and here are your choices:
 Download spreadsheetThe other component of risk is failure, where the company faces the risk of having its life truncated, either because it runs out of cash or because of debt payments coming due. While the rise in stock price has reduced its vulnerability for the moment, those who see more losses in the future and continued borrowing to fund investment may attach a higher probability of default than the 10% that I use, whereas those who believe Elon’s claims that Tesla has entered an era of positive earnings and cash flows, may decide that Tesla has no risk of failure any more:
The ValuationI have created a front end for my Tesla valuation spreadsheet that allows the choices you made to drive the valuation. Running through the different combinations for the four variables, I have too many to list individually, but consider a subset in this table: Download spreadsheetBroadly speaking, there are four broad stories that I have valued here:The Big Auto Story: If your story is that Tesla will emerge from its growth period as one of the largest auto companies in the world (revenues of $100- $300 billion in year 10), with top-tier auto company margins (7.42%), investment efficiency (2.42) and cost of capital (6.94%), the value per share ranges from $106/share (with BMW like revenues) to $227/share (with Daimler-like revenues) to $333/share (with VW/Toyota like revenues).The Techy Auto Company Story: An alternate story is that Tesla is an auto/software/services company with tech company characteristics, giving it higher margins (10.25%) and a higher cost of capital (8.86%). With this story, the value per share ranges from $111/share (with BMW like revenues) to $212/share (with Daimler-like revenues) to $298/share (with VW/Toyota like revenues). Put simply, the higher risk nullifies the benefits of higher profitability.The FAANGy Auto Company: In this variant of the tech story, Tesla not only develops a tech twist, but becomes as successful as the most successful tech companies (I use the FAANG stocks + Microsoft). In this story, the margins approach 18.97% and with a tech cost of capital, the value per share ranges from $459/share (with BMW like revenues) to $855/share (with Daimler-like revenues) to $2,106/share (with VW/Toyota like revenues).The Make-your-best Company: In this variant, I give Tesla the best possible outcomes on each variable, revenues like VW/Toyota, margins like pure software companies (21.24%), a sales to capital ratio that is higher than any of the sector averages (4.00) and a cost of capital of an auto company (6.94%), and arrive at a value per share of $2106.For some of you, the fact that there is a value here that justifies whatever your Tesla status is right now (long, short or just watching) should not be the end of your analysis. Each of these stories may be possible, but the tests you have to run, and I will prejudge your conclusions, is whether they are plausible. With each story, there are key questions that need answering:
With the big auto stories, the key question will be whether Tesla can climb to the very top of the heap in terms of revenues, generally reserved for mass market companies, while earning operating margins that are usually reserved for smaller luxury auto companies?With the techy auto stories, the key question becomes whether a company that derives the bulk of its revenues from selling cars be profitable and reinvest like a tech company? With the FAANGy stories, the investment question becomes whether you should up front for a company on the expectation that it will be an exceptional company. It very well might make it to the top of the heap, but if it does not, you are set up for disappointment.With the MYB story, you are approaching the most dangerous place in valuation, where you pick and choose each assumption, without considering the ones you have already made. Put simply, is it even possible to build a company that generates revenues like Toyota, earns margins like Microsoft and invests more efficiently than any manufacturing company in history has ever done, while still preserving the low cost of capital of an auto company?ConclusionIn the week since I sold Tesla at $640, the stock has gone on a wild ride, rising above $900 in two trading days. Not surprisingly, quite a few of you have asked me whether I have any regrets about selling too early. You may not believe me, but I don't. I made my decision to buy, based on my story and valuation for Tesla, and my decision to sell, for the same reason, because I am an investor who believes in value, and acting on it. If I abandon that philosophy to play the momentum game, a game that I am not good at and don’t really play well, I may make a bit more money, but at what cost? On a different note, I have to confess that one reason that I write about Tesla reluctantly is the vitriol that seems to be part of any discussion of the stock. In a world where we face unbridgeable divides on politics, religion and culture, do we need to add investing to the mix? If you stayed with your Tesla investment, I wish you the best, and I hope that you are holding on for the right reasons, either because you believe that its value is much higher or because you are playing the pricing game. If you sold short and lost money, I get no joy out of your losses and no inclination to do a celebratory dance. For the moment, you may have lost, but having watched this stock for as long as I have, that can change in a minute. As far as I am concerned, Tesla is a fascinating company, but it is just an investment, not a matter of life or death, and definitely not worth losing sleep, and friends, over.
YouTube Video
Spreadsheet
A Do-it-Yourself Valuation of Tesla<!-- /* Style Definitions */ p.MsoNormal, li.MsoNormal, div.MsoNormal {mso-style-unhide:no; mso-style-qformat:yes; mso-style-parent:""; margin:0in; margin-bottom:.0001pt; mso-pagination:widow-orphan; font-size:12.0pt; font-family:"Calibri",sans-serif; mso-ascii-font-family:Calibri; mso-ascii-theme-font:minor-latin; mso-fareast-font-family:Calibri; mso-fareast-theme-font:minor-latin; mso-hansi-font-family:Calibri; mso-hansi-theme-font:minor-latin; mso-bidi-font-family:"Times New Roman"; mso-bidi-theme-font:minor-bidi;} p.MsoListParagraph, li.MsoListParagraph, div.MsoListParagraph {mso-style-priority:34; mso-style-unhide:no; mso-style-qformat:yes; margin-top:0in; margin-right:0in; margin-bottom:0in; margin-left:.5in; margin-bottom:.0001pt; mso-add-space:auto; mso-pagination:widow-orphan; font-size:12.0pt; font-family:"Calibri",sans-serif; mso-ascii-font-family:Calibri; mso-ascii-theme-font:minor-latin; mso-fareast-font-family:Calibri; mso-fareast-theme-font:minor-latin; mso-hansi-font-family:Calibri; mso-hansi-theme-font:minor-latin; mso-bidi-font-family:"Times New Roman"; mso-bidi-theme-font:minor-bidi;} p.MsoListParagraphCxSpFirst, li.MsoListParagraphCxSpFirst, div.MsoListParagraphCxSpFirst {mso-style-priority:34; mso-style-unhide:no; mso-style-qformat:yes; mso-style-type:export-only; margin-top:0in; margin-right:0in; margin-bottom:0in; margin-left:.5in; margin-bottom:.0001pt; mso-add-space:auto; mso-pagination:widow-orphan; font-size:12.0pt; font-family:"Calibri",sans-serif; mso-ascii-font-family:Calibri; mso-ascii-theme-font:minor-latin; mso-fareast-font-family:Calibri; mso-fareast-theme-font:minor-latin; mso-hansi-font-family:Calibri; mso-hansi-theme-font:minor-latin; mso-bidi-font-family:"Times New Roman"; mso-bidi-theme-font:minor-bidi;} p.MsoListParagraphCxSpMiddle, li.MsoListParagraphCxSpMiddle, div.MsoListParagraphCxSpMiddle {mso-style-priority:34; mso-style-unhide:no; mso-style-qformat:yes; mso-style-type:export-only; margin-top:0in; margin-right:0in; margin-bottom:0in; margin-left:.5in; margin-bottom:.0001pt; mso-add-space:auto; mso-pagination:widow-orphan; font-size:12.0pt; font-family:"Calibri",sans-serif; mso-ascii-font-family:Calibri; mso-ascii-theme-font:minor-latin; mso-fareast-font-family:Calibri; mso-fareast-theme-font:minor-latin; mso-hansi-font-family:Calibri; mso-hansi-theme-font:minor-latin; mso-bidi-font-family:"Times New Roman"; mso-bidi-theme-font:minor-bidi;} p.MsoListParagraphCxSpLast, li.MsoListParagraphCxSpLast, div.MsoListParagraphCxSpLast {mso-style-priority:34; mso-style-unhide:no; mso-style-qformat:yes; mso-style-type:export-only; margin-top:0in; margin-right:0in; margin-bottom:0in; margin-left:.5in; margin-bottom:.0001pt; mso-add-space:auto; mso-pagination:widow-orphan; font-size:12.0pt; font-family:"Calibri",sans-serif; mso-ascii-font-family:Calibri; mso-ascii-theme-font:minor-latin; mso-fareast-font-family:Calibri; mso-fareast-theme-font:minor-latin; mso-hansi-font-family:Calibri; mso-hansi-theme-font:minor-latin; mso-bidi-font-family:"Times New Roman"; mso-bidi-theme-font:minor-bidi;} .MsoChpDefault {mso-style-type:export-only; mso-default-props:yes; font-family:"Calibri",sans-serif; mso-ascii-font-family:Calibri; mso-ascii-theme-font:minor-latin; mso-fareast-font-family:Calibri; mso-fareast-theme-font:minor-latin; mso-hansi-font-family:Calibri; mso-hansi-theme-font:minor-latin; mso-bidi-font-family:"Times New Roman"; mso-bidi-theme-font:minor-bidi;} @page WordSection1 {size:8.5in 11.0in; margin:1.0in 1.0in 1.0in 1.0in; mso-header-margin:.5in; mso-footer-margin:.5in; mso-paper-source:0;} div.WordSection1 {page:WordSection1;} /* List Definitions */ @list l0 {mso-list-id:177545795; mso-list-type:hybrid; mso-list-template-ids:326645010 67698689 67698691 67698693 67698689 67698691 67698693 67698689 67698691 67698693;} @list l0:level1 {mso-level-number-format:bullet; mso-level-text:; mso-level-tab-stop:none; mso-level-number-position:left; text-indent:-.25in; font-family:Symbol;} @list l0:level2 {mso-level-number-format:bullet; mso-level-text:o; mso-level-tab-stop:none; mso-level-number-position:left; text-indent:-.25in; font-family:"Courier New";} @list l0:level3 {mso-level-number-format:bullet; mso-level-text:; mso-level-tab-stop:none; mso-level-number-position:left; text-indent:-.25in; font-family:Wingdings;} @list l0:level4 {mso-level-number-format:bullet; mso-level-text:; mso-level-tab-stop:none; mso-level-number-position:left; text-indent:-.25in; font-family:Symbol;} @list l0:level5 {mso-level-number-format:bullet; mso-level-text:o; mso-level-tab-stop:none; mso-level-number-position:left; text-indent:-.25in; font-family:"Courier New";} @list l0:level6 {mso-level-number-format:bullet; mso-level-text:; mso-level-tab-stop:none; mso-level-number-position:left; text-indent:-.25in; font-family:Wingdings;} @list l0:level7 {mso-level-number-format:bullet; mso-level-text:; mso-level-tab-stop:none; mso-level-number-position:left; text-indent:-.25in; font-family:Symbol;} @list l0:level8 {mso-level-number-format:bullet; mso-level-text:o; mso-level-tab-stop:none; mso-level-number-position:left; text-indent:-.25in; font-family:"Courier New";} @list l0:level9 {mso-level-number-format:bullet; mso-level-text:; mso-level-tab-stop:none; mso-level-number-position:left; text-indent:-.25in; font-family:Wingdings;} @list l1 {mso-list-id:441653939; mso-list-type:hybrid; mso-list-template-ids:894629348 67698703 67698713 67698715 67698703 67698713 67698715 67698703 67698713 67698715;} @list l1:level1 {mso-level-tab-stop:none; mso-level-number-position:left; text-indent:-.25in;} @list l1:level2 {mso-level-number-format:alpha-lower; mso-level-tab-stop:none; mso-level-number-position:left; text-indent:-.25in;} @list l1:level3 {mso-level-number-format:roman-lower; mso-level-tab-stop:none; mso-level-number-position:right; text-indent:-9.0pt;} @list l1:level4 {mso-level-tab-stop:none; mso-level-number-position:left; text-indent:-.25in;} @list l1:level5 {mso-level-number-format:alpha-lower; mso-level-tab-stop:none; mso-level-number-position:left; text-indent:-.25in;} @list l1:level6 {mso-level-number-format:roman-lower; mso-level-tab-stop:none; mso-level-number-position:right; text-indent:-9.0pt;} @list l1:level7 {mso-level-tab-stop:none; mso-level-number-position:left; text-indent:-.25in;} @list l1:level8 {mso-level-number-format:alpha-lower; mso-level-tab-stop:none; mso-level-number-position:left; text-indent:-.25in;} @list l1:level9 {mso-level-number-format:roman-lower; mso-level-tab-stop:none; mso-level-number-position:right; text-indent:-9.0pt;} </style></div></div>-->
The Key Levers of ValueIn my earlier post, I valued Tesla and presented my valuation in a picture, where I connected the story that I was telling about the company to my estimated value per share of roughly $427 per share:
 Download spreadsheetIf you find the numbers off putting or overwhelming, the value is determined by four key levers:The Growth Lever: The revenue growth rate controls how much and how quickly the firm will be able to grow its revenues from autos, software, solar panels and anything else that you believe the company will be selling. Rather than focus on the growth rate, I would suggest looking at the estimated revenues in 2030 (ten years out). In my Tesla story (valuation), I have estimated revenues of $125 billion in 2030, a five-fold increase over the 2019 revenues.The Profitability Lever: The target (pre-tax) operating margin determines how profitable you think the company will be, once its growth days start to scale down. Since these are operating margins, not gross or net margins, they are after all operating expenses (cost of goods sold, SG&A etc.) but before any financial expenses (interest expenses). In keeping with my view that R&D is really a capital expense, I capitalize R&D, which improves Tesla’s profitability, and target an operating margin of 12% by 2025.The Investment Efficiency Lever: To grow, companies have to invest in production capacity and the sales to invested capital drives how efficiently investment is done, with higher sales to capital ratios reflecting more efficiency. With Tesla, I assume that every dollar of investment (in new factories, technology and new R&D) in the first 5 years generates $3 in revenues, as it utilizes excess capacity in the early years, and that this efficiency drops back by a third, as capacity constraints hit.The Risk lever: There are two inputs in this valuation that incorporate risk. The first is the cost of capital that I start the valuation with, a reflection of risk as seen through the eyes of a diversified investor in the company. The second is the likelihood of failure (or distress), where the company has to liquidate assets and lose the additional value that it could have generated as a going concern. With Tesla, I set this cost of capital at 7% and assume that given its marginal profitability and significant debt load, the chance of failure is 10%.The value per share of $427 comes out of these assumptions and is driving my investment decisions. Since this is my story and valuation, I expect and welcome disagreement on any and all of these inputs. After all, I don’t have a crystal ball to forecast the future or a monopoly on the right estimates
A DIY Valuation of TeslaIn the rest of this post, rather than force my story on your, I would like you to make your choices on the growth, profitability, investment and risk dimensions future for Tesla, and just in case you need some help, I will offer data perspective, on each of those choices.
The Growth Lever To make your judgment on how much revenue Tesla will have in a decade, it may help to take a look at the overall auto business. In 2019, the collective revenues of all publicly traded auto companies in the world was about $2.46 trillion and the the compounded average growth rate in those revenues over the last decade has been about 3.5%:
 Source data: S&P Capital IQPut simply, this is a big market, but the overall market is in slow growth. To provide some perspective on what the bigger auto companies generate in revenues, I have listed the 20 largest auto companies, in terms of revenues in the table below:
 Source data: S&P Capital IQTesla does make the list, coming in at the very bottom of the list, and its compounded annual growth rate between 2010 and 2019 stands out, partly the base revenues for the company, in 2010, were tiny. Since one of the Tesla stories told by optimistic is that it is a tech company, It may help in your estimation to see what large tech companies look like, and to make this assessment, I decided to focus on the giants on top of the tech heap in the FAANG stocks, with Microsoft thrown in for full measure:
 Note that while the tech companies are substantially more profitable than the auto companies, in terms of margins and dollar operating income, their revenues tend to be more muted, reflecting the pricing of their products and services. Apple, the largest market cap company in the world, had revenues of $ 260 billion in 2019, and Microsoft, the largest software company in the world, by far, had revenues of $129 billion, and both companies lagged Toyota and Volkswagen, on total revenues.
With this background, I think that you have the ammunition you need to make your own revenue judgments for Tesla in a decade, differentiating your story from mine, where revenues in 2030 for Tesla are roughly $125 billion. So, with no further ado, here are your choices (pick one):
 Download spreadsheetSince Tesla’s revenue stream includes not just autos but also software, batteries and solar panels, your story may augment revenues to reflect these, but remember that these streams cannot deliver the same revenue heft as selling cars, though they may be more profitable.
 The Profitability LeverTo make your judgment on operating profitability, take a look at both the largest auto company tables and the one for FAANG stocks in the last section. There is not a single large auto company with double digit margins, and across all auto companies listed publicly, the profit picture is even more bleak:
 Source: S&P Capital IQThe picture is brighter for the FAANG stocks, where the aggregate operating margin across all five stocks is 19.87%, well above auto industry averages. That margin, though, is delivered on smaller revenues and with business models where production costs are a smaller fraction of selling prices. The marginal cost of producing an extra unit for Microsoft is close to zero on both its Office and Cloud business, and even for Apple, which derives a large chunk of its revenues from the iPhone, the cost of making the iPhone is about about 40% of the price it charges.
 This information should provide a basis for you to make a choice on a target operating margin for Tesla in the future, keeping in mind that its current operating margin is miniscule and barely positive.
 Download spreadsheetAs you make this choice, it is important that you tie it back to your earlier growth story. While Tesla sales of software/tech will have higher margins, it the auto sales that are responsible for the bulking up of revenues over time. Thus, if your argument is that Tesla will become predominantly a soft services company, you can give it higher margins, but your revenue expectations may have to be reduced.
The Investment Efficiency LeverThe investment efficiency lever is one of the trickiest to navigate. Again, the place to start is with automobile companies, and the table below presents the distribution of sales to invested capital across all auto firms, at the start of 2020.
Looking across global auto companies, the median company generates $1.37 in sales for every dollar of capital invested, and at the 75th percentile, the more capital-efficient auto companies generate $2.42 in revenues for every dollar of capital invested. In fact, my estimate of $3 in revenues for every dollar of capital invested reflects an optimistic view of Tesla’s capacity to bring technological innovation to its production processes, and reduce the capital needed to fund those processes. Since Tesla, in 2019, generates $1.32 in revenue for every dollar of capital invested, my estimate is more aspirational than based on observable efficiencies, right now. Tesla bulls will counter with the tech company story, and to help the estimation process, I estimated the sales to invested capital at tech firms generally, just software firms and finally at just the FAANG stocks. None of these groups had sales to invested capital that were higher than my estimate. With that data to provide perspective, it is time to make your own judgment on investment efficiency:
 Download spreadsheetThis choice will drive not only how much Tesla will have to reinvest to grow, but the extent to which it will be dependent on external capital for that growth.
The Risk LeverThe first component in the risk lever is the cost of capital, and to provide a sense of what costs of capital look like around the world at the start of 2020, let me start with a cost of capital distribution for all publicly traded companies:
 Download spreadsheetNote that the median cost of capital across all firms globally is 7.58%, and that 50% of all publicly traded firms have costs of capital that fall between 6.27% and 8.71%. It is true that costs of capital vary across different industries, and while you can get the entire list on my website, the median cost of capital for auto firms is 6.94% and for tech firms, it is 8.86%. While I used 7% as my cost of capital, you may disagree and here are your choices:
 Download spreadsheetThe other component of risk is failure, where the company faces the risk of having its life truncated, either because it runs out of cash or because of debt payments coming due. While the rise in stock price has reduced its vulnerability for the moment, those who see more losses in the future and continued borrowing to fund investment may attach a higher probability of default than the 10% that I use, whereas those who believe Elon’s claims that Tesla has entered an era of positive earnings and cash flows, may decide that Tesla has no risk of failure any more:
The ValuationI have created a front end for my Tesla valuation spreadsheet that allows the choices you made to drive the valuation. Running through the different combinations for the four variables, I have too many to list individually, but consider a subset in this table:
 Download spreadsheetBroadly speaking, there are four broad stories that I have valued here:The Big Auto Story: If your story is that Tesla will emerge from its growth period as one of the largest auto companies in the world (revenues of $100- $300 billion in year 10), with top-tier auto company margins (7.42%), investment efficiency (2.42) and cost of capital (6.94%), the value per share ranges from $106/share (with BMW like revenues) to $227/share (with Daimler-like revenues) to $333/share (with VW/Toyota like revenues).The Techy Auto Company Story: An alternate story is that Tesla is an auto/software/services company with tech company characteristics, giving it higher margins (10.25%) and a higher cost of capital (8.86%). With this story, the value per share ranges from $111/share (with BMW like revenues) to $212/share (with Daimler-like revenues) to $298/share (with VW/Toyota like revenues). Put simply, the higher risk nullifies the benefits of higher profitability.The FAANGy Auto Company: In this variant of the tech story, Tesla not only develops a tech twist, but becomes as successful as the most successful tech companies (I use the FAANG stocks + Microsoft). In this story, the margins approach 18.97% and with a tech cost of capital, the value per share ranges from $459/share (with BMW like revenues) to $855/share (with Daimler-like revenues) to $2,106/share (with VW/Toyota like revenues).The Make-your-best Company: In this variant, I give Tesla the best possible outcomes on each variable, revenues like VW/Toyota, margins like pure software companies (21.24%), a sales to capital ratio that is higher than any of the sector averages (4.00) and a cost of capital of an auto company (6.94%), and arrive at a value per share of $2106.For some of you, the fact that there is a value here that justifies whatever your Tesla status is right now (long, short or just watching) should not be the end of your analysis. Each of these stories may be possible, but the tests you have to run, and I will prejudge your conclusions, is whether they are plausible. With each story, there are key questions that need answering:
With the big auto stories, the key question will be whether Tesla can climb to the very top of the heap in terms of revenues, generally reserved for mass market companies, while earning operating margins that are usually reserved for smaller luxury auto companies?With the techy auto stories, the key question becomes whether a company that derives the bulk of its revenues from selling cars be profitable and reinvest like a tech company? With the FAANGy stories, the investment question becomes whether you should up front for a company on the expectation that it will be an exceptional company. It very well might make it to the top of the heap, but if it does not, you are set up for disappointment.With the MYB story, you are approaching the most dangerous place in valuation, where you pick and choose each assumption, without considering the ones you have already made. Put simply, is it even possible to build a company that generates revenues like Toyota, earns margins like Microsoft and invests more efficiently than any manufacturing company in history has ever done, while still preserving the low cost of capital of an auto company?ConclusionIn the week since I sold Tesla at $640, the stock has gone on a wild ride, rising above $900 in two trading days. Not surprisingly, quite a few of you have asked me whether I have any regrets about selling too early. You may not believe me, but I don't. I made my decision to buy, based on my story and valuation for Tesla, and my decision to sell, for the same reason, because I am an investor who believes in value, and acting on it. If I abandon that philosophy to play the momentum game, a game that I am not good at and don’t really play well, I may make a bit more money, but at what cost? On a different note, I have to confess that one reason that I write about Tesla reluctantly is the vitriol that seems to be part of any discussion of the stock. In a world where we face unbridgeable divides on politics, religion and culture, do we need to add investing to the mix? If you stayed with your Tesla investment, I wish you the best, and I hope that you are holding on for the right reasons, either because you believe that its value is much higher or because you are playing the pricing game. If you sold short and lost money, I get no joy out of your losses and no inclination to do a celebratory dance. For the moment, you may have lost, but having watched this stock for as long as I have, that can change in a minute. As far as I am concerned, Tesla is a fascinating company, but it is just an investment, not a matter of life or death, and definitely not worth losing sleep, and friends, over.
YouTube Video
Spreadsheet
A Do-it-Yourself Valuation of Tesla<!-- /* Style Definitions */ p.MsoNormal, li.MsoNormal, div.MsoNormal {mso-style-unhide:no; mso-style-qformat:yes; mso-style-parent:""; margin:0in; margin-bottom:.0001pt; mso-pagination:widow-orphan; font-size:12.0pt; font-family:"Calibri",sans-serif; mso-ascii-font-family:Calibri; mso-ascii-theme-font:minor-latin; mso-fareast-font-family:Calibri; mso-fareast-theme-font:minor-latin; mso-hansi-font-family:Calibri; mso-hansi-theme-font:minor-latin; mso-bidi-font-family:"Times New Roman"; mso-bidi-theme-font:minor-bidi;} p.MsoListParagraph, li.MsoListParagraph, div.MsoListParagraph {mso-style-priority:34; mso-style-unhide:no; mso-style-qformat:yes; margin-top:0in; margin-right:0in; margin-bottom:0in; margin-left:.5in; margin-bottom:.0001pt; mso-add-space:auto; mso-pagination:widow-orphan; font-size:12.0pt; font-family:"Calibri",sans-serif; mso-ascii-font-family:Calibri; mso-ascii-theme-font:minor-latin; mso-fareast-font-family:Calibri; mso-fareast-theme-font:minor-latin; mso-hansi-font-family:Calibri; mso-hansi-theme-font:minor-latin; mso-bidi-font-family:"Times New Roman"; mso-bidi-theme-font:minor-bidi;} p.MsoListParagraphCxSpFirst, li.MsoListParagraphCxSpFirst, div.MsoListParagraphCxSpFirst {mso-style-priority:34; mso-style-unhide:no; mso-style-qformat:yes; mso-style-type:export-only; margin-top:0in; margin-right:0in; margin-bottom:0in; margin-left:.5in; margin-bottom:.0001pt; mso-add-space:auto; mso-pagination:widow-orphan; font-size:12.0pt; font-family:"Calibri",sans-serif; mso-ascii-font-family:Calibri; mso-ascii-theme-font:minor-latin; mso-fareast-font-family:Calibri; mso-fareast-theme-font:minor-latin; mso-hansi-font-family:Calibri; mso-hansi-theme-font:minor-latin; mso-bidi-font-family:"Times New Roman"; mso-bidi-theme-font:minor-bidi;} p.MsoListParagraphCxSpMiddle, li.MsoListParagraphCxSpMiddle, div.MsoListParagraphCxSpMiddle {mso-style-priority:34; mso-style-unhide:no; mso-style-qformat:yes; mso-style-type:export-only; margin-top:0in; margin-right:0in; margin-bottom:0in; margin-left:.5in; margin-bottom:.0001pt; mso-add-space:auto; mso-pagination:widow-orphan; font-size:12.0pt; font-family:"Calibri",sans-serif; mso-ascii-font-family:Calibri; mso-ascii-theme-font:minor-latin; mso-fareast-font-family:Calibri; mso-fareast-theme-font:minor-latin; mso-hansi-font-family:Calibri; mso-hansi-theme-font:minor-latin; mso-bidi-font-family:"Times New Roman"; mso-bidi-theme-font:minor-bidi;} p.MsoListParagraphCxSpLast, li.MsoListParagraphCxSpLast, div.MsoListParagraphCxSpLast {mso-style-priority:34; mso-style-unhide:no; mso-style-qformat:yes; mso-style-type:export-only; margin-top:0in; margin-right:0in; margin-bottom:0in; margin-left:.5in; margin-bottom:.0001pt; mso-add-space:auto; mso-pagination:widow-orphan; font-size:12.0pt; font-family:"Calibri",sans-serif; mso-ascii-font-family:Calibri; mso-ascii-theme-font:minor-latin; mso-fareast-font-family:Calibri; mso-fareast-theme-font:minor-latin; mso-hansi-font-family:Calibri; mso-hansi-theme-font:minor-latin; mso-bidi-font-family:"Times New Roman"; mso-bidi-theme-font:minor-bidi;} .MsoChpDefault {mso-style-type:export-only; mso-default-props:yes; font-family:"Calibri",sans-serif; mso-ascii-font-family:Calibri; mso-ascii-theme-font:minor-latin; mso-fareast-font-family:Calibri; mso-fareast-theme-font:minor-latin; mso-hansi-font-family:Calibri; mso-hansi-theme-font:minor-latin; mso-bidi-font-family:"Times New Roman"; mso-bidi-theme-font:minor-bidi;} @page WordSection1 {size:8.5in 11.0in; margin:1.0in 1.0in 1.0in 1.0in; mso-header-margin:.5in; mso-footer-margin:.5in; mso-paper-source:0;} div.WordSection1 {page:WordSection1;} /* List Definitions */ @list l0 {mso-list-id:177545795; mso-list-type:hybrid; mso-list-template-ids:326645010 67698689 67698691 67698693 67698689 67698691 67698693 67698689 67698691 67698693;} @list l0:level1 {mso-level-number-format:bullet; mso-level-text:; mso-level-tab-stop:none; mso-level-number-position:left; text-indent:-.25in; font-family:Symbol;} @list l0:level2 {mso-level-number-format:bullet; mso-level-text:o; mso-level-tab-stop:none; mso-level-number-position:left; text-indent:-.25in; font-family:"Courier New";} @list l0:level3 {mso-level-number-format:bullet; mso-level-text:; mso-level-tab-stop:none; mso-level-number-position:left; text-indent:-.25in; font-family:Wingdings;} @list l0:level4 {mso-level-number-format:bullet; mso-level-text:; mso-level-tab-stop:none; mso-level-number-position:left; text-indent:-.25in; font-family:Symbol;} @list l0:level5 {mso-level-number-format:bullet; mso-level-text:o; mso-level-tab-stop:none; mso-level-number-position:left; text-indent:-.25in; font-family:"Courier New";} @list l0:level6 {mso-level-number-format:bullet; mso-level-text:; mso-level-tab-stop:none; mso-level-number-position:left; text-indent:-.25in; font-family:Wingdings;} @list l0:level7 {mso-level-number-format:bullet; mso-level-text:; mso-level-tab-stop:none; mso-level-number-position:left; text-indent:-.25in; font-family:Symbol;} @list l0:level8 {mso-level-number-format:bullet; mso-level-text:o; mso-level-tab-stop:none; mso-level-number-position:left; text-indent:-.25in; font-family:"Courier New";} @list l0:level9 {mso-level-number-format:bullet; mso-level-text:; mso-level-tab-stop:none; mso-level-number-position:left; text-indent:-.25in; font-family:Wingdings;} @list l1 {mso-list-id:441653939; mso-list-type:hybrid; mso-list-template-ids:894629348 67698703 67698713 67698715 67698703 67698713 67698715 67698703 67698713 67698715;} @list l1:level1 {mso-level-tab-stop:none; mso-level-number-position:left; text-indent:-.25in;} @list l1:level2 {mso-level-number-format:alpha-lower; mso-level-tab-stop:none; mso-level-number-position:left; text-indent:-.25in;} @list l1:level3 {mso-level-number-format:roman-lower; mso-level-tab-stop:none; mso-level-number-position:right; text-indent:-9.0pt;} @list l1:level4 {mso-level-tab-stop:none; mso-level-number-position:left; text-indent:-.25in;} @list l1:level5 {mso-level-number-format:alpha-lower; mso-level-tab-stop:none; mso-level-number-position:left; text-indent:-.25in;} @list l1:level6 {mso-level-number-format:roman-lower; mso-level-tab-stop:none; mso-level-number-position:right; text-indent:-9.0pt;} @list l1:level7 {mso-level-tab-stop:none; mso-level-number-position:left; text-indent:-.25in;} @list l1:level8 {mso-level-number-format:alpha-lower; mso-level-tab-stop:none; mso-level-number-position:left; text-indent:-.25in;} @list l1:level9 {mso-level-number-format:roman-lower; mso-level-tab-stop:none; mso-level-number-position:right; text-indent:-9.0pt;} </style></div></div>-->
January 30, 2020
An Ode to Luck: Revisiting my Tesla Valuation
When investing, I am often my own biggest adversary, handicapped by the preconceptions and priors that I bring into analysis and decision making, and no company epitomizes the dangers of bias more than Tesla. It is a company where there is no middle ground, with the optimists believing that there is no limit to its potential and the pessimists convinced that it is a time bomb, destined to implode. I have tried, without much luck, to navigate the middle ground in my valuations of the company and have been found wanting by both sides. For much of Tesla’s life, I have pointed to its promise but argued that it was too richly priced to be a good investment, and during that period, Tesla bulls accused me of working for the short sellers. They did not believe me when I argued that you could like a company for its vision and potential, and not like it as an investment. When I bought Tesla in June 2019, arguing that the price had dropped enough (to $180) to make it a good investment, they became my allies, but that decision led to a backlash from Tesla bears, who labeled me a traitor for abandoning my position, again not accepting my argument that at the right price, I would buy any company. I would love to chalk it to my expert timing, but luck was on my side, the momentum shifted right after I bought, and the stock has not stopped rising since. When Tesla’s earnings reported its earnings yesterday (January 29th), the stock was trading at $581, before jumping to $650 in after-market trading. It is time to revisit my valuation and reassess my holding!
Tesla in June 2019: A Story Stock loses its story!It was in June 2019 just over seven months ago, when the sky was full of dark clouds for Tesla, as a collection of wounds, some internal and others external had pushed the stock price down more than 40% in a few months, that I took a look at the company and valued it at just over $190 per share: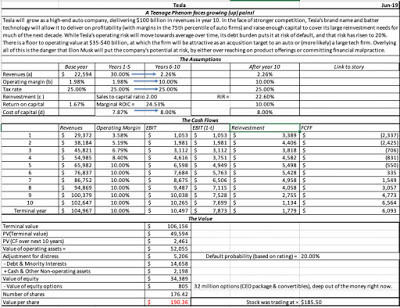 Download spreadsheetIn arriving at this value, I told a story of a company that would grow to deliver $100 billion in revenues in a decade, while also earning a 10% pre-tax operating margin. One concern that I had at the time was that the debt load for the company, in conjunction with operating losses and a loss of access to new capital, would expose the company to a risk of default; I estimated a 20% probability that Tesla would not survive. At the time that I wrote the post, I posted a limit order to buy the stock at a $180 stock price, and when it executed a short while later, some of you pointed out that I was not giving myself much margin of safety. I argued that the distribution of Tesla value outcomes gave me a much larger chance of upside than downside. At the time of the investment, I also described the company as a corporate teenager, with lots of potential but a frustrating practice of risking it all for distractions.
A Story Update, through January 2020When I bought Tesla, I had no indication that it had hit bottom. In fact, given how strongly momentum and mood had shifted against the stock, I expected to lose money first, before any recovery would kick in, and I certainly did not expect a swift return on my investment. The market, of course, had its own plans for Tesla and the stock’s performance since the time I bought it is in the graph below: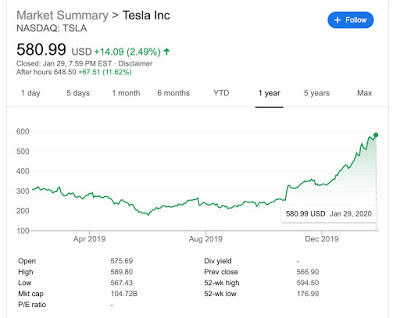
One of my concerns, as an investor, is that I can sometimes mistake dumb luck for skill, but in this case, I am operating under illusions. The timing on this investment was pure luck, but I am not complaining. What happened to cause the turnaround. There were three factors that fed into the upward spiral in the stock price:Return to growth: In the middle of 2019, Tesla’s growth seemed to have run out of steam and there were some who believed that its best days were behind it. In the two quarters since, Tesla has shown signs of growth, albeit not at the breakneck pace that you saw it grow, earlier in its life.Operating improvements: One of Tesla’s weaknesses has been an inability to deliver on time and maintain anything resembling an efficient supply chain. In the second half of 2019, Tesla seemed to be paying attention to its weakest link, focusing on producing and delivering cars, without drama, and even running ahead of schedule on new capacity that it was adding in Shanghai.Radio Silence: I know that this will sound petty to Musk fans, but Elon Musk has always been a mixed blessing for the company. While his vision has been central to building the company, he has also made it a practice of creating diversions that take people’s attention away from the story line. He has also had a history of pre-empting operating decisions with rash missives (pricing the Tesla 3 at $35,000 and producing 5,000 cars/week) that led to operating and credibility problems for the company. Musk has been quieter and more focused of late, and the last six months have been blessedly free of distractions, allowing investors to focus on the Tesla story.In earlier posts, I have drawn a distinction between the value of a stock and its price, noting that traders play the pricing game (trying to gauge momentum and shifts) and investors play the value game, where they invest based upon value, hoping for price convergence. While price and value are driven by different factors, in the case of Tesla, there is a feedback effect from price to value because of (a) its high debt obligations and (b) its need for more capital to fund its growth. As stock prices rise, the debt obligation becomes less onerous for two reasons. First, some of it is convertible debt, at high enough stock prices, it gets converted to equity. Second, Tesla’s capacity to raise new equity at high stock prices gives it a fall back that it can use, if it chooses to pay down debt. By the same token, the number of shares that Tesla will need to issue to cover its funding needs, as it grows, will decrease as the stock price rises, reducing their dilution effect on value.
Valuing Tesla in January 2020There have been three earnings reports from Tesla since my June 2019 report, and the table below shows how the base year numbers have shifted, as a consequence: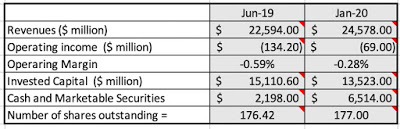 Tesla Quarterly Reports & Earnings Call on January 29, 2020The base revenues have increased by about 9%, and operating margins continued to get less negative (turning positive in the last quarter of the year), as long-promised economies of scale finally manifested themselves. In the table below, I highlight the changes that I have made in key inputs relating to growth, profitability and reinvestment.
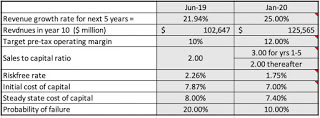 Download spreadsheetSpecifically, here is what I changed:Higher end revenues: My revenue growth rate, while only marginally higher than the growth rate I used in June 2019, delivers revenues of just above $125 billion in 2030, about 25% higher than the end revenues that I forecast a year ago. Since this will require that Tesla sell more than 2 million cars in 2030, I am not making this assumption lightly.Higher margins: My target pre-tax operating margin has also been pushed up from 10% to 12%, reflecting the improvements in margins that the company has already delivered and an expectation that the company will continue to work on a more efficient production model than conventional automakers. More efficient reinvestment: My reinvestment assumptions for the long term resemble those that I made in June, with every dollar in invested capital delivering $2 in revenues, as the company adds capacity. In the near term, though, I assume less reinvestment, assuming $3 in revenues for every new dollar of capital invested, since Tesla contends in its January 2020 earnings call to have capacity online to produce 640,000 cars, enough to cover growth for the next year or two.If you are surprised about the lower cost of capital in January 2020, that drop has little to do with Tesla and more to do with changes in the market. First, the US treasury bond rate has dropped to 1.75% from 2.26% in June 2019, creating a lower base for both the costs of equity and debt for the company. Second, while Tesla’s bond rating has not improved dramatically, default spreads on bonds have dropped over the course of the year. Finally, the price feedback effect has silenced talk about imminent default, but I understand that a momentum shift and a lower stock price can rekindle it, and I have halved the probability of default. With this more upbeat story, the value that I get per share for Tesla is $427, and the details are shown below:
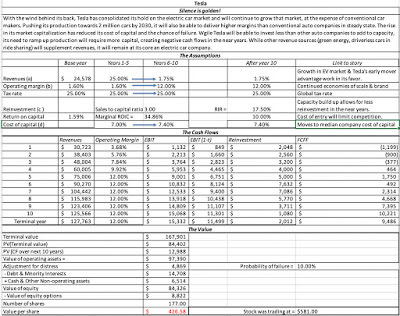 Download spreadsheetIf your criticism of this valuation is that I am letting the good times in the stock feed into my intrinsic value estimate, I am guilty as charged, but I have never been able to completely ignore what markets are doing, when doing intrinsic value. To see how each assumption that I have altered feeds into the value, I broke down the value change into constituent pieces.
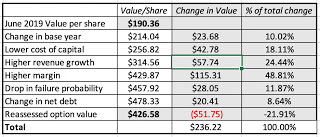 The biggest increase in value comes from increasing the margin, accounting for a little bit more than half of the value change, followed by higher revenue growth and then by lower costs of capital. Note that the firm’s debt load magnifies the effects of changes in the value of operating assets on equity value, and the options that had dropped in value with the stock price in June 2019, are reasserting their role as a drain on value. If there is a lesson that I would take away from this table, it is that the key debate that we should be having on Tesla is not about whether it can grow. Given the size of the auto market, and the shift towards electric cars, the growth is both possible and plausible. It is about the margins that Tesla can command, once it becomes a mature company, which in turn requires an assessment of what the auto market will look like a decade from now. If you believe that an electric car is an automobile first, and electric next, it will be difficult to reach and sustain double-digit operating margins, if you are not a niche auto company. If, in contrast, your view is that the electric car market will be viewed as an electronic or tech product, you may be able to justify higher margins.
What now?In the interests of transparency, I should start with a confession. I went into this valuation wanting to hold on to Tesla for a little while longer, partly because it has done so well for me (and it tough to let winners go, when they are still winning) but mostly because at a 7-month holding period, selling it now will expose me to a fairly hefty tax liability; short-term capital gains (less than a one-year holding period) are taxed at my ordinary tax rate and long term capital gains (greater than a year holding period) are taxed at a 20% lower rate. This desire to derive a higher value for Tesla (to justify continuing to hold it) may be driving the optimism in my assumptions in the last section, but even with those optimistic assumptions, my value per share of $427 was well below the closing price of $581 at the end of trading and even further below the $650 that Tesla was trading at after the earnings release. Could tweaking the assumptions give me a value higher than the price? Of course! I could raise my end year revenues to $200 billion ( plausible in a market this size) and give Tesla an 18% operating margin (perhaps by calling it a tech company) and arrive at a value of $ 1,168 per share, but that to me is pushing the limits of possibility, and one reason why I hold back on simple what-if analyses. A Monte Carlo simulation allows for a more complete assessment of uncertainty and in the table below, I vary four key assumptions (revenue growth, target margin, reinvestment efficiency and cost of capital) to arrive at a value distribution for Tesla: Simulation ResultsAt the price of $650/share, post-earnings report, Tesla is close to the 90th percentile of my value distribution. While it possible that Tesla could be worth more than $650, it is neither plausible nor probable, at least based on my assumptions.
A Post ScriptHolding on to the hope that I could defer my sale of Tesla until June (to qualify for long term capital gains), I looked at buying puts to protect my capital gains, but that pathway is an expensive one at Tesla, given how much volatility is priced into the options. Reluctantly, I sold my Tesla holdings at $640 this morning, and as with my buy order in June, I don’t expect immediate or even near-term gratification. The momentum is strong, and the mood is delirious, implying that Tesla’s stock price could continue to go up. That said, I am not tempted to stay longer, though, because I came to play the investing game, not the trading game, and gauging momentum is not a skill set that I possess. I will miss the excitement of having Tesla in my portfolio, but I have a feeling that this is more a separation than a permanent parting, and that at the right price, Tesla will return to my portfolio in the future.
YouTube Video
SpreadsheetsMy Valuation of Tesla in June 2019My Valuation of Tesla in January 2020Tesla Simulation (Crystal Ball)Posts on TeslaTwists and Turns in the Tesla Story (June 2018)Tesla's Travails: Curfew for a Corporate Teenager (June 2019)<!-- /* Style Definitions */ p.MsoNormal, li.MsoNormal, div.MsoNormal {mso-style-unhide:no; mso-style-qformat:yes; mso-style-parent:""; margin:0in; margin-bottom:.0001pt; mso-pagination:widow-orphan; font-size:12.0pt; font-family:"Calibri",sans-serif; mso-ascii-font-family:Calibri; mso-ascii-theme-font:minor-latin; mso-fareast-font-family:Calibri; mso-fareast-theme-font:minor-latin; mso-hansi-font-family:Calibri; mso-hansi-theme-font:minor-latin; mso-bidi-font-family:"Times New Roman"; mso-bidi-theme-font:minor-bidi;} p.MsoListParagraph, li.MsoListParagraph, div.MsoListParagraph {mso-style-priority:34; mso-style-unhide:no; mso-style-qformat:yes; margin-top:0in; margin-right:0in; margin-bottom:0in; margin-left:.5in; margin-bottom:.0001pt; mso-add-space:auto; mso-pagination:widow-orphan; font-size:12.0pt; font-family:"Calibri",sans-serif; mso-ascii-font-family:Calibri; mso-ascii-theme-font:minor-latin; mso-fareast-font-family:Calibri; mso-fareast-theme-font:minor-latin; mso-hansi-font-family:Calibri; mso-hansi-theme-font:minor-latin; mso-bidi-font-family:"Times New Roman"; mso-bidi-theme-font:minor-bidi;} p.MsoListParagraphCxSpFirst, li.MsoListParagraphCxSpFirst, div.MsoListParagraphCxSpFirst {mso-style-priority:34; mso-style-unhide:no; mso-style-qformat:yes; mso-style-type:export-only; margin-top:0in; margin-right:0in; margin-bottom:0in; margin-left:.5in; margin-bottom:.0001pt; mso-add-space:auto; mso-pagination:widow-orphan; font-size:12.0pt; font-family:"Calibri",sans-serif; mso-ascii-font-family:Calibri; mso-ascii-theme-font:minor-latin; mso-fareast-font-family:Calibri; mso-fareast-theme-font:minor-latin; mso-hansi-font-family:Calibri; mso-hansi-theme-font:minor-latin; mso-bidi-font-family:"Times New Roman"; mso-bidi-theme-font:minor-bidi;} p.MsoListParagraphCxSpMiddle, li.MsoListParagraphCxSpMiddle, div.MsoListParagraphCxSpMiddle {mso-style-priority:34; mso-style-unhide:no; mso-style-qformat:yes; mso-style-type:export-only; margin-top:0in; margin-right:0in; margin-bottom:0in; margin-left:.5in; margin-bottom:.0001pt; mso-add-space:auto; mso-pagination:widow-orphan; font-size:12.0pt; font-family:"Calibri",sans-serif; mso-ascii-font-family:Calibri; mso-ascii-theme-font:minor-latin; mso-fareast-font-family:Calibri; mso-fareast-theme-font:minor-latin; mso-hansi-font-family:Calibri; mso-hansi-theme-font:minor-latin; mso-bidi-font-family:"Times New Roman"; mso-bidi-theme-font:minor-bidi;} p.MsoListParagraphCxSpLast, li.MsoListParagraphCxSpLast, div.MsoListParagraphCxSpLast {mso-style-priority:34; mso-style-unhide:no; mso-style-qformat:yes; mso-style-type:export-only; margin-top:0in; margin-right:0in; margin-bottom:0in; margin-left:.5in; margin-bottom:.0001pt; mso-add-space:auto; mso-pagination:widow-orphan; font-size:12.0pt; font-family:"Calibri",sans-serif; mso-ascii-font-family:Calibri; mso-ascii-theme-font:minor-latin; mso-fareast-font-family:Calibri; mso-fareast-theme-font:minor-latin; mso-hansi-font-family:Calibri; mso-hansi-theme-font:minor-latin; mso-bidi-font-family:"Times New Roman"; mso-bidi-theme-font:minor-bidi;} .MsoChpDefault {mso-style-type:export-only; mso-default-props:yes; font-family:"Calibri",sans-serif; mso-ascii-font-family:Calibri; mso-ascii-theme-font:minor-latin; mso-fareast-font-family:Calibri; mso-fareast-theme-font:minor-latin; mso-hansi-font-family:Calibri; mso-hansi-theme-font:minor-latin; mso-bidi-font-family:"Times New Roman"; mso-bidi-theme-font:minor-bidi;} @page WordSection1 {size:8.5in 11.0in; margin:1.0in 1.0in 1.0in 1.0in; mso-header-margin:.5in; mso-footer-margin:.5in; mso-paper-source:0;} div.WordSection1 {page:WordSection1;} /* List Definitions */ @list l0 {mso-list-id:1495026935; mso-list-type:hybrid; mso-list-template-ids:688417882 67698703 67698713 67698715 67698703 67698713 67698715 67698703 67698713 67698715;} @list l0:level1 {mso-level-tab-stop:none; mso-level-number-position:left; text-indent:-.25in;} @list l0:level2 {mso-level-number-format:alpha-lower; mso-level-tab-stop:none; mso-level-number-position:left; text-indent:-.25in;} @list l0:level3 {mso-level-number-format:roman-lower; mso-level-tab-stop:none; mso-level-number-position:right; text-indent:-9.0pt;} @list l0:level4 {mso-level-tab-stop:none; mso-level-number-position:left; text-indent:-.25in;} @list l0:level5 {mso-level-number-format:alpha-lower; mso-level-tab-stop:none; mso-level-number-position:left; text-indent:-.25in;} @list l0:level6 {mso-level-number-format:roman-lower; mso-level-tab-stop:none; mso-level-number-position:right; text-indent:-9.0pt;} @list l0:level7 {mso-level-tab-stop:none; mso-level-number-position:left; text-indent:-.25in;} @list l0:level8 {mso-level-number-format:alpha-lower; mso-level-tab-stop:none; mso-level-number-position:left; text-indent:-.25in;} @list l0:level9 {mso-level-number-format:roman-lower; mso-level-tab-stop:none; mso-level-number-position:right; text-indent:-9.0pt;} @list l1 {mso-list-id:1633443701; mso-list-type:hybrid; mso-list-template-ids:-895182196 67698689 67698691 67698693 67698689 67698691 67698693 67698689 67698691 67698693;} @list l1:level1 {mso-level-number-format:bullet; mso-level-text:; mso-level-tab-stop:none; mso-level-number-position:left; text-indent:-.25in; font-family:Symbol;} @list l1:level2 {mso-level-number-format:bullet; mso-level-text:o; mso-level-tab-stop:none; mso-level-number-position:left; text-indent:-.25in; font-family:"Courier New";} @list l1:level3 {mso-level-number-format:bullet; mso-level-text:; mso-level-tab-stop:none; mso-level-number-position:left; text-indent:-.25in; font-family:Wingdings;} @list l1:level4 {mso-level-number-format:bullet; mso-level-text:; mso-level-tab-stop:none; mso-level-number-position:left; text-indent:-.25in; font-family:Symbol;} @list l1:level5 {mso-level-number-format:bullet; mso-level-text:o; mso-level-tab-stop:none; mso-level-number-position:left; text-indent:-.25in; font-family:"Courier New";} @list l1:level6 {mso-level-number-format:bullet; mso-level-text:; mso-level-tab-stop:none; mso-level-number-position:left; text-indent:-.25in; font-family:Wingdings;} @list l1:level7 {mso-level-number-format:bullet; mso-level-text:; mso-level-tab-stop:none; mso-level-number-position:left; text-indent:-.25in; font-family:Symbol;} @list l1:level8 {mso-level-number-format:bullet; mso-level-text:o; mso-level-tab-stop:none; mso-level-number-position:left; text-indent:-.25in; font-family:"Courier New";} @list l1:level9 {mso-level-number-format:bullet; mso-level-text:; mso-level-tab-stop:none; mso-level-number-position:left; text-indent:-.25in; font-family:Wingdings;} </style> --><br /><div class="MsoNormal" style="font-size: medium; text-align: justify;"><br /></div></div>
Tesla in June 2019: A Story Stock loses its story!It was in June 2019 just over seven months ago, when the sky was full of dark clouds for Tesla, as a collection of wounds, some internal and others external had pushed the stock price down more than 40% in a few months, that I took a look at the company and valued it at just over $190 per share:
 Download spreadsheetIn arriving at this value, I told a story of a company that would grow to deliver $100 billion in revenues in a decade, while also earning a 10% pre-tax operating margin. One concern that I had at the time was that the debt load for the company, in conjunction with operating losses and a loss of access to new capital, would expose the company to a risk of default; I estimated a 20% probability that Tesla would not survive. At the time that I wrote the post, I posted a limit order to buy the stock at a $180 stock price, and when it executed a short while later, some of you pointed out that I was not giving myself much margin of safety. I argued that the distribution of Tesla value outcomes gave me a much larger chance of upside than downside. At the time of the investment, I also described the company as a corporate teenager, with lots of potential but a frustrating practice of risking it all for distractions.
A Story Update, through January 2020When I bought Tesla, I had no indication that it had hit bottom. In fact, given how strongly momentum and mood had shifted against the stock, I expected to lose money first, before any recovery would kick in, and I certainly did not expect a swift return on my investment. The market, of course, had its own plans for Tesla and the stock’s performance since the time I bought it is in the graph below:

One of my concerns, as an investor, is that I can sometimes mistake dumb luck for skill, but in this case, I am operating under illusions. The timing on this investment was pure luck, but I am not complaining. What happened to cause the turnaround. There were three factors that fed into the upward spiral in the stock price:Return to growth: In the middle of 2019, Tesla’s growth seemed to have run out of steam and there were some who believed that its best days were behind it. In the two quarters since, Tesla has shown signs of growth, albeit not at the breakneck pace that you saw it grow, earlier in its life.Operating improvements: One of Tesla’s weaknesses has been an inability to deliver on time and maintain anything resembling an efficient supply chain. In the second half of 2019, Tesla seemed to be paying attention to its weakest link, focusing on producing and delivering cars, without drama, and even running ahead of schedule on new capacity that it was adding in Shanghai.Radio Silence: I know that this will sound petty to Musk fans, but Elon Musk has always been a mixed blessing for the company. While his vision has been central to building the company, he has also made it a practice of creating diversions that take people’s attention away from the story line. He has also had a history of pre-empting operating decisions with rash missives (pricing the Tesla 3 at $35,000 and producing 5,000 cars/week) that led to operating and credibility problems for the company. Musk has been quieter and more focused of late, and the last six months have been blessedly free of distractions, allowing investors to focus on the Tesla story.In earlier posts, I have drawn a distinction between the value of a stock and its price, noting that traders play the pricing game (trying to gauge momentum and shifts) and investors play the value game, where they invest based upon value, hoping for price convergence. While price and value are driven by different factors, in the case of Tesla, there is a feedback effect from price to value because of (a) its high debt obligations and (b) its need for more capital to fund its growth. As stock prices rise, the debt obligation becomes less onerous for two reasons. First, some of it is convertible debt, at high enough stock prices, it gets converted to equity. Second, Tesla’s capacity to raise new equity at high stock prices gives it a fall back that it can use, if it chooses to pay down debt. By the same token, the number of shares that Tesla will need to issue to cover its funding needs, as it grows, will decrease as the stock price rises, reducing their dilution effect on value.
Valuing Tesla in January 2020There have been three earnings reports from Tesla since my June 2019 report, and the table below shows how the base year numbers have shifted, as a consequence:
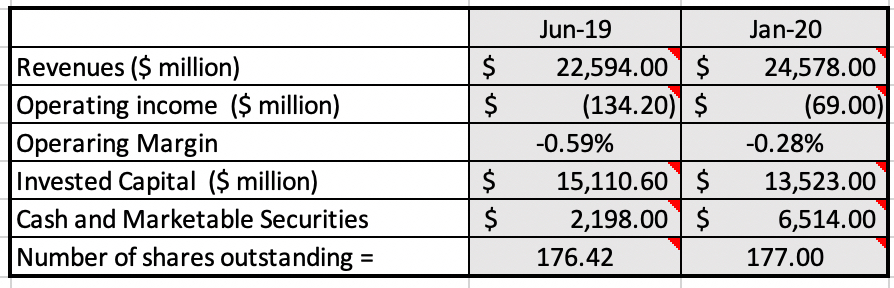 Tesla Quarterly Reports & Earnings Call on January 29, 2020The base revenues have increased by about 9%, and operating margins continued to get less negative (turning positive in the last quarter of the year), as long-promised economies of scale finally manifested themselves. In the table below, I highlight the changes that I have made in key inputs relating to growth, profitability and reinvestment.
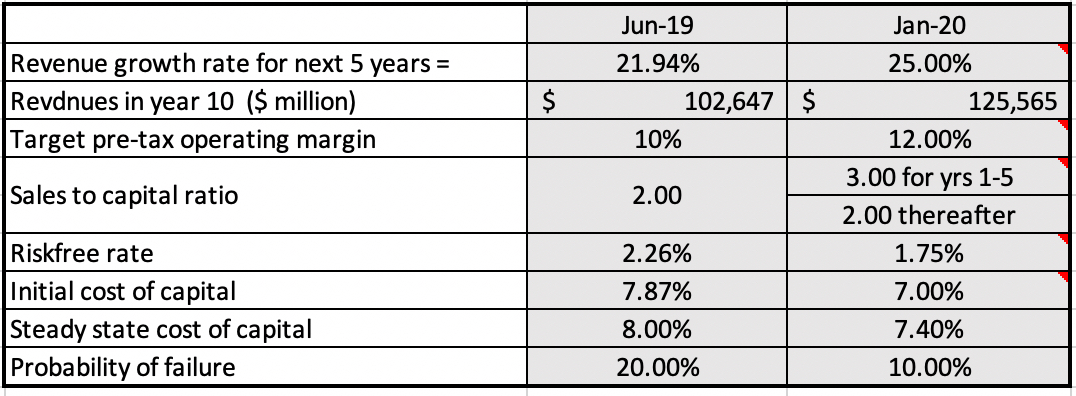 Download spreadsheetSpecifically, here is what I changed:Higher end revenues: My revenue growth rate, while only marginally higher than the growth rate I used in June 2019, delivers revenues of just above $125 billion in 2030, about 25% higher than the end revenues that I forecast a year ago. Since this will require that Tesla sell more than 2 million cars in 2030, I am not making this assumption lightly.Higher margins: My target pre-tax operating margin has also been pushed up from 10% to 12%, reflecting the improvements in margins that the company has already delivered and an expectation that the company will continue to work on a more efficient production model than conventional automakers. More efficient reinvestment: My reinvestment assumptions for the long term resemble those that I made in June, with every dollar in invested capital delivering $2 in revenues, as the company adds capacity. In the near term, though, I assume less reinvestment, assuming $3 in revenues for every new dollar of capital invested, since Tesla contends in its January 2020 earnings call to have capacity online to produce 640,000 cars, enough to cover growth for the next year or two.If you are surprised about the lower cost of capital in January 2020, that drop has little to do with Tesla and more to do with changes in the market. First, the US treasury bond rate has dropped to 1.75% from 2.26% in June 2019, creating a lower base for both the costs of equity and debt for the company. Second, while Tesla’s bond rating has not improved dramatically, default spreads on bonds have dropped over the course of the year. Finally, the price feedback effect has silenced talk about imminent default, but I understand that a momentum shift and a lower stock price can rekindle it, and I have halved the probability of default. With this more upbeat story, the value that I get per share for Tesla is $427, and the details are shown below:
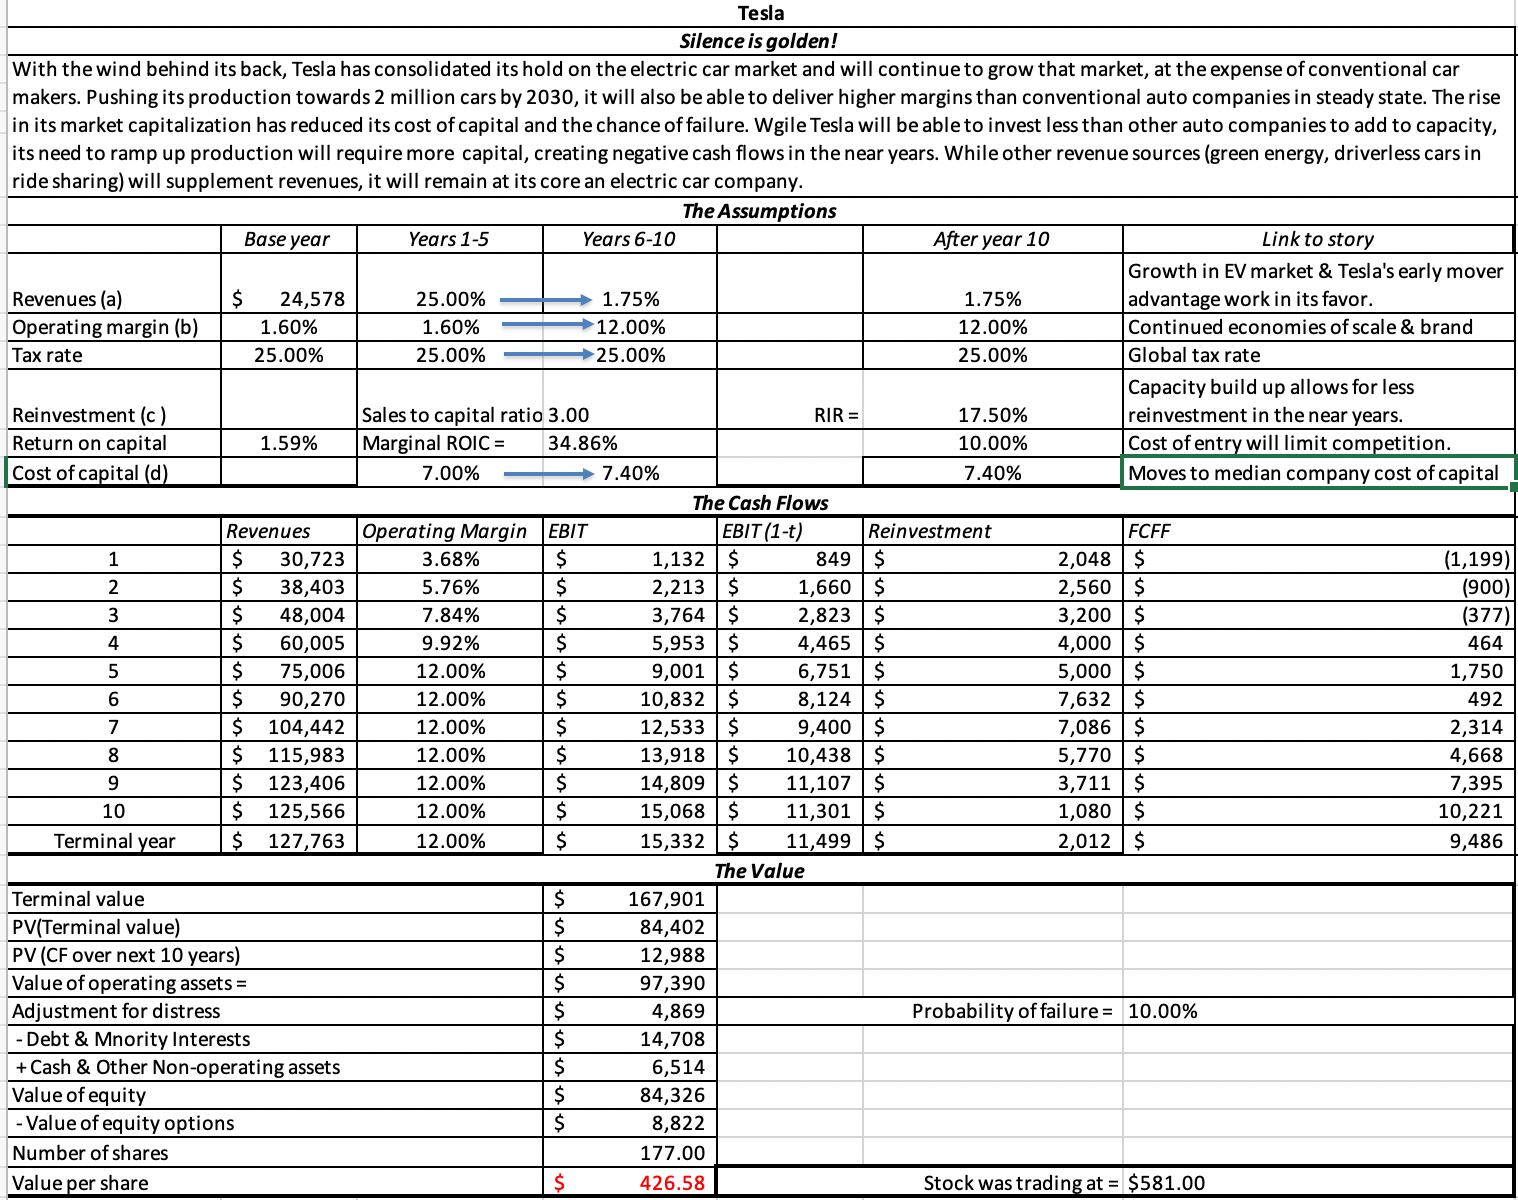 Download spreadsheetIf your criticism of this valuation is that I am letting the good times in the stock feed into my intrinsic value estimate, I am guilty as charged, but I have never been able to completely ignore what markets are doing, when doing intrinsic value. To see how each assumption that I have altered feeds into the value, I broke down the value change into constituent pieces.
 The biggest increase in value comes from increasing the margin, accounting for a little bit more than half of the value change, followed by higher revenue growth and then by lower costs of capital. Note that the firm’s debt load magnifies the effects of changes in the value of operating assets on equity value, and the options that had dropped in value with the stock price in June 2019, are reasserting their role as a drain on value. If there is a lesson that I would take away from this table, it is that the key debate that we should be having on Tesla is not about whether it can grow. Given the size of the auto market, and the shift towards electric cars, the growth is both possible and plausible. It is about the margins that Tesla can command, once it becomes a mature company, which in turn requires an assessment of what the auto market will look like a decade from now. If you believe that an electric car is an automobile first, and electric next, it will be difficult to reach and sustain double-digit operating margins, if you are not a niche auto company. If, in contrast, your view is that the electric car market will be viewed as an electronic or tech product, you may be able to justify higher margins.
What now?In the interests of transparency, I should start with a confession. I went into this valuation wanting to hold on to Tesla for a little while longer, partly because it has done so well for me (and it tough to let winners go, when they are still winning) but mostly because at a 7-month holding period, selling it now will expose me to a fairly hefty tax liability; short-term capital gains (less than a one-year holding period) are taxed at my ordinary tax rate and long term capital gains (greater than a year holding period) are taxed at a 20% lower rate. This desire to derive a higher value for Tesla (to justify continuing to hold it) may be driving the optimism in my assumptions in the last section, but even with those optimistic assumptions, my value per share of $427 was well below the closing price of $581 at the end of trading and even further below the $650 that Tesla was trading at after the earnings release. Could tweaking the assumptions give me a value higher than the price? Of course! I could raise my end year revenues to $200 billion ( plausible in a market this size) and give Tesla an 18% operating margin (perhaps by calling it a tech company) and arrive at a value of $ 1,168 per share, but that to me is pushing the limits of possibility, and one reason why I hold back on simple what-if analyses. A Monte Carlo simulation allows for a more complete assessment of uncertainty and in the table below, I vary four key assumptions (revenue growth, target margin, reinvestment efficiency and cost of capital) to arrive at a value distribution for Tesla:
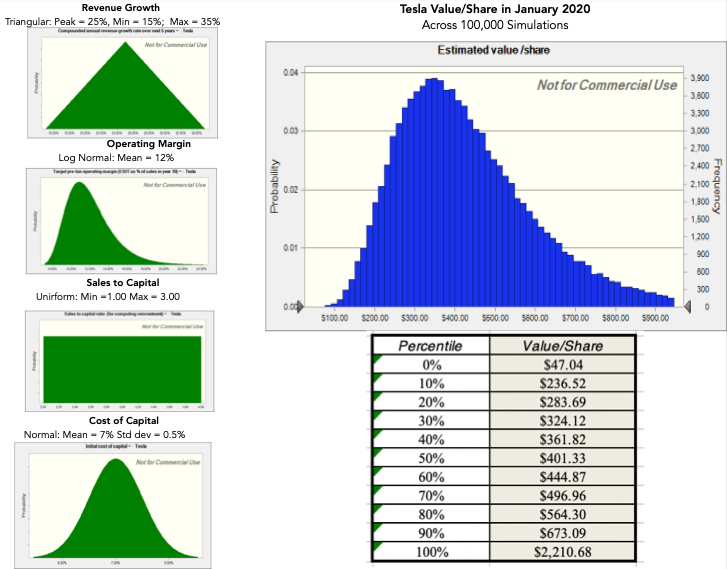 Simulation ResultsAt the price of $650/share, post-earnings report, Tesla is close to the 90th percentile of my value distribution. While it possible that Tesla could be worth more than $650, it is neither plausible nor probable, at least based on my assumptions.
A Post ScriptHolding on to the hope that I could defer my sale of Tesla until June (to qualify for long term capital gains), I looked at buying puts to protect my capital gains, but that pathway is an expensive one at Tesla, given how much volatility is priced into the options. Reluctantly, I sold my Tesla holdings at $640 this morning, and as with my buy order in June, I don’t expect immediate or even near-term gratification. The momentum is strong, and the mood is delirious, implying that Tesla’s stock price could continue to go up. That said, I am not tempted to stay longer, though, because I came to play the investing game, not the trading game, and gauging momentum is not a skill set that I possess. I will miss the excitement of having Tesla in my portfolio, but I have a feeling that this is more a separation than a permanent parting, and that at the right price, Tesla will return to my portfolio in the future.
YouTube Video
SpreadsheetsMy Valuation of Tesla in June 2019My Valuation of Tesla in January 2020Tesla Simulation (Crystal Ball)Posts on TeslaTwists and Turns in the Tesla Story (June 2018)Tesla's Travails: Curfew for a Corporate Teenager (June 2019)<!-- /* Style Definitions */ p.MsoNormal, li.MsoNormal, div.MsoNormal {mso-style-unhide:no; mso-style-qformat:yes; mso-style-parent:""; margin:0in; margin-bottom:.0001pt; mso-pagination:widow-orphan; font-size:12.0pt; font-family:"Calibri",sans-serif; mso-ascii-font-family:Calibri; mso-ascii-theme-font:minor-latin; mso-fareast-font-family:Calibri; mso-fareast-theme-font:minor-latin; mso-hansi-font-family:Calibri; mso-hansi-theme-font:minor-latin; mso-bidi-font-family:"Times New Roman"; mso-bidi-theme-font:minor-bidi;} p.MsoListParagraph, li.MsoListParagraph, div.MsoListParagraph {mso-style-priority:34; mso-style-unhide:no; mso-style-qformat:yes; margin-top:0in; margin-right:0in; margin-bottom:0in; margin-left:.5in; margin-bottom:.0001pt; mso-add-space:auto; mso-pagination:widow-orphan; font-size:12.0pt; font-family:"Calibri",sans-serif; mso-ascii-font-family:Calibri; mso-ascii-theme-font:minor-latin; mso-fareast-font-family:Calibri; mso-fareast-theme-font:minor-latin; mso-hansi-font-family:Calibri; mso-hansi-theme-font:minor-latin; mso-bidi-font-family:"Times New Roman"; mso-bidi-theme-font:minor-bidi;} p.MsoListParagraphCxSpFirst, li.MsoListParagraphCxSpFirst, div.MsoListParagraphCxSpFirst {mso-style-priority:34; mso-style-unhide:no; mso-style-qformat:yes; mso-style-type:export-only; margin-top:0in; margin-right:0in; margin-bottom:0in; margin-left:.5in; margin-bottom:.0001pt; mso-add-space:auto; mso-pagination:widow-orphan; font-size:12.0pt; font-family:"Calibri",sans-serif; mso-ascii-font-family:Calibri; mso-ascii-theme-font:minor-latin; mso-fareast-font-family:Calibri; mso-fareast-theme-font:minor-latin; mso-hansi-font-family:Calibri; mso-hansi-theme-font:minor-latin; mso-bidi-font-family:"Times New Roman"; mso-bidi-theme-font:minor-bidi;} p.MsoListParagraphCxSpMiddle, li.MsoListParagraphCxSpMiddle, div.MsoListParagraphCxSpMiddle {mso-style-priority:34; mso-style-unhide:no; mso-style-qformat:yes; mso-style-type:export-only; margin-top:0in; margin-right:0in; margin-bottom:0in; margin-left:.5in; margin-bottom:.0001pt; mso-add-space:auto; mso-pagination:widow-orphan; font-size:12.0pt; font-family:"Calibri",sans-serif; mso-ascii-font-family:Calibri; mso-ascii-theme-font:minor-latin; mso-fareast-font-family:Calibri; mso-fareast-theme-font:minor-latin; mso-hansi-font-family:Calibri; mso-hansi-theme-font:minor-latin; mso-bidi-font-family:"Times New Roman"; mso-bidi-theme-font:minor-bidi;} p.MsoListParagraphCxSpLast, li.MsoListParagraphCxSpLast, div.MsoListParagraphCxSpLast {mso-style-priority:34; mso-style-unhide:no; mso-style-qformat:yes; mso-style-type:export-only; margin-top:0in; margin-right:0in; margin-bottom:0in; margin-left:.5in; margin-bottom:.0001pt; mso-add-space:auto; mso-pagination:widow-orphan; font-size:12.0pt; font-family:"Calibri",sans-serif; mso-ascii-font-family:Calibri; mso-ascii-theme-font:minor-latin; mso-fareast-font-family:Calibri; mso-fareast-theme-font:minor-latin; mso-hansi-font-family:Calibri; mso-hansi-theme-font:minor-latin; mso-bidi-font-family:"Times New Roman"; mso-bidi-theme-font:minor-bidi;} .MsoChpDefault {mso-style-type:export-only; mso-default-props:yes; font-family:"Calibri",sans-serif; mso-ascii-font-family:Calibri; mso-ascii-theme-font:minor-latin; mso-fareast-font-family:Calibri; mso-fareast-theme-font:minor-latin; mso-hansi-font-family:Calibri; mso-hansi-theme-font:minor-latin; mso-bidi-font-family:"Times New Roman"; mso-bidi-theme-font:minor-bidi;} @page WordSection1 {size:8.5in 11.0in; margin:1.0in 1.0in 1.0in 1.0in; mso-header-margin:.5in; mso-footer-margin:.5in; mso-paper-source:0;} div.WordSection1 {page:WordSection1;} /* List Definitions */ @list l0 {mso-list-id:1495026935; mso-list-type:hybrid; mso-list-template-ids:688417882 67698703 67698713 67698715 67698703 67698713 67698715 67698703 67698713 67698715;} @list l0:level1 {mso-level-tab-stop:none; mso-level-number-position:left; text-indent:-.25in;} @list l0:level2 {mso-level-number-format:alpha-lower; mso-level-tab-stop:none; mso-level-number-position:left; text-indent:-.25in;} @list l0:level3 {mso-level-number-format:roman-lower; mso-level-tab-stop:none; mso-level-number-position:right; text-indent:-9.0pt;} @list l0:level4 {mso-level-tab-stop:none; mso-level-number-position:left; text-indent:-.25in;} @list l0:level5 {mso-level-number-format:alpha-lower; mso-level-tab-stop:none; mso-level-number-position:left; text-indent:-.25in;} @list l0:level6 {mso-level-number-format:roman-lower; mso-level-tab-stop:none; mso-level-number-position:right; text-indent:-9.0pt;} @list l0:level7 {mso-level-tab-stop:none; mso-level-number-position:left; text-indent:-.25in;} @list l0:level8 {mso-level-number-format:alpha-lower; mso-level-tab-stop:none; mso-level-number-position:left; text-indent:-.25in;} @list l0:level9 {mso-level-number-format:roman-lower; mso-level-tab-stop:none; mso-level-number-position:right; text-indent:-9.0pt;} @list l1 {mso-list-id:1633443701; mso-list-type:hybrid; mso-list-template-ids:-895182196 67698689 67698691 67698693 67698689 67698691 67698693 67698689 67698691 67698693;} @list l1:level1 {mso-level-number-format:bullet; mso-level-text:; mso-level-tab-stop:none; mso-level-number-position:left; text-indent:-.25in; font-family:Symbol;} @list l1:level2 {mso-level-number-format:bullet; mso-level-text:o; mso-level-tab-stop:none; mso-level-number-position:left; text-indent:-.25in; font-family:"Courier New";} @list l1:level3 {mso-level-number-format:bullet; mso-level-text:; mso-level-tab-stop:none; mso-level-number-position:left; text-indent:-.25in; font-family:Wingdings;} @list l1:level4 {mso-level-number-format:bullet; mso-level-text:; mso-level-tab-stop:none; mso-level-number-position:left; text-indent:-.25in; font-family:Symbol;} @list l1:level5 {mso-level-number-format:bullet; mso-level-text:o; mso-level-tab-stop:none; mso-level-number-position:left; text-indent:-.25in; font-family:"Courier New";} @list l1:level6 {mso-level-number-format:bullet; mso-level-text:; mso-level-tab-stop:none; mso-level-number-position:left; text-indent:-.25in; font-family:Wingdings;} @list l1:level7 {mso-level-number-format:bullet; mso-level-text:; mso-level-tab-stop:none; mso-level-number-position:left; text-indent:-.25in; font-family:Symbol;} @list l1:level8 {mso-level-number-format:bullet; mso-level-text:o; mso-level-tab-stop:none; mso-level-number-position:left; text-indent:-.25in; font-family:"Courier New";} @list l1:level9 {mso-level-number-format:bullet; mso-level-text:; mso-level-tab-stop:none; mso-level-number-position:left; text-indent:-.25in; font-family:Wingdings;} </style> --><br /><div class="MsoNormal" style="font-size: medium; text-align: justify;"><br /></div></div>
January 27, 2020
Data Update 2 for 2020: Retrospective on a Disruptive Decade
My data updates usually look at the data for the most recent year and what I learn from them, but 2020 also marks the end of a decade. In this post, I look back at markets over the period, a testing period for many active investors, and particularly so for value investors, who found that even as financial assets posted solid returns, what they thought were tried and true approaches to "beating the market" seemed to lose their power. In addition, trust in mean reversion, i.e., that things would go back to historic norms was shaken as interest rates remained low for much of the period and PE ratios rose above historical averages and continued to rise, rather than fall back.
1. It was a great year, and a very good decade, for equities, and a very good year for bonds!While investing should always be forward-looking, there is a benefit to pausing and looking backwards. If you had US stocks in your portfolio, 2019 was a very good year. The S&P 500 started the year at 2506.85 and ended the year at 3230.78, an increase of 28.88%, and with dividends added, the return for the year was 31.22%. To get a sense of how this year measures up against other good years, I compared it to the annual returns from 1927 to 2019 in this graph: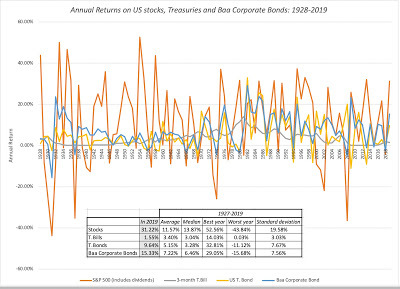 Download spreadsheet with annual market dataOver the 92 years that are in this historical assessment, 2019 ranked as the sixteenth best year and second only to 2013 (annual return of 32.15%) in this century. While stocks have garnered the bulk of the attention for having a good year, bonds were not slackers in the returns game. In 2019, the ten-year US treasury bond returned 9.64% and ten-year Baa corporate bonds weighing in with a 15.33% return. That may surprise some, given how low interest rates have been, but the bulk of these returns came from price appreciation, as the US treasury bond rate declined from 2.69% to 1.92%, and the corporate bonds also benefited from a decline in default spreads (the price of risk in the bond market) during the year. The year also capped off a decade of gains for stocks, with the S&P almost tripling from 1115.10 on January 1, 2010 to 3230.78 on January 1, 2020, and with dividends included and reinvested, the cumulated return for the decade is 252.96%. To put these returns in perspective, I have compared this cumulated return to the eight full decades that I have data for in the table below, in conjunction with the cumulated returns for treasury and corporate bonds over each decade:
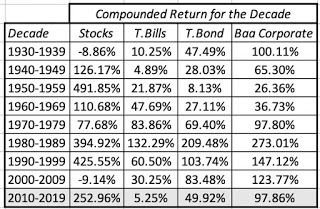 Download spreadsheet with annual market dataWhile 2010-19 represented a bounce back for stocks from a dismal 2000-09 time period, with the 2008 crisis ravaging returns, it falls behind three other decades of even higher returns (1950-59, 1980-89 and 1990-1999). It was a middling decade for both treasury and corporate bonds, with cumulated returns running ahead of the three decades spanning 1940 to 1969 but falling behind the other decades, in terms of returns delivered. Treasury bills delivered their worst decade of returns, since the 1940s, with the cumulated return amounting to 5.25%. I don’t want to overanalyze historical data, but there are interesting nuggets of information in the data:a. Historical Risk Premium: The US historical data has been used by many analysts in corporate finance and valuation as the basis for computing historical risk premiums and in the table below, I compute the risk premiums that investors would have earned in this market, investing in stocks as opposed to treasury bills and bonds, over different time periods, and with different averaging approaches:
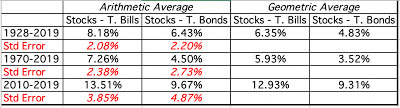 Download spreadsheet with annual market dataIf you go with the geometric average premium from 1927-2019 as your predictor for the equity risk premium in 2020, US stocks should earn about 4.83% more than US treasury bonds for the year:Expected return on stocks in 2020 = T.Bond Rate + Historical ERP = 1.92% + 4.83% = 6.75%Since a portion of this return will come from dividends, the expected price appreciation in stocks is the difference:Expected price appreciation on stocks = Expected Return - Dividend yield = 6.75%- 1.82% = 4.93%I am not a fan of historical premiums, not only because they represent almost an almost slavish faith in mean reversion but also because they are noisy; the standard errors in the historical premiums are highlighted in red and you can see that even with 92 years of data, the standard error in the risk premium is 2.20% and that with 10 or 20 years of data, the risk premium estimate is drowned out by estimation error.b. Asset Allocation: The fact that stocks have beaten treasury and corporate bonds by wide margins over the entire history is often the sales pitch used to push investors to allocate more of their savings to stocks, with the argument being that stocks always win in the long term. The data should yield cautionary notes:First, in three decades out of the nine in the table, stocks under-performed treasury bonds and treasury bills, and if your response is that ten years is not a long enough time period, you may want to check the actuarial tables. Second, there is a selection bias in our use of the US markets for computing the historical premium. Looking across the globe, the US was one of the most successful equity markets of the last century and using it may be skewing our results upwards. Put bluntly, if you had invested in the Nikkei at the height of its climb in the 1980s, you would still be struggling to get back the money you lost, when the Japanese markets collapsed.c. Market Timing: It is human nature to try to time markets, and some investors make it the central focus of their investment philosophies. I will not try to litigate the good sense of doing so in this post, but the historical return data gives us a sense of both the upside and the downside of doing so. In terms of pluses, an investor who was able to avoid the doomed decades (when stocks earned less than T.Bills and T.Bonds) would be comfortably ahead of an investor who did not, if he or she stayed fully invested in the remaining decades. In terms of minuses, if the market timing investor failed to stay invested in stocks in the good decades, the opportunity costs would quickly overwhelm the benefits. Between 2010 and 2019, there were many investors who believed that a correction was around the corner, driven by their perception that interest rates were being kept artificially low by central banks and that they would revert to historic norms quickly. When that reversion did not occur, these investors paid a hefty price in returns foregone. All of the historical returns that I have reported in this section are nominal, and to the extent that you are interested in real returns, you may want to download the historical data from my website and check out the results. (Hint: Not much changes)
2. A Low Interest Rate DecadeIf there was a defining characteristic for the decade, it was that interest rates, both in the US and globally, dropped to levels not seen in decades. You can see this in the path of the US 10-year treasury bond rate in the graph below: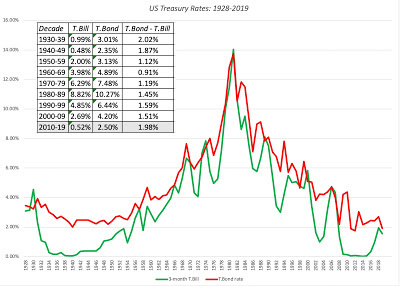 Download historical treasury rates, by yearSince the drop in rates occurred after the 2008 crisis, and in the aftermath of concerted actions by central banks to bolster weak economies, it has become conventional wisdom that it is central banks that have kept rates artificially low, and that the ending of quantitative easing would cause rates to revert back to historical averages. As many of you who have been reading my posts know, I don't believe that central banks have the power to keep long term market-set rates low, if the fundamentals don't support low rates. In fact, one of my favorite graphs is one where I compare the 10-year treasury bond rate each year to the sum of the inflation rate and real GDP growth rate that year (intrinsic riskfree rate):
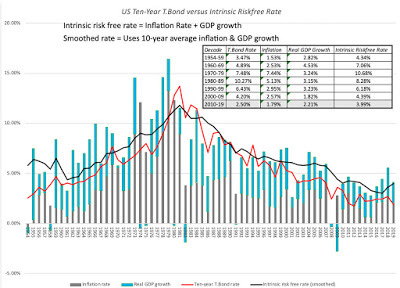 Download historical treasury rates, by yearAs you can see, the main reason why rates have dropped in the US and Europe has been fundamental. As inflation has declined (and become deflation in some parts of the world) and real GDP growth has been anemic, intrinsic and actual risk free rates have dropped. To the extent that the difference between the two is a measure of central banking actions, it is true that the Fed’s actions kept actual rates lower than intrinsic rates more in the last decade than in prior years, but it is also true that even in the absence of central banking intervention, rates would not have reverted back to historical norms.
3. It was a tech decade, and FAANG stocks stole the show!While it was a good decade for stocks, the gains varied across sectors. Using the S&P 500 again as the indicator, you can see the shift in value over the decade by looking at how the different sectors evolved over the decade, as a percent of the S&P 500: The most striking shift is in the energy sector, which dropped from 11.51% of the index to 4.60%, in market capitalization terms. Some of this drop is clearly due to the decline in oil prices during the decade, but some of it can be attributed to a general loss of faith in the future of fossil fuel and conventional energy companies. The biggest sector through the entire decade was technology but its increase in percentage terms seems modest at first sight, rising from 19.76% in 2009 to 21.97% in 2019, but that is because two of the biggest names in the sector, Google and Facebook, were moved to the communication services sector; if they had been left in technology, its share of the index would have risen to more than 30%. In fact, five companies (Facebook, Alphabet, Apple, Netflix and Google), representing the FAANG stocks, had a very good decade, with their collective market capitalization increasing by $3.4 trillion over the ten years:
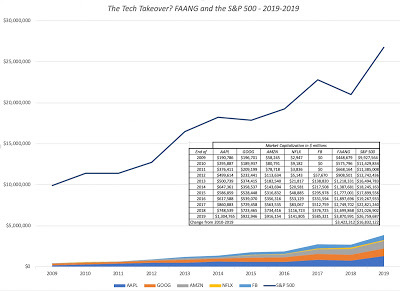
Put in perspective, the FAANG stocks accounted for 22% of the increase in market capitalization of the S&P 500, and any portfolio that did not include any of these stocks for the entire decade would have had a tough time keeping up with the market, let alone beating it. (This is an approximation, since not all five FAANG stocks were part of the S&P 500 for the entire decade, with Facebook entering after its IPO in 2012 and Netflix being added to the index in 2014).
4. Mean Reversion or Structural ShiftOne of the perils of being in a market like the US, where rich historical data is available and easily accessible is that analysts and academics have pored over the data and not surprisingly found patterns that have very quickly become part of investment lore. Thus, we have been told that value beats growth, at least over long periods, and that small cap stocks earn a premium, and have converted these findings into investing strategies and valuation practices. While it is dangerous to use a decade’s results to abandon a long history, the last decade offered sobering counters to old investing nostrums.
a. Value versus GrowthThe basis for the belief that value beats growth is both intuitive and empirical. The intuitive argument is that value stocks are priced cheaper and hence need to do less to beat expectations and the empirical argument is that stocks that are classified as value stocks, defined as low price to book and low price to book stocks, have historically done better than growth stocks, defined as those trading at high price to book and high price earnings ratios. Looking at the annual returns on the lowest and highest PBV stocks in the United States, going back to 1927: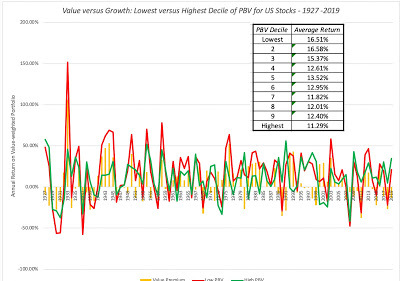 Raw Data from Ken FrenchThe lowest price to book stocks have historically earned 5.22% more than the highest price to book stocks, if you look at 1927-2019. Broken down by decades, though, you can see that the assumption that value beats growth is not as easily justified:
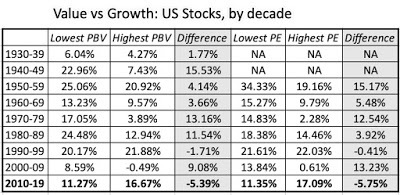 Raw Data from Ken FrenchWhile there are some, especially in the old-time value crowd, that view the last decade as an aberration, the slide in the value premium has been occurring over a much longer period, suggesting that there are fundamental factors at play that are eating away at the premium. If you are a believer in value, as I am, there is a consolation prize here. Assuming that low PE stocks and low PBV stocks are good value is the laziest form of value investing, and it is perhaps not surprising that in a world where ETFs and index funds can be created to take advantage of these screens, there is no payoff to lazy value investing. I believe that good value investing requires creativity and out-of-the-box thinking, as well as a willingness to live with uncertainty, and even then, the payoff
b. The Elusive Small Cap PremiumAnother accepted part of empirical wisdom about stocks not only in the US, but also globally, is that small cap stocks deliver higher returns, after adjusting for risk using conventional risk and return models, than large cap stocks.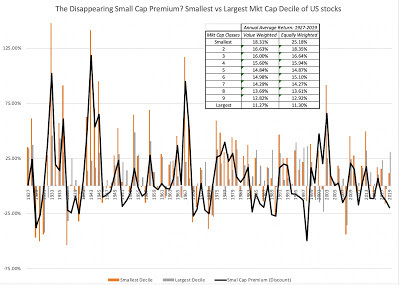 Raw Data from Ken FrenchLooking at the data from 1927 to 2019, it looks conclusively like small market cap stocks have earned substantially higher returns than larger cap stocks; relative to the overall market, small cap stocks have delivered about 4-4.5% higher returns, and conventional adjustments for risk don't dent this number significantly. Not only has this led some to put their faith in small cap investing but it has also led analysts to add a small cap premium to costs of equity, when valuing small companies. I have not only never used a small cap premium, when valuing companies, but I am skeptical about its existence, and wrote a post on why a few years ago. Again, updating the data by decades, here is what I see:
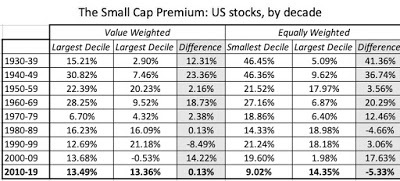 Raw Data from Ken FrenchAs with the value premium, the size premium had a rough decade between 2010 and 2019, dropping close to zero, on a value weighted basis, and turning significantly negative, when returns are computed on a equally weighted basis. Again, the trend is longer term, as there has been little or no evidence of a small cap premium since 1980, in contrast to the dramatic premiums in prior decades. If you are investing in small cap stocks, expecting a premium, you will be disappointed, and if you are still adding small cap premiums to your discount rates, when valuing companies, you are about four decades behind the times.
5. New buzzwords were bornEvery decade has its buzzwords, words that not only become the focus for companies but are also money makers for consultants, and the last decade was no exception. At the risk of being accused of missing a few, there were two that stood out to me. The first was big data, driven partly by more extensive collection of information, especially online, and partly by tools that allowed this data to be accessed and analyzed. The other was crowd wisdom, where expert opinions were replaced by crowd judgments on a wide range of applications, from restaurant reviews to new (crypto) currencies.
a. Big DataEarlier in this post, I looked at the surge in value of the FAANG stocks, and how they contributed to shaping the market over the last decade. One common element that all five companies shared was that they were not only reaching tens of millions of users, but that they were also collecting information on these users, and then using that information to improve existing products/services and add new ones. Other companies, seeking to emulate their success, tried their hand at “big data”, and it became a calling card for start-ups and young firms during the decade. While I agree that Netflix and Amazon, in particular, have turned big data into a weapon against competition, and Facebook’s entire advertising business is built on using personal data to focus advertising, I personally believe that like all buzz words, big data has been over sold. In particular, I noted, in a post from 2018 ,that for big data to create value,The data has to be exclusive: For data to be valuable, there has to be some exclusivity. Put simply, if everyone has it, no one has an advantage. Thus, the fact that you, as a business, can trace my location has little value when two dozen other applications and services on my iPhone are doing exactly the same thing. The data has to be actionable: For value conversion to occur, the data that has been collected has to be usable in modifying and adapting the products and services you offer as a business. Using these two-part test, you can see why Amazon and Netflix are standouts when it comes to big data, since the data they collect is exclusive (Netflix on your viewing habits/tastes and Amazon on your retail behavior) and is then used to tailor their offerings (Netflix with its original content investments and offerings and Amazon with its product nudging). Using the same two-part test, you can also see why the claims of big data payoffs at MoviePass and Bird Scooters makers never made sense.
b. Crowd WisdomOne consequence of the 2008 crisis was a loss in faith in both institutional authorities (central banks, governments, regulators) but also in experts, most of whom had been hopelessly wrong in the lead up to the crisis. It is therefore not surprising that you saw a move towards trusting crowds on answers to big questions right after the crisis. It is no coincidence that Satoshi Nakamoto (whoever he might be) posted the paper laying out the architecture of Bitcoin in November 2008, a proposal for a digital currency without a central bank or regulatory overlay, where transactions would be crowd-checked (by miners). While Bitcoin has been more successful as a speculative game than as a currency during the last decade, the block chains that it introduced have now found their way into a much wider range of businesses, threatening to replace institutional oversight (from banks, stock exchanges and other established entities) with cheaper alternatives. The crowd concept has expanded into almost every aspect of our lives, with Yelp ratings replacing restaurant reviewers in our choices of where to eat, Rotten Tomatoes supplanting movie critics in deciding what to watch and betting markets replacing polls in predicting election outcomes. I share the distrust of experts that many others have, but I also wary of crowd wisdom. After all, financial markets have been laboratories for observing how crowds behave for centuries, and we have found that while crowds are often much better at gauging the right answers than market gurus and experts, they are also prone to herding and collective bad choices. For those who have become too trusting of crowds, my recommendation is that they read “The Madness of Crowds”, an old manuscript that is still timely.
The decade to comeIt has been said that those who forget the past are destined to relive it, and that is one reason why we pore over historical track records, hoping to get insight for the future. But it has also been said that army generals who prepare too intensely to fight the last war will lose the next one, suggesting that reading too much into history can be dangerous. To me the biggest lesson of the last decade is to keep an open mind and to not take conventional wisdom as a given. I don’t know what the next decade will bring us, but I can guarantee you that it will not look like the last one or any of the prior ones, So, strap on your seat belts and get ready! It’s going to be a wild ride!
YouTube Video
Data Links
Stocks, Bonds and Bills: 1928-2019Intrinsic and Actual Risk free Rates: 1954-2019Ken French Data on Value and Size Effects<!-- /* Style Definitions */ p.MsoNormal, li.MsoNormal, div.MsoNormal {mso-style-unhide:no; mso-style-qformat:yes; mso-style-parent:""; margin:0in; margin-bottom:.0001pt; mso-pagination:widow-orphan; font-size:12.0pt; font-family:"Calibri",sans-serif; mso-ascii-font-family:Calibri; mso-ascii-theme-font:minor-latin; mso-fareast-font-family:Calibri; mso-fareast-theme-font:minor-latin; mso-hansi-font-family:Calibri; mso-hansi-theme-font:minor-latin; mso-bidi-font-family:"Times New Roman"; mso-bidi-theme-font:minor-bidi;} p.MsoListParagraph, li.MsoListParagraph, div.MsoListParagraph {mso-style-priority:34; mso-style-unhide:no; mso-style-qformat:yes; margin-top:0in; margin-right:0in; margin-bottom:0in; margin-left:.5in; margin-bottom:.0001pt; mso-add-space:auto; mso-pagination:widow-orphan; font-size:12.0pt; font-family:"Calibri",sans-serif; mso-ascii-font-family:Calibri; mso-ascii-theme-font:minor-latin; mso-fareast-font-family:Calibri; mso-fareast-theme-font:minor-latin; mso-hansi-font-family:Calibri; mso-hansi-theme-font:minor-latin; mso-bidi-font-family:"Times New Roman"; mso-bidi-theme-font:minor-bidi;} p.MsoListParagraphCxSpFirst, li.MsoListParagraphCxSpFirst, div.MsoListParagraphCxSpFirst {mso-style-priority:34; mso-style-unhide:no; mso-style-qformat:yes; mso-style-type:export-only; margin-top:0in; margin-right:0in; margin-bottom:0in; margin-left:.5in; margin-bottom:.0001pt; mso-add-space:auto; mso-pagination:widow-orphan; font-size:12.0pt; font-family:"Calibri",sans-serif; mso-ascii-font-family:Calibri; mso-ascii-theme-font:minor-latin; mso-fareast-font-family:Calibri; mso-fareast-theme-font:minor-latin; mso-hansi-font-family:Calibri; mso-hansi-theme-font:minor-latin; mso-bidi-font-family:"Times New Roman"; mso-bidi-theme-font:minor-bidi;} p.MsoListParagraphCxSpMiddle, li.MsoListParagraphCxSpMiddle, div.MsoListParagraphCxSpMiddle {mso-style-priority:34; mso-style-unhide:no; mso-style-qformat:yes; mso-style-type:export-only; margin-top:0in; margin-right:0in; margin-bottom:0in; margin-left:.5in; margin-bottom:.0001pt; mso-add-space:auto; mso-pagination:widow-orphan; font-size:12.0pt; font-family:"Calibri",sans-serif; mso-ascii-font-family:Calibri; mso-ascii-theme-font:minor-latin; mso-fareast-font-family:Calibri; mso-fareast-theme-font:minor-latin; mso-hansi-font-family:Calibri; mso-hansi-theme-font:minor-latin; mso-bidi-font-family:"Times New Roman"; mso-bidi-theme-font:minor-bidi;} p.MsoListParagraphCxSpLast, li.MsoListParagraphCxSpLast, div.MsoListParagraphCxSpLast {mso-style-priority:34; mso-style-unhide:no; mso-style-qformat:yes; mso-style-type:export-only; margin-top:0in; margin-right:0in; margin-bottom:0in; margin-left:.5in; margin-bottom:.0001pt; mso-add-space:auto; mso-pagination:widow-orphan; font-size:12.0pt; font-family:"Calibri",sans-serif; mso-ascii-font-family:Calibri; mso-ascii-theme-font:minor-latin; mso-fareast-font-family:Calibri; mso-fareast-theme-font:minor-latin; mso-hansi-font-family:Calibri; mso-hansi-theme-font:minor-latin; mso-bidi-font-family:"Times New Roman"; mso-bidi-theme-font:minor-bidi;} .MsoChpDefault {mso-style-type:export-only; mso-default-props:yes; font-family:"Calibri",sans-serif; mso-ascii-font-family:Calibri; mso-ascii-theme-font:minor-latin; mso-fareast-font-family:Calibri; mso-fareast-theme-font:minor-latin; mso-hansi-font-family:Calibri; mso-hansi-theme-font:minor-latin; mso-bidi-font-family:"Times New Roman"; mso-bidi-theme-font:minor-bidi;} @page WordSection1 {size:8.5in 11.0in; margin:1.0in 1.0in 1.0in 1.0in; mso-header-margin:.5in; mso-footer-margin:.5in; mso-paper-source:0;} div.WordSection1 {page:WordSection1;} /* List Definitions */ @list l0 {mso-list-id:1127702183; mso-list-type:hybrid; mso-list-template-ids:-1386323740 67698703 67698713 67698715 67698703 67698713 67698715 67698703 67698713 67698715;} @list l0:level1 {mso-level-tab-stop:none; mso-level-number-position:left; text-indent:-.25in;} @list l0:level2 {mso-level-number-format:alpha-lower; mso-level-tab-stop:none; mso-level-number-position:left; text-indent:-.25in;} @list l0:level3 {mso-level-number-format:roman-lower; mso-level-tab-stop:none; mso-level-number-position:right; text-indent:-9.0pt;} @list l0:level4 {mso-level-tab-stop:none; mso-level-number-position:left; text-indent:-.25in;} @list l0:level5 {mso-level-number-format:alpha-lower; mso-level-tab-stop:none; mso-level-number-position:left; text-indent:-.25in;} @list l0:level6 {mso-level-number-format:roman-lower; mso-level-tab-stop:none; mso-level-number-position:right; text-indent:-9.0pt;} @list l0:level7 {mso-level-tab-stop:none; mso-level-number-position:left; text-indent:-.25in;} @list l0:level8 {mso-level-number-format:alpha-lower; mso-level-tab-stop:none; mso-level-number-position:left; text-indent:-.25in;} @list l0:level9 {mso-level-number-format:roman-lower; mso-level-tab-stop:none; mso-level-number-position:right; text-indent:-9.0pt;} @list l1 {mso-list-id:1605920559; mso-list-type:hybrid; mso-list-template-ids:1918769710 67698689 67698691 67698693 67698689 67698691 67698693 67698689 67698691 67698693;} @list l1:level1 {mso-level-number-format:bullet; mso-level-text:; mso-level-tab-stop:none; mso-level-number-position:left; text-indent:-.25in; font-family:Symbol;} @list l1:level2 {mso-level-number-format:bullet; mso-level-text:o; mso-level-tab-stop:none; mso-level-number-position:left; text-indent:-.25in; font-family:"Courier New";} @list l1:level3 {mso-level-number-format:bullet; mso-level-text:; mso-level-tab-stop:none; mso-level-number-position:left; text-indent:-.25in; font-family:Wingdings;} @list l1:level4 {mso-level-number-format:bullet; mso-level-text:; mso-level-tab-stop:none; mso-level-number-position:left; text-indent:-.25in; font-family:Symbol;} @list l1:level5 {mso-level-number-format:bullet; mso-level-text:o; mso-level-tab-stop:none; mso-level-number-position:left; text-indent:-.25in; font-family:"Courier New";} @list l1:level6 {mso-level-number-format:bullet; mso-level-text:; mso-level-tab-stop:none; mso-level-number-position:left; text-indent:-.25in; font-family:Wingdings;} @list l1:level7 {mso-level-number-format:bullet; mso-level-text:; mso-level-tab-stop:none; mso-level-number-position:left; text-indent:-.25in; font-family:Symbol;} @list l1:level8 {mso-level-number-format:bullet; mso-level-text:o; mso-level-tab-stop:none; mso-level-number-position:left; text-indent:-.25in; font-family:"Courier New";} @list l1:level9 {mso-level-number-format:bullet; mso-level-text:; mso-level-tab-stop:none; mso-level-number-position:left; text-indent:-.25in; font-family:Wingdings;} </style> --></div>
1. It was a great year, and a very good decade, for equities, and a very good year for bonds!While investing should always be forward-looking, there is a benefit to pausing and looking backwards. If you had US stocks in your portfolio, 2019 was a very good year. The S&P 500 started the year at 2506.85 and ended the year at 3230.78, an increase of 28.88%, and with dividends added, the return for the year was 31.22%. To get a sense of how this year measures up against other good years, I compared it to the annual returns from 1927 to 2019 in this graph:
 Download spreadsheet with annual market dataOver the 92 years that are in this historical assessment, 2019 ranked as the sixteenth best year and second only to 2013 (annual return of 32.15%) in this century. While stocks have garnered the bulk of the attention for having a good year, bonds were not slackers in the returns game. In 2019, the ten-year US treasury bond returned 9.64% and ten-year Baa corporate bonds weighing in with a 15.33% return. That may surprise some, given how low interest rates have been, but the bulk of these returns came from price appreciation, as the US treasury bond rate declined from 2.69% to 1.92%, and the corporate bonds also benefited from a decline in default spreads (the price of risk in the bond market) during the year. The year also capped off a decade of gains for stocks, with the S&P almost tripling from 1115.10 on January 1, 2010 to 3230.78 on January 1, 2020, and with dividends included and reinvested, the cumulated return for the decade is 252.96%. To put these returns in perspective, I have compared this cumulated return to the eight full decades that I have data for in the table below, in conjunction with the cumulated returns for treasury and corporate bonds over each decade:
 Download spreadsheet with annual market dataWhile 2010-19 represented a bounce back for stocks from a dismal 2000-09 time period, with the 2008 crisis ravaging returns, it falls behind three other decades of even higher returns (1950-59, 1980-89 and 1990-1999). It was a middling decade for both treasury and corporate bonds, with cumulated returns running ahead of the three decades spanning 1940 to 1969 but falling behind the other decades, in terms of returns delivered. Treasury bills delivered their worst decade of returns, since the 1940s, with the cumulated return amounting to 5.25%. I don’t want to overanalyze historical data, but there are interesting nuggets of information in the data:a. Historical Risk Premium: The US historical data has been used by many analysts in corporate finance and valuation as the basis for computing historical risk premiums and in the table below, I compute the risk premiums that investors would have earned in this market, investing in stocks as opposed to treasury bills and bonds, over different time periods, and with different averaging approaches:
 Download spreadsheet with annual market dataIf you go with the geometric average premium from 1927-2019 as your predictor for the equity risk premium in 2020, US stocks should earn about 4.83% more than US treasury bonds for the year:Expected return on stocks in 2020 = T.Bond Rate + Historical ERP = 1.92% + 4.83% = 6.75%Since a portion of this return will come from dividends, the expected price appreciation in stocks is the difference:Expected price appreciation on stocks = Expected Return - Dividend yield = 6.75%- 1.82% = 4.93%I am not a fan of historical premiums, not only because they represent almost an almost slavish faith in mean reversion but also because they are noisy; the standard errors in the historical premiums are highlighted in red and you can see that even with 92 years of data, the standard error in the risk premium is 2.20% and that with 10 or 20 years of data, the risk premium estimate is drowned out by estimation error.b. Asset Allocation: The fact that stocks have beaten treasury and corporate bonds by wide margins over the entire history is often the sales pitch used to push investors to allocate more of their savings to stocks, with the argument being that stocks always win in the long term. The data should yield cautionary notes:First, in three decades out of the nine in the table, stocks under-performed treasury bonds and treasury bills, and if your response is that ten years is not a long enough time period, you may want to check the actuarial tables. Second, there is a selection bias in our use of the US markets for computing the historical premium. Looking across the globe, the US was one of the most successful equity markets of the last century and using it may be skewing our results upwards. Put bluntly, if you had invested in the Nikkei at the height of its climb in the 1980s, you would still be struggling to get back the money you lost, when the Japanese markets collapsed.c. Market Timing: It is human nature to try to time markets, and some investors make it the central focus of their investment philosophies. I will not try to litigate the good sense of doing so in this post, but the historical return data gives us a sense of both the upside and the downside of doing so. In terms of pluses, an investor who was able to avoid the doomed decades (when stocks earned less than T.Bills and T.Bonds) would be comfortably ahead of an investor who did not, if he or she stayed fully invested in the remaining decades. In terms of minuses, if the market timing investor failed to stay invested in stocks in the good decades, the opportunity costs would quickly overwhelm the benefits. Between 2010 and 2019, there were many investors who believed that a correction was around the corner, driven by their perception that interest rates were being kept artificially low by central banks and that they would revert to historic norms quickly. When that reversion did not occur, these investors paid a hefty price in returns foregone. All of the historical returns that I have reported in this section are nominal, and to the extent that you are interested in real returns, you may want to download the historical data from my website and check out the results. (Hint: Not much changes)
2. A Low Interest Rate DecadeIf there was a defining characteristic for the decade, it was that interest rates, both in the US and globally, dropped to levels not seen in decades. You can see this in the path of the US 10-year treasury bond rate in the graph below:
 Download historical treasury rates, by yearSince the drop in rates occurred after the 2008 crisis, and in the aftermath of concerted actions by central banks to bolster weak economies, it has become conventional wisdom that it is central banks that have kept rates artificially low, and that the ending of quantitative easing would cause rates to revert back to historical averages. As many of you who have been reading my posts know, I don't believe that central banks have the power to keep long term market-set rates low, if the fundamentals don't support low rates. In fact, one of my favorite graphs is one where I compare the 10-year treasury bond rate each year to the sum of the inflation rate and real GDP growth rate that year (intrinsic riskfree rate):
 Download historical treasury rates, by yearAs you can see, the main reason why rates have dropped in the US and Europe has been fundamental. As inflation has declined (and become deflation in some parts of the world) and real GDP growth has been anemic, intrinsic and actual risk free rates have dropped. To the extent that the difference between the two is a measure of central banking actions, it is true that the Fed’s actions kept actual rates lower than intrinsic rates more in the last decade than in prior years, but it is also true that even in the absence of central banking intervention, rates would not have reverted back to historical norms.
 3. It was a tech decade, and FAANG stocks stole the show!While it was a good decade for stocks, the gains varied across sectors. Using the S&P 500 again as the indicator, you can see the shift in value over the decade by looking at how the different sectors evolved over the decade, as a percent of the S&P 500:
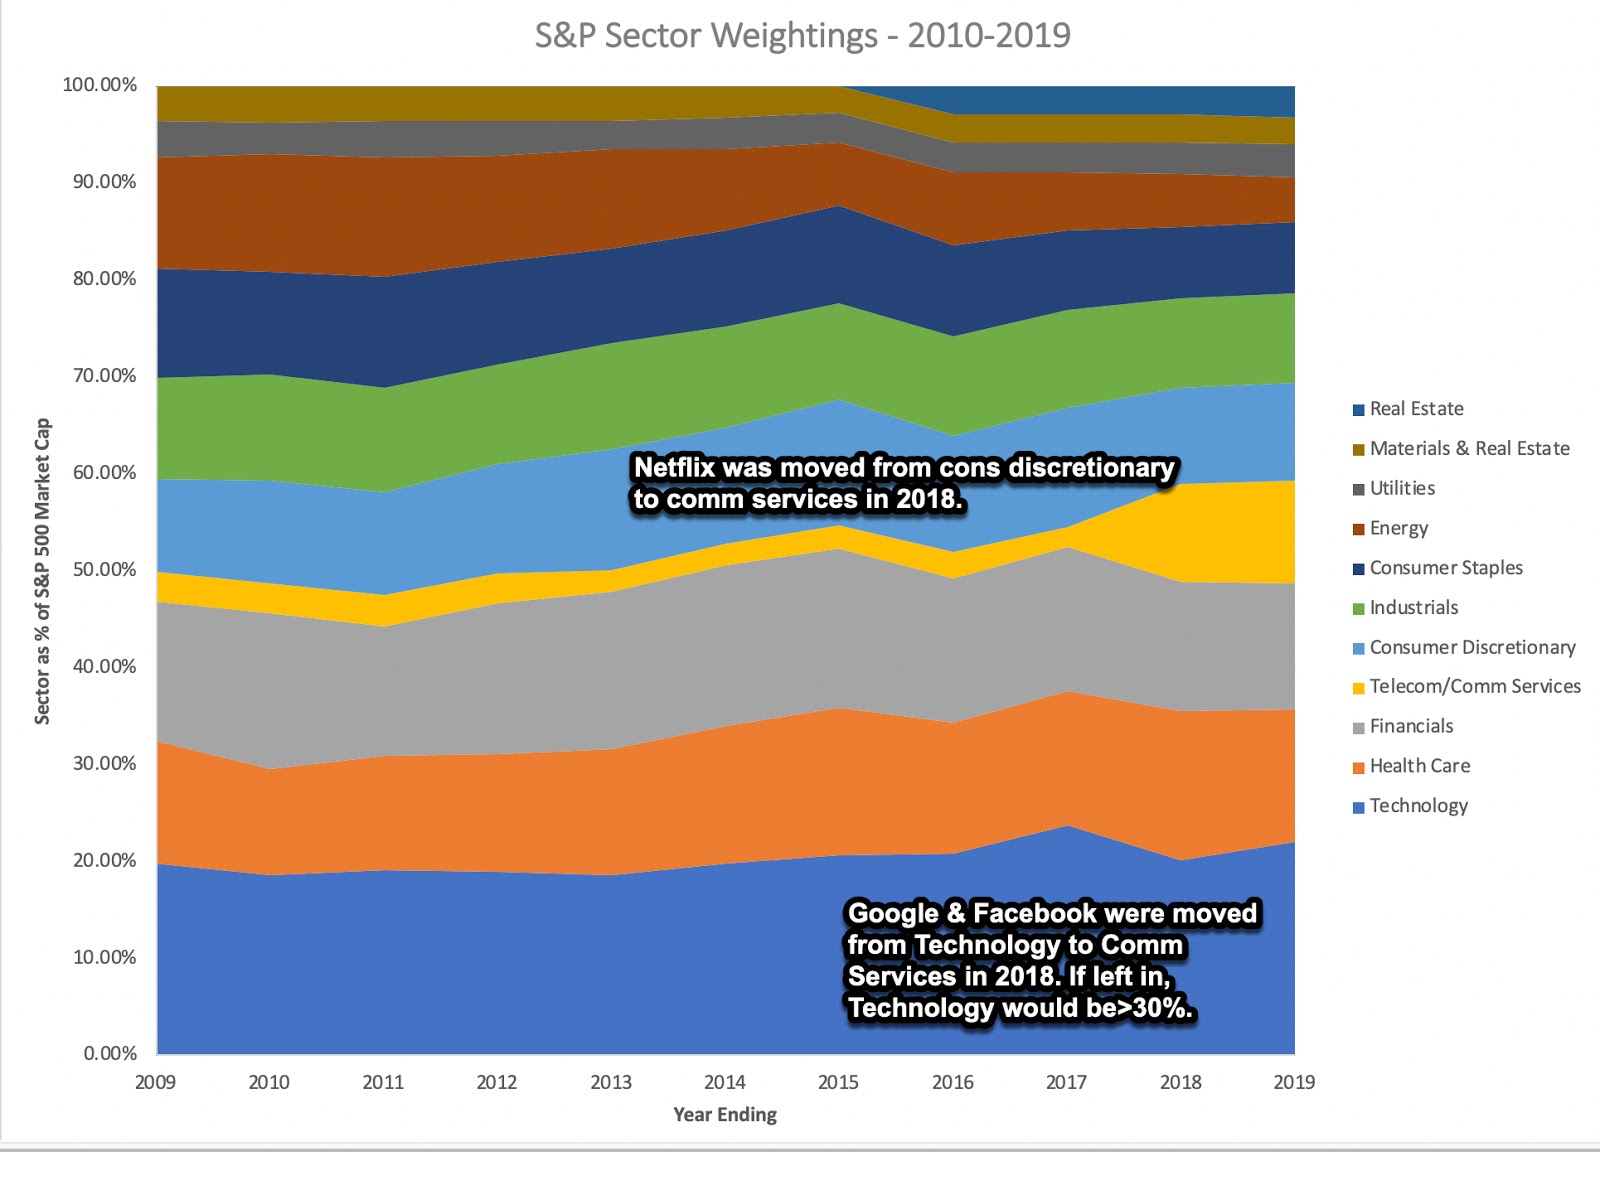 The most striking shift is in the energy sector, which dropped from 11.51% of the index to 4.60%, in market capitalization terms. Some of this drop is clearly due to the decline in oil prices during the decade, but some of it can be attributed to a general loss of faith in the future of fossil fuel and conventional energy companies. The biggest sector through the entire decade was technology but its increase in percentage terms seems modest at first sight, rising from 19.76% in 2009 to 21.97% in 2019, but that is because two of the biggest names in the sector, Google and Facebook, were moved to the communication services sector; if they had been left in technology, its share of the index would have risen to more than 30%. In fact, five companies (Facebook, Alphabet, Apple, Netflix and Google), representing the FAANG stocks, had a very good decade, with their collective market capitalization increasing by $3.4 trillion over the ten years:

Put in perspective, the FAANG stocks accounted for 22% of the increase in market capitalization of the S&P 500, and any portfolio that did not include any of these stocks for the entire decade would have had a tough time keeping up with the market, let alone beating it. (This is an approximation, since not all five FAANG stocks were part of the S&P 500 for the entire decade, with Facebook entering after its IPO in 2012 and Netflix being added to the index in 2014).
4. Mean Reversion or Structural ShiftOne of the perils of being in a market like the US, where rich historical data is available and easily accessible is that analysts and academics have pored over the data and not surprisingly found patterns that have very quickly become part of investment lore. Thus, we have been told that value beats growth, at least over long periods, and that small cap stocks earn a premium, and have converted these findings into investing strategies and valuation practices. While it is dangerous to use a decade’s results to abandon a long history, the last decade offered sobering counters to old investing nostrums.
a. Value versus GrowthThe basis for the belief that value beats growth is both intuitive and empirical. The intuitive argument is that value stocks are priced cheaper and hence need to do less to beat expectations and the empirical argument is that stocks that are classified as value stocks, defined as low price to book and low price to book stocks, have historically done better than growth stocks, defined as those trading at high price to book and high price earnings ratios. Looking at the annual returns on the lowest and highest PBV stocks in the United States, going back to 1927:
 Raw Data from Ken FrenchThe lowest price to book stocks have historically earned 5.22% more than the highest price to book stocks, if you look at 1927-2019. Broken down by decades, though, you can see that the assumption that value beats growth is not as easily justified:
 Raw Data from Ken FrenchWhile there are some, especially in the old-time value crowd, that view the last decade as an aberration, the slide in the value premium has been occurring over a much longer period, suggesting that there are fundamental factors at play that are eating away at the premium. If you are a believer in value, as I am, there is a consolation prize here. Assuming that low PE stocks and low PBV stocks are good value is the laziest form of value investing, and it is perhaps not surprising that in a world where ETFs and index funds can be created to take advantage of these screens, there is no payoff to lazy value investing. I believe that good value investing requires creativity and out-of-the-box thinking, as well as a willingness to live with uncertainty, and even then, the payoff
 b. The Elusive Small Cap PremiumAnother accepted part of empirical wisdom about stocks not only in the US, but also globally, is that small cap stocks deliver higher returns, after adjusting for risk using conventional risk and return models, than large cap stocks.
 Raw Data from Ken FrenchLooking at the data from 1927 to 2019, it looks conclusively like small market cap stocks have earned substantially higher returns than larger cap stocks; relative to the overall market, small cap stocks have delivered about 4-4.5% higher returns, and conventional adjustments for risk don't dent this number significantly. Not only has this led some to put their faith in small cap investing but it has also led analysts to add a small cap premium to costs of equity, when valuing small companies. I have not only never used a small cap premium, when valuing companies, but I am skeptical about its existence, and wrote a post on why a few years ago. Again, updating the data by decades, here is what I see:
 Raw Data from Ken FrenchAs with the value premium, the size premium had a rough decade between 2010 and 2019, dropping close to zero, on a value weighted basis, and turning significantly negative, when returns are computed on a equally weighted basis. Again, the trend is longer term, as there has been little or no evidence of a small cap premium since 1980, in contrast to the dramatic premiums in prior decades. If you are investing in small cap stocks, expecting a premium, you will be disappointed, and if you are still adding small cap premiums to your discount rates, when valuing companies, you are about four decades behind the times.
5. New buzzwords were bornEvery decade has its buzzwords, words that not only become the focus for companies but are also money makers for consultants, and the last decade was no exception. At the risk of being accused of missing a few, there were two that stood out to me. The first was big data, driven partly by more extensive collection of information, especially online, and partly by tools that allowed this data to be accessed and analyzed. The other was crowd wisdom, where expert opinions were replaced by crowd judgments on a wide range of applications, from restaurant reviews to new (crypto) currencies.
a. Big DataEarlier in this post, I looked at the surge in value of the FAANG stocks, and how they contributed to shaping the market over the last decade. One common element that all five companies shared was that they were not only reaching tens of millions of users, but that they were also collecting information on these users, and then using that information to improve existing products/services and add new ones. Other companies, seeking to emulate their success, tried their hand at “big data”, and it became a calling card for start-ups and young firms during the decade. While I agree that Netflix and Amazon, in particular, have turned big data into a weapon against competition, and Facebook’s entire advertising business is built on using personal data to focus advertising, I personally believe that like all buzz words, big data has been over sold. In particular, I noted, in a post from 2018 ,that for big data to create value,The data has to be exclusive: For data to be valuable, there has to be some exclusivity. Put simply, if everyone has it, no one has an advantage. Thus, the fact that you, as a business, can trace my location has little value when two dozen other applications and services on my iPhone are doing exactly the same thing. The data has to be actionable: For value conversion to occur, the data that has been collected has to be usable in modifying and adapting the products and services you offer as a business. Using these two-part test, you can see why Amazon and Netflix are standouts when it comes to big data, since the data they collect is exclusive (Netflix on your viewing habits/tastes and Amazon on your retail behavior) and is then used to tailor their offerings (Netflix with its original content investments and offerings and Amazon with its product nudging). Using the same two-part test, you can also see why the claims of big data payoffs at MoviePass and Bird Scooters makers never made sense.
b. Crowd WisdomOne consequence of the 2008 crisis was a loss in faith in both institutional authorities (central banks, governments, regulators) but also in experts, most of whom had been hopelessly wrong in the lead up to the crisis. It is therefore not surprising that you saw a move towards trusting crowds on answers to big questions right after the crisis. It is no coincidence that Satoshi Nakamoto (whoever he might be) posted the paper laying out the architecture of Bitcoin in November 2008, a proposal for a digital currency without a central bank or regulatory overlay, where transactions would be crowd-checked (by miners). While Bitcoin has been more successful as a speculative game than as a currency during the last decade, the block chains that it introduced have now found their way into a much wider range of businesses, threatening to replace institutional oversight (from banks, stock exchanges and other established entities) with cheaper alternatives. The crowd concept has expanded into almost every aspect of our lives, with Yelp ratings replacing restaurant reviewers in our choices of where to eat, Rotten Tomatoes supplanting movie critics in deciding what to watch and betting markets replacing polls in predicting election outcomes. I share the distrust of experts that many others have, but I also wary of crowd wisdom. After all, financial markets have been laboratories for observing how crowds behave for centuries, and we have found that while crowds are often much better at gauging the right answers than market gurus and experts, they are also prone to herding and collective bad choices. For those who have become too trusting of crowds, my recommendation is that they read “The Madness of Crowds”, an old manuscript that is still timely.
The decade to comeIt has been said that those who forget the past are destined to relive it, and that is one reason why we pore over historical track records, hoping to get insight for the future. But it has also been said that army generals who prepare too intensely to fight the last war will lose the next one, suggesting that reading too much into history can be dangerous. To me the biggest lesson of the last decade is to keep an open mind and to not take conventional wisdom as a given. I don’t know what the next decade will bring us, but I can guarantee you that it will not look like the last one or any of the prior ones, So, strap on your seat belts and get ready! It’s going to be a wild ride!
YouTube Video
Data Links
Stocks, Bonds and Bills: 1928-2019Intrinsic and Actual Risk free Rates: 1954-2019Ken French Data on Value and Size Effects<!-- /* Style Definitions */ p.MsoNormal, li.MsoNormal, div.MsoNormal {mso-style-unhide:no; mso-style-qformat:yes; mso-style-parent:""; margin:0in; margin-bottom:.0001pt; mso-pagination:widow-orphan; font-size:12.0pt; font-family:"Calibri",sans-serif; mso-ascii-font-family:Calibri; mso-ascii-theme-font:minor-latin; mso-fareast-font-family:Calibri; mso-fareast-theme-font:minor-latin; mso-hansi-font-family:Calibri; mso-hansi-theme-font:minor-latin; mso-bidi-font-family:"Times New Roman"; mso-bidi-theme-font:minor-bidi;} p.MsoListParagraph, li.MsoListParagraph, div.MsoListParagraph {mso-style-priority:34; mso-style-unhide:no; mso-style-qformat:yes; margin-top:0in; margin-right:0in; margin-bottom:0in; margin-left:.5in; margin-bottom:.0001pt; mso-add-space:auto; mso-pagination:widow-orphan; font-size:12.0pt; font-family:"Calibri",sans-serif; mso-ascii-font-family:Calibri; mso-ascii-theme-font:minor-latin; mso-fareast-font-family:Calibri; mso-fareast-theme-font:minor-latin; mso-hansi-font-family:Calibri; mso-hansi-theme-font:minor-latin; mso-bidi-font-family:"Times New Roman"; mso-bidi-theme-font:minor-bidi;} p.MsoListParagraphCxSpFirst, li.MsoListParagraphCxSpFirst, div.MsoListParagraphCxSpFirst {mso-style-priority:34; mso-style-unhide:no; mso-style-qformat:yes; mso-style-type:export-only; margin-top:0in; margin-right:0in; margin-bottom:0in; margin-left:.5in; margin-bottom:.0001pt; mso-add-space:auto; mso-pagination:widow-orphan; font-size:12.0pt; font-family:"Calibri",sans-serif; mso-ascii-font-family:Calibri; mso-ascii-theme-font:minor-latin; mso-fareast-font-family:Calibri; mso-fareast-theme-font:minor-latin; mso-hansi-font-family:Calibri; mso-hansi-theme-font:minor-latin; mso-bidi-font-family:"Times New Roman"; mso-bidi-theme-font:minor-bidi;} p.MsoListParagraphCxSpMiddle, li.MsoListParagraphCxSpMiddle, div.MsoListParagraphCxSpMiddle {mso-style-priority:34; mso-style-unhide:no; mso-style-qformat:yes; mso-style-type:export-only; margin-top:0in; margin-right:0in; margin-bottom:0in; margin-left:.5in; margin-bottom:.0001pt; mso-add-space:auto; mso-pagination:widow-orphan; font-size:12.0pt; font-family:"Calibri",sans-serif; mso-ascii-font-family:Calibri; mso-ascii-theme-font:minor-latin; mso-fareast-font-family:Calibri; mso-fareast-theme-font:minor-latin; mso-hansi-font-family:Calibri; mso-hansi-theme-font:minor-latin; mso-bidi-font-family:"Times New Roman"; mso-bidi-theme-font:minor-bidi;} p.MsoListParagraphCxSpLast, li.MsoListParagraphCxSpLast, div.MsoListParagraphCxSpLast {mso-style-priority:34; mso-style-unhide:no; mso-style-qformat:yes; mso-style-type:export-only; margin-top:0in; margin-right:0in; margin-bottom:0in; margin-left:.5in; margin-bottom:.0001pt; mso-add-space:auto; mso-pagination:widow-orphan; font-size:12.0pt; font-family:"Calibri",sans-serif; mso-ascii-font-family:Calibri; mso-ascii-theme-font:minor-latin; mso-fareast-font-family:Calibri; mso-fareast-theme-font:minor-latin; mso-hansi-font-family:Calibri; mso-hansi-theme-font:minor-latin; mso-bidi-font-family:"Times New Roman"; mso-bidi-theme-font:minor-bidi;} .MsoChpDefault {mso-style-type:export-only; mso-default-props:yes; font-family:"Calibri",sans-serif; mso-ascii-font-family:Calibri; mso-ascii-theme-font:minor-latin; mso-fareast-font-family:Calibri; mso-fareast-theme-font:minor-latin; mso-hansi-font-family:Calibri; mso-hansi-theme-font:minor-latin; mso-bidi-font-family:"Times New Roman"; mso-bidi-theme-font:minor-bidi;} @page WordSection1 {size:8.5in 11.0in; margin:1.0in 1.0in 1.0in 1.0in; mso-header-margin:.5in; mso-footer-margin:.5in; mso-paper-source:0;} div.WordSection1 {page:WordSection1;} /* List Definitions */ @list l0 {mso-list-id:1127702183; mso-list-type:hybrid; mso-list-template-ids:-1386323740 67698703 67698713 67698715 67698703 67698713 67698715 67698703 67698713 67698715;} @list l0:level1 {mso-level-tab-stop:none; mso-level-number-position:left; text-indent:-.25in;} @list l0:level2 {mso-level-number-format:alpha-lower; mso-level-tab-stop:none; mso-level-number-position:left; text-indent:-.25in;} @list l0:level3 {mso-level-number-format:roman-lower; mso-level-tab-stop:none; mso-level-number-position:right; text-indent:-9.0pt;} @list l0:level4 {mso-level-tab-stop:none; mso-level-number-position:left; text-indent:-.25in;} @list l0:level5 {mso-level-number-format:alpha-lower; mso-level-tab-stop:none; mso-level-number-position:left; text-indent:-.25in;} @list l0:level6 {mso-level-number-format:roman-lower; mso-level-tab-stop:none; mso-level-number-position:right; text-indent:-9.0pt;} @list l0:level7 {mso-level-tab-stop:none; mso-level-number-position:left; text-indent:-.25in;} @list l0:level8 {mso-level-number-format:alpha-lower; mso-level-tab-stop:none; mso-level-number-position:left; text-indent:-.25in;} @list l0:level9 {mso-level-number-format:roman-lower; mso-level-tab-stop:none; mso-level-number-position:right; text-indent:-9.0pt;} @list l1 {mso-list-id:1605920559; mso-list-type:hybrid; mso-list-template-ids:1918769710 67698689 67698691 67698693 67698689 67698691 67698693 67698689 67698691 67698693;} @list l1:level1 {mso-level-number-format:bullet; mso-level-text:; mso-level-tab-stop:none; mso-level-number-position:left; text-indent:-.25in; font-family:Symbol;} @list l1:level2 {mso-level-number-format:bullet; mso-level-text:o; mso-level-tab-stop:none; mso-level-number-position:left; text-indent:-.25in; font-family:"Courier New";} @list l1:level3 {mso-level-number-format:bullet; mso-level-text:; mso-level-tab-stop:none; mso-level-number-position:left; text-indent:-.25in; font-family:Wingdings;} @list l1:level4 {mso-level-number-format:bullet; mso-level-text:; mso-level-tab-stop:none; mso-level-number-position:left; text-indent:-.25in; font-family:Symbol;} @list l1:level5 {mso-level-number-format:bullet; mso-level-text:o; mso-level-tab-stop:none; mso-level-number-position:left; text-indent:-.25in; font-family:"Courier New";} @list l1:level6 {mso-level-number-format:bullet; mso-level-text:; mso-level-tab-stop:none; mso-level-number-position:left; text-indent:-.25in; font-family:Wingdings;} @list l1:level7 {mso-level-number-format:bullet; mso-level-text:; mso-level-tab-stop:none; mso-level-number-position:left; text-indent:-.25in; font-family:Symbol;} @list l1:level8 {mso-level-number-format:bullet; mso-level-text:o; mso-level-tab-stop:none; mso-level-number-position:left; text-indent:-.25in; font-family:"Courier New";} @list l1:level9 {mso-level-number-format:bullet; mso-level-text:; mso-level-tab-stop:none; mso-level-number-position:left; text-indent:-.25in; font-family:Wingdings;} </style> --></div>
January 13, 2020
Data Update 1 for 2020: Setting the table
Starting in the early 1990s, I have spent the first week or two of every new year playing my version of Moneyball, downloading raw market and accounting data on publicly traded companies and using that data to compute operating, pricing and risk metrics for them. This year, I got a later start than usual on January 6, but as the week draws to a close, the results of my data exploration are posted on my website and will be the basis for a series of posts here over the next six weeks. As you look at the data, you will find that the choices I have made on how to classify companies and compute metrics affect my findings, and I will use this post to cast some light on those choices.
The DataRaw Data: We live in an age when accessing raw data is easy, albeit not always cheap, and the tools to analyze that data are also widely available. My raw data is drawn from a variety of sources, ranging from S&P Capital IQ to Bloomberg to the Federal Reserve, and there are two rules that I try to follow. The first is to be careful about attributing sources for the raw data, and the second is to not undercut my raw data providers by replicating their data on my site, if they have commercial interests. Data Analysis: Broadly speaking, I would categorize my data updates into three groups. The first is macro data, where my ambitions tend to be modest, and the only numbers that I update are numbers that I need and use in my valuation and corporate financial analysis. The second is business data, where I consolidate the company-level data into industry groupings, and report statistics on how companies invest, finance their operations and return cash (dividends and buybacks). The third are my data archives, where you can look at trend lines in the statistics by accessing my statistics from prior years.
A. Macro DataI am not a market timer or a macro economist, and my interests in macro data are therefore limited to numbers that I cannot easily look up, or access, on a public database. Thus, there is no point in my reporting exchange rates between major currencies, when you have FRED, the Federal Reserve site , that I cannot praise more highly for its reach and its accessibility. I do report and update the following:Risk free rates in currencies: The way in which currencies are dealt with in valuation and corporate finance leaves us exposed to multiple problems, and I have written about both why risk free rates vary across currencies and why government bond rates are not always risk free. At the start of every year, I update my currency risk free rates, starting with the government bond rates, and then netting out default spreads and report them here. As risk free rates in developed market currencies hit new lows, and central banks are blamed for the phenomenon, I also update an intrinsic measure of the US dollar risk free rate, obtained by adding the inflation rate to real GDP growth each year, and report the time series in this dataset.Equity Risk Premiums: The equity risk premium is the price of risk in equity markets and plays a key role in both corporate finance and valuation. The conventional approach to estimating this risk premium is to look at history, and to compare the returns that you would have earned investing in stocks, as opposed to investing in risk free investments. I update the historical risk premium for US stocks, by bringing in 2019 returns on stocks, treasury bonds and treasury bills in this dataset; my updated geometric average premium for stocks over US treasuries. I don't like the approach, both because it is backward looking and because the risk premium estimates are noisy, and have argued for a forward looking or implied ERP. I estimate the implied ERP to be 5.20% at the start of 2020 and report the year-end estimates of the premium going back to 1960 in this dataset. Corporate Default Spreads: Just as equity risk premiums measure the price of risk in equity markets, default spreads measure the price of risk in the debt markets. I break down bonds into bond rating classes (S&P and Moody's) and report my estimates of default spreads at the start of 2020 in this spreadsheet (and it includes a way of estimating a bond rating for a firm that does not have one).Corporate Tax Rates: Ultimately, companies and investors count on after-tax income, though companies are adept at keeping taxes paid low. While I will report the effective tax rates that companies actually pay in my corporate data, I am grateful to KPMG for going through tax codes in different countries and compiling corporate tax rates, which I reproduce in this dataset.Country Risk Premiums: As companies expand their operations beyond domestic markets, we are faced with the challenge of bringing in the risk of foreign markets into our corporate financial analyses and valuation. I have spent much of the last 25 years trying to come up with better ways of estimating risk premiums for countries, and I describe the process I use in excruciating detail in this paper. At the start of 2020, I use my approach, flaws and all, to estimate equity risk premiums for 170 countries and report them in this dataset.With macro data, it is generally good practice in both corporate finance and valuation to bring in the numbers as they are today, rather than have a strong directional view. So, uncomfortable though it may make you, you should be using today's risk free rates and risk premiums, rather than normalized values, when valuing companies or making investment assessments.
B. Micro Data
The sample: All data analysis is biased and the bias starts with the sampling approach used to arrive at the data set. My data sample includes all publicly traded companies, listed anywhere in the world, and the only criteria that I impose is that they have a market capitalization number available as of December 31, 2019. The resulting sample of 44,394 firms includes firms from 150 countries, some of which have very illiquid markets and questionable disclosure practices. Rather than remove these firms from my sample, which creates its own biases, I will keep them in my sample and deal with the consequences when I compute my statistics.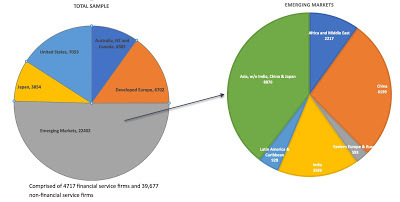
While this is a comprehensive sample, it is still biased because it includes just publicly listed companies. There are tens of thousands of private businesses that are part of the competitive landscape that are not included here, and the reason is pragmatic: most of these companies are not required to make public disclosures and there are few reliable databases that include data on these firms. The Industry Groupings: While I do have a (very large) spreadsheet that has the data at the company level, I am afraid that my raw data providers do not allow me to share that data, even though it is entirely comprised of numbers that I estimate. I consolidate that data into 94 industry groupings, which are loosely based on the industry groupings I created from Value Line in the 1990s when I first started creating my datasets. To see my industry grouping and what companies fall into each one, Picture with live linksIf you are interested, you will find more in-depth descriptions of how I compute the statistics that I report both in the datasets themselves as well as in this glossary.
The timing: I use a mix of market and accounting data and that creates a timing problem, since the accounting data is updated at the end of each quarter and the market data is updated continuously. Using the logic that I should be accessing the most updated data for every item, my January 1, 2020, updated has market data (for share prices, interest rates etc) as of December 31, 2019 and the accounting data as of the most recent financial statement (usually September 30, 2019 for most companies). I don't view this an inconsistent but a reflection of the reality that investors face.
C. Archived DataWhen I first started compiling my datasets, I did not expect them to be widely used, and certainly did not believe that they would be referenced over time. As I starting getting requests for datasets from earlier years, I decided that it would save both me and you a great deal of time to create an archive of past datasets. As you look at these archives, you will notice that not all datasets go back in time to the 1990s, reflecting first the expansion of my analysis from just US companies to global companies about 15 years ago and second the adding on of variables that I either did not or could not report in earlier years.
The Rationale
If you are wondering why I collect and analyze the data, let me make a confession, at the risk of sounding like a geek. I enjoy working with the data and more importantly, the data analysis is a gift that keeps on giving for the rest of the year, as I value companies and do corporate financial analysis.
It gives me perspective: In a world where we suffer from data overload, the week that I spend looking at the numbers gives me perspective not only on what comprises normal in corporate financial behavior, but also on the differences across sectors and geographies. Possible, Plausible and Probable: I have long argued that the valuation of a company always starts with a story but that a critical part of the process of converting narrative to value is checking the story for possibility, plausibility and probability. Having the global data aggregated and analyzed can help significantly in making this assessment, since you can see the cross section of revenues and profit margins of companies in the business and see if your assessments are out of line, and if so, whether you have a justification. Rules of thumb: In spite of all of the data that we now have available, investors and companies seem to still rely on rules of thumb devised in a different time and market. Thus, we are told that companies that trade at less than book value, or six times EBITDA, are cheap, and that the target or right debt ratio for a manufacturing company is 40%. Using the global data, we can back up or dispel these rules of thumb and perhaps replace them with more dynamic and meaningful decision rules.Fact-based opinions: Many market prognosticators and economists seem to have no qualms about making up stuff about investor and corporate behavior and stating them as facts. Thus, it has become conventional wisdom that US companies are paying less in taxes that companies operating elsewhere in the globe, and that they have borrowed immense amounts of cash over the last decade to buy back stock. Those "facts" are now driving political debate and may well lead to change in policy, but these are more opinions than facts, and the data can be arbiter.If you are wondering why I am sharing the data, let's get real. Nothing that I am doing is unique, and I have no secret data stashes. In short, anyone with access to data (and there are literally tens of thousands who do) can do the same analysis. I lose nothing by sharing, and I get immense karmic payoffs. So, please use whatever data you want, and in whatever context, and I hope that it saves you time and helps you in your decision making and analysis.
The CaveatsThe last decade has seen big data and crowd wisdom sold as the answers to all of our problems, and as I listen to the sales pitches for both, I would offer a few cautionary notes, born out of spending much of my life time working with data:Data is not objective: The notion that using data makes you objective is nonsense. In fact, the most egregious biases are data-backed, as people with agendas pick and choose the data that confirms their priors. Just as an example, take a look at the data that I have in what US companies paid in taxes in 2019 in this dataset. I have reported a variety of tax rates, not with the intent to confuse, but to note how the numbers change, depending on how you compute them. If you believe, like some do, that US companies are shirking their tax obligations, you can point to average tax rate of 7.32% that I report for all US companies, and note that this is well below the federal corporate tax rate of 21%. However, someone on the other side of this debate can point to the 19.01% average tax rate across only money making companies (since only profits get taxed) as evidence that companies are paying their taxes. Crowds are not always wise: One of the strongest forces in corporate finance is me-tooism, where companies decide how to invest, how much to borrow and what to pay in dividends by looking at what their peers do. In my datasets, I offer them guidance in this process, by reporting debt ratios and dividend payout ratios for sectors, as well as regional breakdowns. The implicit assumption is that what other companies do, on average, must be sensible, but that assumption is not always true. This warning is particularly relevant when you look at the pricing metrics (PE, EV to EBITDA etc.) that I report, by sector and by region. The market may be right, on average, but it can also over price or under price a sector, at times.I respect data, but I don't revere it. I don't believe that just having data will give me an advantage over other investors or make me a better investor, but harnessing that data with intuition and logic may give me a leg up (or at least I hope it does).
YouTube Video
LinksData on my websiteFederal Reserve Data Site (FRED)
The DataRaw Data: We live in an age when accessing raw data is easy, albeit not always cheap, and the tools to analyze that data are also widely available. My raw data is drawn from a variety of sources, ranging from S&P Capital IQ to Bloomberg to the Federal Reserve, and there are two rules that I try to follow. The first is to be careful about attributing sources for the raw data, and the second is to not undercut my raw data providers by replicating their data on my site, if they have commercial interests. Data Analysis: Broadly speaking, I would categorize my data updates into three groups. The first is macro data, where my ambitions tend to be modest, and the only numbers that I update are numbers that I need and use in my valuation and corporate financial analysis. The second is business data, where I consolidate the company-level data into industry groupings, and report statistics on how companies invest, finance their operations and return cash (dividends and buybacks). The third are my data archives, where you can look at trend lines in the statistics by accessing my statistics from prior years.
A. Macro DataI am not a market timer or a macro economist, and my interests in macro data are therefore limited to numbers that I cannot easily look up, or access, on a public database. Thus, there is no point in my reporting exchange rates between major currencies, when you have FRED, the Federal Reserve site , that I cannot praise more highly for its reach and its accessibility. I do report and update the following:Risk free rates in currencies: The way in which currencies are dealt with in valuation and corporate finance leaves us exposed to multiple problems, and I have written about both why risk free rates vary across currencies and why government bond rates are not always risk free. At the start of every year, I update my currency risk free rates, starting with the government bond rates, and then netting out default spreads and report them here. As risk free rates in developed market currencies hit new lows, and central banks are blamed for the phenomenon, I also update an intrinsic measure of the US dollar risk free rate, obtained by adding the inflation rate to real GDP growth each year, and report the time series in this dataset.Equity Risk Premiums: The equity risk premium is the price of risk in equity markets and plays a key role in both corporate finance and valuation. The conventional approach to estimating this risk premium is to look at history, and to compare the returns that you would have earned investing in stocks, as opposed to investing in risk free investments. I update the historical risk premium for US stocks, by bringing in 2019 returns on stocks, treasury bonds and treasury bills in this dataset; my updated geometric average premium for stocks over US treasuries. I don't like the approach, both because it is backward looking and because the risk premium estimates are noisy, and have argued for a forward looking or implied ERP. I estimate the implied ERP to be 5.20% at the start of 2020 and report the year-end estimates of the premium going back to 1960 in this dataset. Corporate Default Spreads: Just as equity risk premiums measure the price of risk in equity markets, default spreads measure the price of risk in the debt markets. I break down bonds into bond rating classes (S&P and Moody's) and report my estimates of default spreads at the start of 2020 in this spreadsheet (and it includes a way of estimating a bond rating for a firm that does not have one).Corporate Tax Rates: Ultimately, companies and investors count on after-tax income, though companies are adept at keeping taxes paid low. While I will report the effective tax rates that companies actually pay in my corporate data, I am grateful to KPMG for going through tax codes in different countries and compiling corporate tax rates, which I reproduce in this dataset.Country Risk Premiums: As companies expand their operations beyond domestic markets, we are faced with the challenge of bringing in the risk of foreign markets into our corporate financial analyses and valuation. I have spent much of the last 25 years trying to come up with better ways of estimating risk premiums for countries, and I describe the process I use in excruciating detail in this paper. At the start of 2020, I use my approach, flaws and all, to estimate equity risk premiums for 170 countries and report them in this dataset.With macro data, it is generally good practice in both corporate finance and valuation to bring in the numbers as they are today, rather than have a strong directional view. So, uncomfortable though it may make you, you should be using today's risk free rates and risk premiums, rather than normalized values, when valuing companies or making investment assessments.
B. Micro Data
The sample: All data analysis is biased and the bias starts with the sampling approach used to arrive at the data set. My data sample includes all publicly traded companies, listed anywhere in the world, and the only criteria that I impose is that they have a market capitalization number available as of December 31, 2019. The resulting sample of 44,394 firms includes firms from 150 countries, some of which have very illiquid markets and questionable disclosure practices. Rather than remove these firms from my sample, which creates its own biases, I will keep them in my sample and deal with the consequences when I compute my statistics.

While this is a comprehensive sample, it is still biased because it includes just publicly listed companies. There are tens of thousands of private businesses that are part of the competitive landscape that are not included here, and the reason is pragmatic: most of these companies are not required to make public disclosures and there are few reliable databases that include data on these firms. The Industry Groupings: While I do have a (very large) spreadsheet that has the data at the company level, I am afraid that my raw data providers do not allow me to share that data, even though it is entirely comprised of numbers that I estimate. I consolidate that data into 94 industry groupings, which are loosely based on the industry groupings I created from Value Line in the 1990s when I first started creating my datasets. To see my industry grouping and what companies fall into each one, Picture with live linksIf you are interested, you will find more in-depth descriptions of how I compute the statistics that I report both in the datasets themselves as well as in this glossary.
The timing: I use a mix of market and accounting data and that creates a timing problem, since the accounting data is updated at the end of each quarter and the market data is updated continuously. Using the logic that I should be accessing the most updated data for every item, my January 1, 2020, updated has market data (for share prices, interest rates etc) as of December 31, 2019 and the accounting data as of the most recent financial statement (usually September 30, 2019 for most companies). I don't view this an inconsistent but a reflection of the reality that investors face.
C. Archived DataWhen I first started compiling my datasets, I did not expect them to be widely used, and certainly did not believe that they would be referenced over time. As I starting getting requests for datasets from earlier years, I decided that it would save both me and you a great deal of time to create an archive of past datasets. As you look at these archives, you will notice that not all datasets go back in time to the 1990s, reflecting first the expansion of my analysis from just US companies to global companies about 15 years ago and second the adding on of variables that I either did not or could not report in earlier years.
The Rationale
If you are wondering why I collect and analyze the data, let me make a confession, at the risk of sounding like a geek. I enjoy working with the data and more importantly, the data analysis is a gift that keeps on giving for the rest of the year, as I value companies and do corporate financial analysis.
It gives me perspective: In a world where we suffer from data overload, the week that I spend looking at the numbers gives me perspective not only on what comprises normal in corporate financial behavior, but also on the differences across sectors and geographies. Possible, Plausible and Probable: I have long argued that the valuation of a company always starts with a story but that a critical part of the process of converting narrative to value is checking the story for possibility, plausibility and probability. Having the global data aggregated and analyzed can help significantly in making this assessment, since you can see the cross section of revenues and profit margins of companies in the business and see if your assessments are out of line, and if so, whether you have a justification. Rules of thumb: In spite of all of the data that we now have available, investors and companies seem to still rely on rules of thumb devised in a different time and market. Thus, we are told that companies that trade at less than book value, or six times EBITDA, are cheap, and that the target or right debt ratio for a manufacturing company is 40%. Using the global data, we can back up or dispel these rules of thumb and perhaps replace them with more dynamic and meaningful decision rules.Fact-based opinions: Many market prognosticators and economists seem to have no qualms about making up stuff about investor and corporate behavior and stating them as facts. Thus, it has become conventional wisdom that US companies are paying less in taxes that companies operating elsewhere in the globe, and that they have borrowed immense amounts of cash over the last decade to buy back stock. Those "facts" are now driving political debate and may well lead to change in policy, but these are more opinions than facts, and the data can be arbiter.If you are wondering why I am sharing the data, let's get real. Nothing that I am doing is unique, and I have no secret data stashes. In short, anyone with access to data (and there are literally tens of thousands who do) can do the same analysis. I lose nothing by sharing, and I get immense karmic payoffs. So, please use whatever data you want, and in whatever context, and I hope that it saves you time and helps you in your decision making and analysis.
The CaveatsThe last decade has seen big data and crowd wisdom sold as the answers to all of our problems, and as I listen to the sales pitches for both, I would offer a few cautionary notes, born out of spending much of my life time working with data:Data is not objective: The notion that using data makes you objective is nonsense. In fact, the most egregious biases are data-backed, as people with agendas pick and choose the data that confirms their priors. Just as an example, take a look at the data that I have in what US companies paid in taxes in 2019 in this dataset. I have reported a variety of tax rates, not with the intent to confuse, but to note how the numbers change, depending on how you compute them. If you believe, like some do, that US companies are shirking their tax obligations, you can point to average tax rate of 7.32% that I report for all US companies, and note that this is well below the federal corporate tax rate of 21%. However, someone on the other side of this debate can point to the 19.01% average tax rate across only money making companies (since only profits get taxed) as evidence that companies are paying their taxes. Crowds are not always wise: One of the strongest forces in corporate finance is me-tooism, where companies decide how to invest, how much to borrow and what to pay in dividends by looking at what their peers do. In my datasets, I offer them guidance in this process, by reporting debt ratios and dividend payout ratios for sectors, as well as regional breakdowns. The implicit assumption is that what other companies do, on average, must be sensible, but that assumption is not always true. This warning is particularly relevant when you look at the pricing metrics (PE, EV to EBITDA etc.) that I report, by sector and by region. The market may be right, on average, but it can also over price or under price a sector, at times.I respect data, but I don't revere it. I don't believe that just having data will give me an advantage over other investors or make me a better investor, but harnessing that data with intuition and logic may give me a leg up (or at least I hope it does).
YouTube Video
LinksData on my websiteFederal Reserve Data Site (FRED)
December 29, 2019
The Market is Huge! Revisiting the Big Market Delusion
For the high-profile IPOs that have reached the market in 2019, with apologies to Charles Dickens for stealing and mangling his words, it has been the best and the worst of years. On the one hand, you have seen companies like Uber and Slack, each less than a decade old, trading at market capitalizations in the tens of billions of dollars, while working on unformed business models and reporting losses. On the other, many of these new listings have not only had disappointing openings, but have seen their market prices drop in the months after. In September 2019, we did see an implosion in the value of WeWork, another company that started the listing process with lots of promise and a pricing to match, but melted down from a combination of self-inflicted wounds and public market scrutiny. While these companies were very different in their business models (or lack of them), they shared one thing in common. When asked to justify their high pricing, they all pointed to how big the potential markets for their products/services were, captured in their assessments of market size. Uber estimated its total accessible market (TAM) to be in excess of $ 6 trillion, Slack’s judgment was that it had 5 million plus prospective clients across the world and WeWork’s argument was that the commercial real estate market was massive. In short, they were telling big market stories, just as PC makers were in the 1980s, dot com firms in the 1990s and social media companies a decade later. In this post, we will start by conceding the allure of big markets, but argue that the allure can lead to delusional pricing. (This post is a not-so short summary of a paper that Brad Cornell and I have written on this topic. You can find it by clicking here.)
The IngredientsThere is nothing more exciting for a nascent business than the perceived presence of a big market for its products and services, and the attraction is easy to understand. In the minds of entrepreneurs in these markets, big markets offer the promise of easily scalable revenues, which if coupled with profitability, can translate into large profits and high valuations. While this expectation is not unreasonable, overconfidence on the part of business founders and their capital providers can lead to unrealistic judgments of future profits, and overly high estimates for what they think their companies are worth, in what I will term the “big market delusion”. That initial overpricing is a common feature of these markets, but results in an inevitable correction that brings the pricing back to earth. In fact, there are three pieces to this puzzle, and it is when they all come together that you see the most egregious manifestations of the delusion.Big Market: It is the promise of a big market that starts the process rolling, whether it be eCommerce in the 1990s, online advertising between 2010 and 2015, cannabis in 2018 or artificial intelligence today. In each case, the logic of impending change was impeccable, but the extrapolation that the change would lead create huge and profitable markets was made casually. That extrapolation was then used to justify high pricing for every company in the space, with little effort put into separating winners from losers and good from bad business models. Overconfidence: Daniel Kahneman, whose pioneering work with Amos Tversky, gave rise to behavioral finance as a disciple described overconfidence as the mother of all behavioral biases, for three reasons. First, it is ubiquitous, since it seems to be present in an overwhelming proportion of human beings. Second, overconfidence gives teeth to, and augments, all other biases, such as anchoring and framing. Finally, there is reason believe that overconfidence is rooted in evolutionary biology and thus cannot be easily countered. The problem gets worse with big markets, because of a selection bias, since these markets attract entrepreneurs and venture capitalists, who tend to be among the most over confident amongst us. Big markets attract entrepreneurs, over confident that their offerings will be winners in these markets, and venture capitalists, over confident in their capacity to pick the winners. Pricing Game: We will not bore you with another extended discourse on the difference between value and price, but suffice to say that young companies tend to be priced, not valued, and often on raw metrics (users, subscribers, revenues). As a consequence, there is no attempt made to flesh out the "huge market" argument, effectively removing any possibility that entrepreneurs or the venture capitalists funding them will be confronted with the implausibility of their assumptions.The end result is that young companies in big markets will operate in bubbles of overconfidence, leading them to over estimate their chances of succeeding, the revenues they will generate if they do and how much profit they can generate on these revenues: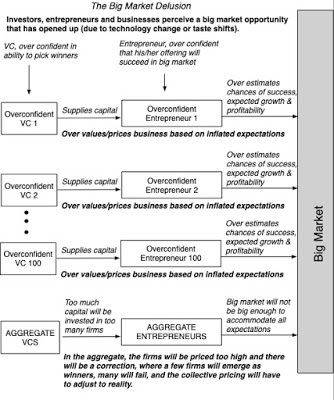
This does not mean that every company in the big market space will be over priced, since a few will succeed and exploit the big market to full effect, but it does mean that the companies will be collectively over priced. As is always the case with markets, there will be a time of reckoning, where investors and managers will wake up to the reality that the big market is not big enough to accommodate all their growth dreams and there will be a correction. In the aftermath, there will be finger-wagging and talk of "never again", but the process will be repeated, albeit in a different form, with the next big market.
Case StudiesWe will not claim originality here, since the big market delusion has always been part of market landscapes, and big markets have always attracted overconfident start ups and investors, creating cycles of bubble and bust. In this section, we will highlight three high profile examples:
1. Internet Retail in 1999 The Big Market: As the internet developed and became accessible to the public in the 1990s, the promise of eCommerce attracted a wave of innovators, from Amazon in online retail in 1994 to Ebay in auctions in 1995, and that innovation was aided by the arrival of Netscape Navigator's browser, opening up the internet to retail consumers and PayPal, facilitating online payments. New businesses were started to take advantage of this growing market with the entrepreneurs using the promise of big market potential to raise money from venture capitalists, who then attached sky-high prices to these companies. By the end of 1999, not only was venture capital flowing in record amounts to young ventures, but 39% of all venture capital was going into internet companies.The Pricing Delusion: The enthusiasm that entrepreneurs and venture capitalists were bringing to online retail companies seeped into public markets, and as public market interest climbed, many young companies found that they could bypass the traditional venture capital route to success and jump directly to public listings. Many of the online retail companies that were listed on public markets in the late 1990s had the characteristics of nascent businesses, with small revenues, unformed business models and large losses, but all of these shortcomings were overwhelmed by the perception of the size of the eCommerce market. In 1999 alone, there were 295 initial public offerings of internet stocks, representing more than 60% of all initial public offerings that year. One measure of the success of these dot.com stocks is that data services created indices to track them. The Bloomberg Internet index was initiated on December 31, 1998, with a hundred young internet companies in it, and it rose 250% in the following year, reaching a peak market capitalization of $2.9 trillion in early 2000. Because the collective revenues of these companies were a fraction of that value, and most of them were losing money, the only way you could justify these market capitalizations was with a combination of very high anticipated revenue growth accompanied by healthy profit margins in steady state, premised on successful entry into a big market. The Correction: The rise of internet stocks was dizzying, in terms of the speed of ascent, but its descent was even more precipitous. The date the bubble burst can be debated, but the NASDAQ, dominated in 2000 by young internet companies, peaked on March 10, 2000, and in the months after, the pricing unraveled as shown in the collapse of the Bloomberg Internet Index: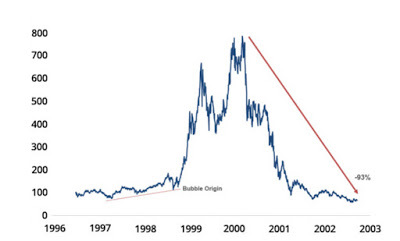 The Bloomberg Internet IndexOf the dozens of publicly traded retail companies in existence in March 2000, more than two-thirds failed, as they ran out of cash (and capital access) and their business models imploded. Even those that survived, like Amazon, faced carnage, losing 90% of their value, and flirting with the possibility of shutting down.
2. Online Advertising in 2015 & 2019 The Big Market: The same internet that gave birth to the dot com boom in the nineties also opened the door to digital advertising and while it was slow to find its footing, the arrival of search engines like Yahoo! and Google fueled its growth. The advent of social media altered the game even more, as businesses realized that not only were they more likely to reach customers on social media sites, but that social media companies also brought in data about their users that would allow for more focused and effective advertising. The net result of all these innovations was that digital advertising grew in the decade from 2005 to 2015, both in absolute numbers and as a percent of total advertising:
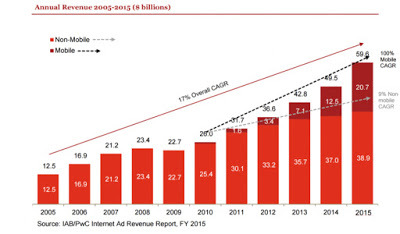
As digital advertising grew, firms that sought a piece of this space also entered the market and were generally rewarded with infusions of capital from both private and public market investors.The Pricing Delusion: In a post in 2015, I looked at how the size of the online advertising market skewed the companies of companies in this market, by looking at publicly traded companies in the space and backing out from the market capitalizations what revenues would have to be in 2025, for investors to break even. To do this, I made assumptions about the rest of the variables required to conduct a DCF valuation (the cost of capital, target operating margin and sales to capital ratio) and held them fixed, while Ie varied the revenue growth rate until I arrived at the current market capitalization. With Facebook in August 2015, for instance, here is what I estimated: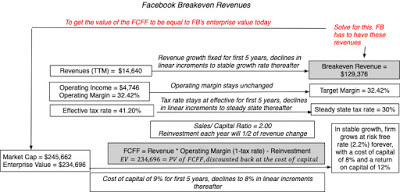
Put simply, for Facebook's market capitalization in 2015 to be justified, its revenues would have to rise to $129,318 million in 2025, with 93% of those revenues coming form online advertising. Repeating this process for all publicly traded online ad companies in August 2015: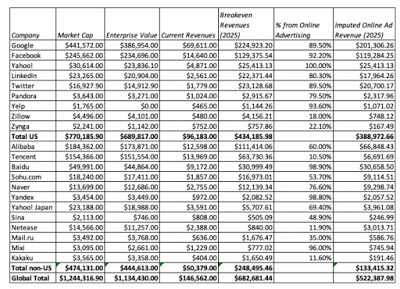 Imputed Revenues in 2025 in millions of US $The total future revenues for all the companies on the list totals $523 billion. Note that this list is not comprehensive, because it excludes some smaller companies that also generate revenues from online advertising and the not-inconsiderable secondary revenues from online advertising, generated by firms in other businesses (such as Apple). It also does not include the online adverting revenues being impounded into the valuations of private businesses like Snapchat, that were waiting in the wings in 2015. Consequently, we are understating the imputed online advertising revenue that was being priced into the market at that time. In 2014, the total advertising market globally was about $545 billion, with $138 billion from digital (online) advertising. Even with optimistic assumptions about the growth in total advertising and the online advertising portion of it climbing to 50% of revenues, the total online advertising market in 2025 comes to $466 billion. The imputed revenues from the publicly traded companies in August 2015 alone exceeds that number, implying that the companies in were being overpriced relative to the market (online advertising) from which their revenues were derived.The Correction? The online ad market has not had a precipitous fall from the heights of 2015, but it has matured. By 2019, not only had investors learned more about the publicly traded companies in the online advertising business, but online advertising matured. Using the same process that we used in 2015, we imputed revenues for 2029 using data up through November 2019. Those calculations are presented in the table below:
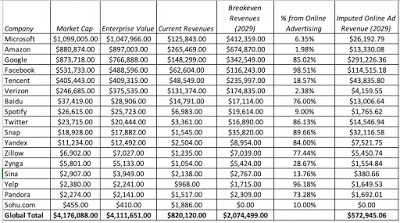 Imputed Revenues in 2029 in millions of US $There are signs that the market has moderated since 2015. First, the number of companies shrank, as some were acquired, some failed, and a few consolidated. Second, the market capitalizations had been recalibrated and starting revenues in 2019 are much greater than they were in 2015. As a result, the breakeven revenue in 2029 is $573 billion, only slightly higher than the imputed revenues from the 2015 calculation, despite being four years further into the future. This suggests that the market is starting to take account of the limits imposed by the size of the underlying market. Third, more of the companies on the list have had moments of reckoning with the market, where they have been asked to show pathways to profitability and not just growth numbers. Two examples are Snap and Twitter. For both companies the market capitalizations have languished because of the perception that their pathways to profitability are rocky. In short, if there is a correction occurring in this market, it seems to be happening in slow motion.
3. Cannabis in October 2018 The Big Market: Until recently, cannabis, in any of its forms, was illegal in every state in the United States in most of the world, but that is changing rapidly. By October 2018, smoking marijuana recreationally and medical marijuana were both legal in nine states, and medical marijuana alone in another 20 states. Outside the United States, much of Europe has always taken a more sanguine view of cannabis, and on October 17, 2018, Canada became the second country (after Uruguay) to legalize the recreational use of the product. In conjunction with this development, new companies were entering the market, hoping to take advantage of what they saw as a “big” market, and excited investors were rewarding them with large market capitalizations. The widespread view as of October 2018 was that the cannabis market would be a big one, in terms of users and revenues. There were concerns that many recreational cannabis users would continue to use the cheaper, illegal version over the regulated but more expensive one, and that US federal law would be slow to change its view on legality. In spite of these caveats, there remained optimism about growth in this market, with the more conservative forecasters predicting that global revenues from marijuana sales will increase to $70 billion in 2024, triple the estimated sales in 2018, and the more daring ones predicting close to $150 billion in sales.The Pricing Delusion: In October 2018, the cannabis market was young and evolving, with Canadian legalization drawing more firms into the business. While many of these firms were small, with little revenue and big operating losses, and most were privately owned, a few of these companies had public listings, primarily on the Canadian market. The table below lists the top ten cannabis companies as of October 14, 2018, with the market capitalizations of each one, in conjunction with each company’s operating numbers (revenues and operating income/losses, in millions of US $).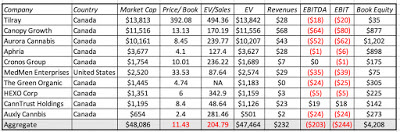 Cannabis Stocks on Oct 14, 2018 ($ values in millions of US$)Note that the most valuable company on the list was Tilray with a market cap of over $13 billion. Tilray had gone public a few months prior, with revenues that barely register ($28 million) and nearly equal operating losses, but had made the news right after its IPO, with its stock price increasing ten-fold in the following weeks, before subsequently losing almost half of its value in the following weeks. Canopy Growth, the largest and most established company on the list, had the highest revenues at $68 million. More generally, all of them trade at astronomical multiples of book value, with a collective market cap in excess of $48 billion, more than 20 times collective revenues and 10 times book value. For each company, the high market capitalization relative to any measure of fundamental value was justified using the same rationale, namely that the cannabis market was big, allowing for huge potential growth. The Correction: In the of the cannabis market, the overreach on the part of both businesses and their investors caught up with them. By October 2019, the assumptions regarding growth and profitability were being universally scaled back, business models were being questioned, and investors were reassessing the pricing of these companies. The best way to see the adjustment is to look the performance of the major cannabis exchange-traded fund, ETFMG, over the period depicted in the figure below:
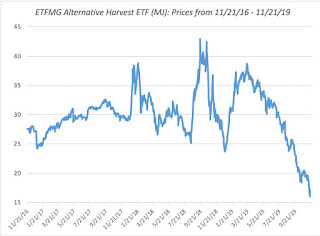 Note that within a period of approximately one year, cannabis stocks lost more than 50% of their aggregate value. The damage cut across the board. Tilray and Canopy Growth, the two largest market capitalization companies in the October 2019 saw their market capitalizations decline by 80.7% and 38.6% respectively. Given that there was no significant shift in fundamentals, the apparent explanation is that investors came to realize that the “big market” was not going to deliver the previously expected growth rates or the profitability for the expanding group of individual companies.
Common ElementsThe three examples that we listed are in very different businesses and have different market settings. That said, there are some common elements that you see in all three, and will in any big market setting:Big Market stories: In every big market delusion, there is one shared feature. When asked to justify the pricing of a company in the market, especially young companies with little to show in terms of fundamentals, entrepreneurs, managers and investors almost always point to macro potential, i.e., that the retail or advertising or cannabis markets were huge. The interesting aspect is that they rarely express the need to go beyond that justification, by explaining why the specific company they were recommending was positioned to take advantage of that growth. In recent years, the big markets have gone from just words to numbers, as young companies point to big total accessible markets (TAM), when seeking higher pricing, often adopting nonsensical notions of what accessible means to get to large numbers. Blindness to competition: When the big market delusion is in force, entrepreneurs, managers and investors generally downplay existing competition, thus failing to factor in the reality that growth will have to be shared with both existing and potential new entrants. With cannabis stocks in late 2018, much of the pricing optimism was driven by the size of the potential market in the United States, assuming legalization, but very few entrepreneurs, managers and investors seemed to consider the likelihood that legalization would attract new players into the market and that illegal sources of supply would maintain their hold on the market.All about growth: When enthusiasm about growth is at its peak, companies focus on growth, often putting business models to the side or even ignoring them completely. That was true in all three of our case studies. With internet stocks, companies typically based their entire pricing pitch on how quickly they were growing. With social media companies, it took an even rawer form, with growth in users and subscribers being the calling cards for higher pricing. Investors, both private and public, not only went along with the pitch but often actively encouraged companies to emphasize growth at the expense of profits.Disconnect from fundamentals: If you combine a focus on growth as the basis for pricing with an absence of concern at these companies about business models, you get pricing that is disconnected from the fundamentals. In all three case studies presented in this paper, at the peak of the pricing run up, most of the stocks in each group had negative earnings (making earnings multiples not meaningful), little to show in assets (making book value multiples difficult to work with) and traded at huge multiples of revenues. Put simply, the pricing losing its moorings in value, but investors who look at only multiples miss the disconnect.The one area where the three case studies diverge is in how the pricing delusion corrects itself. There are also differences in how these markets correct. For instance, the dot com bubble to hit a wall in March 2000 and burst in a few months, as public markets corrected first, followed by private markets, but the question of why it happened at the time that it did remains a mystery. The online advertising run-up has moderated much more gradually over a few years, and if that trend continues, the correction in this market may be smooth enough that investors will not call it a correction. With cannabis stocks, the rise and fall were both precipitous, with the stocks tripling over a few months and losing that rise in the next few months.
Implications
If the big market delusion is a feature of big markets, destined to repeat over time, it behooves us as entrepreneurs, managers, investors and regulators to recognize that reality and modify our behavior.
1. Entrepreneurs and Venture Capitalists
The obvious advice that can be offered to entrepreneurs and venture capitalists, to counter the big market delusion, is to be less over confident, but given that it is not only part of their make up but the driver for exploiting the big market, it will have little effect. Our suggestions are more modest. First, testing out the plausibility of your market size assumptions and the viability of the business model you plan to use to exploit the market on people, whose opinion you value but don't operate in your bubble, is a sensible first step. Second, when you get results from your initial business forays that run counter to what you expected to see, don't be quick to rationalize them away as aberrations. By keeping the feedback loop open, you may be able to improve your business model and adjust your expectations sooner, to reflect reality. Third, build in safety buffers into your model, allowing you to keep operating even if capital dries up (as it inevitably will when the correction arrives), by accumulating cash and avoiding cost commitments that lock you in, like debt and long term cost contracts. Finally, while you may be intent on delivering the metrics that are priced highly, such as users or subscribers, pay attention to building a business model that will work at delivering profits, and if forced to pick between the two objectives, pick the latter.
2.Public Market Investors
The big market delusion almost never stays confined to private markets and sooner or later, the companies in the space list on public markets and are often priced in these markets, at least initially, like they were in private markets. While a risk averse investor may feel it prudent to entirely avoid these stocks, there are opportunities that can be exploited:Momentum investors/traders: The big market delusion is one explanation for the momentum of young, growth stocks. When fascination with a big market like “transportation” takes hold, it can produce momentum in the prices of innovative companies in that space such as Uber and Lyft, and significant profits along the way. The risk, of course, is that the big market delusion fades and the market corrects as has happened in the case of both Uber and Lyft. As we have emphasized, however, there appears to be no way to time such corrections. Value investors: The obvious advice is to avoid young, growth stocks whose value is based on big market stories. But that carries its own risk. In the twelve year stretch beginning in 2007, growth stocks have dramatically outperformed value stocks. As one example, during this period the Russell 1000 growth index outperformed the Russell 1000 value index by an astonishing 4.3% per year. That outperformance was driven in part by stories regarding how technology companies were going to disrupt or invent big markets from housing to entertainment to automobiles. There is a riskier, higher payoff, strategy. Since the big market delusion leads to a collective over pricing, value investors can bet against a basket of stocks (sell short on an ETF like the ETFMG) and hope that the correction occurs soon enough to reap rewards.In sum, though, young companies make markets interesting and by making them interesting, they increase liquidity and trading. 3. Governments and Market Regulators In the aftermath of every correction, there are many who look back at the bubble as an example of irrational exuberance. A few have gone further and argued that such episodes are bad for markets, and suggested fixes, some disclosure-related and some putting restrictions on investors and companies. In fact, in the aftermath of every bursting bubble, you hear talk of how more disclosure and regulations will prevent the next bubble. After three centuries of futility, where the regulations passed in response to one bubble often are at the heart of the next one, you would think that we would learn, but we don't. In fact, over confidence will overwhelm almost every regulatory and disclosure barrier that you can throw up. We also believe that these critics are missing the point. Not only are bubbles part and parcel of markets, they are not necessarily a negative. The dot com bubble changed the way we live, altering not only how we shop but how we travel, plan and communicate with each other. What is more, some of the best performing companies of the last two decades emerged from the debris. Amazon.com, a poster child for dot com excess, survived the collapse and has become a company with a trillion-dollar market capitalization. Our policy advice to politicians, regulators and investors then is to stop trying to make bubbles go away. In our view, requiring more disclosure, regulating trading and legislating moderation are never going to stop human beings from overreaching. The enthusiasm for big markets may lead to added price volatility, but it is also a spur for innovation, and the benefits of that innovation, in our view, outweigh the costs of the volatility. We would choose the chaos of bubbles, and the change that they create, over a world run by actuaries, where we would still be living in caves, weighing the probabilities of whether fire is a good invention or not.
Conclusion
Overconfident in their own abilities, entrepreneurs and venture capitalists are naturally drawn to big markets which offer companies the possibility of huge valuations if they can effectively exploit them. And there are always examples of a few immense successes, like Amazon, to fuel the fire. This leads to a big market delusion, resulting in too many new companies being founded to take advantage of big markets, each company being overpriced by its cluster of founders and venture capitalists. This overconfidence then feeds into public markets, where investors get their cues on price and relevant metrics from private market investors, leading to inflated values in those markets. This results in eventual corrections as the evidence accumulates that growth has to be shared and profitability may be difficult to achieve in a competitive environment. This post is a long one, but if you find it interesting, Brad Cornell and I have a paper expounding a more complete picture here. As always, your feedback is appreciated!
Paper on the big market delusionThe Big Market Delusion: Valuation and Investment ImplicationsPrevious posts relating to the big market delusionBig Markets, Over Confidence and the Macro Delusion (October 2015)High and Higher: The Money in Marijuana (October 2018)
The IngredientsThere is nothing more exciting for a nascent business than the perceived presence of a big market for its products and services, and the attraction is easy to understand. In the minds of entrepreneurs in these markets, big markets offer the promise of easily scalable revenues, which if coupled with profitability, can translate into large profits and high valuations. While this expectation is not unreasonable, overconfidence on the part of business founders and their capital providers can lead to unrealistic judgments of future profits, and overly high estimates for what they think their companies are worth, in what I will term the “big market delusion”. That initial overpricing is a common feature of these markets, but results in an inevitable correction that brings the pricing back to earth. In fact, there are three pieces to this puzzle, and it is when they all come together that you see the most egregious manifestations of the delusion.Big Market: It is the promise of a big market that starts the process rolling, whether it be eCommerce in the 1990s, online advertising between 2010 and 2015, cannabis in 2018 or artificial intelligence today. In each case, the logic of impending change was impeccable, but the extrapolation that the change would lead create huge and profitable markets was made casually. That extrapolation was then used to justify high pricing for every company in the space, with little effort put into separating winners from losers and good from bad business models. Overconfidence: Daniel Kahneman, whose pioneering work with Amos Tversky, gave rise to behavioral finance as a disciple described overconfidence as the mother of all behavioral biases, for three reasons. First, it is ubiquitous, since it seems to be present in an overwhelming proportion of human beings. Second, overconfidence gives teeth to, and augments, all other biases, such as anchoring and framing. Finally, there is reason believe that overconfidence is rooted in evolutionary biology and thus cannot be easily countered. The problem gets worse with big markets, because of a selection bias, since these markets attract entrepreneurs and venture capitalists, who tend to be among the most over confident amongst us. Big markets attract entrepreneurs, over confident that their offerings will be winners in these markets, and venture capitalists, over confident in their capacity to pick the winners. Pricing Game: We will not bore you with another extended discourse on the difference between value and price, but suffice to say that young companies tend to be priced, not valued, and often on raw metrics (users, subscribers, revenues). As a consequence, there is no attempt made to flesh out the "huge market" argument, effectively removing any possibility that entrepreneurs or the venture capitalists funding them will be confronted with the implausibility of their assumptions.The end result is that young companies in big markets will operate in bubbles of overconfidence, leading them to over estimate their chances of succeeding, the revenues they will generate if they do and how much profit they can generate on these revenues:

This does not mean that every company in the big market space will be over priced, since a few will succeed and exploit the big market to full effect, but it does mean that the companies will be collectively over priced. As is always the case with markets, there will be a time of reckoning, where investors and managers will wake up to the reality that the big market is not big enough to accommodate all their growth dreams and there will be a correction. In the aftermath, there will be finger-wagging and talk of "never again", but the process will be repeated, albeit in a different form, with the next big market.
Case StudiesWe will not claim originality here, since the big market delusion has always been part of market landscapes, and big markets have always attracted overconfident start ups and investors, creating cycles of bubble and bust. In this section, we will highlight three high profile examples:
1. Internet Retail in 1999 The Big Market: As the internet developed and became accessible to the public in the 1990s, the promise of eCommerce attracted a wave of innovators, from Amazon in online retail in 1994 to Ebay in auctions in 1995, and that innovation was aided by the arrival of Netscape Navigator's browser, opening up the internet to retail consumers and PayPal, facilitating online payments. New businesses were started to take advantage of this growing market with the entrepreneurs using the promise of big market potential to raise money from venture capitalists, who then attached sky-high prices to these companies. By the end of 1999, not only was venture capital flowing in record amounts to young ventures, but 39% of all venture capital was going into internet companies.The Pricing Delusion: The enthusiasm that entrepreneurs and venture capitalists were bringing to online retail companies seeped into public markets, and as public market interest climbed, many young companies found that they could bypass the traditional venture capital route to success and jump directly to public listings. Many of the online retail companies that were listed on public markets in the late 1990s had the characteristics of nascent businesses, with small revenues, unformed business models and large losses, but all of these shortcomings were overwhelmed by the perception of the size of the eCommerce market. In 1999 alone, there were 295 initial public offerings of internet stocks, representing more than 60% of all initial public offerings that year. One measure of the success of these dot.com stocks is that data services created indices to track them. The Bloomberg Internet index was initiated on December 31, 1998, with a hundred young internet companies in it, and it rose 250% in the following year, reaching a peak market capitalization of $2.9 trillion in early 2000. Because the collective revenues of these companies were a fraction of that value, and most of them were losing money, the only way you could justify these market capitalizations was with a combination of very high anticipated revenue growth accompanied by healthy profit margins in steady state, premised on successful entry into a big market. The Correction: The rise of internet stocks was dizzying, in terms of the speed of ascent, but its descent was even more precipitous. The date the bubble burst can be debated, but the NASDAQ, dominated in 2000 by young internet companies, peaked on March 10, 2000, and in the months after, the pricing unraveled as shown in the collapse of the Bloomberg Internet Index:
 The Bloomberg Internet IndexOf the dozens of publicly traded retail companies in existence in March 2000, more than two-thirds failed, as they ran out of cash (and capital access) and their business models imploded. Even those that survived, like Amazon, faced carnage, losing 90% of their value, and flirting with the possibility of shutting down.
 2. Online Advertising in 2015 & 2019 The Big Market: The same internet that gave birth to the dot com boom in the nineties also opened the door to digital advertising and while it was slow to find its footing, the arrival of search engines like Yahoo! and Google fueled its growth. The advent of social media altered the game even more, as businesses realized that not only were they more likely to reach customers on social media sites, but that social media companies also brought in data about their users that would allow for more focused and effective advertising. The net result of all these innovations was that digital advertising grew in the decade from 2005 to 2015, both in absolute numbers and as a percent of total advertising:

As digital advertising grew, firms that sought a piece of this space also entered the market and were generally rewarded with infusions of capital from both private and public market investors.The Pricing Delusion: In a post in 2015, I looked at how the size of the online advertising market skewed the companies of companies in this market, by looking at publicly traded companies in the space and backing out from the market capitalizations what revenues would have to be in 2025, for investors to break even. To do this, I made assumptions about the rest of the variables required to conduct a DCF valuation (the cost of capital, target operating margin and sales to capital ratio) and held them fixed, while Ie varied the revenue growth rate until I arrived at the current market capitalization. With Facebook in August 2015, for instance, here is what I estimated:

Put simply, for Facebook's market capitalization in 2015 to be justified, its revenues would have to rise to $129,318 million in 2025, with 93% of those revenues coming form online advertising. Repeating this process for all publicly traded online ad companies in August 2015:
 Imputed Revenues in 2025 in millions of US $The total future revenues for all the companies on the list totals $523 billion. Note that this list is not comprehensive, because it excludes some smaller companies that also generate revenues from online advertising and the not-inconsiderable secondary revenues from online advertising, generated by firms in other businesses (such as Apple). It also does not include the online adverting revenues being impounded into the valuations of private businesses like Snapchat, that were waiting in the wings in 2015. Consequently, we are understating the imputed online advertising revenue that was being priced into the market at that time. In 2014, the total advertising market globally was about $545 billion, with $138 billion from digital (online) advertising. Even with optimistic assumptions about the growth in total advertising and the online advertising portion of it climbing to 50% of revenues, the total online advertising market in 2025 comes to $466 billion. The imputed revenues from the publicly traded companies in August 2015 alone exceeds that number, implying that the companies in were being overpriced relative to the market (online advertising) from which their revenues were derived.The Correction? The online ad market has not had a precipitous fall from the heights of 2015, but it has matured. By 2019, not only had investors learned more about the publicly traded companies in the online advertising business, but online advertising matured. Using the same process that we used in 2015, we imputed revenues for 2029 using data up through November 2019. Those calculations are presented in the table below:
 Imputed Revenues in 2029 in millions of US $There are signs that the market has moderated since 2015. First, the number of companies shrank, as some were acquired, some failed, and a few consolidated. Second, the market capitalizations had been recalibrated and starting revenues in 2019 are much greater than they were in 2015. As a result, the breakeven revenue in 2029 is $573 billion, only slightly higher than the imputed revenues from the 2015 calculation, despite being four years further into the future. This suggests that the market is starting to take account of the limits imposed by the size of the underlying market. Third, more of the companies on the list have had moments of reckoning with the market, where they have been asked to show pathways to profitability and not just growth numbers. Two examples are Snap and Twitter. For both companies the market capitalizations have languished because of the perception that their pathways to profitability are rocky. In short, if there is a correction occurring in this market, it seems to be happening in slow motion.
3. Cannabis in October 2018 The Big Market: Until recently, cannabis, in any of its forms, was illegal in every state in the United States in most of the world, but that is changing rapidly. By October 2018, smoking marijuana recreationally and medical marijuana were both legal in nine states, and medical marijuana alone in another 20 states. Outside the United States, much of Europe has always taken a more sanguine view of cannabis, and on October 17, 2018, Canada became the second country (after Uruguay) to legalize the recreational use of the product. In conjunction with this development, new companies were entering the market, hoping to take advantage of what they saw as a “big” market, and excited investors were rewarding them with large market capitalizations. The widespread view as of October 2018 was that the cannabis market would be a big one, in terms of users and revenues. There were concerns that many recreational cannabis users would continue to use the cheaper, illegal version over the regulated but more expensive one, and that US federal law would be slow to change its view on legality. In spite of these caveats, there remained optimism about growth in this market, with the more conservative forecasters predicting that global revenues from marijuana sales will increase to $70 billion in 2024, triple the estimated sales in 2018, and the more daring ones predicting close to $150 billion in sales.The Pricing Delusion: In October 2018, the cannabis market was young and evolving, with Canadian legalization drawing more firms into the business. While many of these firms were small, with little revenue and big operating losses, and most were privately owned, a few of these companies had public listings, primarily on the Canadian market. The table below lists the top ten cannabis companies as of October 14, 2018, with the market capitalizations of each one, in conjunction with each company’s operating numbers (revenues and operating income/losses, in millions of US $).
 Cannabis Stocks on Oct 14, 2018 ($ values in millions of US$)Note that the most valuable company on the list was Tilray with a market cap of over $13 billion. Tilray had gone public a few months prior, with revenues that barely register ($28 million) and nearly equal operating losses, but had made the news right after its IPO, with its stock price increasing ten-fold in the following weeks, before subsequently losing almost half of its value in the following weeks. Canopy Growth, the largest and most established company on the list, had the highest revenues at $68 million. More generally, all of them trade at astronomical multiples of book value, with a collective market cap in excess of $48 billion, more than 20 times collective revenues and 10 times book value. For each company, the high market capitalization relative to any measure of fundamental value was justified using the same rationale, namely that the cannabis market was big, allowing for huge potential growth. The Correction: In the of the cannabis market, the overreach on the part of both businesses and their investors caught up with them. By October 2019, the assumptions regarding growth and profitability were being universally scaled back, business models were being questioned, and investors were reassessing the pricing of these companies. The best way to see the adjustment is to look the performance of the major cannabis exchange-traded fund, ETFMG, over the period depicted in the figure below:
 Note that within a period of approximately one year, cannabis stocks lost more than 50% of their aggregate value. The damage cut across the board. Tilray and Canopy Growth, the two largest market capitalization companies in the October 2019 saw their market capitalizations decline by 80.7% and 38.6% respectively. Given that there was no significant shift in fundamentals, the apparent explanation is that investors came to realize that the “big market” was not going to deliver the previously expected growth rates or the profitability for the expanding group of individual companies.
Common ElementsThe three examples that we listed are in very different businesses and have different market settings. That said, there are some common elements that you see in all three, and will in any big market setting:Big Market stories: In every big market delusion, there is one shared feature. When asked to justify the pricing of a company in the market, especially young companies with little to show in terms of fundamentals, entrepreneurs, managers and investors almost always point to macro potential, i.e., that the retail or advertising or cannabis markets were huge. The interesting aspect is that they rarely express the need to go beyond that justification, by explaining why the specific company they were recommending was positioned to take advantage of that growth. In recent years, the big markets have gone from just words to numbers, as young companies point to big total accessible markets (TAM), when seeking higher pricing, often adopting nonsensical notions of what accessible means to get to large numbers. Blindness to competition: When the big market delusion is in force, entrepreneurs, managers and investors generally downplay existing competition, thus failing to factor in the reality that growth will have to be shared with both existing and potential new entrants. With cannabis stocks in late 2018, much of the pricing optimism was driven by the size of the potential market in the United States, assuming legalization, but very few entrepreneurs, managers and investors seemed to consider the likelihood that legalization would attract new players into the market and that illegal sources of supply would maintain their hold on the market.All about growth: When enthusiasm about growth is at its peak, companies focus on growth, often putting business models to the side or even ignoring them completely. That was true in all three of our case studies. With internet stocks, companies typically based their entire pricing pitch on how quickly they were growing. With social media companies, it took an even rawer form, with growth in users and subscribers being the calling cards for higher pricing. Investors, both private and public, not only went along with the pitch but often actively encouraged companies to emphasize growth at the expense of profits.Disconnect from fundamentals: If you combine a focus on growth as the basis for pricing with an absence of concern at these companies about business models, you get pricing that is disconnected from the fundamentals. In all three case studies presented in this paper, at the peak of the pricing run up, most of the stocks in each group had negative earnings (making earnings multiples not meaningful), little to show in assets (making book value multiples difficult to work with) and traded at huge multiples of revenues. Put simply, the pricing losing its moorings in value, but investors who look at only multiples miss the disconnect.The one area where the three case studies diverge is in how the pricing delusion corrects itself. There are also differences in how these markets correct. For instance, the dot com bubble to hit a wall in March 2000 and burst in a few months, as public markets corrected first, followed by private markets, but the question of why it happened at the time that it did remains a mystery. The online advertising run-up has moderated much more gradually over a few years, and if that trend continues, the correction in this market may be smooth enough that investors will not call it a correction. With cannabis stocks, the rise and fall were both precipitous, with the stocks tripling over a few months and losing that rise in the next few months.
Implications
If the big market delusion is a feature of big markets, destined to repeat over time, it behooves us as entrepreneurs, managers, investors and regulators to recognize that reality and modify our behavior.
1. Entrepreneurs and Venture Capitalists
The obvious advice that can be offered to entrepreneurs and venture capitalists, to counter the big market delusion, is to be less over confident, but given that it is not only part of their make up but the driver for exploiting the big market, it will have little effect. Our suggestions are more modest. First, testing out the plausibility of your market size assumptions and the viability of the business model you plan to use to exploit the market on people, whose opinion you value but don't operate in your bubble, is a sensible first step. Second, when you get results from your initial business forays that run counter to what you expected to see, don't be quick to rationalize them away as aberrations. By keeping the feedback loop open, you may be able to improve your business model and adjust your expectations sooner, to reflect reality. Third, build in safety buffers into your model, allowing you to keep operating even if capital dries up (as it inevitably will when the correction arrives), by accumulating cash and avoiding cost commitments that lock you in, like debt and long term cost contracts. Finally, while you may be intent on delivering the metrics that are priced highly, such as users or subscribers, pay attention to building a business model that will work at delivering profits, and if forced to pick between the two objectives, pick the latter.
2.Public Market Investors
The big market delusion almost never stays confined to private markets and sooner or later, the companies in the space list on public markets and are often priced in these markets, at least initially, like they were in private markets. While a risk averse investor may feel it prudent to entirely avoid these stocks, there are opportunities that can be exploited:Momentum investors/traders: The big market delusion is one explanation for the momentum of young, growth stocks. When fascination with a big market like “transportation” takes hold, it can produce momentum in the prices of innovative companies in that space such as Uber and Lyft, and significant profits along the way. The risk, of course, is that the big market delusion fades and the market corrects as has happened in the case of both Uber and Lyft. As we have emphasized, however, there appears to be no way to time such corrections. Value investors: The obvious advice is to avoid young, growth stocks whose value is based on big market stories. But that carries its own risk. In the twelve year stretch beginning in 2007, growth stocks have dramatically outperformed value stocks. As one example, during this period the Russell 1000 growth index outperformed the Russell 1000 value index by an astonishing 4.3% per year. That outperformance was driven in part by stories regarding how technology companies were going to disrupt or invent big markets from housing to entertainment to automobiles. There is a riskier, higher payoff, strategy. Since the big market delusion leads to a collective over pricing, value investors can bet against a basket of stocks (sell short on an ETF like the ETFMG) and hope that the correction occurs soon enough to reap rewards.In sum, though, young companies make markets interesting and by making them interesting, they increase liquidity and trading. 3. Governments and Market Regulators In the aftermath of every correction, there are many who look back at the bubble as an example of irrational exuberance. A few have gone further and argued that such episodes are bad for markets, and suggested fixes, some disclosure-related and some putting restrictions on investors and companies. In fact, in the aftermath of every bursting bubble, you hear talk of how more disclosure and regulations will prevent the next bubble. After three centuries of futility, where the regulations passed in response to one bubble often are at the heart of the next one, you would think that we would learn, but we don't. In fact, over confidence will overwhelm almost every regulatory and disclosure barrier that you can throw up. We also believe that these critics are missing the point. Not only are bubbles part and parcel of markets, they are not necessarily a negative. The dot com bubble changed the way we live, altering not only how we shop but how we travel, plan and communicate with each other. What is more, some of the best performing companies of the last two decades emerged from the debris. Amazon.com, a poster child for dot com excess, survived the collapse and has become a company with a trillion-dollar market capitalization. Our policy advice to politicians, regulators and investors then is to stop trying to make bubbles go away. In our view, requiring more disclosure, regulating trading and legislating moderation are never going to stop human beings from overreaching. The enthusiasm for big markets may lead to added price volatility, but it is also a spur for innovation, and the benefits of that innovation, in our view, outweigh the costs of the volatility. We would choose the chaos of bubbles, and the change that they create, over a world run by actuaries, where we would still be living in caves, weighing the probabilities of whether fire is a good invention or not.
Conclusion
Overconfident in their own abilities, entrepreneurs and venture capitalists are naturally drawn to big markets which offer companies the possibility of huge valuations if they can effectively exploit them. And there are always examples of a few immense successes, like Amazon, to fuel the fire. This leads to a big market delusion, resulting in too many new companies being founded to take advantage of big markets, each company being overpriced by its cluster of founders and venture capitalists. This overconfidence then feeds into public markets, where investors get their cues on price and relevant metrics from private market investors, leading to inflated values in those markets. This results in eventual corrections as the evidence accumulates that growth has to be shared and profitability may be difficult to achieve in a competitive environment. This post is a long one, but if you find it interesting, Brad Cornell and I have a paper expounding a more complete picture here. As always, your feedback is appreciated!
Paper on the big market delusionThe Big Market Delusion: Valuation and Investment ImplicationsPrevious posts relating to the big market delusionBig Markets, Over Confidence and the Macro Delusion (October 2015)High and Higher: The Money in Marijuana (October 2018)
Aswath Damodaran's Blog

- Aswath Damodaran's profile
- 725 followers
Aswath Damodaran isn't a Goodreads Author
(yet),
but they
do have a blog,
so here are some recent posts imported from
their feed.

