
Nate Silver's Blog, page 170
June 24, 2014
World Cup Advancement Scenarios For Groups C And D
Tuesday’s World Cup matches will determine which teams advance from Groups C and D. Although Colombia and Costa Rica are locks for the Round of 16, and England is eliminated, it remains to be determined which side will come out on top of each group. Let’s take a look at the possibilities in Brazil.
Group D
Group D will kick off first, with Costa Rica and England playing in Belo Horizonte. Italy and Uruguay will tangle in Natal. The scenarios in Group D are quite simple.
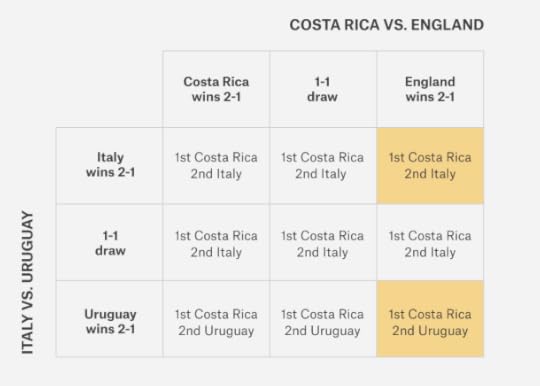
If Italy draws or beats Uruguay, Italy will advance. If Uruguay wins, it will advance instead. Costa Rica is certain to advance regardless of its result against England, whose slim chances of advancing after a loss to Uruguay last week have already gone to zero.
Costa Rica will qualify as the first-place team unless it loses to England and the winner of the Uruguay-Italy match makes up the goal differential deficit. The chart above assumes that all wins come by a 2-1 score and all draws are 1-1. (These are some of the most common scores for wins and draws, respectively.) But I’ve highlighted, in yellow, the cases in which a different score could make a difference in the group standings. For example, a 2-0 Italy win and a 2-0 loss by Costa Rica against England would advance Italy in first place and Costa Rica in second. Still, Costa Rica has an 89.0 percent chance of finishing first.
Group C
Colombia is all but certain to emerge as Group C’s winner. It has a 98.5 percent chance of doing so, according to the FiveThirtyEight forecast, and can guarantee its victory over the group by winning or drawing against Japan.
A win or draw by Colombia would also make it easy to determine the second-place team from Group C: whichever side wins the match between Ivory Coast and Greece.

The more complicated cases come if Colombia loses to Japan. If Japan wins and Greece wins, too, for example, then Colombia would take first with six points while Japan and Greece would be tied for second with four points. (Ivory Coast would be out of the tournament.) Japan has a better goal differential than Greece, however, and so would be favored to make the knockout stage.
A Japan win and a draw between Ivory Coast and Greece would produce a tie for second place between Japan and Ivory Coast. In that case, Ivory Coast would be favored to advance on the basis of its superior goal differential and head-to-head win over Japan.
Colombia could be knocked into second place only if it loses and Ivory Coast wins, results that would give each team six points. But Colombia has the tiebreakers in its favor, so it would have to lose by a lot, and Ivory Coast would have to win my a good margin, for Los Cafeteros to end up No. 2.


June 23, 2014
The Outcomes of Groups A And B Will Be Decided Today
Monday marks the end of the beginning of the World Cup: the simultaneous matches phase. At 4 p.m. EDT, all teams from Group A will kick off: Brazil will play Cameroon in Brasilia, Brazil, while Mexico will play Croatia in Recife. FIFA schedules these matches simultaneously so that no team might benefit from knowing the score of the other match ahead of time, which could potentially impact strategy.
These are the final matches of the group phase and therefore will determine who advances. Sometimes, working through the permutations is easy — as it is in Group B, where the Netherlands and Chile have already guaranteed advancement and are playing only to determine who finishes first in the group. But other cases, like the United States’ Group G, are more complicated.
FiveThirtyEight’s World Cup forecasts project the results in a probabilistic fashion, showing each team’s odds of winning and advancing from its group. But we’ll also be working through the possibilities in a more detailed way with matrices, such as the one you see below:

That was the simple case I mentioned before: Group B, which will play its matches at noon Monday. The Netherlands will advance first in the group if it beats Chile or draws with it; Chile will do so if it beats the Netherlands by any margin. Australia and Spain are already mathematically eliminated from the tournament, and their game won’t make any difference.
But the Chile-Netherlands game matters more than you might think: Up for grabs is the right not to have to face Brazil in the Round of 16, which the second-place team from Group B will probably have to do.
Brazil’s Group A is more complicated, even though most scenarios result in Brazil finishing in first place. Cameroon has been eliminated. Brazil is almost certain to advance, but there are wild-card scenarios where it might not. Mexico can guarantee advancement with a win or draw against Croatia. A Croatia win means that it advances while Mexico almost certainly does not. This is what that group looks like:
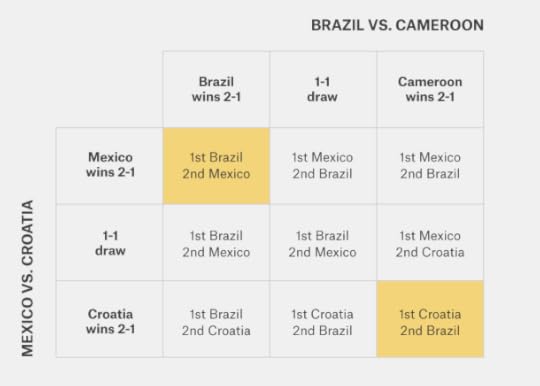
I’m assuming, as a default, that all wins come by a 2-1 scoreline while all draws are 1-1. Cases where the exact score matters are highlighted in yellow.
Brazil and Mexico, for instance, are tied atop Group A with four points, but Brazil is ahead on the goal-differential tiebreaker. If both teams win their matches Monday, both will advance with seven points. Will Brazil advance as the first-place team? Yes, if both wins come by our default 2-1 scoreline or under most other realistic scenarios. But it’s theoretically possible that Mexico could surpass Brazil — for example, if it beats Croatia 3-0 while Brazil beats Cameroon 1-0.
The more treacherous case for Brazil — albeit extremely unlikely because it’s so heavily favored to beat Cameroon — is if Brazil and Mexico lose. In that case, Croatia will qualify first in the group. Brazil and Mexico will be stuck on four points and tied for second. If Brazil lost by a wider margin than Mexico, it could fail to advance.
There’s also one case where Brazil would be denied advancement outright. That comes if it loses to Cameroon, and Mexico and Croatia draw. Then the group standings would be: Mexico 5 points, Croatia 4, Brazil 4, Cameroon 3. Mexico qualifies first and Croatia and Brazil are tied for second. But Brazil would be guaranteed to lose the goal-differential tiebreaker because it and Croatia currently have the same goal differential (+2) and Brazil’s would worsen with its loss while Croatia’s would stay the same with its draw. Fortunately for Brazil, the probability of this happening is only about 0.5 percent.

June 22, 2014
How the Portugal Draw Boosts the U.S.’s World Cup Advancement Odds
The United States was seconds away from defeating Portugal on Sunday when Michael Bradley, normally one of the steadiest American players, mishandled a ball in midfield and gave Portugal a last opportunity. Silvestre Varela took advantage, scoring on a header.
But the 2-2 draw was a result the U.S. might have been happy with before the match began. It improved the Americans’ odds of advancing to the knockout round of the World Cup. Those chances are up to 76 percent, according to the FiveThirtyEight forecast, an improvement from 65 percent before Sunday’s match.
That 76 percent figure may even be slightly low, for reasons I’ll explain in a moment. Still, the U.S. will not be guaranteed advancement unless it manages at least a draw against Germany on Thursday in Recife, Brazil. If the U.S. loses, the Portugal-Ghana game, which will kick off simultaneously in Brasilia, could cause heartbreak for Americans. You may want to have two screens at your disposal for Thursday’s matches.
The U.S. has essentially three ways to advance to the knockout stage:
The easy way. First, it could draw or beat Germany. That might not sound so challenging, but the Germans are the third-best team in the world, according to ESPN’s Soccer Power Index. Our forecast gives the U.S. a 14 percent chance of a win and a 22 percent chance of a draw — but a 64 percent chance of a loss. As a bonus, however, the U.S. will advance first from Group G if it beats Germany. That matters because the first-place team from Group G is likely to face Russia or Algeria in the Round of 16 — while the second-place team will face a stronger side in Belgium.The almost-as-easy way. Next, the United States could lose to Germany but advance if Ghana and Portugal draw in Brasilia. Our forecast puts the chance of a Ghana-Portugal draw at 29 percent.The hard way. Finally, the U.S. could lose to Germany but advance because it edges either Portugal or Ghana — whichever team wins in Brasilia — on goal differential or another ofJune 21, 2014
Germany’s Draw Didn’t Help the U.S.
Germany drew Ghana 2-2 on Saturday in one of the most exciting matches of the World Cup. The result has some tricky effects for the United States, which will play Portugal in Manaus, Brazil, on Sunday. It increases the chance that the U.S. will finish first in Group G — that probability is now 20 percent, compared with 11 percent before the match. However, it slightly reduces the Americans’ overall chances of advancing. Those odds are down to 64 percent from 69 percent before.
The reason is a bit technical. One of the likelier outcomes for the Americans is to finish with four points in the group by drawing Portugal or Germany but losing the other match. If Ghana had lost to Germany, it would have finished with three points at best. Now, however, Ghana could also finish with four points if it beats Portugal, potentially denying the U.S. advancement if the teams finish in a tie for second.
Let’s update our earlier assessment of the nine potential scenarios for the Americans:
Beat Portugal, beat Germany. The U.S. advances as the first-place team from Group G.
Beat Portugal, draw Germany. This also guarantees the U.S. first place. (If Germany had beaten Ghana, this would have meant a first-place tie instead.)
Beat Portugal, lose to Germany. The U.S. advances as the second-place team from Group G. (Previously, there was an outside chance that the U.S. could have failed to advance despite accumulating two wins in the group, but this possibility was eliminated by Saturday’s draw.)
Draw Portugal, beat Germany. The U.S. advances in first place.
Draw Portugal, draw Germany. The U.S. and Germany tie atop the group with five points, but Germany gets the first position on the basis of goal differential. The U.S. advances as the second team from Group G instead.
Draw Portugal, lose to Germany. This outcome depends on the result of the Portugal-Ghana match:
If Portugal beats Ghana, the U.S. and Portugal tie for second. The U.S. is favored (although not guaranteed) to advance based on goal differential because Portugal’s 4-0 loss against Germany could come back to haunt it.If Ghana beats Portugal, the U.S. and Ghana tie for second. This is a more dangerous case for the United States. For example, if it loses to Germany by more than one goal, or Ghana beats Portugal by more than one goal, the U.S. will lose the tiebreaker to Ghana. It also doesn’t help the U.S. that Ghana’s match against Germany was high-scoring because FIFA’s second tiebreaker is based on the number of goals scored. For example, if the U.S. draws Portugal 1-1, loses to Germany 1-0, and Ghana beats Portugal 1-0, then the U.S. and Ghana will have even goal differentials. But Ghana will have four goals scored to the Americans’ three and Ghana will advance.If Portugal draws Ghana, the U.S. finishes in sole possession of second place and advances.Lose to Portugal, beat Germany. The U.S. advances, probably as the first-place team, although Portugal could knock the U.S. into second if it also beats Ghana and makes up its lopsided goal differential.
Lose to Portugal, draw Germany. This isn’t such a favorable outcome for the Americans, but it depends on what happens between Portugal and Ghana.
If Portugal beats Ghana, the U.S. finishes third in the group and is out of the World Cup.If Portugal draws Ghana, the U.S. finishes tied for second with Portugal. This becomes dangerous if the U.S. loss to Portugal is by more than one goal since that simultaneously helps Portugal’s goal differential and hurts the United States’. For instance, if the U.S loses to Portugal 2-0, draws Germany 1-1, and Portugal beats Ghana 2-1, then Portugal would advance.If Ghana beats Portugal, the U.S. finishes tied for second with Ghana and it comes down to the tiebreaker.Lose to Portugal, lose to Germany. The U.S. is out of the tournament. (Previously, there was an outside chance the U.S. could have advanced despite losing its remaining matches, but this possibility was eliminated by Saturday’s draw.)
None of this should radically change the Americans’ game plan for Sunday. A win puts it into the knockout round. A draw is still a reasonably good result, but slightly more dangerous than before because Ghana remains alive in the tournament.

June 20, 2014
It’s Been the Americas’ World Cup
Before the World Cup began, FiveThirtyEight’s projections, which are based on ESPN’s Soccer Power Index (SPI), were higher for teams from South America and lower for teams from Europe than other ratings systems’.
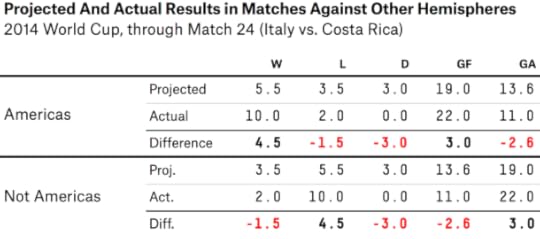
So far, that’s looked like a reasonably sharp assessment. And if we extend the analysis from continents to hemispheres — with teams from North America and South America in one group, and those from Europe, Africa and Asia in the other — it looks like we may even have underestimated teams from the Americas.
First, let’s look at the results by continental confederation. The table below evaluates each confederation’s results so far and compares them with the FiveThirtyEight/SPI forecast before the tournament. It includes results through Friday afternoon’s game between Costa Rica and Italy, and excludes games (such as the France-Switzerland match that I’m watching now) between teams from the same confederation.

Before the tournament, our projections expected South American teams to have compiled 5.7 wins, 2.0 losses and 2.3 draws through this point in the World Cup. In fact, their record is 7-2-1. Not a huge difference, but the South American teams have more than held up their side of the bargain.
Teams from Europe, by contrast, are 5-6-2 in games played against other confederations, compared with an expected record of 5.1 wins, 4.6 losses and 3.3 draws. Pretty close, although a pinch worse than expected.
It’s teams from North America’s CONCACAF federation, instead, that have produced the largest discrepancy. They’re 4-1-1 so far, much better than their meager expected record of 1.4 wins, 3.1 losses and 1.5 draws. Meanwhile, teams from Asia and Africa, although not expected to be much good, are struggling with a combined record of just 1-8-4 so far.
A still more striking result comes when you combine the continents into hemispheres (counting Europe along with Asia and Africa in one hemisphere and the Americas in another). In inter-hemisphere matches so far, the Americas have 10 wins against just two losses. The rest of the world has the opposite record: 2-10-0.
What accounts for the differences? The least sexy explanation might be luck: We’re not talking about all that large a sample of matches. We’ll have to see whether the pattern holds through the rest of the tournament.
But travel distance could also play a role. The FiveThirtyEight match projections include a very modest adjustment for east-to-west travel distance (north-to-south distance seems to matter much less, perhaps because it doesn’t produce as much jet lag). The adjustment is calibrated based on the results of highly competitive soccer matches since 2006. However, there’s evidence that the home-continent advantage had been higher in the past. No European team has ever won a World Cup played in the Americas.
It’s also possible that the effect has something to do with the stadium atmosphere. Teams such as Chile and Colombia have received raucous support in their matches so far; in the game I attended at Estádio do Maracana in Rio de Janeiro on Wednesday, perhaps 90 percent of the crowd was pulling for the Chileans. Because partisan crowds seem to affect officiating decisions in soccer, that could mean these teams are getting a bit more slack from the officials. Chile, for example, spent much of the second half of its win against Spain lying on the pitch with exaggerated injuries but received no sanction for time-wasting.
A final theory might be that teams from the Americas are fresher. The major European leagues just completed play in mid-May after beginning their season last August. Portugal’s Cristiano Ronaldo, for example, played in 51 matches for Real Madrid since the start of last summer, including the Champions League final a few weeks ago. The best teams from the Americas, like Brazil and Argentina, also have plenty of stars in the major European leagues. But others, such as Costa Rica and Mexico, are less reliant on such players. That could serve to mitigate the talent advantage that the European teams might have and reward the countries with disciplined and tactical team play.

June 19, 2014
We’re Telling England There’s a Chance!
England’s World Cup hopes seemed to melt away Thursday with a heartbreaking 2-1 loss to Uruguay, which followed a loss to Italy by the same scoreline last week. Since the World Cup expanded to a 32-team format in 1998, no team has advanced to the knockout stage despite taking two losses in its group.
But the Three Lions are still mathematically alive: The FiveThirtyEight forecast gives England about a 4 percent chance of backing into the knockout stage.
Here’s what would need to happen; any deviation from this scenario, and England is out.
Italy beats Costa Rica on Friday. This seems like the easy part: Isn’t Italy way better than Costa Rica? Perhaps, but the Soccer Power Index (SPI) doesn’t see it as the overwhelming favorite; it gives Italy a 40 percent chance of a win, against 30 percent for Costa Rica. (All probabilities are listed as they were Thursday morning; they’ll change slightly when we rerun SPI overnight.) Italy and Costa Rica are also fairly conservative teams, so a draw is a decent possibility. SPI doesn’t have anything against Italy in particular, incidentally; instead, it takes a more pessimistic view of European teams than other ratings systems, particularly compared to teams from South America. That’s looked reasonably smart overall. SPI was also down, relatively speaking, on Spain, Portugal and England. SPI was comparatively high on teams such as Chile and Colombia, but there have been some potential exceptions, like Italy.England beats Costa Rica next week. As of Thursday morning, SPI put the chances of this at 45 percent, against 26 percent for a Costa Rica win and 29 percent for a draw.Italy beats Uruguay next week. These look like fairly evenly-matched teams, but SPI puts Uruguay slightly ahead. It gives Italy a 33 percent chance of beating the Uruguayans, against a 38 percent chance of a Uruguay win and a 29 percent chance of a draw.England wins the tiebreaker. If the remaining matches in Group D go down as I’ve described, Italy would advance first with a 3-0 record, while England, Uruguay and Costa Rica would be tied for second, each with one win and two losses. England would need to have the best goal differential among the three teams to advance. If the goal differential is tied, England would need to have scored the most goals. I’m skipping some math here, but Costa Rica has a slight advantage in the tiebreaker so far because it beat Uruguay by two goals last week. So to win the tiebreaker, England would either have to defeat Costa Rica by two or more goals or see Costa Rica lose to Italy by two or more goals; a series of 1-0 results wouldn’t work.As I’ve said, the chance of this sequence unfolding is about 4 percent. England fans might not take much solace in this — or they might think it’s too optimistic given how unlucky their team has been in the past.
But these odds are somewhere in the vicinity of those that an NBA, NHL or Major League Baseball team has of winning a seven-game playoff series after losing the first three games. The Boston Red Sox, who came back from 3-0 to beat the New York Yankees in 2004, demonstrate that sometimes the 4 percent chance proves a winner — and the Red Sox were once thought to have cursed luck, too.

June 18, 2014
Spain Must Beat Chile If It Hopes to Advance in the World Cup
I’ve arrived here in Rio de Janeiro for a few days. I know how lucky I am — especially since the match I’ll see later on Wednesday, between Spain and Chile at the Maracana stadium, might be the most important of the group stage. (For more on Wednesday’s other matches, see our Crib Notes.)
ESPN’s Soccer Power Index doesn’t have much in the way of a prediction for this game — it sees a Chilean win and a Spanish win as about equally likely, with a draw also a decent possibility. But of course, the match matters greatly for Spain’s chances of advancing.
Let’s follow the format we used for breaking down the United States’ chances and consider the rest of the group stage from Spain’s perspective. The nine scenarios I’ll cover detail the possible results of the two games Wednesday in Group B — before Spain kicks off with Chile, the Netherlands and Australia will have completed their match in Porto Alegre (the Netherlands is heavily favored). I’ll list what the group standings will look like at the end of the day after each result — assuming that Spain remains behind on any goal differential tiebreaker because it lost by four goals to the Netherlands earlier in the group stage. (That goal differential tiebreaker makes Spain’s path much more difficult than it otherwise would be and is a big part of why our simulations give the La Furia Roja only about a 25 percent chance of advancing.) I’ll then consider how the final two matches (between Spain and Australia, and between the Netherlands and Chile) might play out.
Netherlands wins, Spain wins: Netherlands 6 points, Chile 3, Spain 3, Australia 0. Obviously, this is one result Spain would be happy with. A follow-up win against Australia would probably get Spain to the knockout stage — and there are some cases in which a draw against Australia could, too. Even two wins wouldn’t leave Spain 100 percent safe, however. If Spain beats Australia but Chile beats the Netherlands, three teams would be tied atop the group with six points, and Spain would probably have the worst goal differential.Netherlands draws, Spain wins: Netherlands 4 points, Chile 3, Spain 3, Australia 1. This is more promising for Spain as there’d then be some chance it could leapfrog the Netherlands. Spain would control its own destiny without having to worry about goal differential: Win against Australia by any margin and Spain would make it to the knockout stage. Spanish fans should be rooting for the Socceroos to grab at least one point today.Netherlands loses, Spain wins: Netherlands 3 points, Chile 3, Australia 3, Spain 3. A heck of a mess in the short run as all teams would be tied at three points. However, Spain would still control its own destiny and a win against Australia by any margin would put Spain in the knockout stage.Netherlands wins, Spain draws: Netherlands 6 points, Chile 4, Spain 1, Australia 0. Spain is very probably out. The only exception is if it beats Australia and the Netherlands beats Chile — and the margins are wide enough to swing the goal differential back in Spain’s favor.Netherlands draws, Spain draws: Netherlands 4 points, Chile 4, Australia 1, Spain 1. This scenario is extremely problematic for Spain and probably means its elimination. The best Spain could hope after these results is a tie for second, which it would probably lose on goal differential. Another problem is that even if Spain were to beat Australia, the Netherlands and Chile could guarantee their entry into the knockout stage by drawing with each other. FIFA and fans hate it, but soccer teams have a way of playing for the draw when such incentives are in place.Netherlands loses, Spain draws: Chile 4 points, Netherlands 3, Australia 3, Spain 1. Only marginally better. In this case, Spain can finish in sole possession of second place if it then beats Australia and Chile beats the Netherlands. If Spain beats Australia but the Netherlands draws or beats Chile, Spain finishes in a tie for second and is likely out based on goal differential.Netherlands wins, Spain loses: Netherlands 6 points, Chile 6, Australia 0, Spain 0. Spain is mathematically eliminated.Netherlands draws, Spain loses: Chile 6 points, Netherlands 4, Australia 1, Spain 0. Spain is mathematically eliminated.Netherlands loses, Spain loses: Chile 6 points, Netherlands 3, Australia 3, Spain 0. Spain is eliminated for all intents and purposes. It would have to beat Australia, have Chile beat the Netherlands, and then beat both the Netherlands and Australia on goal differential — not very likely.The short version: Lose to Chile on Wednesday and Spain is almost certainly out of the tournament. A draw and La Furia Roja is in grave trouble: Spain would need a win against Australia by an overwhelming margin and very probably some help on top of that. A win keeps Spain alive, but it remains vulnerable, especially if the Netherlands beats Australia (a 74 percent chance, according to our model).
CORRECTION (June 18, 11:56 a.m.): A previous version of this post incorrectly listed Australia as having three points if the Netherlands beats Australia and Spain loses to Chile. In that scenario, Australia would have zero points.

June 17, 2014
Population Shifts Had Nothing to Do With Cantor’s Defeat
I warned you to be suspicious of novel theories about the defeat of House Majority Leader Eric Cantor in his Republican primary last week. It probably had something to do with Cantor’s identification with the Republican establishment at a time when it is deeply unpopular. But to the extent that Cantor’s defeat was like an earthquake, that means we can’t pin down its causes all that precisely. We might even think of it as having been somewhat random. Why did Cantor’s district give way when so many others held? (Only 1 to 2 percent of Republicans running for re-election to the House of Representatives have been denied their nomination since 2010.)
But here’s one such theory, as described by a New York Times article published Sunday: Perhaps Cantor’s defeat — and the near-defeat of Republican Sen. Thad Cochran in Mississippi — has something to do with migration patterns. If more people are moving into areas where they are less familiar with the incumbent, perhaps the incumbency advantage has waned.
Indeed, there’s robust evidence that politics are becoming more nationalized; state and local races (like those for governor) are more likely to follow patterns from federal races and less likely to involve ticket-splitting.
But it’s less clear that this has much to do with migration patterns, or at least not in the way that The New York Times proposes. More of the evidence contradicts rather than supports its hypothesis, in fact.
The theory doesn’t align well with the results in Virginia. If migration to Virginia was a major contributor to Cantor’s defeat, you’d expect Cantor to have done worse in counties where there were more transplants.
Instead — as can be seen in the graphic below — there was essentially no relationship between the percentage of the population that was born outside Virginia (as based on American Community Survey estimates) and the share of the vote that Cantor received in a county:
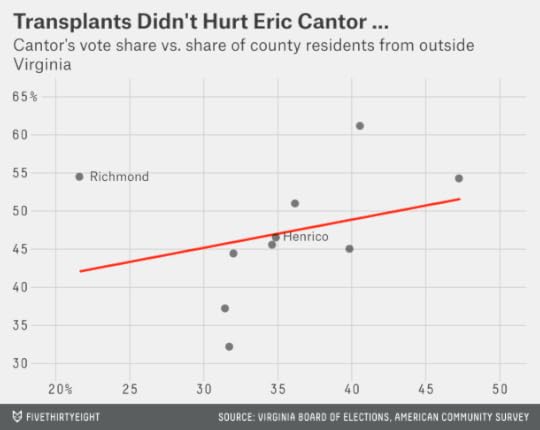
If anything, Cantor did better in counties with more transplants. This is especially so if you exclude the city of Richmond (Virginia has a number of cities that are not incorporated into any county), where Cantor was born, and where he maintains his home and his local campaign office. (I’ve also excluded Henrico County, which is where Cantor’s opponent David Brat makes his home.) If you do that, the relationship between Cantor’s vote share and the percentage of transplants is highly statistically significant and positive — running in exactly the opposite direction of what the Times’s theory would imply:

How about in Mississippi? There, the relationship at least goes in the right direction from the standpoint of the Times’s theory. Thad Cochran, the incumbent, did slightly better in counties with fewer out-of-state transplants:
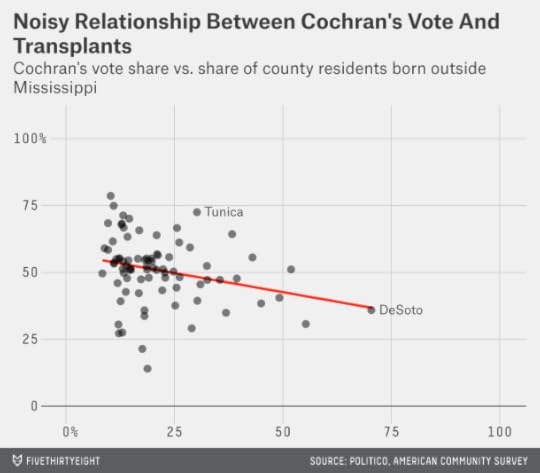
However, the relationship is quite noisy. Although there were places like DeSoto County — which has a high rate of transplants and where Cochran’s conservative challenger Chris McDaniel did well — there are counterexamples like Tunica County, which neighbors DeSoto and which also has a fairly high rate of transplants, but where Cochran got 73 percent of the vote.
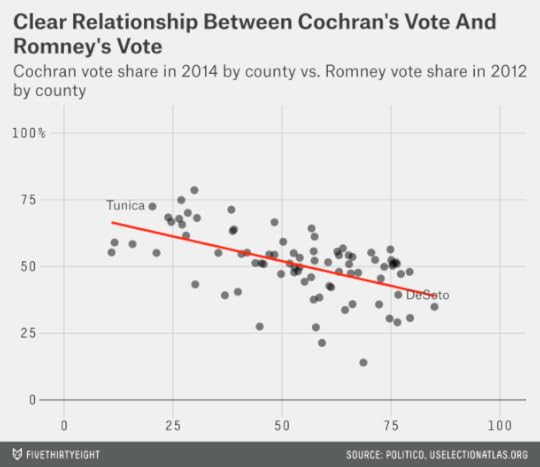
What’s the difference between Tunica and DeSoto? DeSoto is mostly white and highly conservative; it gave Mitt Romney 66 percent of its vote in 2012. Tunica is mostly black and gave President Obama 79 percent of its vote. There is, in fact, a fairly strong relationship between the Mississippi primary outcome and the presidential results. In more conservative counties — where Romney got more of the vote — Cochran did worse and McDaniel did better.
Once you account for a district’s presidential vote, in fact, the share of transplants is not close to being statistically significant in explaining Cochran’s vote. It doesn’t tell us much of anything.
![Screen Shot 2014-06-17 at 12.15.44 PM[1]](https://i.gr-assets.com/images/S/compressed.photo.goodreads.com/hostedimages/1403172240i/10052857._SX540_.png)
There are other problems with the Times’s theory. For instance, while the share of transplants is fairly high in Virginia, it is quite low in Mississippi. As of 2010, 72 percent of Mississippi residents were born in the state, well above the national average of 59 percent. If transplants were a major factor in predicting incumbent defeats, you’d have expected Cochran to be safer than most incumbents and not more vulnerable.
Yet another critical problem is that migration is decreasing significantly in the United States, both among states and within them, in part because of the recent recession. If there’s a link between migration and incumbent vulnerability, you’d have expected incumbents to become less vulnerable overall — not more so, as the Times asserts.
The article may be reflecting the views of some of its sources; the Times’ house style sometimes makes it hard to tell where reporting ends and analysis begins. Karl Rove, for example, is one Republican who espoused a link between migration patterns and incumbent defeats for the piece:
“They don’t know who the heck Thad is,” said the Republican strategist Karl Rove, of Mississippi’s newly arrived voters. “There is no 40-year history with him, knowing that this is the guy who built up the state’s modern Republican Party. The same with Eric, people who have just gotten to Richmond don’t even know what the House of Delegates is, let alone that he served there.”
This theory is a bit self-serving for Rove, who has fought to defeat primary challenges against Republican incumbents. Blaming migration patterns for them, rather than the increasing conservatism of the Republican Party, or the increasing (if sometimes oversimplified) divide between the Republican establishment and party outsiders, would imply he is less responsible for them. In this case, however, the theory doesn’t fit the evidence at all.

June 16, 2014
The U.S. Now Has a Better Shot at the World Cup, But Still Needs a Point Against Portugal
The United States may or may not have played the better football in Monday’s match against Ghana. But it
June 15, 2014
Most Women Like Hillary Clinton ‘Evolved’ On Gay Marriage Years Ago
If you were at a dinner party and the woman seated across from you was a wealthy, white, well-educated, liberal-to-moderate Democrat, it would be fairly safe for you to assume she supported gay marriage.
But if that woman were Hillary Clinton, you’d have been wrong — at least until March 2013, when Clinton publicly announced her support for gay marriage. At least, Clinton would like us to believe she hadn’t supported gay marriage before. In an interview with Clinton on Thursday, NPR’s Terry Gross repeatedly asked the former secretary of state when and how her views on gay marriage had “evolved.” Did Clinton privately support gay marriage for years but wait to express that view until she perceived the politics favored it? Or did her personal view change only recently? Clinton told Gross that, like many Americans, she had rethought the issue, and resisted the implication that her personal beliefs on gay marriage had differed from her publicly stated views.
Rather than trying to read Clinton’s mind, we can look at the views of the Americans who are most like her. No woman, of course, is exactly like Hillary Clinton — no other woman has been a secretary of state, a U.S. senator and a first lady. But those private citizens who share the most in common with Clinton were well ahead of the curve on gay marriage. I estimate that somewhere between 75 percent and 90 percent of them supported gay marriage as of 2008.
The way I came up with these figures was to look at individual-level voter data from the 2008 exit polls, specifically from the three states — California, Arizona and Florida — that voted on gay marriage ballot initiatives that year. This data allows us to understand, with quite a bit of detail and precision, what demographic and political characteristics predict a voter’s likelihood of supporting gay marriage. (In the past I’ve used this technique to estimate support for gay marriage in every state.) In the output below, from a logistic regression analysis on this data, positive coefficients are associated with an increased likelihood of supporting gay marriage, and negative coefficients with a reduced one.
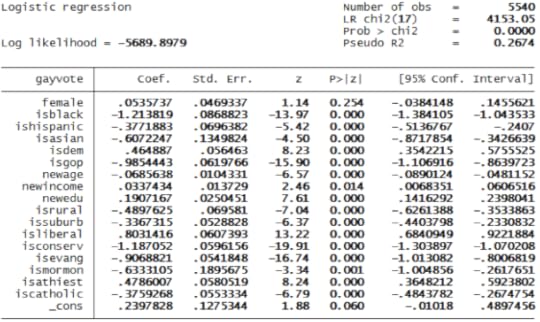
The results should be pretty intuitive. The probability of supporting gay marriage rises if a voter:
is Democraticis liberalis whiteis youngis female (although the effect of gender is very minor once other categories are accounted for)is more highly-educatedcomes from a higher-income householdlives in an urban areais atheist or reports having no religious affiliationif religious, is a non-evangelical Protestant, rather than an evangelical, Mormon or Catholic.Almost all Clinton’s characteristics would predict a higher likelihood of supporting gay marriage: She is Democratic, female, a non-evangelical Protestant and in the exit polls’ top categories for household income and education. The only factor that would negatively predict support for gay marriage is her age: Clinton turned 60 in late 2007.
Two other characteristics are a bit ambiguous. First, is Clinton liberal or moderate? “Liberal” might seem like the obvious answer. Clinton was slightly to the left of the average Democratic member of Congress based on her voting record in the Senate. The average Democratic member of Congress is pretty liberal to begin with. (Members of Congress are more consistent in taking liberal or conservative positions than members of the public, who have more heterodox views.)
But a voter’s ideology in the exit polls is based on how she chooses to define herself — and Clinton has sometimes avoided describing herself as a liberal (instead, she called herself a “modern progressive” during a 2007 debate). Would she say “liberal” or “moderate” if asked privately in an exit poll where “progressive” is not an option?
Whether Clinton’s residence is urban or suburban is also up for question. Before Bill Clinton’s presidential run, the Clintons lived in the Governor’s Mansion in Little Rock, Arkansas, which would be considered urban. While he was president, the White House in Washington, D.C., was their sole residence until 1999, when they purchased a home in Chappaqua, New York, in suburban Westchester County, and began filing their taxes from there. The Clintons have also maintained a home in Washington, however.
So we’ll run the numbers two ways: First, for women who are liberal and urban, and second, for women who are moderate and suburban — with both groups matching Clinton’s demographic profile in all other respects.
The regression model estimates that about 90 percent of liberal, urban women like Clinton supported gay marriage as of 2008. Meanwhile, about 75 percent of moderate, suburban women like Clinton did so then.
We can also make some estimates of how these numbers have changed over time. (Gory details: I accomplish this by varying the constant term in the regression, calibrating the model such that overall support for gay marriage matches the trend line from national opinion polls from the year in question. This implicitly assumes that the rising tide toward gay marriage has lifted support levels among all demographic groups over time — a reasonable but not perfect assumption.)
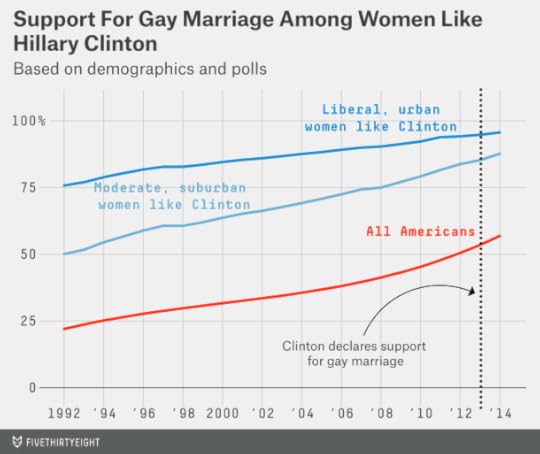
The majority of women with this profile supported gay marriage long ago. I estimate, for instance, that about 75 percent of liberal, urban, Democratic women who otherwise match Clinton’s demographic characteristics did so even in 1992. And support among moderate, suburban Democratic women like Clinton rose above 50 percent shortly after her husband took office in 1993. Those figures might seem high. But there were some people who supported gay marriage in the early 1990s — about 25 percent of the U.S. population, based on the trend from national opinion polls. These were just the sort of people likely to be among that 25 percent.
But perhaps Clinton should be compared to other politicians and not to private citizens. President Obama was also slow to announce his support for gay marriage. So were most Democrats in the U.S. Senate.
As the Atlantic’s Conor Friedersdorf points out, politicians who changed their position on gay marriage risk being criticized however they explain the shift. Either they look like they weren’t willing to stand behind their convictions or they admit to holding a position, until very recently, that many Democratic voters now regard as wrongheaded and even bigoted. A third option, also fraught with complications, might be to embrace a distinction between private views and public positions for elected officials in a representative democracy.
Nonetheless, it’s fair to be suspicious of politicians like Clinton who imply that they were just regular Americans going along with the tide. The median American came to support gay marriage only recently — but the Americans most like Clinton did so a long while ago.

Nate Silver's Blog

- Nate Silver's profile
- 729 followers

