
Nate Silver's Blog, page 168
July 15, 2014
Carmelo Anthony’s Contract Could Doom the Knicks to Mediocrity
The New York Knicks have won 55 percent of their games since Carmelo Anthony joined the team in 2011 — a rate that equates to a 45-37 record over a regular season and a first-round exit from the playoffs.
Get ready for more of the same. It’s not that Anthony is a bad player. He’s a very good player — perhaps even an underappreciated player, as my Grantland colleague Bill Simmons notes. He’s improved some problematic aspects of his game, like 3-point shooting, since arriving in New York.
But Anthony’s new contract — reported to be in the range of $125 million over five seasons — will pay him every penny he’s worth. NBA teams win championships by getting players at discounts instead — and Anthony probably won’t qualify. Let’s take a deeper look at the case.
Evaluating an NBA player’s contract requires three things: some measure of his basketball value, a way to translate back and forth between basketball value and the economics of his contract, and a system for projecting how his value will change as he ages.
For our overall measure of basketball value, I’ll be using statistical plus-minus (SPM), a system designed by my FiveThirtyEight colleague Neil Paine. This is the same metric I used to (hypothetically) place LeBron James on different clubs and see how many wins his new team was projected to produce. SPM is usually denominated in points — how much having a player in your lineup changes a team’s scoring margin per 100 possessions — but I’ve translated it to a wins above replacement (WAR) basis instead.
SPM and other plus-minus metrics take a middle ground in valuing shot creation. That’s important for Anthony, an extremely high-volume shooter whose efficiency is only slightly better than average. Other metrics either give a player no credit for taking shots or considerably too much credit for taking mediocre ones.
I don’t want to spend too much time in the weeds of the shot-creation debate — but it’s too important to gloss over in Anthony’s case. My read of the evidence is that we ought to give a fair amount of credit to this skill. Anthony can draw double-teams and create better opportunities for his teammates, who become more efficient shooters with him on the floor — an effect we’ve also observed for James. He can also take tough shots when his team doesn’t have many alternatives — last season, 42 percent of Anthony’s field goal attempts came with eight or fewer seconds on the shot clock compared to a league average of 31 percent.1 In those situations, shooting efficiency drops drastically — but Anthony’s numbers held up well, and he was bailing out his team from a desperation attempt or a shot-clock violation.2
Translating between wins and player salaries is another challenge. I’ve done it a lot in the past — but I’m now convinced I was doing it wrong. A lot of NBA advanced metrics use a zero-win baseline, which implies that if you filled a team with replacement-level players — guys who could be had at the league-minimum salary — it would go 0-82. But it wouldn’t; if you’d fielded a roster last year with actual league-minimum players, that team would have gone about 16-66 instead.
This makes a bigger difference than you might think. Last year, the average NBA team had a payroll of about $67 million and went 41-41. Divide $67 million by 41 wins, and you get a valuation of about $1.6 million per win.
But we should be dividing $55 million by 25 wins instead, which comes out to $2.2 million per win. Where do these numbers come from? The $55 million represents the money a team spends above and beyond the minimum contracts for a 12-man roster,3 and 25 is the number of wins it takes to go from replacement-level (16 wins) to league average (41).
I nudged this $2.2 million number upward further for two reasons. First, the $2.2 million estimate includes players still on rookie-scale contracts, who generally make considerably less than their market rate. Excluding them gets us to a valuation of about $2.6 million per win for free agents. Second, the figure is out of date — the salary cap is increasing by 7.5 percent next season. Assuming player salaries will rise at the same rate, that produces a price of $2.8 million per win in this summer’s free-agent market.4
The last task is to project Anthony’s performance over his next five seasons. There are a lot of quick ways to do this if you’re indifferent to whether the aging curve for a league-average player resembles the one for a star player. But here we’re interested in a star.
So I built something resembling a lo-fi version of PECOTA, the baseball projection system I designed many years ago, which uses comparable players to project an athlete’s career path. Other people have attempted and refined this approach in the NBA, and my version is a work in progress. But it compares players on the basis of a number of attributes: height, weight, position, minutes played and minutes per game, true shooting percentage, statistical plus-minus — and points, rebounds, assists, steals, blocks and turnovers per 36 minutes played. (Not all components are weighted equally.)5. Comparables must be of the same age, so Anthony, who was 29 for most of last season, is compared against historical players in their age 29 seasons.
There isn’t as much choice as in baseball. There are five starters per NBA team rather than nine in Major League Baseball, and I’m using NBA data only from the late 1970s forward rather than the 1940s, as PECOTA did. Furthermore, Anthony is something of an oddball player, being a hybrid between a “big” and a “wing.” But these were the top 10 names the system came up with:
Dirk NowitzkiAlex EnglishVince CarterPaul PierceTom ChambersDominique WilkinsSean KempJulius ErvingKobe BryantBob LanierSome of these work better than others, but I was fascinated to see Nowitzki in the No. 1 slot after reading the Simmons article that compared Dirk and Melo. Nowitzki was the better player, but the statistical differences were subtle. Anthony, at age 29, had 25.5 points per 36 minutes along with 7.5 rebounds and 2.9 assists; he shot 45 percent from the floor, 40 percent from 3-point range, and 85 percent on free-throws. Nowitzki, at the same age, has 24.5 points per 36 minutes, 8.6 rebounds, 3.5 assists and shooting numbers of 48/36/88. The difference amounts to about one rebound a game, one assist every other game, two field goal attempts a game, and one shot every two or three games that Nowitzki makes but Anthony misses.
Otherwise, Anthony’s list produces a lot of throwback players — English, Wilkins. In some ways, he fits that hero-ball aesthetic: lots of midrange jumpers (another thing he has in common with Nowitzki). Very high shooting volumes. Good-but-not-great efficiency. Inconsistent defense.
The point is not to argue over whether Nowitzki or Wilkins is the better comp for Anthony — further refinements to the method might change the ordering and remove some of the more dubious names from Anthony’s list (like Patrick Ewing, Melo’s No. 16 comp). But we can get a basic sense for how high-volume scorers (who otherwise aren’t grossly dissimilar to Anthony) held up as they entered their 30s. That’s what’s reflected in the chart below, which lists each player’s WAR from age 27 through 34.6

The average Carmelo comparable averaged about 11 wins per season from age 27 through 29. But he declined to nine wins in his age 30 season and then lost about one more win in every subsequent year.
It isn’t a total disaster: Some comparables, such as Kemp and Adrian Dantley, had abrupt ends to their careers, but others like Nowitzki and Paul Pierce held most of their value through their mid-30s. All of these guys were starting from a high baseline, so they could lose some value and still be worthwhile players. But the overall trend is uniform: All but two of Anthony’s comparables were more valuable at age 29 than at age 32.
We can value Anthony’s contract by applying our wins-to-dollars translation.7 I’ve adjusted his projection slightly upward because he was slightly better than his average comparable in his age 29 season.8 It results in an estimate that Anthony is worth about $122 million over the next five years — almost exactly what the Knicks will be paying him.9
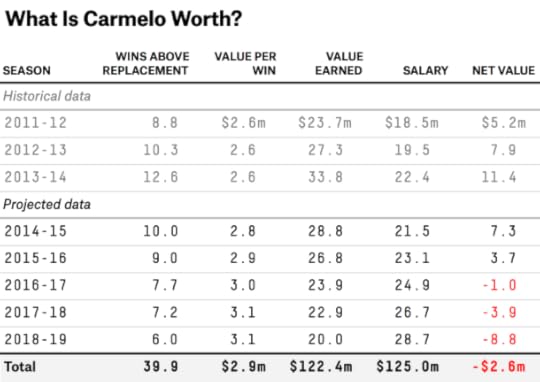
So, what’s the problem? Actually, there are two. One is that Anthony’s value is front-loaded — he projects to be worth about $7 million more than his salary next season. But by age 34 — in the 2018-19 season — he’ll be worth $9 million less than his salary. That’s inconvenient for the Knicks, who will have much more opportunity to improve their roster in the summers of 2015 and 2016 than they do this year.
The more fundamental issue is that teams don’t win NBA championships by paying players fairly: They need to sign them for less than they’re worth. To a first approximation,10 a team of players paid at their market rate will finish at the league average record of 41-41.
Could a roster built around Anthony win the championship? Simmons makes the case that it could — in part because of the comparison to Nowitzki, who won one in Dallas.
If taken literally, the question is absurd. A team on which Anthony was the best player and every other player on the 12-man roster was just a bit worse than Anthony (a borderline All-Star who complemented Anthony’s skills) would be a prohibitive championship favorite and would probably post a win total somewhere in the 70s. Further, we could argue for hours about whether Anthony would qualify as the best player on some teams that did win the championship, such as the Bad Boys Pistons or the Pistons’ 2003-04 team — or perhaps even last year’s World Champion San Antonio Spurs.
It’s also possible to construct plausible championship-caliber lineups for next season on which Anthony would be the best player. For example, consider a team with a starting five of Anthony, Damian Lillard, Danny Green, Paul Millsap and Marc Gasol. For the reserves, we’ll use some actual Knicks: Pablo Prigioni, J.R. Smith, Iman Shumpert, Kenyon Martin and Cole Aldrich. That team would project to 63 or 64 wins, according to my system. You could just barely fit it under the salary cap if Anthony agreed to play for $15 million next year instead of somewhere in the $21 million range.
That team relies on a number of underpriced assets: Anthony at well under the max; Green for next to nothing; Lillard on his rookie-scale deal. Even with one overpriced player in Smith on the roster, those contracts more than pull their weight.
But in practice, it may be easier to build a team around a singular superstar like LeBron. Historically, teams with an MVP-caliber player like James are about three times more likely to win championships than those with mere All-Star starters like Anthony.
The reason may be the league’s maximum salary: James is worth something like $45 million per season by this method but will make only about $20 million. Surround James with 11 league-average players, paid at their market rate, and his team would be projected to win about 56 games. Add in one other favorable contract to the mix, and it would be somewhere in the 60-plus win range and a championship front-runner. It isn’t easy to find a LeBron, obviously. But the league’s very best players are so underpaid that getting one of them can be as valuable as signing three or four Lillards or Milsaps or Greens to pretty good deals.
That didn’t make this an easy call for the Knicks, who had neither course available. Nor would dropping Anthony have provided for a clear path forward.11 In poker, good players put their opponents in positions where all of their options are equally bad — and bad poker players put themselves in those positions. The Knicks are suffering for past sins: the assets they gave up for Anthony in 2011 when they could have signed him as a free agent; the horrible deal given out to Amar’e Stoudemire; the inexplicable trade for Andrea Bargnani. Jimmy Dolan played a bad hand, and he’s paying the price.


July 13, 2014
Germany May Be the Best National Soccer Team Ever
Germany didn’t begin the World Cup as the favorite. That honor belonged to (ahem) Brazil. But that’s a slightly deceptive measure. This was a top-heavy World Cup; not only Brazil but also Germany, Argentina and Spain would have been the front-runners in many past editions of the tournament.
By the end of the World Cup, Germany left little doubt it is the best team in the world. In fact, it may be the best national soccer team ever assembled.
One simple way to compare World Cup winners is by their goal differential throughout the tournament. Germany, with 18 goals scored and four allowed, comes out at a plus-14. This is tied for the best goal differential ever for a World Cup champion; Brazil also scored 18 goals and allowed four in winning the 2002 tournament.
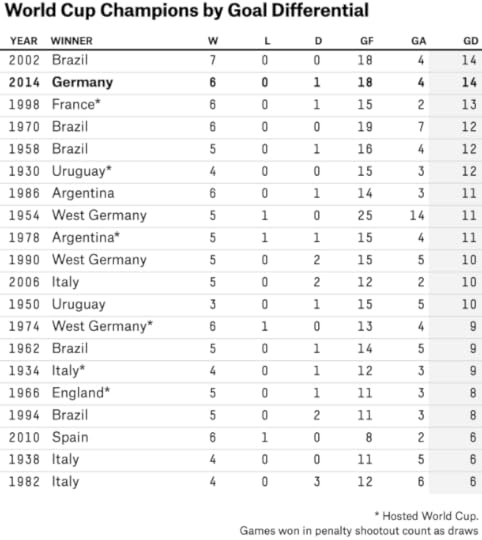
No, the Germans weren’t flawless. They tied Ghana in the group stage and had a little more trouble than they should have with Algeria in the Round of 16. But few World Cup champions are perfect in every match. All but three eventual winners took a draw or loss, or required a penalty shootout, along the way (soccer statisticians usually count games that go to penalties as draws).
And some of these teams were fortunate in other respects. Uruguay only needed to play four matches to win the inaugural World Cup in 1930. Uruguay also had the benefit of playing on home soil. Brazil, in 2002, had a favorable draw – China, Costa Rica and Turkey were in its group.
The Germans, by contrast, did this against some tough competition. They took down Argentina and Brazil in the knockout stage, along with a French team that had been playing as well as anyone.
The World Football Elo Ratings provide one way to account for all these factors: a team’s strength going into the tournament, its dominance during the tournament itself, the quality of its competition, and whether it was aided by playing at home.
Germany’s Elo rating was high to begin with at 2046, which is stronger than a number of World Cup winners. But it gained 150 more points throughout the World Cup (about half of them by beating Brazil 7-1), finishing with a rating of 2196.
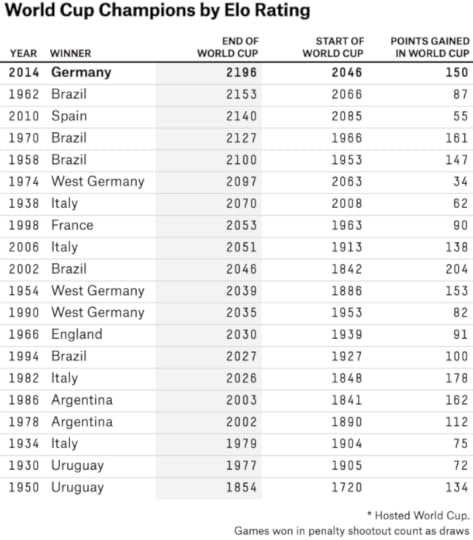
This is the highest Elo rating ever for a World Cup champion. The 1962 Brazil team previously held the top spot.
In fact, it’s the highest a national soccer team has ever been rated in the Elo system. Before Germany, the highest-rated team of all time had been Hungary in 1954. Hungary’s rating peaked at 2166 after winning the World Cup semifinal, but then it lost to West Germany in the tournament’s final match.
I’ll be curious to see how this year’s German team is regarded in barroom arguments around the world, both now and with the benefit of hindsight. It doesn’t have a transcendent superstar, although it has a number of players who might rank in the top 20 or 25 in the world. It’s often said that the Germans didn’t have a distinctive style — although their relentless attacking play represents the new paradigm in world football, and it led to the highest-scoring and perhaps most exciting World Cup in many years.
Other teams — notably Spain from 2008 to 2012, and Brazil under Pele — had longer sustained stretches at the apex of world football. But Germany is young and deep. Mario Götze, who scored the winning goal in the final Sunday, is 22. Thomas Müller and Toni Kroos are 24, and Mesut Özil is 25. The Germans have a good chance to go in as the favorites in the 2018 World Cup in Russia.
Still, the competition is going to be tough. At the start of the next tournament, Brazil’s Neymar and Colombia’s James Rodríguez will be just 26, and Lionel Messi — despite playing in his fourth World Cup — only 30. France is perhaps a player away from competing with the world’s best teams, and after having won FIFA’s Under-20 World Cup last year, it could make that transition soon. This is a great era for the international game, and that makes what Germany accomplished all the more impressive.

The Most Likely Scores in the World Cup Final
After one of the most astonishing score lines in the history of the World Cup on Tuesday — Germany 7, Brazil 1 — nothing that happens in Sunday’s World Cup final would be a total surprise. But we do have estimates of the most likely final scores for the game.
Germany is a 63 percent favorite to defeat Argentina, according to the FiveThirtyEight forecast. Argentina had a slightly higher Soccer Power Index (SPI) rating when the tournament began, but Germany has seen its rating rise, particularly after its thrashing of Brazil, and it now ranks No. 1 by some margin. Betting lines also have Germany favored.
The SPI match predictor allows us to predict the number of goals scored and allowed for each club. It calls for 1.7 goals by Germany and 1.2 by Argentina.
There are a couple of problems with this — for one thing, a team cannot score seven-tenths of a goal. So the match predictor uses a version of a Poisson distribution, which calculates the probability of the teams finishing with any whole-number score. For example, if Germany scores an average of 1.7 goals, how often does it score exactly two goals or exactly three goals? That’s what a Poisson distribution does.
Another issue is that the match predictor is calibrated on the basis of 90-minute matches when knockout-round games can go to extra time. To account for extra-time results, we ran an additional Poisson regression based on the results of extra-time games in major international tournaments since 2005. (In geek speak, we’re nesting a Poisson distribution within another Poisson distribution.) All of that produces the following heat map:

Read left to right for Germany’s score and top to bottom for Argentina’s. Boxes in which the score is still tied after extra time represent cases where the game goes to penalty kicks (there is about a 14 percent chance of this happening). The 10 most probable scores are as follows:
Germany 2, Argentina 1Germany 1, Argentina 0Argentina 2, Germany 1Germany 2, Argentina 0Argentina 1, Germany 0Germany 3, Argentina 11-1 draw (game goes to penalties)Germany 3, Argentina 2Germany 3, Argentina 0Argentina 2, Germany 0What are the odds of another 7-1 scoreline? The model says there is only about a 0.06 percent probability of such a score favoring Germany (about one chance in 1,600). There’s even less of a chance — more than 10,000-to-1 against — of the same score favoring Argentina.
But these figures may underestimate the chance of astonishingly lopsided results. The mathematical basis for the Poisson distribution is the assumption of independent trials. This is a little inexact (it describes a special case of a Poisson distribution called a binomial distribution), but a Poisson distribution is treating a soccer game something like this:
Suppose we expect Germany to score 1.7 goals on average in a 90-minute game against Argentina. That translates into about a 2 percent probability (1 chance in 50) of scoring a goal in a given minute of play.So we can run an experiment where we randomly draw ping-pong balls from a set of 90 lottery machines, one representing each minute of the game. In each machine, there are 50 balls, one labeled GOAL! and 49 blanks. The probability of drawing a GOAL! from one machine doesn’t affect what happens with the next one. (This is the assumption of independent trials.) After we’ve drawn balls from all 90 machines, we count the number of GOAL! balls. This represents how often Germany scored in the game.We can repeat the experiment a bunch of times. Most commonly, we’ll wind up with something like one or two GOAL! balls. But other times we’ll have drawn zero or four or six. The relative frequency of these outcomes represents the Poisson distribution for Germany’s score.As strange as this experiment might seem, it isn’t a bad mathematical approximation of a soccer game. And for the most part, Poisson distributions do a good job of modeling real-world soccer scores.
But there are some complications. For instance, we may have some estimate of how the absences of Neymar and Thiago Silva might affect Germany’s chances of scoring against Brazil. But there is some uncertainty around that: Maybe Brazil plays more fluidly when it isn’t waiting around for Neymar to do something, or maybe it breaks down. This is equivalent to not knowing exactly how many GOAL! balls and blanks there are in the ping-pong machines. This uncertainty will tend to slightly increase the number of extreme outcomes (Germany scoring zero goals or a lot of goals) that we observe in the real world.
Another issue is that the texture of play in soccer depends to some extent on the scoreline. Play is usually tighter and more conservative in a drawn game and then opens up once the tie is broken. As a result, standard Poisson distributions slightly underestimate the chance of draws and of some wild scores, such as 5-2. (The variant of the Poisson distribution that we use is meant to address this problem.)
For the most part in sports, these complications are not worth worrying about. There are cases where a Poisson distribution or a normal distribution isn’t perfect — normal distributions seem to slightly underestimate the number of extreme outlier scores in sports — but they usually hold up reasonably well. Nobody gets hurt when you say that Germany has only a 1-in-4,000 chance of winning by six goals when it actually had a 1-in-400 chance.
But real-world distributions are often slightly fat-tailed, meaning that extreme outliers happen more often than the normal distribution predicts. And — outside the sports world — using the wrong model can cause real problems, underestimating the chance of an earthquake or a financial crisis.

July 10, 2014
What Cleveland Would Look Like With LeBron James And Kevin Love
Update (July 11, 12:30 p.m.): It’s official: LeBron James is going back to the Cleveland Cavaliers.
Perhaps we should collect data on what percentage of NBA rumors on Twitter turn out to be true. But as of late Thursday afternoon, the Internet was abuzz with speculation that LeBron James will return to Cleveland.
If it happens, the Cavaliers may need some additional help to build an instant championship contender for LeBron. In an article earlier Thursday, I projected the Cavaliers’ record should they sign James and Ray Allen but otherwise stand pat. It wasn’t so great: 52-30. That would be enough to make them one of the better Eastern Conference teams but probably not good enough to win a championship.
But one of the reasons for James to choose Cleveland over Miami is that the Cavs have a lot more flexibility in how they might build a team around him. The Cavaliers also have some young assets — including No. 1 overall draft pick Andrew Wiggins — who could be traded for another star.
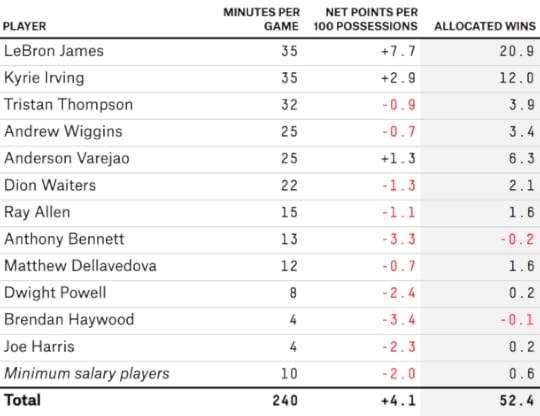
So let’s imagine that not only the LeBron rumors but also those involving Minnesota’s Kevin Love are true. Cleveland, after signing James, uses Wiggins as the centerpiece of a package that goes to Minnesota for Love. It also gives up Anderson Varejao and Anthony Bennett, and gets Ronny Turiaf in the deal — the salaries look like they’d work out.
Also, in addition to Allen, the Cavs bring in friend-of-Lebron Mike Miller. That would allow them to construct a 12-man roster that looks something like this:
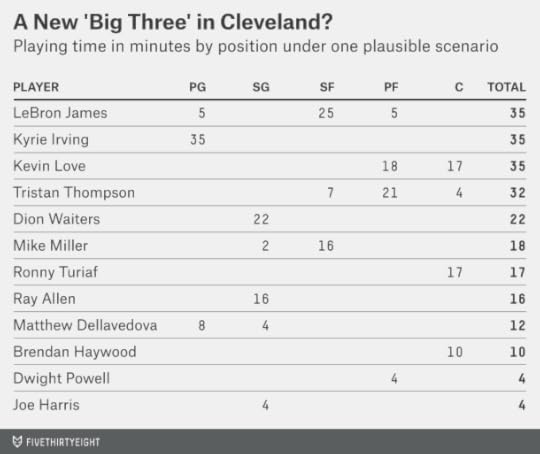
It’s a slightly weird roster, with players splitting time between several positions. But because James could be an All-Star at any of the five positions, that’s as much a feature for Cleveland as a bug — the Cavs could go big, small or anything in between. This roster could use a defensive specialist or two off the bench, and a true backup point guard, but those are fairly petty complaints.
How would this team perform? Using the same process from Thursday’s article, which projects a team’s win total based on a system called Statistical Plus Minus, it’d be on track for a record of 63-19.
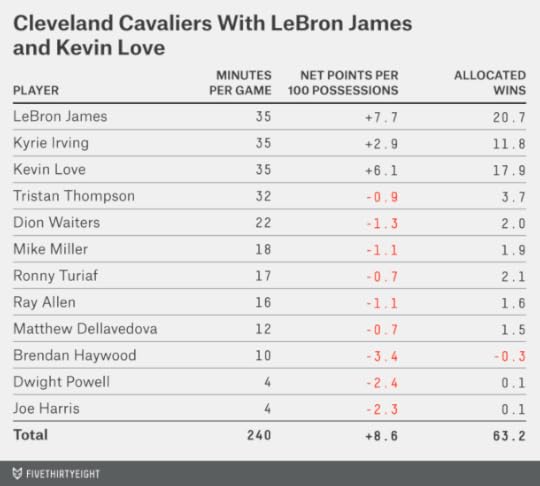
This would be a much better opportunity for James than anything likely in Miami, which finished with a 54-28 record last year and which would probably have about the same record if the Heat brought back James, Dwyane Wade and Chris Bosh. A 54-win team has less than a 5 percent chance of winning an NBA title; a 63-win team has about a 40 percent chance.
The Cavs could be better than this still — perhaps in the range of 65 to 67 wins — if they managed to acquire Love without giving up Varejao.

LeBron James Shouldn’t Stay in Miami Or Go to Cleveland
The conventional wisdom is that LeBron James will remain in Miami or return home to Cleveland. Neither would maximize his chances of winning a championship — but Cleveland, at least, is on an upward trajectory.
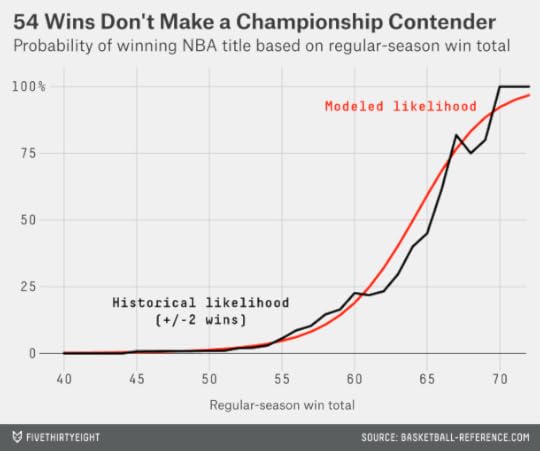
In Miami, James runs the risk of staying too long with a team in decline. The Heat won 54 games last year in a historically soft Eastern Conference and were dismantled by San Antonio in the NBA Finals. As if the Spurs left any doubt, a team with 54-win talent is rarely good enough to win a championship. Since the introduction of the three-point shot in 1979-80,1 just one of 22 teams to finish with 54 regular-season wins has won the championship that season.
I’m not cherry-picking data to make the Heat’s case look bad. We can expand the sample to include all teams that won between 52 and 56 regular-season games. There have been 102 such teams — and only three of them won the NBA title.
Instead, a team’s title chances increase rapidly once it gets its win total into the high 50s – or better yet, somewhere in the 60s. A team with 55 regular-season wins will win the title about 5 percent of the time; with 60 wins, it will about 20 percent of the time, and with 65 wins, about 60 percent of the time.2
If James really wants to get to that 60-win threshold, he’d be better off exploring teams aside from his reported favorites, such as the Chicago Bulls, Houston Rockets, Dallas Mavericks, Phoenix Suns, Atlanta Hawks, New York Knicks, Los Angeles Lakers and Los Angeles Clippers. When I placed James on the roster and ran projections for those teams, all but one finished ahead of both Miami and Cleveland.
To make the projections, I used a metric called Statistical Plus/Minus (SPM), which was originally developed by my colleague Neil Paine. (SPM is not quite the same thing as NBA Real Plus Minus, though the systems are related.) SPM measures a player’s value in points per game (more precisely, points per 100 possessions3) relative to the league average. For instance, a player with an SPM of +4 (like the Bulls’ Joakim Noah) produces a net of four extra points for his team per 100 possessions. James is in the range of +8. Negative SPMs indicate below-average players.
SPM has a good track record when it comes to predicting how teams will be affected by roster changes. But I’m hoping not to get sidetracked into a debate about which is the best “all-in-one” NBA metric.4 In this case my choice is pragmatic: Whereas some metrics like win shares value the very best NBA players as worth 15 to 20 wins per season, others like PER estimate that they’re worth 25 to 30 wins per season. SPM, which can also be translated into win totals, comes down somewhere in the middle, and puts James in the low 20s.
We also need some way to project a player’s SPM for next season, so I’m using a variant on another Neil Paine invention, the Simple Projection System. Like Neil’s system, my version uses data from the past three NBA seasons. The only variables it looks at are SPM and minutes played. But it includes a slightly more sophisticated handling of mean-reversion5 and player aging.6 There’s also a separate routine to handle rookies, whom I’ve projected on the basis of their draft position and age.7 You might call my variant the Pretty Simple Projection System (PSPS).
Let’s put some of that methodology to use. I’ve projected seasons for the 10 teams that, at one point or another, were rumored to have a chance at landing James. We’ll start with the worst and move toward the best. Ranking at the bottom are the Los Angeles Lakers.
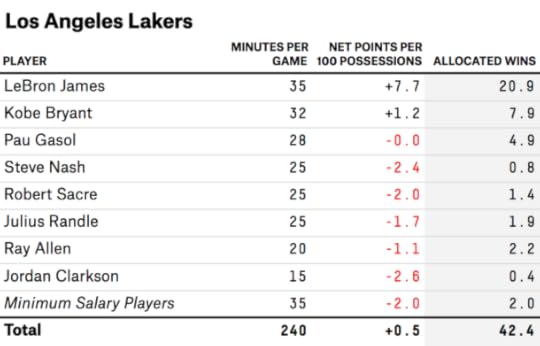
The system projects that the Lakers would win only 42 games even with James on the roster. The problem is that between age and injuries, Kobe Bryant and Pau Gasol may be no better than average NBA players — and any scenario that would allow the Lakers to sign James would require them to absolutely gut their depth.
Importantly, I’m making a few assumptions in constructing the Lakers’ hypothetical roster — and in constructing the rosters for all the teams James may join:
James is the only top-tier free agent the team signs this summer, other than its own free agents. So the Lakers can re-sign Pau Gasol, for instance, if the salary numbers are at all realistic. But they can’t also sign Carmelo Anthony or someone to pair with James.Rosters must be at least vaguely plausible under the salary cap and other contractual rules. Some cases will be bigger stretches than others. (For the Lakers, both James and Gasol would probably have to accept less than they might make elsewhere.) But they’re reasonable best-case scenarios or slightly better than that. In some cases, I’ll specify players who I assume will have to be traded to clear cap room for James.James and his teammates stay in reasonably good health, but there are no medical miracles. For instance: Kobe Bryant may be relatively healthy, but he doesn’t go back to playing 40 minutes a game, 82 times a year.8 (He played in just six games last season.)Every team that gets James also gets Ray Allen for “free.” That is to say, it signs Allen for the minimum salary or in some other way that doesn’t require it to sacrifice its options. There are reports that Allen will follow James wherever he goes. Like a lot of reports in the NBA’s silly season, they may turn out to be false. But even if Allen doesn’t follow James, another veteran like Mike Miller might. Allen represents a team’s “LeBron Dividend” — the one or two championship-seeking veterans who might join James for slightly below their market rate in order to have a shot at a ring.After Allen, I assume that a team signs generic replacement-level players if it doesn’t have enough minutes to fill out its roster. This is pertinent in the case of the Lakers. Even after some heroic assumptions — Steve Nash stays healthy enough to play half the Lakers’ minutes at point guard, they give playing time to second-round pick Jordan Clarkson — the Lakers will almost certainly need to sign a number of scrappy veterans at the minimum salary. Players signed to league-minimum contracts in 2013-14 averaged about -2 points per 100 possessions. Opponents of a roster full of such players would outscore it by 10 points per game, leaving the league-minimum team with a record of 16-66.9Once we allocate a team’s minutes, we can estimate its projected scoring margin by summing each player’s SPM projection. The Lakers, for instance — even with James — would be projected to outscore their opponents by only 0.5 points per game. That translates to a 42-40 record, using a Pythagorean projection.
Once we project a team’s win total, we can allocate its wins back to individual players: For instance, James is worth about 21 wins to the Lakers. There are a couple of highly technical points about this process, which I’ve reserved for the footnotes,10 but note that a player’s win allocation can vary slightly from team to team. (The issue is diminishing returns — a team’s win total eventually maxes out at 82 wins in the regular season. Otherwise, you’d run into problems like the 2012 U.S. Olympic roster projecting to 110 wins and negative 28 losses.)
Here are some benchmarks to keep in mind: A team that played James 35 minutes a game and filled out the rest of the roster with replacement-level players would have a projected record of 33-49. And a team that had James plus 11 league-average players would have a record of 56-26.
That’s why James wouldn’t give up much if he left Miami, which won 54 games last season. The rest of the Heat’s players have regressed to the point where they’re league-average without James, or perhaps slightly below average — and they probably aren’t going to get any better.

Instead, the Heat project to a record of 52-30 if they re-sign James, Dwyane Wade and Chris Bosh. The projection ought to be intuitive. Miami’s record last season wasn’t all that good, and that probably wasn’t an accident: The Heat’s players were aging, and the team was a man or two short of a full rotation. Adding Josh McRoberts and Danny Granger might help a little, but will probably only offset further age-related reversion from the rest of the roster. (PSPS has a rather nice-looking projection for McRoberts, which makes up for its very pessimistic one for Bosh.)
The other challenge is that the Heat have so many free agents that it’s hard to know who will remain with the club. I’m assuming that Allen, Chris Andersen, Greg Oden, Udonis Haslem and Michael Beasley will return if the Big Three do, while the other players will not. (Shane Battier is retiring, for instance.)
The controversial case is point guard Mario Chalmers, whom I’ve left off the roster. Chalmers played poorly in the playoffs and the Heat would have very limited money to offer him after stretching as much as it can to re-sign the Big Three. But SPM hates the alternative point guard, Norris Cole, and it’s inherently pessimistic about what any rookie (Shabazz Napier included) will do in his first season. If you replaced Cole’s minutes with Chalmers’s, the Heat’s projection would improve to 56 wins. Still, Miami would be somewhere in the vicinity of where it was last season.
What the Heat really needed was to add another star talent, especially to address its deficiency at the point. For instance, if Miami had snagged Kyle Lowry — and somehow also re-signed the Big Three — it would project to 60-plus wins.
The wild-card scenario would involve the Heat retaining James but parting ways with Bosh or Wade. There are some theoretically intriguing possibilities that build a team around James, Carmelo Anthony, a league-average point guard and some complementary role players.
But ultimately James would maximize his championship potential by surrounding himself with players who are underpaid relative to the basketball value they produce. Might he find them in Cleveland?
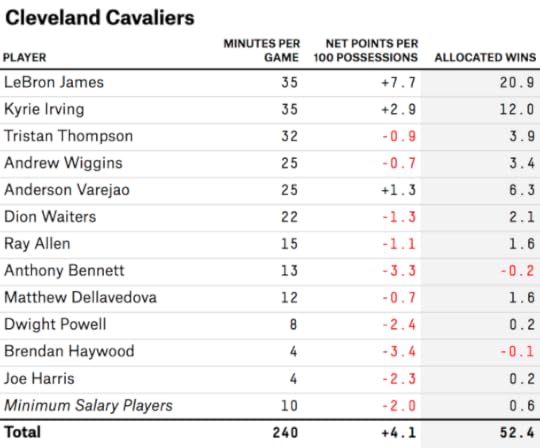
Perhaps, but the Cavs’ projection is the same as the Heat’s: 52-30. The Cavaliers won only 33 games last season, so a 19-win improvement is sizable. A little bit of that comes from projected improvement from young players like Kyrie Irving — although the Cavs also have a few subtractions, like Jarrett Jack and Luol Deng.
At least in Cleveland it’s possible to conjure any number of upside scenarios. Reports have linked Minnesota’s Kevin Love to the Cavs, for instance. With a number of caveats,11 trading Andrew Wiggins and Anderson Varejao (and some draft picks) for Love would make the Cavs a 60-plus-win team with James on the roster. Or the Cavs could wait for Wiggins, Irving and Tristan Thompson to develop further.
But James has a number of alternatives that could get him on a championship-caliber roster right away — and with fewer contingencies. One possibility is Dallas:

The Mavs have probably gotten over James, having made an offer to Chandler Parsons instead (Parsons is a restricted free agent, so the Rockets will have the right to match). And our projections aren’t all that optimistic about them. Dirk Nowitzki is finally due for some age-reversion. Monta Ellis has never been an advanced-stats poster boy. The Mavericks might get poor point-guard play from Ray Felton, and I’m assuming the team would have to salary-dump Brendan Wright, and give up on re-signing Vince Carter and Shawn Marion, in order to clear room for James. With all those issues, they’d still project to a 55-27 record next season with James.
The Knicks rate similarly:

This is almost certainly not going to happen. The Knicks would have to find takers for Amar’e Stoudemire and Andrea Bargnani. Even under this miracle scenario, I’m assuming that they’d lose Iman Shumpert and Tim Hardaway, Jr., in order to facilitate salary-dump deals. I have them relying on a lot of playing time from second-round draft picks and other dubious alternatives like Lamar Odom.
Even so, the Knicks project to a 56-26 record with an Anthony/James pairing and an otherwise spartan roster. Don’t take this as an indication of how awesome the Knicks are, but instead as a benchmark for how little of a draw Miami’s incumbent status really is for James. As I mentioned earlier, a team of league-average players plus James would project to a 56-26 record; Miami is about a league-average team without James, but so are the Knicks. It’s not a high bar to clear.
For some further indication of this, we can look at the next three teams in lightning-round fashion; all project to a 59-23 record with James on the roster. First up, one of Grantland basketball writer Zach Lowe’s dark-horse candidates, the Phoenix Suns:
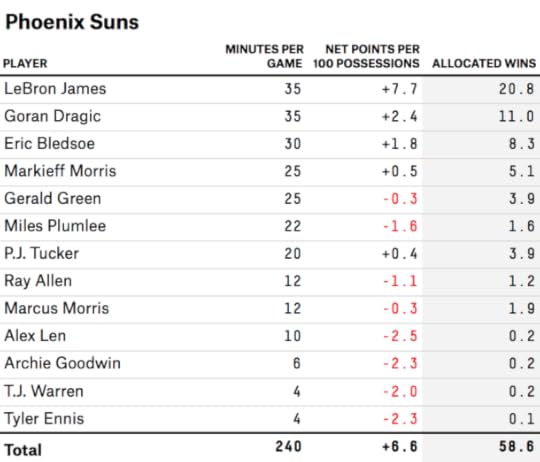
Jeff Hornacek somehow got 48 wins out of a roster that was expected to lose enough to be granted a lottery pick. There’s the potential for some mean-reversion in Phoenix, but that’s much less of a concern for a young club. The Suns have a lot of underpaid players and could potentially add another piece next year in addition to James. As Lowe wrote, if James were making a decision strictly on the basis of getting the max salary on a title contender, the Suns would be an excellent option.
So might another Z-Lowe favorite, the Atlanta Hawks:

The starting five would be very good, depending on Al Horford’s health. There isn’t a lot of depth in Atlanta, but Miami and Cleveland don’t have much depth either.
A sexier alternative would be the Chicago Bulls:
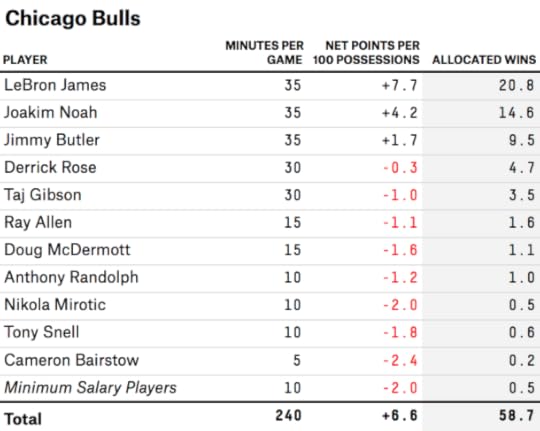
It might seem surprising that the Bulls project no better than the Suns or the Hawks — not that 59 wins is anything to sneeze at. But I’m assuming that to sign James, the Bulls would have to amnesty Carlos Boozer and find a taker for Mike Dunleavy.
Granted, Boozer and Dunleavy are not better than league-average players at this point in their careers. But they also aren’t total zeroes; they combined for 10 win shares last season. The win-shares baseline is too generous; but when James gets added to an already talented roster, he’s taking playing time from some semi-respectable alternatives instead of some Bargnanis.
The other issue is Derrick Rose, who projects as only a league-average player. The problem is not just that Rose has played only 10 games in the past two seasons — he stunk when he did play last year. Still (since we’re indulging in so many hypotheticals) the Bulls would project to a 65-17 record if they both signed James and Rose performed at his 2011-12 level.
James’s final alternative would be to create a sequel to the Big Three with either the Clippers or the Rockets. They’re terrific options if the cap mechanics work.

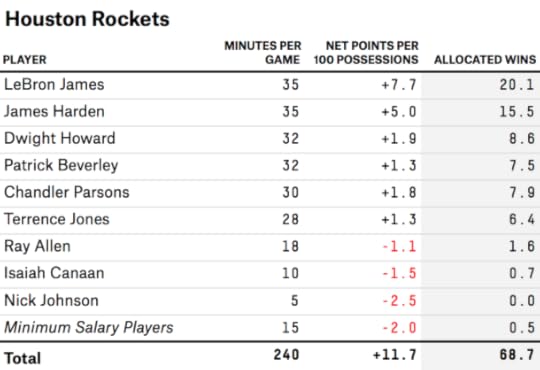
A LeBronful Clips team projects at 66-16 — and the Rockets are even better, at 69-13. The Clippers’ Big Three might be slightly better than the Rockets’, but the Clips would have to gut their roster to keep all three players on board — dumping DeAndre Jordan and Jamal Crawford, and perhaps others. Still, the top-level talent might overwhelm everything else, in the fashion of the 2007-08 Celtics.
The talent in Houston would run six players deep, with Chandler Parsons, Patrick Beverley and Terrence Jones aiding and abetting James, James Harden and Dwight Howard. After that, there would be almost no one on the roster — the Rockets would have to dump Omer Asik and Jeremy Lin to make room for James.
There’s room for concern about how well James, Harden and Howard would mesh together — something that statistics like SPM may not capture well. But this would be a really, really good problem for Houston General Manager Daryl Morey to have. Even if the Rockets lost Parsons to Dallas as collateral damage and gave his minutes to veteran-minimum players instead, they’d project to 65 wins. Even if you subtracted five more wins for lack of team cohesion, they’d still be better positioned to win a championship than the Heat.
But incumbency is a powerful advantage. James may stay in Miami or go back to Cleveland — even if some alternatives might give him a better chance of keeping up with Michael Jordan.

July 8, 2014
The Most Shocking Result in World Cup History
We had Brazil favored to win Tuesday’s World Cup semifinal against Germany (even despite the absence of Neymar and Thiago Silva).
Time to eat some crow. That prediction stunk.
It’s not that a German win was all that unlikely. Germany had a 35 percent chance of victory, according to our model. But the 7-1 scoreline was truly shocking.
The Soccer Power Index (SPI) match-predictor (which uses a poisson distribution to estimate the range of possible scores) gave Germany only a 0.022 percent probability (about one chance in 4,500) of scoring seven or more goals. Likewise, SPI gave Germany a 0.025 percent probability (one chance in 4,000) of beating Brazil by six goals or more.
Statistical models can fail at the extreme tails of a probability distribution. There often isn’t enough historical data to distinguish a 1-in-400 from a 1-in-4,000 from a 1-in-40,000 probability. (This is some of the basis of Nassim Taleb’s book “The Black Swan.”)
We can, however, at least confirm that the match was an extreme outlier from the standpoint of past World Cup matches. There have been 833 matches played since the World Cup began in 1930. Based on the scoreline, this was the most unlikely result.
Although we don’t have SPI ratings before 2006, we can look at the Elo ratings, which are heavily correlated with SPI and contain data back to the 19th century. The Elo ratings (which we’ve updated manually since the start of the World Cup) had Brazil as a 65 percent favorite before Tuesday’s match, with most of that based on its (supposed) home-field advantage.
There’s nothing that noteworthy about a 65 percent favorite losing. Brazil lost as an 87 percent Elo favorite in the 1950 World Cup against Uruguay, for instance. And in the group phase of that World Cup, England lost to the United States with just a 7 percent chance of doing so by Elo’s estimation.
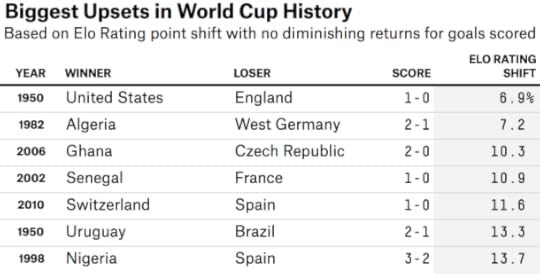
But both of those losses came by a single goal. The Elo formula also accounts for goal differential, although it discounts lopsided margins; scoring the seventh goal doesn’t count as much as scoring the second one. Teams exchange Elo points based on the score of the game and the pre-match odds.
Prior to Tuesday, the biggest shift in Elo points after a World Cup match came in 1958, when Czechoslovakia beat a heavily favored Argentina team by a 6-1 scoreline. That improved Czechoslovakia’s Elo rating by 85 points and lowered Argentina’s by the same margin (in the Elo system, the number of points exchanged between teams always equals zero).
The Germany-Brazil match ranks second by this metric; Germany’s six-goal win produced an 83-point rating shift in its favor.
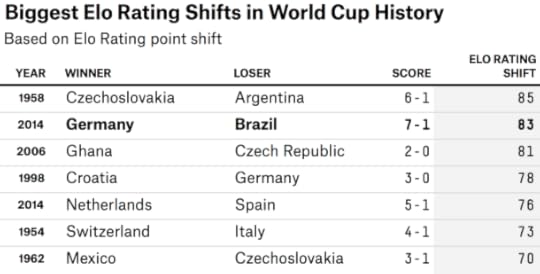
As I mentioned, however, the Elo system discounts lopsided victories. Since it was the lopsidedness of the scoreline that made Tuesday’s match such an outlier, that somewhat defeats our purpose of placing the result in historical context.
So I ran an alternate version of the Elo ratings that includes no discount for scoring margin — every goal counts as much as the last. By this rendering, the Germany-Brazil match does rank well ahead of anything else.

There are still plenty of questions to ask about the match, and the model. To state the obvious, the loss of Neymar and Silva may have had a much larger impact than we accounted for. Not only do those players have enormous individual talent, they serve as the tactical anchors of Brazil’s offense and defense, respectively. Brazil’s defense appeared disorganized — then stunned, then demoralized.
Betting markets, which had the game at even odds going in, look a lot better than SPI and Elo in this instance.
But there was almost certainly some bad luck for Brazil. It had more shots than Germany in the match — I would never have guessed that while watching the game — and kept possession of the ball slightly more than half the time. Some of the goals that Brazil keeper Julio Cesar allowed were unavoidable, but he was not exactly Tim Howard in net. Even if our model had treated the teams as evenly matched going in, it would still have given Germany just a 1-in-900 chance of winning by six goals or more.
Germany’s win will also affect its odds in the World Cup final. Before Tuesday’s match, SPI had it rated just slightly ahead of the Netherlands but just slightly behind Argentina. But it will get a huge amount of credit for its overwhelming victory, and will likely enter the final as the SPI favorite unless the Argentines or the Dutch do something equally impressive.
CORRECTION (July 9, 10:35 a.m.): A previous version of the third table in this post, “Most Unexpected Scorelines in World Cup History,” incorrectly listed Switzerland defeating Turkey 7-0 in 1998 as the fourth-most unexpected scoreline. It should have listed Turkey defeating South Korea 7-0 in 1954. The table has been updated.

Di Maria’s Injury Makes Argentina-Netherlands Almost Even
The injury to Brazil’s Neymar might have made more headlines, but Argentina will also be shorthanded in its World Cup semifinal. Attacking midfielder Angel di Maria, who was hurt in the first half of Argentina’s win against Belgium, will miss the team’s match against the Netherlands on Wednesday.
Di Maria is a big deal. He ranked No. 72 on The Guardian’s list of the world’s top 100 footballers and was UEFA’s man of the match in Real Madrid’s victory over Atletico Madrid in this past spring’s Champions League final.
We can evaluate the impact of di Maria’s injury the same way we did for Neymar — by using the plus-minus rating system embedded within ESPN’s Soccer Power Index (SPI). The plus-minus system has some blind spots. It will underrate world-class defensive players whose contributions don’t show up in the stat line, and it has a limited sample of data for players who don’t play in one of the top five club leagues in Europe. But for di Maria — an attacking player in Spain’s La Liga — it should do reasonably well.
The system estimates that di Maria is worth about 0.33 goals per 90 minutes of play, relative to an average international footballer. (Of these, 0.28 are from his offense and 0.05 are from his defense.) That’s not quite in Neymar’s league, but it would imply that di Maria is somewhere around the 30th best player in the world — a little ahead of where The Guardian ranks him.
Some of di Maria’s value lies in that he can play center midfield or on the wing. That flexibility also makes it hard to say how Argentina will replace him. There are at least five possibilities, including forwards Ezequiel Lavezzi and Rodrigo Palacio, and midfielders Enzo Perez, Ricardo Alvarez and Maxi Rodriguez.
In contrast to Neymar’s potential replacements — which SPI had rated about evenly with one another — the footballers who might spell di Maria are seen rather differently by the system, as shown in the chart below (numbers are rounded). SPI rates Palacio and Rodriguez highly, Perez relatively poorly, and the others somewhere in between.

But the ratings for Rodriguez and Perez are based on a small sample of games. (This is especially so for Rodriguez, who plays for Newell’s Old Boys in the Argentine Primera Division, not a league that we track.) Therefore, I’ve weighed the potential replacements by the number of minutes with them on the pitch in recent games in the SPI database.
This weighted average estimates that the replacements are the equivalent of 0.13 goals per 90 minutes worse than di Maria, including both offensive and defensive play. This is enough to lower Argentina’s chances of beating the Netherlands from 57 percent at full strength to 53 percent.
Nevertheless, the trade for Argentina – one missed match for di Maria (it’s hoped he’ll be back for the final) in exchange for two Neymar absences and one Thiago Silva suspension on rival Brazil — isn’t a horrible one. The injury-adjusted version of our World Cup odds, shown in the table below, gives Argentina a 21 percent chance of winning it all. This is slightly higher than the unadjusted version, which assumes Argentina and Brazil are healthy and puts Argentina’s chances at 20 percent instead.


July 7, 2014
It’s a Huge Upset When All the World Cup Favorites Win
Warren Buffett has a great investment track record. So perhaps it’s no accident that he declined to offer $1 billion for correctly predicting the outcome of all World Cup knockout stage games, as he did for the NCAA men’s basketball tournament games.
The odds of winning Buffett’s NCAA challenge were about one in 7.4 billion, assuming you chose the favorite in each game as selected by FiveThirtyEight’s NCAA model. But the odds of correctly filling out a 16-team knockout tournament such as the World Cup are much shorter.
In fact, though there have been some thrilling matches in the knockout stage so far — six of 12 have gone to extra time and only two were decided by more than one goal — the favorite has advanced every time (at least as according to the FiveThirtyEight’s World Cup predictions).
Here is the breakdown so far. The following table lists the win probability for the FiveThirtyEight favorite as of the day of the match, along with the cumulative probability of the model having called all knockout stages correctly up to that point in time.

For instance, the probability of correctly identifying the winners in each of the first four knockout matches — Brazil over Chile, Colombia over Uruguay, the Netherlands over Mexico and Costa Rica over Greece — was about 23 percent, or one chance in 4.3. And the chance of going 12 for 12, as the FiveThirtyEight favorites have done so far, is just one in 75.
It’s an upset, in other words, when all the favorites prevail. On average, we’d have expected three or four upsets through this point in the knockout round.
Of course, there are four matches left — counting the World Cup’s third-place playoff between the two semifinal losers. According to the FiveThirtyEight forecasts, Brazil is favored over Germany on Tuesday (even after accounting for Neymar’s injury) and Argentina is slightly favored over the Netherlands on Wednesday. To complete a perfect knockout bracket, Germany would then need to beat the Netherlands in the consolation game while Brazil prevailed over Argentina in the final.
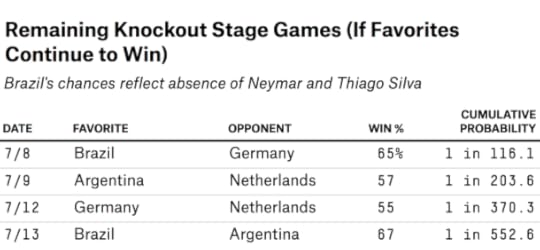
All of the remaining matches look pretty close, so the FiveThirtyEight forecasts are likely to fail at some stage. If the model gets the matches right, however, it will have made good on a 1-in-553 chance of calling all 16 knockout stage winners correctly.
Incidentally, this isn’t the huge success for the FiveThirtyEight model that it might seem. The FiveThirtyEight forecasts are probabilistic. Teams listed as 75 percent favorites are supposed to win about 75 percent of the time over the long run — not much less than that but also not any more often. There are supposed to be some upsets. If 75 percent favorites are winning 100 percent of the time over the long run instead, that means the forecasts are miscalibrated and overestimating the chances for the underdogs.
In this case, the success of the favorites does seem to be mostly a matter of luck. Three games have gone to a penalty shootout so far — pre-match favorites might have a slight edge in those but not much of one. Mexico, meanwhile, was a few minutes away from defeating the Netherlands, and the U.S. was a few inches away from beating Belgium.
The best way to test probabilistic forecasts is to check their calibration and to compare them against alternative probabilistic estimates. For example, if your model says that the U.S. has a 40 percent chance of beating Belgium and the consensus betting line gives the U.S. just a 25 percent chance instead, you should bet on the Americans — even though you expect Belgium to win most of the time. So far, the FiveThirtyEight forecasts have done well against consensus betting lines when used in this fashion — although that could reflect good luck, too.

How Neymar’s Injury Affects Brazil’s Chances at the World Cup
Brazil has been FiveThirtyEight’s frontrunner to win the World Cup since the beginning of the tournament. But A Seleção will have to do it without its star, Neymar, who is out of the tournament after fracturing a vertebra in Brazil’s quarterfinal win against Colombia. In the semifinal against Germany on Tuesday, Brazil will also be without defender Thiago Silva, who was suspended after accumulating two yellow cards (Silva will return if Brazil reaches the final).
Our forecast, which gives Brazil a 54 percent chance of treating its home fans to a title, doesn’t account for these player absences. This article will attempt to measure their impact and recalculate the numbers.
We have some reasonably good news for Brazil. Even without Neymar and Silva, the team remains the leading contender to win the World Cup in our estimation. You may or may not agree with the math, but the intuition behind it is this: Soccer is a team sport, and Brazil is a very deep team. Whether Brazil is better than Germany without Neymar and Silva is up for debate. However, Brazil will play at home, where the national team hasn’t lost a competitive match since 1975.
Our rating system
Our World Cup forecasts are based on ESPN’s Soccer Power Index (SPI). SPI is essentially two ratings systems rolled into one. It measures a national team’s performance, placing more weight on its most competitive matches, and evaluates the talent on its roster based on players’ performance in national and club matches.
The player ratings work by means of a plus-minus system that assigns or subtracts points from players based on goals scored and allowed at the time they’re on the pitch. They include data from national team matches, along with the top-flight club leagues in Spain, England, Italy, Germany and France, and matches from the Champions League.
In principle, the system operates something like this. The average English Premier League team scores and allows about 1.4 goals per game. But let’s say Arsenal wins a game 3-1 instead against an average EPL opponent. Its three goals scored are 1.6 goals above the league average, so we have 1.6 goals worth of extra credit to apportion out to the players who were on the pitch at the time. Arsenal also allowed 0.4 goals less than average, so there’s 0.4 goals worth of defensive credit to split up, too.
In theory, this allows us to estimate the impact of any one player. But the plus-minus works better for some players than others. The statistics it accounts for are goals scored, bookings and the starting lineups and substitutions of a match, along with the players’ positions. This works fine for strikers like Neymar, whose main objective is to score goals and set them up, but it isn’t as helpful for defenders like Silva.1 SPI will give about the right overall amount of credit to the back line and midfielders on a team — for instance, to Silva’s Paris Saint-Germain after an impressive victory. But if Silva is better than the other defenders, it will give him too little credit and his teammates too much.
So we’ll use the SPI method to account for Neymar’s absence, and then an alternative method that might more accurately measure the loss of Silva.
The impact of Neymar’s absence
For forwards and strikers, the SPI plus-minus ratings line up reasonably well with subjective perceptions. The following chart compares SPI plus-minus ratings for forwards, measured as the number of additional goals they help score and prevent per 90 minutes of play, as compared to The Guardian’s consensus list of the top 100 footballers in the world.
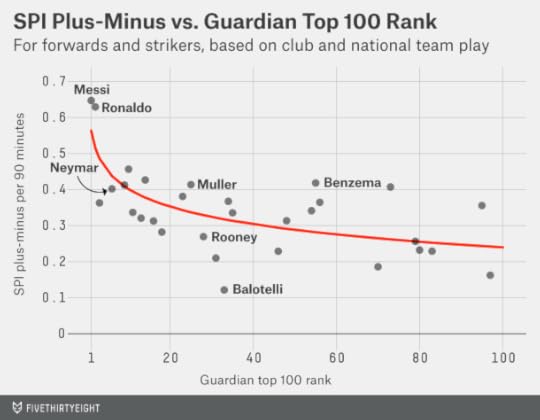
The correlation isn’t perfect, but it’s reasonably good. The amazing Lionel Messi, along with Portugal’s Cristiano Ronaldo, rate as the best forwards in the world by far in both systems.
Based on data from his FC Barcelona games over the past two years, along with his recent play for Argentina, for instance, we estimate that Messi contributes about 0.65 goals per game relative to an average international footballer. (Almost all of that impact comes from Messi helping his team get more goals — only a little bit is defense or goal prevention.)
How big is that impact? The SPI match predictor estimates that if you put Messi on an average team, it would go from winning 50 percent of its games (assuming a knockout-style format with no draws) to around 65 percent instead. That’s impressive — not far from the effect you might see by replacing an average NBA player with LeBron James. But James plays a 5-on-5 game, while Messi and Ronaldo play one with 11 players to a side.
Neymar isn’t quite at Messi’s or Ronaldo’s level — nor is anyone else. Instead, SPI estimates his impact at about 0.4 goals per 90 minutes. Almost all of this (0.37 goals) comes from increasing his team’s scoring, while just a fraction (0.03 goals) comes from improving its goal prevention.
These player ratings can be carried forward to the team level. For instance, if you removed Neymar from the pitch and replaced him with an average international footballer, Brazil’s scoring would drop by 0.37 goals per 90 minutes, we estimate. Brazil would also allow an additional 0.03 goals per 90 minutes of play.
But the players replacing Neymar are going to be well above average. An average international soccer player, according to SPI, is something like a starter on Israel or Libya or Uzbekistan. A player on Brazil’s second or third string would be a star on one of those sides.
It’s not clear exactly who will replace Neymar. In fact, it may wind up being a combination of players, given that his injury will have knockoff effects on Brazil’s depth. But Neymar’s playing time will likely be distributed principally among three players: the forwards Bernard and Jo, and the winger Willian.
Of the three, we have the best data on Willian, since he plays his club football for Chelsea in the EPL — one of the leagues we track. SPI estimates he’s worth about 0.2 goals per 90 minutes relative to an average footballer. If Neymar is worth about 0.4 goals per 90 minutes, Willian is 0.2 goals per 90 minutes worse. (Some numbers in the tables below may look slightly off due to rounding.)
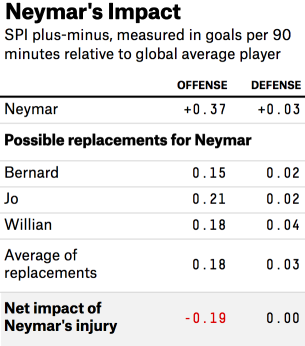
For Bernard, who plays for Shakhtar Donetsk in Ukraine, we have data only from his performance with Brazil, plus a smattering of Champions League matches. And for Jo, who plays for Atlético in Brazil, we have the national team data only. But they rate similarly to Willian, at about +0.2 goals per 90 minutes.
Certainly these players lack Neymar’s explosiveness and creativity. But this isn’t a total disaster for Brazil. Ratings in the range of +0.2 goals per 90 minutes imply that Willian, Bernard and Jo would belong somewhere in the top 200 or 250 footballers in the world, and would start for most of the teams that made the World Cup.
The impact of Silva’s absence
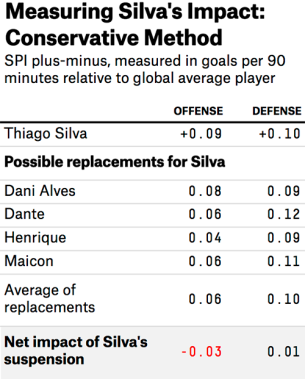
Brazil will also be without Thiago Silva for the Germany match, and coach Luiz Felipe Scolari has a number of options to replace him. Brazil played Dani Alves in its first four World Cup matches, then replaced him with Maicon for its game against Colombia. Scolari could choose to play them both instead, though Brazil would need to rotate its formation, as they both typically play right back rather than center. Scolari could also go with Dante, who plays center defense for Bayern Munich and who has the advantage of being familiar with some of Germany’s stars. Henrique, who plays as a center back or defensive midfielder, would be another option.
The SPI plus-minus ratings suggest that there’s hardly any difference between Silva and some of these options — and what impact it does find comes on offense, such as on set pieces.
But this conclusion may be misguided. As I mentioned, the SPI ratings are a crude tool for evaluating defensive players. They do get us somewhere: SPI knows that Silva plays for Brazil and Paris Saint-Germain, two excellent teams, and gives him credit for being in those lineups. But it will have trouble distinguishing truly world-class defensive players from merely very good ones.
There’s a more aggressive way to approach the problem, however, which is to approximate Silva’s defensive value by using his position on The Guardian’s top 100 ranking. Silva was No. 17 on that list.
As I mentioned, the SPI plus-minus should be pretty solid for forwards and strikers. So we can calibrate the value of Silva by estimating how much a striker rated as the No. 17 player in the world would be worth. This value turns out to be about 0.37 goals per 90 minutes based on the regression line I drew in the chart above. By comparison, the raw SPI numbers put Silva’s impact at 0.19 goals per 90 minutes, considering both offensive and defensive contributions.
So let’s assume that The Guardian’s panelists have it right and that Silva is in fact worth 0.37 goals per match. We’ll further assume that SPI is missing Silva’s defense but that it gauges his offensive contributions about right. That implies having Silva on the pitch reduces an opponent’s goal-scoring by about 0.28 goals per 90 minutes relative to an average player, while he adds 0.09 goals per match with his offense.
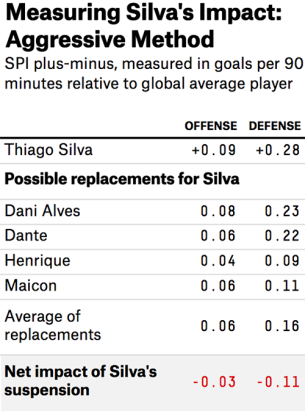 If we make this fix for Silva, however, we should do so for Dante and Dani Alves, who also rank in The Guardian’s top 100. (We won’t make any adjustment for Henrique and Maicon, who are outside the top 100.)
Averaging the figures for Silva’s potential replacements yields a combination of players that rate at +0.22 goals per 90 minutes. That’s about 0.15 goals per match worse than Silva. More precisely, we estimate Brazil’s goal-scoring to decline by 0.03 goals per 90 minutes without Silva, and for it to allow an additional 0.11 goals in that time.
The change to Brazil’s odds
The next step is to see what impact this has on Brazil’s overall chances of victory. Brazil, at full strength, has an SPI offensive rating of 3.12 (placing it No. 1 in the world) and an SPI defensive rating of 0.50 (putting it at No. 3 — at the team level, lower defensive ratings are better).
Without Neymar and Silva, Brazil’s offensive rating declines to 2.90 while its defensive rating worsens to 0.61. Both ratings are almost identical to Germany’s, which checks in with a 2.92 offensive rating and a 0.63 defensive rating.
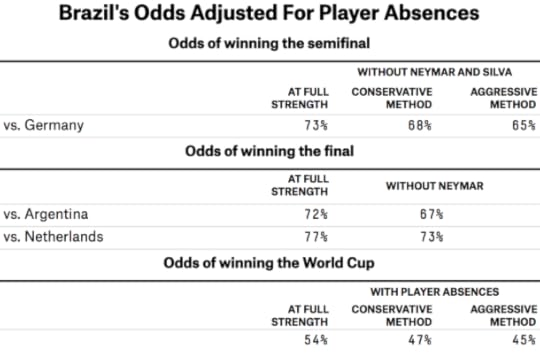
But Brazil still has the home-country advantage. If we run the new numbers through the SPI match predictor, we come up with a 65 percent chance of Brazil prevailing against Germany. This is as opposed to a 73 percent chance of doing so with Silva and Neymar in the lineup.
Let me pause here to ruminate on the nature of home-country advantage in soccer. Brazil has developed a reputation for “winning ugly” so far in this World Cup. The team was helped by a dubious penalty in its opening match against Croatia. It needed a penalty shootout to get by Chile. And Brazil’s match against Colombia was marred by rough play, including the foul that knocked Neymar out.
But winning ugly is part of what home-field advantage is all about. Home teams benefit significantly from officiating decisions — it’s much harder for most referees to hand out a red card or to award a penalty against the home team’s hero. Home teams may also have some advantage in shootouts. Since 2005 — and counting Brazil’s win against Chile — home teams are 7-0 in penalty shootouts in major international competitions. That’s not to say that Brazil has been in its best form (in fact, its SPI rating has declined slightly over the course of the World Cup). But in Brazil, being in pretty good form may be good enough.
Should Brazil make it to the final — with Silva returning but still without Neymar — we estimate that it would have a 67 percent chance of beating Argentina (down from 72 percent with Neymar in the lineup). Almost all of that comes from home-field advantage — the teams would be almost level at a neutral site. Brazil would have a 73 percent chance against the Netherlands without Neymar, we estimate, down from 77 percent with him.
We can recalculate Brazil’s overall odds of winning the World Cup as well: They’re 45 percent, as opposed to 54 percent with the team at full strength. The other teams benefit from Brazil’s limitations: Argentina’s odds of winning the World Cup rise to 23 percent from 20 percent; Germany’s to 18 percent from 14 percent. The Netherlands gets the least help and goes to 14 percent from 12.5 percent.
Betting markets see things a bit differently. The odds available as of early Sunday afternoon have Germany, Brazil and Argentina as co-favorites, each with about a 27 percent chance of winning the World Cup, and the Netherlands just slightly behind at 20 percent.
It could be that the markets see a greater impact from the losses of Neymar and Silva than the ones we’ve estimated here. But I suspect that’s only part of the issue — from the start of the tournament, betting markets have consistently been lower on Brazil than SPI and another computer rating system, Elo, have.
So far, SPI and Elo have performed well compared to the betting markets. In general, markets are fairly tough to beat, so this could just reflect good luck. International football is particularly hard to rate, whether using subjective or objective methods. The main problems are that the teams don’t play very many competitive matches against one another, and that the composition of the rosters is always changing. SPI tries to address some of those problems, but it isn’t perfect.
But there could also be a pro-European bias in the markets. Even though Europe has performed rather poorly in this World Cup, it has the highest-profile club leagues, and it has a higher concentration of wealthy people who can afford to bet on soccer. FIFA’s ranking of international teams, with methodological flaws that may result in overrating European teams, also has some currency in shaping perceptions about international soccer. That may help to explain why betting markets give the European teams a 47 percent chance of winning the World Cup when SPI gives them a 32 percent chance (even after accounting for Brazil’s player absences). It may also help to explain why Brazil’s ugly wins against Colombia and Chile are given less credit than if they had come against, say, Portugal and France.
In a sense, the World Cup has come full circle. At the start of the tournament, SPI’s major contentions were that South America was underrated as compared with Europe — and that Brazil’s home-field advantage shouldn’t be overlooked. Brazil still has those things working in its favor, even without Neymar.

July 3, 2014
How the NFL’s Top Receivers’ Stats Would Change If They Played With Average QBs
The New Orleans Saints’ Jimmy Graham lost an arbitration hearing Wednesday in which he sought classification as a wide receiver rather than a tight end. Graham’s desire to be a wideout might seem counterintuitive to fantasy football players used to a game where being a tight end makes Graham even more valuable. But in the NFL, Graham will lose money as a result of the decision. He’s been designated with the Saints’ franchise player tag, which means that his compensation is determined by the top salaries in the NFL at his position. The five highest-paid NFL wide receivers make an average of about $12 million per season — more than the $7 million the top tight ends do.
The arbitrator’s decision might seem unfair to Graham. Over the past three NFL seasons, Graham ranks eighth in the NFL in receiving yards, fourth in receptions and first in receiving touchdowns. He’s put up stats comparable to the best wide receivers — but he won’t be paid like one.
But there’s a catch, and it has nothing to do with Graham’s position. Instead it involves his quarterback. Over the past three NFL seasons, Saints’ quarterback Drew Brees has ranked first in the league in passing yards, passing touchdowns and completions. Graham has been a big part of that. But even if we subtracted Graham’s receiving statistics from Brees’s totals, Brees would rank seventh, third and sixth in those categories.
So we can say Brees’s numbers would still be very strong with an average tight end (or even with no tight end at all). But what would Graham’s numbers look like with an average QB?
We can come to some reasonable estimates by using ESPN’s Total Quarterback Rating. Unlike most other quarterback statistics, Total QBR seeks to isolate the contribution of the quarterback as opposed to his receivers and his offensive line. It does so by using play-by-play tracking to account for things such as misthrown balls, yards after the catch and defensive pressure.
Unfortunately, there’s not yet any analog to QBR for wide receivers and tight ends. But we can use QBR to estimate the effect a quarterback has on his receivers’ statistics. The next couple of paragraphs, which detail the method, are going to be a little dry; scroll down if you want to see just the results.
To come up with these estimates, I used a subcomponent of QBR called Pass EPA, which focuses on a quarterback’s passing performance (as opposed to Total QBR, which also accounts for his rushing statistics and his propensity to avoid sacks and draw penalties). I ran a series of regressions on team totals from the 2011-13 NFL regular seasons, which estimated a team’s receiving yards, receptions and receiving touchdowns as a function of its Pass EPA. In essence, this reflects what a team’s passing statistics would look like given average receivers and pass protection but its actual quarterbacks. For example, a team with the quarterbacking of the 2013 Dallas Cowboys (mostly Tony Romo) would project to about 360 receptions, 4000 passing yards and 29 touchdowns given average receivers and offensive linemen.
We can then divide a team’s projected statistics by league-average figures to estimate what effect its quarterbacks had on its receivers. For example, the average team since 2011 has had 24 passing touchdowns. Since the 2013 Cowboys projected to 29 touchdowns instead based on their QBR — about 20 percent higher than average — this implies that Romo boosted his receivers’ touchdown totals by 20 percent. Thus, we can divide the touchdown totals for Dez Bryant, Jason Witten and other Cowboys receivers by 20 percent to estimate how they would have done with league-average quarterbacking.
Let’s return to Graham. His quarterback isn’t the good-but-not-consistently-great Romo; it’s the spectacular Brees. Here’s what I estimate Graham’s numbers would have looked like with an average quarterback instead of Brees:
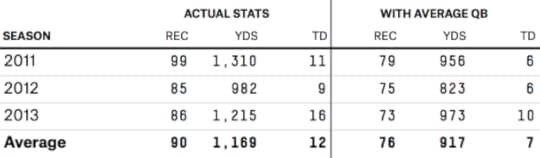
In the table above, REC, YDS and TD represent a receiver’s unadjusted receptions, receiving yards and receiving touchdowns.
Graham has been averaging about 90 receptions and 1,200 yards per year under Brees. I estimate that his totals would be more like 75 receptions and 900 yards with an average QB. And he’d go from having about 12 touchdowns per season to seven or eight instead. (Quarterbacks have an especially large impact on their receivers’ touchdown totals, in part because it requires consistent quarterbacking to get a team into the red zone.)
These revised totals would still qualify Graham as an exceptional tight end — but they’d only be very good by the standard of a wide receiver. In the next chart, I’ve listed the actual and QB-adjusted receiving statistics for the top 50 players in the NFL as ranked based on a fantasy football scoring system of one point per reception, one point per 10 receiving yards and six points per receiving touchdown. (Fantasy football scoring systems place too much emphasis on touchdowns rather than yardage, but I’ll leave that argument for another day.)
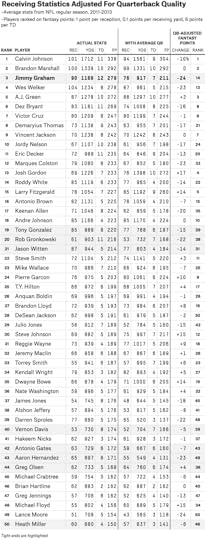
Based on his average fantasy points (FP) per season since 2011, Graham ranks third among all receivers and tight ends. But his FPs decline by almost 25 percent using his QB-adjusted statistics, so he falls to 14th place instead.
Graham has benefited as much from his quarterbacks as any player in the NFL. Other pass-catchers for the Saints have been helped almost as much. So has Wes Welker, who left the New England Patriots and joined the Broncos just as Patriots quarterback Tom Brady began to show some signs of age. In Denver, Peyton Manning, apparently ageless, had perhaps the best QB season of all-time.
The biggest gainer is the Browns’ Josh Gordon, who has posted excellent statistics despite a horrible quarterbacking situation in Cleveland. If Johnny Manziel lives up to the hype, Gordon could be a fantasy football monster next season (if he plays; Gordon failed a drug test and will be suspended for a yet to be determined number of games).
For most other players, the effects are not so dramatic. Calvin Johnson and Brandon Marshall rate as the No. 1 and No. 2 receivers according to both raw and QB-adjusted statistics.
But the league’s best tight ends tend to fall with the adjustment for quarterback quality. Rob Gronkowski drops from No. 20 to No. 39, for instance. Witten falls from No. 21 to No. 31 and Antonio Gates from No. 42 to No. 48.
This could be a fluke — it’s a small sample of players. But it could also mean that tight ends are especially dependent on having good QBs. Along with slot receivers like Welker (it might be best to think of tight ends like Graham as being analogous to slot receivers), they tend to rely on routes based on precision and timing rather than beating their man downfield. Running those routes — and catching passes in traffic — requires a lot of skill. But the quarterback’s impact may be proportionately higher. That may be part of why NFL teams do not pay the best tight ends as well as the best wideouts.

Nate Silver's Blog

- Nate Silver's profile
- 729 followers

