
Nate Silver's Blog, page 177
March 27, 2014
The NCAA Bracket: Checking Our Work
Our NCAA tournament forecasts are probabilistic. You could say that FiveThirtyEight is “calling” for Michigan State to defeat Virginia on Friday, but it isn’t much of a call. Our model gives Michigan State a 50.7 percent chance of winning, and Virginia a 49.3 percent chance. For all intents and purposes, it’s a toss-up.
Other times, of course, one team has a much clearer edge. Duke was a 92.9 percent favorite against Mercer last week, but Mercer won.
Still, upsets like these are supposed to happen some of the time. The question in evaluating a probabilistic forecast is whether the underdogs are winning substantially more or less often than expected. The technical term for this is calibration. But you might think of it more as truth in advertising. Over the long run, out of all the times when we say a team is a 75 percent favorite, is it really winning about 75 percent of the time?
FiveThirtyEight’s NCAA tournament projections have been published each year since 2011. The formula has changed very little over that period. (The only substantive change has been adding a fifth computer power rating, ESPN’s Basketball Power Index, this season.) That gives us a reasonable baseline for evaluation: a total of 254 games, counting the 52 played so far this year. (These totals include “play-in” games.)
You can find a file containing our past predictions
Not all the numbers work out so neatly, however. Another bin contains all those favorites with win probabilities in the 50s (anywhere from 50.0 percent to 59.9 percent). These teams were supposed to win about 55 percent of the time. In fact, they’ve won 38 of 63 games, or 60.3 percent of the time. So the teams performed a little better than expected in these games.
By contrast, teams with win probabilities in the 60s (from 60.0 percent to 69.9 percent) have won 35 of their 60 games, or 58.3 percent. That’s a bit worse than expected.
What’s going on here? How are the somewhat heavier favorites, with win probabilities in the 60s, performing worse than those teams whose win probabilities were in the 50s? Are the heavier favorites getting cocky? Is there something wrong with the model?
Probably not. Instead, these differences are well within the ranges that might result from random chance. This is easier to explain visually, as in the following graphic, which portrays the results of games from each bin along with their confidence intervals.

Each result is within its respective confidence interval. The calibration is not perfect. But the deviations from perfect calibration are not statistically significant. We encourage you to


March 26, 2014
For Columnist, a Change of Tone
A New York Times columnist has expressed substantially more negative sentiments about FiveThirtyEight since it left The New York Times, according to a FiveThirtyEight analysis.
The columnist, Paul Krugman, who writes about economics and politics for The Times, has referred to FiveThirtyEight or editor-in-chief Nate Silver 33 times on his blog. FiveThirtyEight classified each reference based on whether it expressed a favorable, unfavorable or neutral sentiment toward FiveThirtyEight.
DateFiveThirtyEight’s StatusSentiment9/10/08IndependentNeutral9/11/08IndependentNeutral10/17/08IndependentFavorable6/22/09IndependentFavorable1/20/10IndependentFavorable4/1/10IndependentFavorable8/8/10IndependentUnfavorable4/13/11NYTFavorable7/14/11NYTFavorable9/11/12NYTFavorable9/26/12NYTNeutral9/30/12NYTNeutral10/25/12NYTFavorable10/27/12NYTNeutral10/28/12NYTFavorable10/30/12NYTFavorable11/3/12NYTFavorable11/4/12NYTFavorable11/4/12NYTNeutral11/6/12NYTFavorable11/7/12NYTFavorable11/7/12NYTFavorable11/8/12NYTNeutral11/10/12NYTFavorable11/21/12NYTFavorable11/27/12NYTFavorable11/30/12NYTFavorable1/22/13NYTUnfavorable8/5/13DormantNeutral3/18/14ESPNUnfavorable3/18/14ESPNUnfavorable3/23/14ESPNUnfavorable3/26/14ESPNUnfavorableFiveThirtyEight was an independent blog prior to joining The New York Times on Aug. 25, 2010. Mr. Krugman referred to FiveThirtyEight or Nate Silver on seven occasions during its independent period. Four of these mentions were favorable, two were neutral, and one was unfavorable.
During FiveThirtyEight’s tenure with The New York Times, Mr. Krugman referred to FiveThirtyEight or to Nate Silver 21 times. Over all, 15 of these references were favorable, as compared to five neutral references and one unfavorable one.
But Mr. Krugman’s views of FiveThirtyEight have changed since it re-launched March 17 under the auspices of ESPN. The columnist has mentioned FiveThirtyEight four times in just nine days, all in negative contexts. (Mr. Silver has frequently criticized what he calls “pundits” and “opinion journalists,” including those who write for The Times.)
To be sure, the difference in Mr. Krugman’s views could reflect a decline in quality for FiveThirtyEight. The web site has brought on almost two dozen new employees and contributors. And it has expanded its coverage beyond politics into sports, economics and other areas.
While it can be easy to extrapolate a spurious trend from a limited number of data points, the differences are highly statistically significant. At his current pace, Mr. Krugman will write 425 more blog posts about FiveThirtyEight between now and the 2016 presidential election.

March 25, 2014
The DSCC Can’t Have It Both Ways
There was a lot of discussion Monday about the rebuttal by the Democratic Senatorial Campaign Committee (DSCC) to FiveThirtyEight’s latest Senate forecast. That forecast identified the Republicans as more likely than not to take over the Senate. But the GOP’s advantage is slim, and there’s a lot of uncertainty in both the individual races and the overall forecast.
The DSCC’s memo pointed to past forecasts by FiveThirtyEight that were off the mark. It’s a fun story for news outlets, but public statements by partisan groups won’t usually say anything that you didn’t already know.
Indeed, it’s not news that forecasts are sometimes wrong — as our Senate forecasts were in Montana and North Dakota in 2012. (Democrats won both races when Republicans were favored in our model.) Furthermore, the margin of error is larger at earlier stages of the campaign.
That’s why our forecasts are expressed in terms of probabilities. For example, our NCAA tournament model gave Mercer just a 7 percent chance of defeating Duke on Friday. Mercer won. Upsets are supposed to happen sometimes. Specifically, out of all forecasts in which we say the underdog has a 7 percent chance of prevailing, the underdog is supposed to win about seven times out of 100 over the long run — no more and no less. This property is called calibration, and it’s one of the best ways to assess probabilistic forecasts. (We’ll be conducting a test of the historical calibration of our NCAA forecasts this week.)
Nor is it news when party officials claim that the errors are all in their direction. During the 2012 presidential campaign, Republicans were convinced that Mitt Romney would significantly outperform the polling averages. In fact, the polls weren’t all that great in 2012. But the polls were biased (I use the term “bias” strictly in a statistical sense) in favor of Romney, rather than against him. For instance, President Obama won Colorado by 5.4 percentage points as compared with a RealClearPolitics polling average that showed him ahead by 1.5 points; he won Virginia by 3.9 points as compared with a RealClearPolitics polling average of 0.3 points.
Sometimes, as in North Dakota in 2012, party officials are right and public polls are wrong. But more often, it’s the other way around, such as when the Romney campaign’s internal polls were badly biased toward its candidate, or when Democratic polls claimed the Wisconsin gubernatorial recall in June 2012 was a toss-up. (Instead, Scott Walker, the Republican governor, was retained by 7 percentage points — almost exactly what the public polls predicted.) On average, partisan polls released to the public express a 6-point bias in favor of their candidate.
Our forecasts could be wrong in November. In fact, they probably will be wrong — it’s unlikely that Republicans will win exactly six seats. But we think it’s equally likely that our forecast will be biased in either direction. If Democrats retain just one more seat, they’ll hold the Senate. Or Republican gains could grow to seven seats, or quite a bit more.
And here’s the least surprising news: Political campaigns are hypocritical. At the same time the DSCC is criticizing our forecasts publicly, it’s sending out email pitches that cite Nate Silver’s “shocking, scary” forecasts to compel Democrats into donating.
You’d do well to shut out the noise the next time the DSCC writes a polling memo.

March 24, 2014
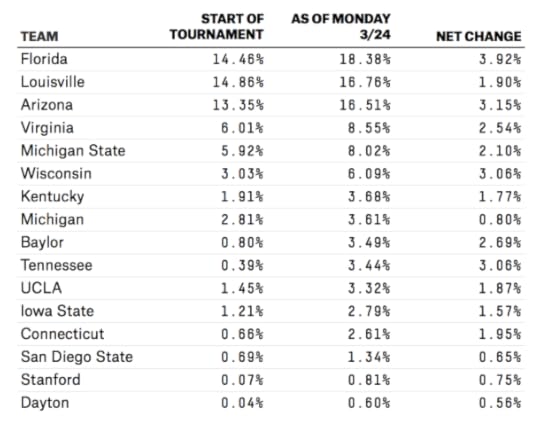
The Gators Bite Back
On Friday, I noted that the Florida Gators had seen a decline in their chances of winning the NCAA men’s basketball tournament despite beating Albany in their opening game. What hurt the Gators’ prospects? They defeated No. 16 Albany by an underwhelming 12 points, and they drew a tough Round of 32 matchup against Pittsburgh and a looming regional final matchup against either Kansas or Syracuse.
But the Gators had a terrific weekend. They thrashed Pittsburgh by 16 points. And they were helped by upsets in the other half of the South region, with No. 3 Syracuse and No. 2 Kansas both losing to opponents with double-digit seeds.
The Gators’ game against UCLA on Thursday is no gimme — they have a 72 percent chance of winning it, according to our model. But conditional upon winning that game, they have an 83 percent chance of winning the regional final against either No. 10 Stanford or No. 11 Dayton and advancing to the Final Four.
All in all, the Gators benefited more than any other team from the opening week of the tournament. Their chances of winning the national title are 18.4 percent, up from 14.5 percent before the tournament began.

March 23, 2014
FiveThirtyEight Senate Forecast: GOP Is Slight Favorite in Race for Senate Control
When FiveThirtyEight last issued a U.S. Senate forecast — way back in July — we concluded the race for Senate control was a toss-up. That was a little ahead of the conventional wisdom at the time, which characterized the Democrats as vulnerable but more likely than not to retain the chamber.
Our new forecast goes a half-step further: We think the Republicans are now slight favorites to win at least six seats and capture the chamber. The Democrats’ position has deteriorated somewhat since last summer, with President Obama’s approval ratings down to 42 or 43 percent from an average of about 45 percent before. Furthermore, as compared with 2010 or 2012, the GOP has done a better job of recruiting credible candidates, with some exceptions.
As always, we encourage you to read this analysis with some caution. Republicans have great opportunities in a number of states, but only in West Virginia, South Dakota, Montana and Arkansas do we rate the races as clearly leaning their way. Republicans will also have to win at least two toss-up races, perhaps in Alaska, North Carolina or Michigan, or to convert states such as New Hampshire into that category. And they’ll have to avoid taking losses of their own in Georgia and Kentucky, where the fundamentals favor them but recent polls show extremely competitive races.
Since a number of you may be new to FiveThirtyEight, I’m going to go into slightly more detail than usual in explaining how we make these forecasts. You’re welcome to skip past this next section if you’re more interested in the forecasts than in how we came to them.
An overview of our methodology
In contrast to the forecasts we’ll begin issuing sometime this summer, which are strictly algorithmic based on our senate forecast model, these are done by hand. However, they’re based on an assessment of the same basic factors our algorithm uses:
The national environment. The single best measure of the national political environment, in our view, is the generic congressional ballot. Right now, it shows a rough tie between Democrats and Republicans. That stalemate likely reflects voters’ dislike for both Obama and the Republican Party.
A tie on the generic ballot might not sound so bad for Democrats. But it’s a misleading signal, for two reasons. First, most of the generic ballot polls were conducted among registered voters. Those do not reflect the turnout advantage the GOP is likely to have in November. Especially in recent years, Democrats have come to rely on groups such as racial minorities and young voters that turn out much more reliably in presidential years than for the midterms. In 2010, the Republican turnout advantage amounted to the equivalent of 6 percentage points, meaning a tie on the generic ballot among registered voters translated into a six-point Republican lead among likely voters. The GOP’s edge hadn’t been quite that large in past years. But if the “enthusiasm gap” is as large this year as it was in 2010, Democrats will have a difficult time keeping the Senate.
Democrats’ other problem is one of basic constitutional mathematics. Senators are elected in six-year cycles, so the seats in play this year were last contested in 2008,1 an extraordinarily strong year for Democrats. Even a strictly neutral political environment, or one that slightly favored Democrats, would produce a drop-off relative to that baseline. And Democrats’ losses will grow this year if voters go from modestly favoring Republicans to strongly favoring them.
Incidentally, we prefer to look at aggregate measures of the national environment, like the generic ballot and Obama’s approval ratings, instead of piecemeal ones such as voters’ views of Obamacare. Certainly the unpopularity of the Affordable Care Act — and its clumsy roll-out late last year — contributes to Democrats’ problems. But it’s hard to tell where Obamacare’s unpopularity ends and President Obama’s overall unpopularity begins. Voters’ views of the economy also have ambiguous effects in midterm years, especially when control of government is already divided.
Candidate quality. The notion of “candidate quality” might sound awfully subjective, but there are sound statistical ways to assess it. Fundraising totals, especially individual contributions, are a good indication of a candidate’s organizational strength. Various systems rate a candidate’s ideology on a left-right scale, based on her voting record or public issue statements, and we can compare those ratings against those of voters in her state. And candidates who have previously held elected office tend to outperform inexperienced ones, controlling for other factors.
State partisanship. As Dan Hopkins wrote at FiveThirtyEight last week, races of all kinds have become more and more correlated with presidential results in recent years. So the Partisan Voting Index (PVI), which compares how a state voted in the past two presidential years against the national popular vote, is also a useful tool for congressional races. At this early point in the cycle, there’s reason to be skeptical of races where the polls are out of step with how the state usually votes; states often revert to their partisan mean once more voters engage with the campaign.
Incumbency. Incumbents may be unpopular in the abstract, but they still win the overwhelming majority of races. Incumbency still represents an advantage in most cases, and sometimes a significant one. We can spot the potential exceptions by looking at an incumbent’s approval or favorability ratings.
Head-to-head polls. Head-to-head polls at this point in the cycle have some predictive power if evaluated carefully. That means taking care to see whether the poll was conducted among registered or likely voters, and putting less emphasis on polls when one or both candidates lack widespread name recognition. However, as my colleague Harry Enten has lamented, many of the more important Senate races have rarely been polled this year. Furthermore, much of the polling comes from firms such as Rasmussen Reports and Public Policy Polling, which have poor track records, employ dubious methodologies, or both. So the most appropriate use of polls at this stage is to see whether they roughly match our assessment of the race based on the fundamentals. Where there is a mismatch, it could indicate that the polls are missing something, that our view of the fundamentals is incorrect, or some of both — and it means there is more uncertainty in the outlook for the state.
Overall forecast
In consideration of these factors, we assess the probability of the Democratic or Republican candidate winning each seat. Where the choice of candidates is uncertain — for instance, in a race where a Democrat will face either a moderate, six-term incumbent U.S. representative or a poorly-financed tea party upstart, depending on the outcome of the Republican primary — the probabilities are meant to reflect a weighted combination of the plausible match-ups. Our assessment of the 36 races2 up for grabs this November is as follows:

One advantage of looking at the races on a probabilistic basis is that we can simply sum the probabilities to come up with a projection of how the new Senate will look. That method projects that Republicans will finish with 51 seats,3 a net gain of six from Democrats, and exactly as many as they need to win control of the chamber. (Democrats will hold the Senate in the event of a 50-50 split because of the tiebreaking vote of Vice President Joe Biden.)
That represents an edge for Republicans, but not much of one — and there are any number of paths by which they might get to 51 seats, or fail to do so. It might help to break the 36 races down into six categories, based on the party which holds the seat now and its likelihood of flipping to the other party.
Democrat-held seats likely to be picked up by Republicans (4): West Virginia, South Dakota, Montana, Arkansas
You’ll find that our characterization of the 36 races in most cases is very close to that issued by such forecasters as the Cook Political Report and Rothenberg Political Report. We’re looking at the same sort of information they are, and they have strong track records, so it’s natural there should be similarities.
One point of difference is that we’re much more pessimistic about the Democrats’ chances in West Virginia, South Dakota and Montana. These races have a lot in common, taking place in three red states where longtime Democratic incumbents have retired.
We’re bullish on Republican chances in these states for simple reasons. First, they’re red states. Second, we think the national political environment modestly favors Republicans. Third, we think the Republicans are poised to nominate equal or superior candidates in each state. Fourth, our research suggests there is little or no carry-over effect from incumbency once the incumbent himself retires. In West Virginia, for instance, the retirement of Democrat Jay Rockefeller provides little information about how the race will turn out in November.
We give Republicans a 90 percent chance of winning West Virginia, in fact. The state’s politics are a little more complicated than might be apparent from presidential voting — Obama is extraordinarily unpopular there, but a slim majority of the state’s voters are still registered as Democrats, and Democrats hold the governorship and both branches of the state legislature. But Republicans are poised to nominate an excellent candidate in Rep. Shelley Moore Capito, and she has held leads of 6 to 17 percentage points in polls against the likely Democratic nominee, Secretary of State Natalie Tennant.
We also give Republicans a 90 percent chance of winning South Dakota. It’s a more straightforward case, except that the presumptive Republican nominee, Gov. Mike Rounds, has been caught up in a controversy over the state’s participation in the EB-5 immigration visa program. To have much of a chance, Democrats will either need Rounds to lose the Republican primary or be significantly damaged by it.
Montana is slightly different in that Democrats technically do have an incumbent, John E. Walsh, running for re-election there. However, Walsh was appointed, not elected (he replaced Max Baucus in February when Baucus was named United States Ambassador to China). Appointed senators have a poor historical track record; from a predictive standpoint, it’s best to think of their races as open seats, rather than incumbent defenses. Walsh trails the likely Republican nominee, Rep. Steve Daines, by double digits in polling so far. The race is likely to tighten; Montana is somewhere between a purple state and a red one, and Walsh, who was elected as Montana’s lieutenant governor in 2012, is a credible candidate. Still, we give Republicans an 80 percent chance of flipping it.
The final race in this category is Arkansas, where Democrats have a true incumbent, Sen. Mark Pryor, running. Pryor was once so popular that he won without Republican opposition in 2008. But Arkansas has become redder and redder, and Democratic Sen. Blanche Lincoln’s 21-point loss to Republican John Boozman in 2010 demonstrates that past popularity is no guarantee of future success for a Democrat there. Furthermore, Republicans have a strong candidate in Rep. Tom Cotton, who is ahead by an average of about five points in recent polls. Pryor will be able to fight for his seat — he had $4.2 million in cash on hand as of Dec. 31, compared to $2.2 million for Cotton. The polling has returned inconsistent answers about Pryor’s approval and favorability ratings, so it’s hard to say how deep a reservoir of personal goodwill he will have to draw from. But the evidence points toward him being the underdog.
Democrat-held seats that are toss-ups (4): Louisiana, North Carolina, Alaska, Michigan
For Republicans, the path of least resistance to a Senate majority is winning West Virginia, South Dakota, Montana and Arkansas, and then two of the four states in this category.
Louisiana, where the Democratic incumbent Mary Landrieu is running, may be the easiest opportunity. Landrieu’s fundamentals are similar in most respects to Pryor’s: Her fundraising has been fine, but otherwise she’s running against the tide in what has become a very red state, and her moderate overall voting record may be undermined by her role in passing the Affordable Care Act in 2010. The difference is that Landrieu’s most likely opponent, Rep. Bill Cassidy, has yet to pull ahead in the polls, which instead show a race that’s roughly tied.
In North Carolina, Democrat Kay Hagan is an example of a candidate who could go in and out with the political tides. She was elected in 2008 over Elizabeth Dole as the Obama campaign turned out African Americans and college students throughout the state. But those are precisely the voters who don’t always show up for midterms. Still, Hagan could get a reprieve depending on Republicans’ choice of nominee. Republicans have eight declared candidates for their May 6 primary who range from Thom Tills, the speaker of the state House, to a variety of activists and political amateurs.
Alaska might be the hardest race to forecast. The polling there is often erratic. The state has voted Republican for president every year since 1968, but its independent streak sometimes translates differently in other races. The Democratic incumbent, Mark Begich, might face an establishment candidate in Daniel S. Sullivan, the former attorney general, or Mead Treadwell, the lieutenant governor — or he could face Joe Miller, the former judge and tea party activist who is unpopular beyond the Republican base.
The race in Michigan differs from the others in this group: It’s somewhere between purple and blue instead of red, and there’s no incumbent, as Democratic Sen. Carl Levin is retiring. But Republicans will have an excellent candidate in Terri Lynn Land, the former secretary of state. She comes from the old guard of moderate Michigan Republicans, instead of the tea party wing that might have preferred a candidate like Rep. Justin Amash. The likely Democratic nominee, Rep. Gary Peters, should win his primary without serious opposition, and he’s kept pace with Land in fundraising. But we take the polls that show the race as a toss-up at face value. The question is whether Michigan’s modest blue lean is enough to overcome a modestly Republican-leaning national climate.
Democrat-held seats that lean Democratic but with a plausible GOP pick-up (3): Colorado, Iowa, New Hampshire
Republicans have some backup options if they fail to win states such as North Carolina and Michigan.
The best one is Colorado. The GOP got the candidate of its choice in Rep. Cory Gardner, who declared for the race last month. That will prevent them from again nominating Ken Buck, the tea party candidate who lost a winnable race in 2010. (Buck has withdrawn from this year’s Senate race and decided to run for the U.S. House instead.) By our measures, Gardner is a decent candidate rather than a great one. He’ll start at a fundraising deficit to the Democratic incumbent, Mark Udall, who had $4.7 million in cash on hand as of Dec. 31, and he comes from a conservative district and has amassed a conservative voting record that may or may not translate well in the Denver suburbs. But Udall’s approval ratings only break even, and we give Republicans a 40 percent chance of winning his seat.
The other big recruiting news is in New Hampshire, where Scott Brown, the former Massachusetts senator, has announced he’ll seek the Republican nomination. But as Harry Enten noted, Brown isn’t terribly popular in New Hampshire, which has long had a love-hate relationship with Massachusetts. Just as important, Jeanne Shaheen, the Democratic incumbent, has enjoyed approval ratings that would be good enough to get her re-elected. The political winds in New Hampshire can shift quickly, which is why we’re not ruling out a Republican win. But we don’t think Brown improves the GOP’s chances much as compared with another credible candidate.
Iowa is also a political bellwether. Sen. Tom Harkin, the Democrat, is retiring, which might seem to give Republicans even or better odds in a Republican-leaning national environment. But Democrats have a substantial edge in candidate quality. Rep. Bruce Braley, the presumptive nominee, has a fairly moderate voting record and $2.6 million in cash on hand. Meanwhile, Republicans have yet to coalesce around one of several inexperienced candidates. Perhaps like the one in New Hampshire, therefore, this race could swing Republican if the Democrats’ national position deteriorates further; Braley would hold the seat for them in an election held today.
Democrat-held seats likely or almost certain to be retained by Democrats (10): Minnesota, Oregon, New Jersey, Virginia, Hawaii (special election), Massachusetts, Illinois, New Mexico, Delaware, Rhode Island
Minnesota might seem vulnerable for Democrats. Sen. Al Franken won his seat only after a months-long recount in 2008, and he’s amassed the liberal voting record you’d expect of him. But Franken’s approval ratings are pretty good and he raises plenty of money from liberals around the country. So far, he has deterred a credible Republican challenger from entering the race.
In Oregon, Democratic incumbent Jeff Merkley has middling approval ratings. But the state has become quite blue, and the Republican roster there is weak; in 2010, the GOP nominated inexperienced candidates in both the Senate and gubernatorial races. It doesn’t look like they’ll nominate a strong candidate this year, either. Their chances of victory depend on the electoral climate becoming catastrophic for Democrats.
The other eight races on this list are likely to hold for Democrats even in worst-case scenarios. Republicans have sometimes talked up their opportunity in Virginia, where the former chairman of the Republican National Committee, Ed Gillespie, is running. Ordinarily, we’d snark about party hacks overrating the chances of one of their brethren winning office, but Virginia just elected Terry McAuliffe as its governor. However, Democratic incumbent Mark Warner maintains high approval ratings, and he’d likely hold the seat even against a strong opponent.
Republican-held seats that lean Republican but where Democratic pick-up is possible (2): Georgia, Kentucky
Republican paths to take over the Senate are complicated slightly by their need to defend two seats of their own.
The higher-profile problem is in Kentucky, where Sen. Mitch McConnell, the Republican minority leader, has poor approval ratings, and Democrats will nominate a charismatic candidate in Alison Lundergan Grimes, the secretary of state.4 Grimes has run about even with McConnell in polls since she declared her candidacy in July. But McConnell will have all the financial resources he could want — he had $10.9 million as of Dec. 31 — along with Obama’s unpopularity in Kentucky to undermine Grimes. His path to survival could resemble that of the Democratic leader, Harry Reid, who prevailed in Nevada in 2010 with similarly poor approval ratings after a brutal campaign. We give McConnell a 75 percent chance of holding the seat. I’ll concede that I’m curious to see what our algorithmic forecasts do with this race once they’re up and running.
Georgia might be the slightly better opportunity for Democrats. The Republican primary, to be held May 20, has been a mess in the polling, with any of five different GOP candidates near the top of the race depending on the survey. Their prospects range from Secretary of State Karen Handel, who might be the strongest general-election nominee, to Reps. Phil Gingrey and Paul Broun, who have amassed conservative enough voting records that they might turn off swing voters even in red Georgia. Democrats are almost certain to nominate Michelle Nunn, the daughter of former U.S. Sen. Sam Nunn, who has run even with or slightly ahead of the Republicans in scant polling so far. Ordinarily, we are skeptical of candidates who lack previous experience in elected office, but those from famous political families don’t have the same name-recognition deficit to overcome and can sometimes tap into their families’ networks to raise funds and staff their campaigns.
Republican-held seats likely or almost certain to be retained by Republicans (13): Maine, Mississippi, South Carolina (regular election), Nebraska, South Carolina (special election), Texas, Tennessee, Oklahoma (special election), Kansas, Oklahoma (regular election), Wyoming, Alabama, Idaho
Thirteen other Republican-held seats will be contested in November, but none looks like a viable opportunity for Democrats. The moonshot for Democrats might be in Mississippi, where the Republican incumbent, Thad Cochran, is vulnerable to a primary challenge and Democrats have a good prospective nominee in former Rep. Travis Childers. Still, as Harry Enten explained, it’s hard for any Democrat to get to 50 percent of the vote in Mississippi.
A wide range of outcomes
We’ve sometimes seen people take our race ratings and run Monte Carlo simulations based upon them, which assume that the outcome of each race is independent from the others. But that’s a dubious assumption, especially so far out from the election. Instead, the full-fledged version of our ratings assumes that the error in the forecasts is somewhat correlated from state to state.
In plain language: sometimes one party wins most or all of the competitive races. If we had conducted this exercise at this point in the 2006, 2008 or 2012 campaigns, that party would have been the Democrats. In 2010, it would have been the Republicans. There are still more than seven months for news events to intervene and affect the national climate.
There are 10 races that each party has at least a 25 percent chance of winning, according to our ratings. If Republicans were to win all of them, they would gain a net of 11 seats from Democrats, which would give them a 56-44 majority in the new Senate. If Democrats were to sweep, they would lose a net of just one seat and hold a 54-46 majority.
So our forecast might be thought of as a Republican gain of six seats — plus or minus five. The balance has shifted slightly toward the GOP. But it wouldn’t take much for it to revert to the Democrats, nor for this year to develop into a Republican rout along the lines of 2010.

March 21, 2014
Is Hillary Clinton Qualified to Be President? A New Poll is Easy to Misread
People sometimes have an easier time assessing the whole than the parts. Zagat reviews of restaurants show highly correlated ratings between food and service, for instance. Perhaps there is some intrinsic relationship between these qualities. But it’s not always so easy to separate the steak from the sizzle.
This “halo effect” also manifests in politics. For instance, government-issued terror alerts during George W. Bush’s first term improved not only his approval ratings, but also views of how he was handling the economy.
A Gallup poll on Hillary Clinton released Friday is triggering some of these challenges of interpretation. It asked an open-ended question about what Americans would regard as the best and worst qualities of a Clinton presidency. The top negative, mentioned by 6 percent of respondents, was that Clinton was not qualified to be president or wasn’t likely to succeed on the job.
This poll could easily be misread. Clinton’s qualifications were her most oft-mentioned negative — but they were cited by just 6 percent of respondents. Nor, however, should the results be taken to imply that 94 percent of respondents see Clinton as qualified. Many of the respondents who described other negatives about Clinton undoubtedly also think she lacks the credentials for the job. (Gallup recorded only one reply per person.)
A better way to test voters’ opinions on Clinton’s qualifications is to ask them directly. YouGov did that in a poll released last month. In that survey, 49 percent of respondents said Clinton had the qualifications to be president while 38 percent said she did not.
Those ratings might seem low when Clinton is compared to the two most recent presidents. She spent 12 years in national or executive office, counting her tenure as U.S. senator and secretary of state but not her years as first lady. Barack Obama, by contrast, had spent just four years as a U.S. senator at the time of his election, while George W. Bush had spent six years as governor of Texas.
I can imagine some of our Democratic readers bristling at my implication that Bush was qualified to be president, and some of our Republican readers doing the same for Obama. Maybe if Obama had had actual responsibilities instead of being a community organizer, he would have been better at the job, the Republicans might say. Maybe if Bush hadn’t leveraged his family name to get into the governor’s mansion, he would have been more suited for the Oval Office, the Democrats might say.
But that’s just the problem with taking this sort of polling result too literally. The question on Clinton’s qualifications tends to reflect overall assessments of her personal qualities and performance in office — more than it does the narrower issue of her credentials.
Consider the results of two other questions that YouGov asked about Clinton. Did voters approve or disapprove of her performance as secretary of state? And do they have a favorable or unfavorable impression of her?

The results were almost identical to the question about Clinton’s qualifications. For instance, 25 percent of Republicans said they regarded Clinton as qualified for office, while 21 percent said they approved of her performance as secretary of state and 20 percent said they took a favorable view of her.
Most of these Republicans are not worried that Clinton would make an unqualified president so much as they don’t want her to become president in the first place.

Duke’s Lehigh Loss Was Bad, But Mercer Was Worser
Some upsets aren’t as big as the seed lines suggest; some are bigger. Two years ago, the No. 2-seeded Duke Blue Devils were upset by No. 15 Lehigh in the first round of the NCAA tournament. But Duke was the weakest No. 2 seed in 2012, according to the FiveThirtyEight projections that year, whereas Lehigh was unusually strong for a No. 15. Our model had given Lehigh a 10 percent chance of winning.
Something of the same pattern held last season when No. 2 Georgetown lost to No. 15 Florida Gulf Coast in the first round. Georgetown was just the 15th-best team in the country, according to our ratings, and was badly overseeded as a No. 2. Our model gave that upset a 10 percent chance of occurring as well.
This afternoon, as a No. 3 seed, Duke lost to 14th-seeded Mercer — but the Blue Devils (and the FiveThirtyEight model) have fewer excuses. In fact, Duke was the strongest No. 3 by some margin this year, according to our ratings and other indices like Ken Pomeroy’s power ratings. Our projections had Mercer with just a 7 percent chance of winning before the game began.

Florida’s Odds Are Dropping
Which NCAA team had the worst day on Thursday? The obvious answer might be Ohio State, Cincinnati or Oklahoma, all of which succumbed to lower-ranked teams in the basketball tournament’s round of 64. Or perhaps North Carolina State, which squandered a 16-point lead against Saint Louis and lost in overtime.
But none of those teams had much chance of winning the championship. Meanwhile, Florida, a tournament favorite, ended Thursday in a worse position than it started, despite winning its opening game against Albany. (Of course, Ohio State would still probably trade places with the Gators.)
In the latest FiveThirtyEight forecast, updated with game results and injury information as of early Friday morning, Florida’s probability of winning the tournament is 11 percent. Twenty-four hours ago, it was 14.5 percent.
How did the Gators’ odds get worse? There are three contributing factors:
A closer-than-expected game against Albany. Florida defeated No. 16 seed Albany by 12 points, a final score that conceals a game that was competitive until late in the second half. But the Gators were favored by 22 to 23 points according to Las Vegas sportsbooks and power ratings. Our research suggests that performance relative to power ratings and point spreads early in the tournament has a fair amount of say in predicting how a team fares later on. Florida’s performance was forgivable, and the team remains the favorite in the South region, but the Gators will need to be sharper as the competition improves.A tough third-round matchup. Pittsburgh, despite a No. 9 seed, was a reasonably clear favorite against No. 8-seeded Colorado on Thursday, according to our model. And the Panthers dominated the Buffaloes, pulling ahead 46-18 by halftime and eventually winning by 29 points. Computer systems like Ken Pomeroy’s regard Pittsburgh as having the strength of a typical No. 4 or No. 5 seed. This could be a challenging matchup for Florida. The Gators played a tough out-of-conference schedule, but they’ve faced just two ranked teams since Jan. 1 in a weak basketball year for the SEC.Threats in the regional finals. The South may not be as loaded as the East or the Midwest. But the No. 3-seeded team, Syracuse, turned in an excellent performance in its win against Western Michigan. The Gators will likely have to defeat either the Orange or No. 2-seeded Kansas to reach the Final Four. Meanwhile, Kansas coach Bill Self sounds increasingly confident that injured center Joel Embiid will be able to return at some point in the tournament, even as he confirmed that Embiid is likely out for the opening weekend.
Nate Silver's Blog

- Nate Silver's profile
- 729 followers

