
Nate Silver's Blog, page 169
July 1, 2014
Tim Howard Lost, But He Just Had the Best Match of the World Cup
After losing 2-1 to Belgium on Tuesday, the U.S. men’s national team will be left to contemplate its future; after years of steady improvement, there are hints U.S. men’s soccer has hit a plateau. But one American left the tournament with a strong argument for his international quality: Goalkeeper Tim Howard.
Howard was FIFA’s Man of the Match despite conceding Belgium’s two goals — both in extra time. The award is deserved. In fact, Howard’s game probably was the best by a goalkeeper in the World Cup to date.
So far in the tournament, there have been three saves for every goal conceded (excluding penalties and own goals). If we account for shots in the same way that the National Hockey League does — a shot must result in either a goal or a save by the goalie, while shots stopped by another defensive player are considered “blocked shots” instead — this implies that every shot has a 25 percent chance of scoring. (In practice, soccer statisticians usually consider blocked shots to be shots on target as well, but we’ll go with the NHL’s definition as it better isolates goalkeeper performance.)
Howard faced 18 shots from Belgium by this definition. If 25 percent of shots score on average, that implies Belgium would typically score 4.5 goals on this shooting volume. Instead, Howard conceded two goals. That means he saved a net of 2.5 goals for the United States.
 That +2.5 score — which we’ll call Howard’s “net goals saved” — was the best single-game performance in Brazil so far. The second-best belongs to Ecuador’s Alexander Dominguez, who made nine saves and allowed no goals against France for +2.25 net goals saved. That’s pretty good but slightly behind Howard’s total; Howard’s seven extra saves slightly outweighed the two goals he let in.
The worst single-game performance belongs to Jung Sung-ryong of South Korea, who allowed four goals and made just one save in a poor performance against Algeria — a net goals saved score of -2.75. Spain’s Iker Casillas was nearly as bad in conceding five goals against the Netherlands, but he at least made five saves to go with them.
Howard has not quite had the best overall tournament, however, because his net goals saved was exactly average (+0.00) entering the Belgian match. Instead, that honor goes to Colombia’s David Ospina, who has made 18 saves and allowed just two goals in four games so far, for a net goals saved of +3.00.


A Chart For Predicting Penalty-Shootout Odds in Real Time
If you’ve come here during a penalty shootout, scroll down for some cool charts. The next several paragraphs explain our methodology in some detail.
FiveThirtyEight has some credibility staked on the performance of the Brazilian national team. It was our pretournament favorite to win the World Cup. (Many other forecasts had Brazil favored, but not as heavily as we did.) So, like the 23 Brazilians on the pitch and the 200 million watching at home, we were sweating the outcome when Brazil went to a penalty shootout with Chile on Saturday.
We were curious about the Brazilians’ chances of winning at various points in the shootout. How safe were they after Brazil’s David Luiz made his first penalty and Chile’s Mauricio Pinilla missed his? How close did things get after the shootout was tied at 2-2, and how bad would it have been if Neymar had then missed for Brazil?
What follows is a series of charts to provide some reasonable estimates of these probabilities. We’ll start with the case in which both teams are assumed to be equally likely to convert penalty kicks, and then explore alternatives where one team (perhaps like Brazil against Chile) might be thought to have a marginal edge.
There’s a cottage industry around predicting the outcome of penalty kicks. Some theories are worth exploring. There’s some evidence, for example, that whichever team shoots first has a slight advantage. Others are probably more dubious and may rely on overinterpreting evidence from small sample sizes (see Phil Birnbaum’s cautionary note for more on this).
Our goal is not to litigate those theories. Instead, we make some simple assumptions: that the outcome of one penalty kick is independent from the next one, and that a team’s chances of making a penalty is consistent with long-run averages.
In the history of the World Cup, teams have made 71.5 percent of their penalty-shootout kicks. But the sample size is not huge, and the percentage has been slightly higher — closer to 75 percent — in other major international tournaments like the European Championships. So we fudge just a pinch upward and assume that the long-run rate of made penalties in the World Cup is 72.5 percent.
It’s important to clarify that this percentage pertains to penalty kicks attempted during shootouts. The success rate is higher — in the range of 75 to 80 percent — for penalties attempted after a foul is called in the box in regulation play. But those cases are a little different. A team will usually designate its best penalty taker to make the one attempt instead of having to rotate through at least five players as in a shootout. (If Neymar or Lionel Messi got to make every attempt, the success rate in shootouts would rise.) Furthermore, the rebound is live in penalties attempted during regulation play; rebounds are not live during a shootout. (Even if goals scored on the rebound are not counted as penalty-kick conversions, the possibility of a rebound may affect the strategy of the kick taker and the goalkeeper.) Finally, players may be under more pressure during a shootout, and they’ll have the opportunity to alter their behavior after observing their teammates’ kicks.
So to repeat: Our initial assumption is simply that each penalty kick has a 72.5 percent chance of being made. From there, calculating the probability of a team winning the shootout is fairly straightforward given any condition of the game (for instance, a team being ahead 2-1 after each team has attempted three penalties). The technique we’re applying is technically known as a Markov chain, but that makes it sound more elaborate than it is.
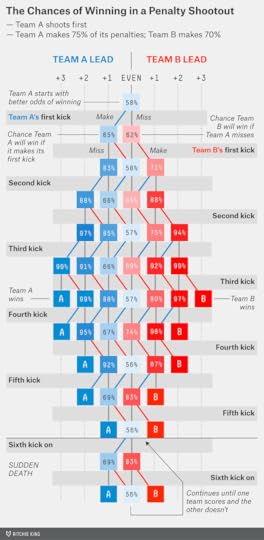
Time for the first chart. This assumes two-evenly matched teams, which we’ll call Team A and Team B. Team A shoots first.
You can follow the action by moving down one row after every penalty-kick attempt. Whenever Team A makes a penalty, move down and to the left. Whenever Team B does, move down and to the right. When there’s a miss, move straight down (don’t alter your horizontal direction). A cell tinged in blue means that Team A is favored to win the shootout, and one tinged in red means that Team B is favored instead.

As an example, we’ll take the shootout in the 1994 World Cup final between Italy (the Azzurri shot first, so they are Team A, in blue) and Brazil (Team B, in red). The teams were about evenly matched, so we’ll assume that the probability was 50-50 going in. Here’s what happened next:
Italy’s first kick. An errant attempt by Franco Baresi, which sails over the crossbar. Move due south on the chart. Brazil — Team B, in red — is now a 70 percent favorite.Brazil’s first kick. But Brazil’s Márcio Santos misses, too! Terrific anticipation by Italian goalkeeper Gianluca Pagliuca. Move straight down again: we’re back to 50-50.Italy’s second kick. Italy’s Demetrio Albertini makes his penalty. Move down and to the left. Italy, up 1-0, is a 58 percent favorite.Brazil’s second kick. Romário notches a kick off the left crossbar. Move down and right. We’re tied 1-1, and the probabilities are at 50-50 again.Italy’s third kick. Brazil goalkeeper Claudio Taffarel guesses the right direction — but is much too late to stop Italy’s Alberigo Evani. Move down and to the left. Italy is ahead 2-1 and has a 59 percent chance of winning.Brazil’s third kick. Brazil’s Branco equalizes. Down and to the right. Back to 50-50.Italy’s fourth kick. This was the pivotal penalty — it affected the odds more than any other kick (including Roberto Baggio’s infamous miss later on). Taffarel anticipates Daniele Massaro’s kick and makes one of the easier-looking saves you’ll see in a shootout. Move straight down. Although the score is tied 2-2, Brazil has an attempt in hand and is a 79 percent favorite to win.Brazil’s fourth kick. Dunga’s penalty is low and to the middle — and by Baresi. Brazil up 3-2. Look down and right on the chart: The team’s now 90 percent to win the shootout.Italy’s fifth kick. Italian star Baggio gets far too much on his attempt and it goes well over the crossbar. The Brazilian reserves rush the pitch to celebrate their World Cup championship. Presumably, you’re either celebrating too or throwing things at the television screen — either way, hope you saved that bottle of grappa. But, if you insist, move straight down the chart. You’ll encounter a solid block B — in this case, representing Brazil. This is an end condition: The penalty shootout is over, and Brazil has won.Here’s the chart with the Italy-Brazil results filled in:

Sometimes the shootout can persist for more than five kicks per team. For example, one shootout in the 2006 Africa Cup of Nations featured 23 consecutive made penalties before Cameroon’s Samuel Eto’o finally missed to hand Ivory Coast advancement. When this occurs, follow the loop in the chart. The situation when teams are tied after five kicks is mathematically identical to the one when they’re tied after six kicks, 12 kicks, 20 kicks or any other number.
On other occasions, there may be reason to think that one team starts the shootout with an advantage. Maybe it has a better goalkeeper, or its opponent is England, or you buy the theory that the team that shoots first has an edge. There’s also some evidence that the better team based on overall measures of team quality (such as Elo ratings or the Soccer Power Index) may have some minor advantage in the shootout. Shootouts are mostly random but not entirely so.
Take the case in which Team A shoots first and is the better penalty-shooting team, converting 75 percent of its penalty kicks — while Team B makes 70 percent. Team A will win the shootout about 58 percent of the time. This resembles the shootout between Brazil and Chile on Saturday: Live betting odds, before the first penalty was attempted, put Brazil’s chance of winning in the range of 55 to 60 percent. Here is the chart for that occasion:
We won’t give you a complete walkthrough, but Brazil’s odds rose to 83 percent after Luiz’s make and Pinilla’s miss — and then further, to 91 percent, after Marcelo put Brazil ahead 2-0. But consecutive makes by Chile and a miss by Hulk brought Brazil’s odds down to 56 percent. Neymar made Brazil’s fifth penalty, and the team’s odds recovered to 69 percent — and Brazil won when Chile’s Gonzalo Jara hit the post. Had Neymar missed instead, Chile would have been the 83 percent favorite.
Finally, here’s the case where the side that shoots second — Team B — has a slight edge and makes 75 percent of its penalties to Team A’s 70 percent.

Note that Team B’s advantage amounts to the equivalent of about half a kick. If Team A makes its first penalty, and Team B still has an attempt in hand, the odds go to about 50-50. But if Team A misses, Team B’s odds rise to 77 percent despite not having yet made an attempt.

Has the U.S. Men’s National Team Plateaued?
For the United States, almost every recent World Cup match has been billed as the most important game in the history of the men’s national team. Its knockout-stage match against Belgium on Tuesday isn’t receiving quite as much hype.1 But a win would advance the U.S. to the World Cup quarterfinals for a Saturday afternoon match against Argentina or Switzerland. That would probably be the most-watched game in U.S. soccer history — the first World Cup quarterfinal that many American fans would ever see their men play live.2
It’s tempting to say that these matches are the soccer equivalent of political “game changers” — much-ballyhooed events that seem exciting at the time but which rarely have as much lasting impact as the pundits claim. But it’s not unreasonable to feel as though every World Cup game is more important than the last. It’s a consequence of the long-term state of U.S. soccer.
On the one hand, expectations are getting higher. The U.S. advanced from the group stage in 1994, 2002, 2010 and now 2014. Matches against England or Portugal or Germany are now thought of as opportunities rather than sure losses. On the other hand, the men’s national team has never quite had its breakthrough moment.
When might the bar be raised? When might U.S. fans view a Round of 16 exit as a travesty and not a triumph?
If you’re in your mid-30s, like me, the advance of the U.S. men’s national team might seem as inevitable as that of gay marriage. You’ll be just old enough to remember that the U.S. was once a soccer backwater. But you might not remember how long it took the Americans to get where they are today. The trajectory since the 1980s has always been upward:

This chart shows the Elo rating for the U.S. in each World Cup year3 since 1986 — the last World Cup where the Americans failed to qualify, and the last one before 1988, when FIFA declared the 1994 World Cup would be played in the U.S.
From this perspective, the upward trend has been extremely steady. In fact, other than the 2002 team arriving in the quarterfinals a little ahead of schedule, it’s been almost perfectly linear. Since 1986, the U.S.’s Elo rating has improved by almost exactly 50 points every four years.
Imagine that the trend continues. Right now, the U.S. team’s Elo rating is nearly 1,850, which places it 15th in the world. Add another 50 points, and by 2018 it would be at 1,900 — somewhere around eighth or 10th in the world and near where Belgium and Uruguay and France are today. That’s a team that could be a dark-horse World Cup contender. By 2026, its Elo rating would be 2,000 — not far from where Argentina, Germany and the Netherlands began this year’s tournament. So in just 12 more years — in a World Cup that could possibly be held in the United States — the U.S. will be a global soccer powerhouse.
Or perhaps not. Consider another look at the evidence, one where we run the numbers back further. For much of the 1970s, there was a lot of hope surrounding the growth of U.S. soccer, but the men’s national team repeatedly failed to qualify for the World Cup. In one year, the U.S. failed to win a single qualifying match. But let’s go back ever further, to 1950. This tells a different story. The men’s national team got worse from 1950 to 1958, bottomed out for almost 30 years with no sign of life, improved rather sharply in a concentrated period from 1986 through 2002, and has been fairly steady since.

Yes, the U.S. has still gotten better by this reckoning — but it looks more like a case of punctuated equilibrium — a sudden change after years of stasis.4

This view suggests the U.S. may have reached a new plateau. The performance of the 2002 team, for instance, is problematic from this vantage point. If the U.S. fails to beat Belgium on Tuesday, that means it will have gone three World Cups without equaling (much less improving upon) the 2002 team’s performance. Perhaps we’re left with the global soccer equivalent of the Atlanta Hawks: a team that will usually make the “playoffs” then lose in the first round.
This might seem like a contrived reading of the evidence. But mapping the Americans’ trajectory from 1986 onward is also selective: It’s easy to make an upward pattern look more impressive by starting from what you know to be a low point.
There’s a credible story behind each theory. Under the steady-improvement theory, the story is one of demographic and cultural trends abetted by some measure of self-perpetuating success (a positive feedback loop). Soccer has been a big youth-participation sport since the 1970s, but immigration from Latin America may be giving the U.S. even more young athletes who are interested in soccer. The occasional successes of the U.S. men’s national team, along with an increasingly popular domestic league (and improved television visibility for the English Premier League and Liga MX) may motivate some of these young athletes to play soccer professionally instead of transitioning into baseball, football or another sport.
The punctuated-equilibrium theory suggests that the U.S. was badly underachieving its soccer potential for many years. Then it got its act together when it was chosen to host a World Cup: better facilities, more investment in the national team, a sustainable domestic league and so forth. But it was picking low-hanging fruit. It shouldn’t be that difficult for a super-wealthy country like the United States, which excels at so many other sports, to be half-decent at soccer if it tries.
What’s more challenging is going from a country that sometimes makes the knockout phase to one that sometimes makes the World Cup semifinals — or beyond. It’s not clear that the U.S.’s wealth, or its athletic prowess, implies that it ought to be much more successful at soccer than it has been in recent years. For instance, we can compare each country’s GDP (taken as a natural logarithm) against its soccer team’s Elo rating as of June. There’s certainly some relationship, but it’s rough (soccer is a comparatively inexpensive sport). The trendline in the chart implies that a best guess for the United States is an Elo rating somewhere in mid-1,800s, almost exactly where it is today.

The same story holds if we compare the number of medals each country has won at the Summer Olympics since 2000 (again taken as a natural logarithm5) against its soccer team’s Elo rating.

There’s a high margin of error on these estimates. China’s GDP (and its Olympic medal count) is just a little less than the United States’ — but its soccer team has qualified for only one World Cup and has gotten worse in recent years. Germany also has a big economy and a big medal count — and its soccer team is great. The point is that the U.S. men’s national team is no longer underachieving reasonable expectations, as it was before the 1990s. Nor is it exceeding them. Perhaps what we’ve seen is about what we’re due to get in a populous, wealthy, athletic country — where interest in soccer is average, at best, by global standards.
The success of the U.S. women’s national soccer team stands in contrast to that of the men’s. But soccer players are among the highest-profile female athletes in the U.S., suggesting that part of the problem for the men’s side is competition from other sports.
The punctuated-equilibrium theory would imply that it may take some time for the U.S. men’s team to reach the next plateau. Perhaps an external catalyst would help: another American World Cup, a run to the World Cup semifinals, the emergence of an American soccer player who is recognized as among the best in the world. (Personally, I’d hope for him to be as brash as Cristiano Ronaldo, the better to spark headlines and stoke rivalries with other countries.) But it could be a long while before any of those things happen, and there could be some further delay before their feedback effects kick in.
Or it could be that the steady-improvement theory is right. It also reflects a reasonable interpretation of the evidence. The data on youth interest in soccer is very encouraging, for instance.
Tuesday’s game against Belgium will provide us with one data point — but just one. Unlike in the past, however, we might not need to wait four years for the next one. Instead, in 2016, the United States will host the Copa América Centenario, a special one-off tournament that will feature the best teams from both North and South America. It could serve as a preview of our soccer future. Playing at home produces the equivalent of an 100 Elo-point bonus — equal to eight years of improvement for the U.S. based on its 1986 to 2014 trajectory. If the U.S. will be ready to compete with the Colombias and Argentinas and Brazils of the world on neutral turf by 2022 and 2026, it should be able to do so on home soil in 2016.
CORRECTION (July 1, 4:54 p.m.): A chart in an earlier version of this post mislabeled the Elo ratings vs. Olympic medal counts for China and Russia. The chart has been updated.

June 28, 2014
Updated Elo Ratings For World Cup Teams
Although we’re loyal to the Soccer Power Index (SPI), the system we use to produce FiveThirtyEight’s World Cup projections, we’re also big fans of the World Football Elo Ratings.
Unfortunately, the Elo ratings website has not been updated since the World Cup began. So we followed their instructions for calculating their ratings and ran the numbers ourselves:

Brazil, as before, ranks as the world’s best team per Elo. But the Netherlands has made huge gains and now ranks No. 2, just ahead of Germany. Spain’s rating has fallen the most, 116 points, taking the team from second to sixth.
Elo and SPI are highly correlated and they’ve fared well against other methods of predicting World Cup results so far, including betting lines.

June 27, 2014
Extra Time Isn’t a Crapshoot in the Knockout Round, But Penalties Are
If you’re one of those people who thinks there are too many ties in soccer, it’s now safe to tune into the World Cup. The knockout stage begins Saturday, and with it the guarantee that a team is going to win each game. If matches are tied at the end of regulation, there will be 30 minutes of extra time. If they’re tied after that, penalty kicks will decide the games.
These knockout matches require different treatment from the Soccer Power Index (SPI) match predictor, which we’re using to power the FiveThirtyEight World Cup forecasts. The match predictor is calibrated based on the results of competitive international matches since late 2006. (We define a competitive match as any game that isn’t a friendly, and one where both teams were ranked in the SPI top 100 before the match.) The vast majority of these matches are ones that end in a draw rather than go into extra time. So the match predictor calculates the probability of a draw, along with a win or a loss, for each team.
But draws are no longer possible in the knockout round. The match predictor needs some way to resolve the proportion of games that it originally had going to a tie. Previously, SPI made a very conservative assumption and split those games 50-50 between the two teams. This is equivalent to saying that the results in extra time are totally random.
In this case, however, the conservative assumption probably isn’t the best one. In conjunction with ESPN Stats & Info, I gathered a list of extra-time matches since 2005 (after FIFA discontinued use of the “sudden-death” Golden Goal and Silver Goal rules) in the most important competitions: the knockout stages of the World Cup, the Confederations Cup and continental championships. We identified 54 such matches. Then we looked to see how often the favorite won. (To determine the favorite, we used Elo ratings rather than SPI ratings, because the Elo sample goes back further; however, SPI ratings are very highly correlated with Elo ratings and it’s reasonably easy to translate from one system to the other.
The pre-match favorite won 33 of the 54 matches — 61 percent — either after extra time or on penalties.

The sample size isn’t huge, but it’s unlikely that these results are a statistical fluke. If extra-time games were truly random, there’d only be about a 7 percent chance that the pre-match favorite would just happen to win 33 or more times in 54 attempts. Just as important, there are sound logical reasons to assume that the pre-match favorite is slightly more likely to prevail in extra time. If Germany somehow managed to draw with Burkina Faso after 90 minutes, you’d be wise to take Germany’s side of the bet if the teams were given another 30 minutes to play.
Most of the favorite’s edge, in fact, comes from its opportunity to play another 30 minutes of regular football. Of those games that were won before penalties — such as the 2010 World Cup final between Spain and the Netherlands, where Spain scored a goal in the 116th minute and held the lead to avoid having to go to penalties — the favorite won 68 percent of the time. But the favorite won just 57 percent of the games that were decided on penalties.
Of course, some matches feature much heavier favorites than others. So we ran a logistic regression model to estimate the favorite’s win probability based on the difference in the team’s Elo ratings. Those results are reflected by the red line in the chart below.

In a knockout-stage game featuring teams with a 100-point Elo-rating difference — for instance, Italy and Ivory Coast based on their pre-World Cup Elo ratings — the favorite (in this case, Italy) starts out with a 64 percent chance of winning. If the game is tied at the end of regulation play, the favorite’s chance of winning (either after extra time or on penalties) is reduced to 56 percent. Its edge is even smaller if extra time is drawn and the only way to win is on penalties — it has just a 53 percent chance of prevailing at that point, we estimate.
Where the difference between the teams is larger, the favorite maintains more of an edge. Argentina and Algeria, for example, have about a 350-point Elo-rating difference. Argentina would have a 71 percent chance of winning such a game after it went to extra time. However, its edge would be quite small — it would only be about a 60-40 favorite — if the game went to penalties.
Matchups as lopsided as Argentina-Algeria rarely occur in the knockout stages of the World Cup, however — and where they do, the favorite is highly likely to win during regulation play anyway. So this adjustment doesn’t make all that much practical difference. Calibrated based on SPI rather than Elo ratings, we have Argentina as an 85.8 percent favorite under our new method, rather than 82.4 percent under our previous system that treated all extra-time games as random. And in the match between Belgium and the United States, Belgium is now a 58.4 percent favorite instead of 57.3 percent. The main effect is on Brazil, which has gone from having a 36 percent chance of winning the tournament to a 41 percent chance. Still, even the Brazilians sometimes lose on penalties, like to Paraguay in 2011.

Drafting Sophomores Is a Smart Strategy For NBA Teams
When Jared Sullinger, the nation’s No. 2 high-school recruit, finished his freshman year playing center at Ohio State in 2011, he was forecast to be drafted into the NBA in the top three. But when he declared that he was going back to school for his sophomore season, his draft stock plummeted, bottoming out at the 20th pick the next year, according to one mock draft. This was despite a season in which Sullinger won his second consensus All-American award and led Ohio State to the Final Four. Eventually, he went No. 21 to the Celtics — a bargain considering he’s outperformed most of the players who went in the lottery that year.
The Celtics have had success with sophomores. Their best player, Rajon Rondo, entered the draft after his sophomore year at Kentucky,1 and they were the first team to take a sophomore in Thursday’s NBA draft, choosing Marcus Smart of Oklahoma State with the sixth pick. But the Celtics are atypical. The draft’s top four picks, Andrew Wiggins, Jabari Parker, Joel Embiid and Aaron Gordon, left college after their freshman year. Two freshmen whom the Celtics bypassed, Julius Randle and Noah Vonleh, went No. 7 and No. 9.
Drafting freshmen has become the new normal in the NBA. Since 2006, when the NBA raised its age limit to 19 years and precluded high school players from entering the draft, the roster of players chosen Nos. 1 through 5 has consisted of 23 freshmen, nine sophomores, eight juniors, four international players and just one college senior.2 (By contrast, just four of the 40 top-five picks from 1998 through 2005 were freshmen.3)
From the players’ point of view, the trend is easy to explain. Elite basketball prospects aren’t typical college students: They’re sacrificing millions of dollars every year they stay in school. Since 2006, 32 of the top 40 high school recruits4 — 80 percent — played one year in college and then declared for the NBA draft. Only 20 percent played through their sophomore year or beyond.
The percentage of top recruits to play at least two years in college has decreased since the NBA instituted its age limit. Between 1998 and 2005, 35 percent of top high school recruits5 (rather than 20 percent) played through at least their sophomore year of college. True, another 45 percent did not attend college at all. But the one-and-done “compromise”6 has become the league standard. Given where players such as Sullinger and Kawhi Leonard, who slipped to No. 15 in the 2011 draft after being projected higher, were drafted, it seems like teams may hold something against players who take a second year in school.
So the Celtics’ attraction to sophomores may be no accident. They’ve been zigging while the rest of the league is zagging.
NBA teams are generally correct to assume that players who exit college as freshmen have more upside. The chart below, which is spun off from earlier data I gathered on the NBA lottery, lists the number of win shares accumulated by first-round draft picks7 during their first 10 NBA seasons. Ideally, we’d run the numbers only from 2006, when the NBA changed its eligibility requirements, onward. However, that would leave us with a small sample — and no one who’s played 10 years in the league. So instead, I’ve included all NBA drafts from 1995 through 20138 and grouped high school players and freshmen together. Juniors and seniors are also grouped together, while sophomores and international players get their own categories.

Freshmen and high school draft picks have better careers on average. Through their first 10 NBA seasons, they produce about 15 percent more win shares than sophomores, and 70 percent more than juniors and seniors.
However, they can take longer to come into their own. The average sophomore draft pick has been slightly better than the average freshman through his first five NBA seasons.9
But the slow development of a freshman can sometimes happen too late for the team that drafts him. Under the NBA’s current collective bargaining agreement (CBA), teams are guaranteed to have control of a first-round pick only through his first four or five NBA seasons. After that, a team theoretically has some option value in having the right to offer a player a max or “supermax” extension. But there are a host of problems with this: Relatively few players are worth the max, and even fewer are worth substantially more than the max. It’s hard to predict who is who. A team doesn’t get a “hometown discount”; instead it has the right to pay more than anyone else to retain a player. And even when a team identifies such a player, he’s under no obligation to sign with it.
In basketball terms, the problem with drafting a guy like Andrew Wiggins is that he might get really expensive right when he gets really good. Or he might take his talents to Los Angeles or Manhattan or South Beach. Teams should probably assume that any surplus value from a draft pick comes from his first four or five seasons and draft on that basis.
There’s a flip-side for sophomores like Marcus Smart. They might get really expensive right when they start to stink — unlike freshmen, sophomores typically begin to decline after about five seasons in the league. An incautious team might sign such a player to a massive extension when he isn’t worth one, as in the case of Rudy Gay and the Memphis Grizzlies. A rational team, however, should be able to resist that temptation — or even exploit other teams’ failure to appreciate the aging curve by trading a player like Smart right when he’s at his peak.
There’s another benefit to drafting sophomores. In addition to being slightly better than freshmen in their first few NBA seasons, they come slightly cheaper. The table below compares the win shares produced by each class of player in its first four NBA seasons10 against the value produced by other players in the same draft position (for instance, a No. 3 overall pick is compared against other No. 3 picks).11 Through their first four NBA seasons, sophomores produce about 10 percent more wins than the average players chosen in their draft slots, while freshmen produce 5 percent to 10 percent fewer wins. Because sophomores are drafted slightly later on average, they’ll also be paid slightly less under the league’s rookie salary scale.

Exploiting a 10 percent edge won’t ensure a team a title. The Celtics will need some luck to build a championship contender around Smart, Rondo and rotation players like Sullinger and Kelly Olynyk. The sophomore strategy isn’t sexy, and other players chosen on Thursday have higher upsides than Smart. But the Celtics are playing the percentages while other teams are playing the lottery.

June 26, 2014
The U.S.’s Odds of Beating Belgium And Every Other World Cup Opponent
I passed a fellow Disney cast member in the hallway just after Thursday afternoon’s first set of World Cup matches concluded. He’d missed the U.S.-Germany game.
“Did we win?” he asked.
“Yes,” I said. “I mean, no, we lost. But we advanced.” He seemed to understand.
After its loss to Germany, the U.S. finished tied for second in Group G, with one win, one loss and one draw. Portugal had the same record. But the U.S. had the better goal differential and will go on, reaching the knockout stage in consecutive World Cups for the first time in its history.
Some further good news for the U.S. is that it has a palatable draw in its Round of 16 game. If the U.S. gets very lucky and Algeria and South Korea win their games Thursday, its opponent would be Algeria. However, there is only a 3.5 percent chance of both of those outcomes. In any other case, the U.S. will face Belgium.
The U.S. will be an underdog against Belgium, but not as badly as it would be against some other opponents. If we put the remaining World Cup teams into several tiers based on their Soccer Power Index (SPI) ratings, it would look something like this:
Tier 1A: Brazil (partly because of home-country advantage)
Tier 1B: Germany, Argentina
Tier 2A: Colombia, Netherlands, France, Chile
Tier 2B: Belgium, Uruguay
Tier 3A: Switzerland, U.S., Mexico, Costa Rica, Nigeria, Russia
Tier 3B: Algeria, Greece
Tier 4: South Korea (very unlikely to advance)
Belgium is dangerous, but not as dangerous as tournament favorites Brazil, Germany and Argentina. Meanwhile, the Netherlands, France, Chile and Colombia also look more threatening than Belgium based on the things SPI looks at: pre-tournament resumes, form so far in the World Cup and, in the case of Chile and Colombia, games closer to home.
Our match-prediction algorithm gives the U.S. about a 42 percent chance of winning a knockout-stage game against Belgium based on each team’s SPI rating as of Thursday morning. (The U.S. would be 59 percent favorites against Algeria.) Here’s how those probabilities look for a knockout match between the U.S. and all remaining teams in the World Cup:

A note for soccer newbies: There are no draws in the knockout stage. If the score is tied at the end of regulation, the teams play 30 minutes of extra time. (The 30 minutes are guaranteed; there is no longer any “sudden death” or Golden Goal rule.) If the score is still tied, the game goes to a penalty shootout. (Some soccer statisticians consider games that go to penalties to be draws for record-keeping purposes — but the winner of the shootout advances all the same.)
These probabilities reflect an improvement, which we’ll be unveiling Friday morning, to the SPI match-prediction program. Previously, it had been resolving all matches that would have been draws in regulation 50-50. In other words, it was assuming that the outcome of a game that went to extra time was purely random.
We’ve done some further research, however, and this assumption turns out be somewhat too conservative. Based on the results from major tournaments since 2005, the better team does have a slight edge in extra time. It isn’t much of an advantage if the teams are at all competitive with one another: For example, if a U.S.-Belgium game went to extra time, Belgium would have a 54 percent chance of advancing either after extra time or on penalties, and the U.S. would have a 46 percent chance. But it’s worth worrying about when one team is clearly better. For instance, we estimate that Argentina would have a 65 percent chance of winning an extra-time game against the U.S.
Speaking of Argentina, it represents the biggest barrier to the U.S. making a deep run in the World Cup. The Argentines are the Americans’ most likely opponent in the quarterfinals and the U.S. has only a 20 percent chance of beating them. The U.S. will want to root for Switzerland to upset Argentina in the Round of 16 — against the Swiss, the Americans would be almost even money.
Overall, the U.S. has a 13 percent chance of winning two knockout-stage matches and advancing to the semifinals for the first time since the 1930 World Cup. Its probability of winning the World Cup is only 1.2 percent — although those odds are up from just 0.4 percent before the tournament began.

It’s Judgment Day in World Cup Groups G and H
The World Cup has been a roller-coaster for the United States, which nearly drew with Ghana before beating it and nearly won against Portugal before drawing it. But overall, the Americans’ position is improved. It has about a 76 percent chance of advancing to the knockout stage — slightly more than double its odds before the tournament began.
The U.S. will kick off against Germany at noon Eastern time in Recife, Brazil. By 2 p.m., its fate will be determined. If the Americans beat Germany, the math is simple: They’ll win Group G and will face the second-place team from Group H in the Round of 16. Their opponent would probably be either Algeria, whom the U.S. would be favored against — or Russia, against whom they would have about even odds.
Draw with Germany, and the U.S. will also advance — but as the second-place team from Group G likely to face Belgium in the Round of 16. (The 2-1 and 1-1 scores in the chart below are some of the most common for wins and draws, respectively.)

If the Americans lose, they’ll have to sweat the results of the other Group G match between Ghana and Portugal, which will take place simultaneously in Brasilia. They’ll get a reprieve if the Ghana-Portugal match is drawn, in which case the U.S. is guaranteed to advance in second. But a U.S. loss in Recife, coupled with a victor in Brasilia, could knock them out of the tournament.
The table below describes what will happen if the U.S. loses its match, for all losing scores up to 4-0 Germany, and for all possible outcomes in Brasilia up to four goals scored by each team. For example, if the U.S. loses to Germany 2-0 and Portugal beats Ghana 3-1, the U.S. will advance over Portugal on the basis of FIFA’s goal-differential tiebreaker. Portugal, still disadvantaged from its 4-0 loss to Germany in its opening game, has to make up a net of five goals with the U.S. to make the knockout round.

Although Cristiano Ronaldo might think otherwise, we can’t put it completely past Portugal to accomplish this: The Portuguese can score goals in bunches when in good form, and they have about a 5 percent chance of backing into the knockout stage. There’s even a remote chance that FIFA would have to draw lots to resolve a tie between the U.S. and Portugal: If Portugal beats Ghana 2-0 and the U.S. loses to Germany 3-0, both teams would be stuck on four goals scored and six allowed, and FIFA would resort to the luck of the draw.
However, the bigger problem for the U.S. would be if it loses in Recife and Ghana wins in Brasilia. Then, any Ghana win by more than one goal, or any U.S. loss by more than one goal, would send Ghana forward. The U.S. does have the head-to-head tiebreaker against Ghana by virtue of having beaten it, but that will come into play only if the two matches finish with the same score line (there’s about a 2 percent chance of that happening).
This could yield some interesting strategy and psychology at each venue. Say, for example, that about 75 minutes into Thursday’s matches, the U.S. trails Germany 2-1 while Ghana leads Portugal by the same margin. If those scores held, the U.S. would advance — so it might want to play quite defensively rather than seek an equalizer. But in Brasilia, the Portuguese would have almost nothing left to play for (merely drawing their match against Ghana or even winning it by one goal wouldn’t do them any good), and the Ghanaians would. If Ghana added a garbage-time goal against an indifferent Portuguese back line, the U.S. would be out.
Incidentally, the Germans also have something to play for Thursday — at least in theory. They have not technically clinched advancement: They could be out of the tournament if they lose to the U.S. and there is a victor in Brasilia. However, the outcomes would need to be exceptionally lopsided given Germany’s +4 goal differential so far, which is why Germany has a 99.7 percent chance of going forward.
Later Thursday, the final matches of Group H will take place.

An interesting scenario might unfold in Group H if the U.S. beats Germany. Then Belgium might have an incentive to lose to South Korea and hope that Algeria overtakes it. That would set the Red Devils up with a Round of 16 match against the Americans instead of the Germans.

June 25, 2014
The FiveThirtyEight International Food Association’s 2014 World Cup
Walter: Here at FiveThirtyEight, two things are dominating our interest this summer. The first is the 2014 FIFA World Cup, an international tournament of countries trying to prove who’s the best at soccer. The second is the burrito, a flour tortilla wrapped around a protein and other ingredients.
Inevitably, we combined our two favorite pursuits. After my request to fly around the globe to sample a dish from each World Cup nation was met with awkward silence, we decided to democratize this process. If you want to see a talented food writer conduct a World Cup of Food, check out the ambitious project by Al Jazeera’s Rosie Schaap, who uses “specialized knowledge” and “developed taste” to ascertain the best food in the tourney. I have neither, so democracy it is.
We polled 1,373 Americans through SurveyMonkey Audience and asked them to rate the national cuisines of the 32 teams that qualified for the World Cup, as well as eight additional nations with bad soccer but great food: China, Cuba, Ethiopia, India, Ireland, Thailand, Turkey and Vietnam.
Nate: Nate here. I’ll be interrupting Walter to provide further detail on our methodology and commentary about the cuisines.
We were intrigued by the apparent correlation between countries that are good at soccer and those that are good at food. Consider the past four World Cup champions: Spain, Italy, France and Brazil. Great food! By contrast, the past four countries to win an Olympic gold medal in ice hockey: Canada, Sweden, the Czech Republic and Russia.1 Unless you have a hankering for poutine or borscht, not so appealing.
The eight countries that Walter mentioned are what we call our “potluck” entrants. If you’re a fringe contender like Belgium, you really do not want to draw China or India into your group. We also included Ireland in the potluck draw — a much more favorable opponent.2
Walter: Respondents were asked to rate each country’s cuisine on a scale from 1 to 5. A five means that the respondents “love this country’s traditional cuisine” and “think it’s one of the best in the world” and a one means the opposite. Since these are Americans we’re talking about here, we let them opt out of the question if they were unfamiliar with a particular cuisine.
After randomly sorting each of our play-ins into Groups A through H,3 we simulated their performance in the group stage by looking at respondents familiar with both nations’ cuisines.
Nate: That last point is worth repeating. The results we’ll show you are solely among people who had an opinion about both cuisines in a particular matchup. We call this the “turnout rate,” and it varied anywhere from 7 percent to 65 percent depending on the matchup.
And there’s another twist to ensure that this isn’t purely a popularity contest. Just as political polls are weighted toward likely voters, ours is weighted toward people who are most interested in actually consuming these foods — likely eaters. We asked our respondents two questions, one related to their level of interest in cuisine from around the world and another related to their knowledge about it. Their votes could be weighted by a multiple anywhere from zero to six depending on their responses.4 If you find this horribly undemocratic or want to remix the numbers in a different way, we’ve posted all our data on Github.
Walter: We then played out the 10 head-to-head matches from each group, much as they do in the soccer World Cup, except nobody took a dive. Also as in soccer, a draw was possible if the plurality of respondents rated both cuisines equally.
As an example, let’s say 100 people had an opinion about the traditional cuisine of two countries, A and B. If 20 preferred A over B, 45 preferred B over A, and 35 rated them equally, B would win that “match.” If 20 preferred A over B, 25 preferred B over A, and 55 rated them equally, the match would be a draw.
Nate: The rules are otherwise the same as in the soccer World Cup. In the group stage, a win counts for three points and a draw counts for one. The two countries with the most points from each group will advance to the knockout stage (American translation: the playoffs). Just as ties in World Cup groups are broken on the basis of goal differential, ours are broken on vote differential.5
Let’s look at our groups and their performances.

Nate: Perhaps not everyone shares our love of Mexican food. But this is Mexico’s group to lose. And they got a rather fortunate potluck draw in Ireland.
Walter: My people, the Irish, are known for a great many things — a long history of invention, for example — but great food is not among them. When your best-known culinary achievement involves cabbage, you’re doomed.
Nate: The food down in Brazil was tasty, if a little protein-heavy. Maybe you wouldn’t come for the food but you’d certainly stay for it. And I can’t see any other country getting second place.

Nate: A predictable set of results. But Mexico’s margins are quite something: an average of 61 percent of the vote for and just 10 percent against.
Walter: A fond farewell to Cameroon, which had the cuisine Americans were most unfamiliar with. Only 9 percent of respondents knew enough about it to form an opinion. A little research shows that one specialty is kebabs, so now I’m going to try to find a Cameroonian joint so I can become a food-hipster.

Walter: Here’s our first group with some solid competition. Ethiopia, the potluck entrant, should take at least second place in this group if there’s any sense of fairness, but I wouldn’t be shocked if Americans aren’t super familiar with the deliciousness that is wat. Since roughly 80 percent of my diet is cheese and I’m on an Edam kick, I’d also like to see the Dutch score a win here.
Nate: But this might also be the sort of group where Americans are going more on vague impressions than first-hand experience. Spain, if its cuisine has yet to reach the mass-market appeal of Mexico or Italy, would seem like the favorite. Chilean food is obscure enough that Yelp doesn’t include a distinct category for it. I had some excellent food in Australia. But it was lamb and seafood and some great Asian food, not what Americans might think of as “traditional” Australian food, like Vegemite and kangaroo.
As for the Netherlands, here are my food-hipster impressions after a few trips to Amsterdam: The non-Dutch cuisine, especially the Southeast Asian food, is very good. But overall the Netherlands does not seem as food-obsessed as most nations in Western Europe. I’m not sure the Dutch would vote themselves into the knockout stage.

Nate: I’m impressed that our likely eaters gave Ethiopia the second position, which will ensure at least some African representation in the knockout stage. But it was a very close result. Chile had the better vote differential.
Walter: The Dutch got robbed. There, I said it.
Nate: Dude, the Chileans got robbed — maybe. The Dutch drew with Vegemite.

Walter: This is the closest thing we have to a Group of Death, since everything sounds delicious here. In a previous life I was a line cook in a Greek diner, so I personally hope Greece takes it all the way to the final, and I’d say it’s guaranteed to get the top slot. Choosing between Japanese and Indian food, my heart wants India to win because of naan alone, but my head says Japan will win because of sushi.
Nate: I’m a JIM guy: Japanese, Italian, Mexican. If I had to choose between eating JIM for the rest of my life or ABCDEFGHKLNOPQRSTUVWXYZ (every other cuisine in the world combined), I’d go with JIM. Will our likely eaters agree? Japanese food probably travels less well than Mexican or Italian food: It’s more dependent on super-fresh ingredients and its flavors are less familiar to an American palate. But people do like their spicy tuna rolls.
With that said, this is a deep group, and India makes it a hell of a lot tougher. I’m curious about the perception of Greek food and slightly less confident that it’s sure to advance. Do Americans think of D-grade gyro meat, or amazing seafood by the Mediterranean?

Nate: Well, that didn’t resolve much. Japan, Greece and India drew all their matches against one another. But Japan has the best vote differential and takes the top position. Greece goes through in second.
Walter: It’s sad to see Indian food go out like this — on vote differential — since it had the potential to be such a strong competitor in later rounds. I wish Ivorian food were more popular in the States, because grilled Ivorian land snails look wild.
Nate: Escargot or no, we shouldn’t bury the lede: India is out despite going undefeated in the group stage. This is almost as unfair as the actual World Cup.

Nate: Italy is the perfect fit for this competition. It can go highbrow — after France and Japan, Italy has the most Michelin-starred restaurants. But it does just as well at simple and unpretentious cuisine. It’s also versatile: The Italians do amazing things with pasta, with fish, with cured meat — and don’t overlook their facility with a good cut of steak. And really, who’s going to beat them in the group?
Walter: Italy is going to crush it in this tournament, but for all the wrong reasons. I’d bet Americans are breaking for them on pizza and the Olive Garden — stuffed crust is an American innovation, and I doubt Papa John’s delivers to St. Peter’s Square — when the Italians deserve to win it on cured meats alone.
Nate: I need to take you to a few of my favorite Italian restaurants or book you on a flight to Rome. And I have a little more faith in our likely eaters. They picked Ethiopia, didn’t they?
Still, we’re agreed that the real competition here is for second — and Vietnam, the potluck entrant, seems like the best bet. The other countries have little culinary reputation or, in England’s case, a miserable one.

Nate: Well, the order is about what we expected, but the margins are quite stunning. Italy defeats England — 84 percent to 3 percent? Indeed, the English were roundly thrashed by the Costa Ricans and Uruguayans. They’re really almost as bad at this as they are at penalty kicks. The dominant Italians move on, meanwhile, and will face a traditional rival, Greece, to start their knockout round.
Walter: England got a well-deserved annihilation. I can’t name a single Costa Rican specialty, but I’m sure I’d prefer the dish of the day to whatever a crumpet actually is.

Nate: I’m curious about France. It seems almost certain to advance in a rather average group. But do our likely eaters think of French food – but of course! – as among the best cuisines in the world, or as fussy and pretentious?
Walter: I’m pulling for the Swiss here (recall my cheese-based diet). But China, the Potluck entrant, is a ringer no matter where you put it.
Nate: Indeed, China is a tough draw for Switzerland, which otherwise might have Mueslixed its way to second place.
Walter: This is another example, like Italy, of a national cuisine that might win but for the wrong reasons. Chinese food — actual Chinese food — is divine, but China will win out because of General Tso.
Nate: In my experience, Americans are every bit as likely to settle for middling interpretations of French food. If you have a barely adequate steak frites, a few brunch cocktails and a waiter who goes by Pierre (even if he’s really named Peter), you can have a bustling business.

Nate: France did just fine, it turns out. In fact, it almost beat China outright although “draw” just barely took the plurality in that match.
France benefited in part from weighting for likely eaters; it got an average of 53 percent of the vote in our weighted sample as compared with 49 percent in the overall sample. That isn’t a huge difference and it didn’t swing any matches at this stage. But France will face some tougher competition down the road.

Walter: Cuba totally deserves to win this one, but the second-place contender is anyone’s guess. I’d go with Argentinian food, but only because most Americans have at least some sort of flavor anchor when it comes to South American cuisine. Also, Argentina is known for its steaks, which are the best food.
Nate: You seem fairly keen on this group. By contrast, another person in our office — not an aspiring food-hipster like we are! — described it as the “Group of Death,” meaning that he’d rather die than eat the food from any of these countries.
That’s totally unfair, of course. But these are the sorts of countries that Americans may not like for reasons having little to do with the cuisine. Several of them have a checkered political history with the United States: Would Iranian food have better chances if we’d called it “Persian” instead?

Walter: This is, indeed, the hipster group. The food is great, but you probably haven’t heard of it. The vast majority of respondents had never experienced the cuisines of Bosnia (88 percent), Nigeria (87 percent), Iran (75 percent) or Argentina (62 percent). Cuba goes on to the next round, where it regrettably — but almost definitely — goes down to Chinese food.
Nate: That unfamiliarity seemed to translate into indifference as most of the results in the group were draws. Iran’s results, 0-0-4, were particularly strange. Like India, it’s knocked out despite being undefeated, but like England it went winless.

Walter: You’d think that if the U.S. wins our tournament it’s only because we’re exclusively surveying Americans. However, don’t put this on home-plate advantage alone: America has successfully adapted other cuisines — Chinese and Italian come to mind — and besides, it’s a steak country. Does this nation have culinary sins? Of McCourse. But it absolutely deserves to be a contender.
Nate: This is otherwise a fairly strong group, with Germany, Portugal and Turkey. America’s a great place to eat, too. But let me raise a few objections.
First, the U.S. is great because of the stunning array of consumer choices. However, it also requires some time and some money to sort through all the options. If you know what you’re doing in New York or Los Angeles or Chicago or San Francisco, perhaps you can eat better than anywhere else in the world. But the floor is higher in some other locations: I’d rather walk into a restaurant chosen completely at random in Tokyo or Barcelona or Mexico City, for instance.
Second, our survey asked specifically about “traditional” cuisine. What is traditional American cuisine? Is it what the Pilgrims ate? Is it state fair food like corn dogs and cheeseburgers? Is it regional American cooking, like Southern food?
Of course, you can make the case that assimilating cuisine from different cultures is an American tradition. But I’d argue that highly successful attempts at assimilation are relatively new. Check out the menu collection from the Los Angeles Public Library, for instance. “Japanese” food in 1960s LA meant 16 different kinds of meat with teriyaki sauce.
I’m not going to be unhappy if the United States makes a deep run in the tournament. But remove the home-plate advantage and our case is not all that different from England’s or Australia’s. Those countries also have rapidly improving culinary cultures and assimilate plenty of great food from the rest of the world. But they failed to win a single match. We’re going to do a lot better.

Nate: The U.S. becomes the fourth country after Italy, Spain and Mexico to sweep the group stage. However, its margins were closer than the other three — Germany came within a few percentage points of drawing the U.S., for instance. Perhaps that suggests some vulnerability in the knockout stage.
The rest of the group resolved itself oddly. Germany advances despite having a worse vote differential than Portugal because it beat Turkey while Portugal drew Turkey. I’m mildly disappointed not to see a better performance from Turkey and other Middle Eastern countries, although one could argue that Greek food is Middle Eastern.

Walter: This is a sleeper group. Any nation here could claim the top spot. Belgian fries are fantastic but if Belgium wins it’s thanks to waffles. Russian food is absolutely underrated, South Korea has bulgogi, Algeria has a fusion of Mediterranean and Middle Eastern cuisines that can’t be beat, and Thai food is exceedingly popular.
Nate: I agree that this is among the harder groups to call. I doubt very many Americans will share your sympathies for Russia, however.
The one I’m curious about is Korean food. Tyler Cowen said Korean food tends to be reasonably good in the United States precisely because it isn’t very popular: There isn’t much of a market for it beyond Korean-Americans and food-hipsters, who have high standards. I’m not sure how a cuisine like that will perform under our rules. By contrast, there’s a lot of mediocre Pad Thai served in the United States, although one trip to SriPraPhai or Lotus of Siam should assure you of Thai cuisine’s potential.

Nate: Looks like the sleeper was Thailand. With a 4-0-0 record and some commanding margins in a tough group, Thailand might have the stuff to make a run to the semifinals or beyond. Belgium goes in ahead of South Korea, meanwhile, after winning the vote differential tiebreaker.6
Walter: We’ll move on to the knockout round next week. Here’s what the matches looks like. There are a lot of extremely compelling regional fights going on in the Round of 16.
Mexico vs. EthiopiaJapan vs. VietnamFrance vs. ArgentinaU.S. vs. BelgiumSpain vs. BrazilItaly vs. GreeceCuba vs. ChinaThailand vs. GermanyNate: A lot of olive oil will be spilled in the Italy vs. Greece clash. And I think we’ve identified some of the other top contenders. Mexico, Spain, Thailand and the United States also went 4-0-0 in the opening round, while France and China went 3-0-1. But we’ll be conducting a new set of surveys for the knockout round.

World Cup Advancement Scenarios For Groups E And F
As the eight World Cup teams in Groups E and F take the field Wednesday in Brazil, some things are not in much doubt. Argentina has clinched advancement in Group F. France has not technically clinched advancement in Group E, but its goal differential is so strong that it has advanced for all intents and purposes.
Switzerland and Ecuador have a lot on the line, however. So does Nigeria, which is favored to advance but could fail to do so if it loses to Argentina and Iran beats Bosnia and Herzegovina. There’s even a possibility that FIFA could have to draw lots to determine whether Nigeria or Iran moves on. Let’s focus on Nigeria’s Group F first, which will kick off its final games Wednesday at noon Eastern time:

Most scenarios in Group F are simple. Argentina will advance in first place if it beats or draws Nigeria, or as the second-place team behind Nigeria if it loses to it.
Nigeria is an 88 percent favorite to advance in some capacity, according to the FiveThirtyEight forecast. The only way it could fail to do so is the case I mentioned: if it loses to Argentina while Iran beats Bosnia. That scenario could get messy.
Say that Iran beats Bosnia 2-1 while Nigeria loses to Argentina by the same 2-1 scoreline. Both teams will have one win, one draw and one loss. Both will have two goals scored and two goals allowed. FIFA’s next tiebreaker is head-to-head results, but Nigeria and Iran drew their match. That means FIFA would be out of tiebreakers and forced to draw lots to determine who advances.
Mind you, this situation is unlikely. Iran is probably a weaker team than Bosnia and has only a 21 percent chance of beating the World Cup newcomer. Also, anything but the same scoreline in the two Group F matches would give FIFA some other way to resolve the tie. For example, if Iran won 2-0 and Nigeria lost 1-0, Iran would have the better goal differential and would advance. If Iran won 1-0 and Nigeria lost 2-1, the teams would be tied on goal differential but Nigeria would advance on the basis of goals scored. The chance that FIFA will have to draw lots is only 0.6 percent, according to our match predictor.
An even bigger longshot than that scenario is if France failed to advance from Group E. Let’s look at the situation there:

The FiveThirtyEight forecast lists each team’s advancement probability to the first decimal point and describes France’s chances at 100.0 percent; if we added a decimal place, they’d be 99.98 percent instead. The only way this extraordinarily unlikely scenario could come into play is as follows: France loses to Ecuador. Switzerland beats Honduras. Then France, Switzerland and Ecuador are tied atop Group E with six points each.
This scenario is not all that unlikely: There’s a 10 percent chance that both Switzerland and Ecuador will win their matches. But France would also have to finish last among the three teams in the goal-differential tiebreaker. There’s almost no chance that will happen; France’s goal differential is +6 so far, while Ecuador’s is even and Switzerland’s is -2.
But Switzerland and Ecuador’s advancement prospects are more complicated. Switzerland is guaranteed to advance if:
It beats Honduras and Ecuador draws or loses.It draws Honduras and Ecuador loses.Ecuador is guaranteed to advance if:
It beats France and Switzerland draws or loses.It draws France and Switzerland loses.Both matches in Group E are draws.Other cases, like the one where Ecuador and Switzerland both win, will go down to a tiebreaker.
There’s even an outside chance (about 2 percent) for a three-way tie, in which Honduras could advance. That would require both Honduras and France to win — in which case Honduras, Ecuador and Switzerland would be tied for second with three points each. Honduras would then need to win on the tiebreaker. That would probably require them to beat Switzerland by at least two goals while Ecuador takes a multi-goal loss to France.
CORRECTION (June 25, 9:39 a.m.): An earlier version of this post incorrectly described the scenario of Iran beating Bosnia 2-1 and Nigeria losing to Argentina by the same 2-1 scoreline.

Nate Silver's Blog

- Nate Silver's profile
- 729 followers

