Nate Silver's Blog, page 173
May 13, 2014
The 2014 Election Is the Least Important in Years
A Gallup poll released Monday found that just 35 percent of registered voters are more excited than usual about voting in November’s midterm elections. That’s well down from 2010 and somewhat down from most other midterm years when Gallup has asked this question. Midterm elections normally generate less voter enthusiasm than presidential years, so this isn’t all that high a bar to clear.
It would be easy to blame voters for their apathy, but perhaps they could use a breather. The past 14 years have featured a number of exceptionally exciting elections with control of the federal government at stake. This year, it probably isn’t.
It’s extremely unlikely Democrats will win back the U.S. House in November. The party that’s in the White House very rarely gains seats in midterm elections, and Democrats also face headwinds because there are far fewer swing districts than there used to be. It would take a very strong Democratic year for them to win back the House, and the political climate for Democrats appears to be somewhere between fair and middling (with some chance that could turn into an outright poor year for them).
Of course, President Obama will control the White House through 2016. So, there will be a Democratic president and, almost certainly, a Republican check on Obama’s power in the Congress. The Senate is very much in play. But a GOP-controlled Senate would be somewhat redundant. Republicans already exercise a “veto” on Obama’s power in the House and, with party-line voting and political polarization near their all-time highs, this suffices to make Obama a lame duck except on initiatives he can pass through the executive branch alone.
That isn’t to say that Senate control doesn’t matter at all. It certainly matters in the long run. In 2016, the Senate landscape isn’t favorable to Republicans, as they’ll have to defend seats in a number of blue states they won in the GOP wave year of 2010. Unless they make considerable gains this year, they’re unlikely to have much of a shot of controlling the Senate after 2016.
Furthermore, the Senate has the sole authority in Congress to approve Supreme Court nominations, along with Cabinet appointments and treaties. There’s the prospect of Ruth Bader Ginsburg or another justice retiring within the next two-and-a-half years.
Nor does this say anything about the races in states and localities, which account for about 40 percent of all government spending in the U.S., and which provide the farm systems that allow parties to develop future presidential and congressional candidates. The gubernatorial races in a number of large states, including Florida, Ohio, Pennsylvania, Michigan and Wisconsin, appear to be very competitive.
This is not an election without consequences. It’s just that the consequences are a little lower than the ones that we may be used to.
The table below documents the disposition of the federal government after each election since 1980: which party controlled the White House, and whether the opposition party exercised a check on power by holding at least one branch of Congress.
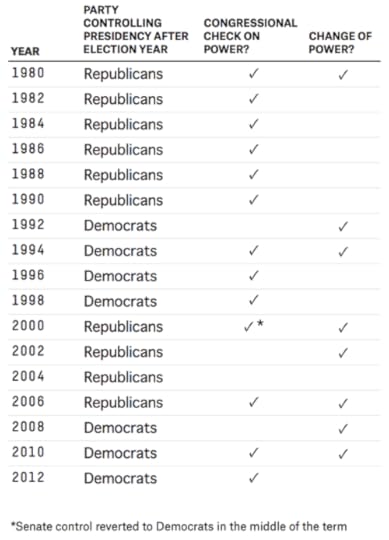
Seven of the past 11 federal elections have featured changes in power: 1992, 1994, 2000, 2002, 2006, 2008 and 2010.
The exceptions were 1996, 1998, 2004 and 2012. But in 2012, it was plausible for Republicans to win the presidency; the FiveThirtyEight forecast model gave them about a 40 percent chance of doing so in May 2012. It was also plausible the GOP would win the Senate, until the party faded late in the race.
The 2004 election was parallel to 2012 in some ways. The presidential election was close, and the Republican edge in the Senate was thin heading into the election year. It’s less clear whether Democrats had much of a chance of taking the House in 2004, but they had reasonable odds of winning a check on George W. Bush’s power in some way.
The late-1990s elections were duller. As the economy gained steam in the mid-1990s, Bill Clinton became a fairly clear favorite to retain the presidency in 1996. Democrats gained a couple seats in the House, but not nearly enough to retake the majority. And they lost a net of two seats in the Senate, despite Clinton’s re-election.
In 1998, after the Republican Party grew unpopular in the wake of the Clinton impeachment trial, Democrats had some hope of winning the House. Democrats wound up gaining a few seats — far better than parties usually do in midterm years — but that may have been toward the upper bound of their plausible performances. The Senate, where the Democrats needed to gain five seats while defending more seats than the GOP, was another problem.
But relatively sleepy election years like 1996 and 1998 were fairly common in the past. The parties were in a long stalemate between 1980 and 1992, with Republicans controlling the presidency and Democrats retaining a large edge in the House.
Back then, at least, the parties behaved in a more bipartisan fashion. So the outcomes were less binary, and the margins of control in the House and the Senate mattered more. Ronald Reagan and George H.W. Bush were far from being lame ducks at this time in their tenures.
The caution, of course, is that all of this is easier with the benefit of hindsight. In 1994, voter enthusiasm was initially fairly low. But it proved to be a monumental year as Republicans regained the House for the first time since 1955. Even then, however, polling showed the GOP with a chance to win the House fairly early in the year, so its win didn’t come out of nowhere.
Perhaps the polls are missing a Democratic wave that will make the House competitive in November. Otherwise, the consequences of this year’s federal elections are mostly in how they’ll set up 2016, and not how they’ll affect Washington in the interim.
By all means, go out and vote! Just be skeptical if you hear that 2014 is the most important election of your lifetime, as parties, pundits and politicians almost always claim sooner or later. This election isn’t so special.
Correction (May 13, 4:05 p.m.): A previous version of this post incorrectly said the Democrats lost House seats in 1996. They won two seats.

Game 7 is a Great Time to Get Physical
In 1979, the Boston Bruins, facing the Montreal Canadiens in Game 7 of the Stanley Cup semifinals, had a one-goal lead with 2 minutes and 34 seconds to play in the third period. But then the Bruins were whistled for a bench minor during a sloppy shift change — too many men on the ice. You can probably guess what happened next. Canadiens’ legend Guy Lafleur scored on the ensuing power play to tie the score. The Canadiens won in overtime.
The Bruins fired their outspoken coach, Don Cherry, after the season. Cherry coached the next year for the Colorado Rockies. After they finished dead last in the NHL — their slogan had been, “Come to the fights and watch a Rockies game break out!” — CBC hired Cherry as a broadcaster. His “Coaches’ Corner” segment debuted the next year and has aired on CBC ever since. Cherry is so legendary to fans of “Hockey Night in Canada” that he was once voted the seventh-greatest Canadian of all time. Alexander Graham Bell finished ninth in the same poll. Wayne Gretzky finished 10th.
Cherry — if you’ve never seen him — has a populist sensibility that seems to appeal to the same part of the Canadian psyche as Toronto’s crack-smoking mayor, Rob Ford.1 And like Ford, he isn’t much of a stickler for the rules. He loves physical hockey and hates ticky-tack penalties, like the one the Bruins got in Montreal 35 years ago.
But Cherry’s experience in 1979, as much as it altered the course of Canadian and Canadien history, was more the exception than the rule. Usually in Game 7s, referees let an awful lot go and call far fewer penalties than they do in the regular season or the rest of the playoffs. Game 7s are very good environments for the physical hockey teams that Cherry likes best.
Case in point: the 2010-11 Bruins, who won Boston its first Stanley Cup since 1972. In those playoffs, the Bruins became the first-ever NHL team to win three Game 7s. The Bruins were a penalty-prone team, finishing
It’s unlikely that this is a fluke. Game 7s, like the one the Bruins and the Canadiens will play Wednesday and the New York Rangers and Pittsburgh Penguins will play Tuesday night, are a special treat. But there have been more than 100 of them since 1988, making for a reasonably large sample. Furthermore, there is evidence from baseball, basketball and other sports that officials are prone to passivity with more on the line. About 20 percent of power plays result in goals, both in the regular season and in the playoffs.
But it’s easy to blame the refs. Is it possible that the players — as opposed to the officials — are doing something differently in Game 7s?
Not in a way that would explain the discrepancies in the data. The NHL now keeps track of body checks, or hits. In Game 7s since 2009, teams have averaged 28.7 hits per 60 minutes of ice time. That’s a tiny bit lower than the rate in the first six games of the playoffs, which is 30.2 hits per 60 minutes. But it’s much higher than in the regular season, when teams average 22.2 hits. The playoffs are considerably more physical, and Game 7s are typical of the playoffs.
It is true that teams get into fewer fights during the playoffs. Since 1997-98, teams have been called for 0.8 minutes’ worth of major penalties per 60 minutes of ice time in the playoffs, as compared to 2.7 per 60 minutes in the regular season. Major penalties generally mean fighting majors, so that can be taken to mean that fights are only about one-third as common in the playoffs. Perhaps there are fewer fights in Game 7 than during the rest of the playoffs — I don’t have that data handy. But fighting majors are so rare in the playoffs to begin with that they can’t account for much of the drop-off in penalty minutes in Game 7s compared to the rest of the series.
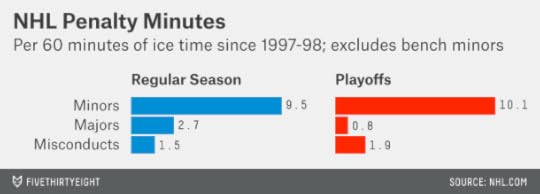
Incidentally, there are more misconduct penalties called in the playoffs than during the regular season, and this trend has been especially pronounced during the past five years or so. For those of you who aren’t familiar with misconducts, they’re penalties that rule a player off the ice for either 10 minutes or the rest of the game, depending on the severity of the infraction. However, unlike major and minor penalties, they don’t give the other team a power play (although misconducts are usually called in conjunction with major or minor penalties). Thus misconducts, along with fines and suspensions from the league office, may serve as an attractive solution for officials. They serve a deterrent effect without having quite as much of a direct impact on the game as fans see it.
But by Game 7, referees drop all pretense of calling the game as they usually would, despite the action remaining highly physical.
Which teams might benefit from this? The next chart lists the net number of goals scored by each remaining playoff team during special-teams situations (power plays and penalty-kills; the totals include short-handed goals). The higher a team ranks on this list, the more it stands to lose from a drop-off in penalty calls. Conversely, the teams low on the list would prefer more even-strength play.

The Penguins and the Rangers ranked first and third among NHL teams for net special-teams goals during the regular season. The Rangers’ power play has been awful in the playoffs so far, but that’s probably just a function of a small sample size. Still, they probably won’t mind a game with fewer penalties, especially since the Penguins’ power play is so deadly. On the other hand, the Rangers are more of a finesse than a power hockey team, so it’s not likely that they’ll just be able to check Sidney Crosby into submission, even with laxer officiating.
The Bruins and the Canadiens might also be something of a wash. The Bruins recorded 17 percent more hits than the Canadiens during the regular season — but the Canadiens had 20 percent more penalty minutes. And while the Bruins have the better power play, Montreal has the better penalty-kill.
If there’s a team that could benefit from the Game 7 officiating style, it could be the Los Angeles Kings. The Kings led the league in hits during the regular season, and while they avoided fighting majors, they had the fourth-highest number of minor penalties in the league. They also have an anemic power play and just an average penalty-kill, which made them net-negative in special-teams goals during the regular season.
Don Cherry is still an unabashed Bruins fan, but the Kings fit his style the best, avoiding blatant cheap shots but otherwise pushing the limits of legal play. If they beat the Anaheim Ducks tomorrow to advance to a Game 7, they might have better luck than Cherry did.

May 11, 2014
Fairness vs. Freedom: Is Politics Going Back to the 1970s?
Inequality is a hot topic these days — even on Fox News. This contrasts with most of the past decade, when the term was barely mentioned even on the liberal-leaning television network MSNBC.
The increasing focus on inequality is best thought of as a reemergence of an old theme rather than something new. Since the founding of the republic, frames focused around fairness and equality have competed against those centered around freedom and liberty in American political discourse.
I put together the following graphic (well, I put together the data; FiveThirtyEight visual journalist Ritchie King put together the graphic), based on a search for the terms equality, fairness, freedom and liberty* in the Democratic and Republican platforms dating to 1948. It tells us a lot about how the priorities of the parties have changed over the years.
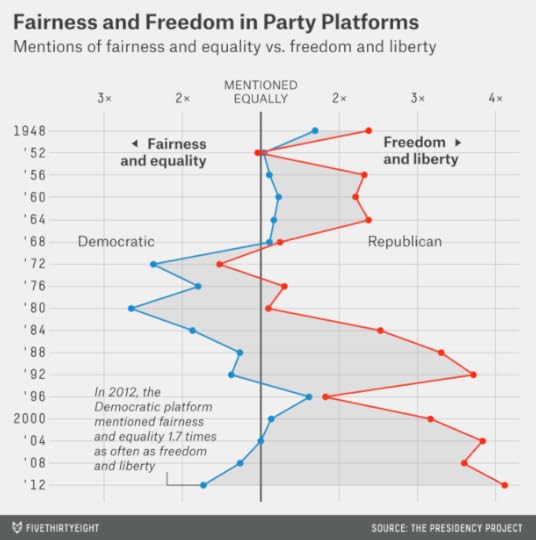
In the 1950s and 1960s, Democrats were about as likely to talk about fairness as freedom. Then there was a strong shift toward fairness and equality as rhetorical frames under George McGovern in 1972, Jimmy Carter in 1976 and 1980, and Walter Mondale in 1984. But Democrats reverted to being more even in their use of the terms under the platforms written for Michael Dukakis, Bill Clinton, Al Gore and John Kerry. Barack Obama’s platforms emphasized fairness and equality more often, however, especially in 2012.
Republicans have almost always used freedom-related words more than fairness-related words (with modest exceptions in 1952 under Dwight Eisenhower and 1972 under Richard Nixon). But from the 1950s through the 1990s, the parties usually tracked with each other. That is to say, when Democrats shifted toward talking more about fairness and less about freedom, Republicans moved in the same direction.
However, the partisan split in these terms has widened considerably since 1996. In their 2012 party platform, Republicans used “freedom” and “liberty” 4.1 times more often than “fairness” and “equality.” Obama’s Democrats, by contrast, used “fairness” and “equality” 1.7 times more often than “freedom” and “liberty.”
The usage of the terms can also be thought of as a proxy for where the parties align on on the left-right spectrum. Like other measures of partisan activity, this one shows that Republicans have shifted somewhat further away from the center and have therefore been somewhat more responsible for the increasing divide between the parties. However, Democrats have also been moving to the left.
In general, I’m in agreement with Thomas E. Mann and Norman Ornstein, that political commentators and journalists have been too slow to talk about the Republican Party’s rightward shift. It also seems plausible to me, however, that we could see an increasingly sharp shift toward the left in the Democratic Party in the coming years, particularly if Hillary Clinton is not its nominee in 2016.
Furthermore, it seems plausible that Republicans could gradually steer back toward the center; they’re talking more about inequality, too, both on cable television and in Congress. As inequality gains traction as a political concept, Republicans may frame their goal as wanting to ensure equality of opportunity, while they accuse Democrats of desiring equality of outcomes. The word, opportunity, is one that Republicans have gotten away from. From 1948 through 1988, the parties used “opportunity” or “opportunities” about as often as each other in their platforms, although with some fluctuations from year to year. Since 1992, however, Democrats have mentioned opportunity about 60 percent more often than Republicans as a proportion of all words in their platforms.

Both parties, then, might be inclined to rediscover some of their rhetoric from the 1970s and the 1980s. These weren’t glorious times for Democrats, who occupied the White House for only four years between 1968 and 1992. What’s different this time is that income inequality has risen steadily since then. It’s something you’ll almost certainly be hearing a lot about heading into 2016.
* More specifically, I searched for the text strings “equal,” “fair,” “free” and “libert-” in the party platforms. So, for example, words like “equalize” and “equal” will be counted along with “equality” and “inequality.” There may be a very small number of false positives — for example, the word “affair” (as in “foreign affairs”) contains the text string “fair” — but these cases are rare enough that they aren’t worth worrying about.

May 10, 2014
Quick Thoughts on Michael Sam to the Rams
I wrote this week that Michael Sam, the Missouri defensive end who came out as gay in February, wasn’t certain to be picked in the NFL draft. Of those players at his position who had been rated as sixth-round picks before the draft — as Sam was — slightly less than 50 percent were chosen by an NFL team.
I also wrote that I’d take Sam’s side of the bet given even odds:
Personally, however, if the odds are something like 50-50 on Sam being drafted, I think I’d take his side of the bet. Why? A player only needs one team to draft him. A player like Sam who generates polarized opinions might have a better chance of being chosen in a late round by a team like the New England Patriots or the Seattle Seahawks than one who everyone agrees is mediocre.
Perhaps this counts as a “correct” (if well-hedged) prediction. But I got one thing pretty wrong. I assumed that Sam would be chosen by a team like the Patriots or the Seahawks or the San Francisco 49ers that play in an urban area especially tolerant toward gay people. But St. Louis was probably the best fit all along.
How come? Public acceptance of homosexuality certainly varies from city to city and state to state. If we use support for gay marriage as a rough proxy, for example, I estimate that about 47 percent of voters approve of it in Missouri, as compared with 58 percent in California, 59 percent in Washington state and 66 percent in Massachusetts. (Obviously, the percentages are likely to be higher in cities such as San Francisco and Seattle specifically as opposed to the states as a whole. But that’s probably also true for St. Louis, which is considerably more liberal than the rest of Missouri.)
What varies a lot more, however, is appreciation for University of Missouri football. Interest in the Tigers is about 50 times higher in Missouri than in the rest of the country, according to the number of Google searches.
In other words, a higher percentage of people in St. Louis and elsewhere in Missouri will know of Sam as a football player and not just as a gay athlete. Here’s hoping that helps him to concentrate on what he does best.

May 8, 2014
Could Mitt Romney Be the New Dick Nixon?
Did ya hear the news? Mitt Romney may run for president again! A little birdie told Bob Schieffer so.
Our guess is that, like so many anonymous reports, this one will turn out to be false. Still, it’s not that uncommon for general-election losers to try again. The tradition dates to 1800, when Thomas Jefferson avenged his 1796 loss to John Adams and became our third president.
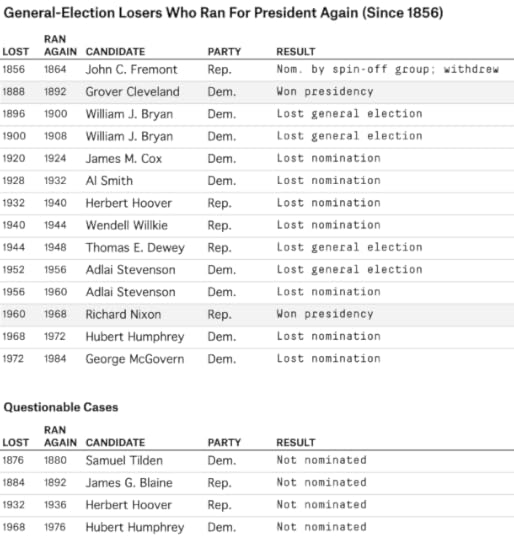
In recent years, recycled candidates have been somewhat less common. Plenty of candidates have lost their nomination fights and run again — as Romney did in 2012 after losing in 2008, and as Ronald Reagan did in 1980 after failing to win the Republican nomination in both 1968 and 1976. But no general-election loser from a major party has tried again since George McGovern, who lost to Richard Nixon in 1972 and ran a quixotic bid for the Democratic nomination in 1984.
That may be because these candidates don’t have a very good track record. Since 1856, when the Republican Party first nominated a candidate for president, general-election losers from the major parties have run again for president somewhere between 14 and 18 times, depending on how you count several debatable cases. (Samuel Tilden, for example, won the popular vote in 1876 but lost in the electoral college. In 1880, he never officially declared his candidacy, but was considered the front-runner and still received votes at the Democratic convention.)
Only two of these candidates won the presidency: Grover Cleveland in 1892 and Nixon in 1968.
Perhaps Romney could turn to Nixon for hope. Tricky Dick successfully reinvented his public image: the new Nixon!
But Cleveland and Nixon are the exceptions — and both came back after losing exceptionally close races. Cleveland, who won the presidency in 1884, lost the electoral college to Benjamin Harrison in 1888 but won the popular vote. Nixon, in 1960, nearly won the popular vote against John F. Kennedy.
Romney’s loss to Barack Obama in 2012 was no landslide, but it probably wasn’t close enough to convince Republicans that Romney would have won if only circumstances had been a little different. Romney performed, at best, in line with what would be expected by prediction models based on economic fundamentals — and perhaps a little worse. And his campaign was derided by some Republican activists after its get-out-the-vote system, Project ORCA, failed on Election Day.
In some ways, this assessment is unfair to Romney. Incumbent presidents aren’t that easy to beat, even under middling economic conditions. Romney raised an enormous amount of money and avoided major scandals. Down the ballot under Romney, Republicans failed to win the Senate, but they did hold on to the House of Representatives. His nomination wasn’t a disaster on the scale of McGovern’s.
Still, since some Republicans thought right up to the last minute that the election was theirs to lose, our guess is that they won’t want any more of Romney. And Romney will probably find something else to do with his time.

May 7, 2014
‘Inequality’ Booms on MSNBC And Fox News (CNN’s Looking For Flight 370)
In 2008, the year Barack Obama was elected the first African-American president and the global economy teetered near collapse, the word “inequality” was used just 14 times on the liberal-leaning cable network MSNBC. So far in 2014, which is barely more than a third over, the word has been said 647 times on the network.
These results are based on a LexisNexis search of transcripts of MSNBC’s original news programming (in other words, not the prison dramas shown on weekends). Each instance of the term “inequality” is counted separately — so, if it is used 29 times on the same program (as it was on one episode of Melissa Harris-Perry’s show), it counts 29 times.
How substantial is 647 mentions of “inequality” in the context of MSNBC’s programming budget? LexisNexis records about 250,000 words’ worth of MSNBC transcripts each week, and there are about 6,000 words spoken per hour of programming (I calculated this as 150 words per minute times 40 minutes of noncommercial time per hour). That implies that “inequality” is said 0.87 times per hour of original programming on MSNBC. By comparison, it was used only 0.006 times per hour in 2008.
A good amount of the increase came in 2011, the year of the Occupy Wall Street protests, when MSNBC used “inequality” about five times more often than it did in 2010. But the term’s frequency has continued to increase since then. This year, as the economist Thomas Piketty’s treatise on inequality has topped best-seller lists, the word is on pace to be used more than twice as often on MSNBC as it was in 2013.
What may be more surprising is that there has also been an “inequality” boom on the Fox News. The word has been used 0.57 times per hour on Fox so far this year, almost an order of magnitude larger than the 0.08 instances per hour in 2013.
CNN lags behind by this measure: It has used the term about 0.14 times per hour of original programming so far this year. By comparison, “Flight 370,” referring to the Malaysian airliner that went missing, has been used 13,348 times on CNN, or about once every six minutes of original programming since the flight disappeared.

May 6, 2014
The Odds Michael Sam Will Be Picked in the NFL Draft
Former Missouri defensive end Michael Sam, who in February announced that he was gay, may not be among the 256 men chosen in this year’s NFL draft, which begins Thursday. In fact, based on a historical assessment of players who were rated similarly by media scouting projections, Sam’s chances of being drafted are only about 50-50.
Sam, the 2013 SEC Co-Defensive Player of the Year, is rated as a sixth-round pick on the Scouts Inc. draft board, which is available through ESPN Insider. That might seem to imply that he’s likely to be drafted, because the NFL draft has seven rounds.
But players projected to be chosen late in the draft are hard to differentiate from one another. You can think of NFL prospects as representing the tail end of a bell curve. At the extreme end of the tail are a small number of potential franchise talents, such as Andrew Luck and Bo Jackson. The curve gets denser and denser with players the farther down the draft board you go, however. Players who are projected as sixth-round picks often fall out of the draft entirely.
I looked at what happened to projected sixth-round picks since 2005, as according to the Scouts Inc. draft board. Specifically, I looked at defensive ends and outside linebackers, the two positions that Sam might play in the NFL. (That some scouts regard Sam as a “tweener” is one reason he may not be drafted highly.)
There were 67 such players between 2005 and 2013. Of those, 37 players — 55 percent — were not drafted. Twenty-four others were drafted between the fifth and seventh rounds, while six were chosen in the fourth round or higher. Only about 10 percent were chosen in the sixth round exactly.
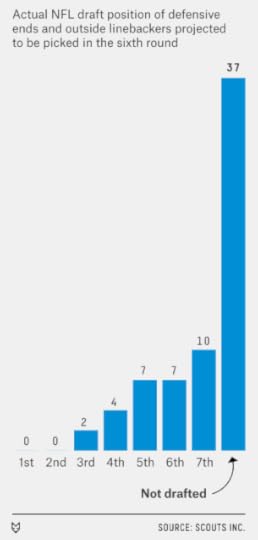
Isn’t it a bit contradictory to describe prospects as sixth-round draft picks when they’re far more likely not to be drafted than to be chosen in the that round? There are more projected sixth-round picks than sixth-round slots. This year, for example, Scouts Inc. lists 71 players as sixth-round picks, but there are only 39 selections in that round (this includes a number of compensatory picks given to teams who lost free agents).
The alternative, however, would imply a false precision in differentiating between sixth-round picks, seventh-round picks, guys just off the draft board and so forth. Picks late in the draft are intrinsically hard to project, because each team has different assessments of the players, and some teams prioritize need while others look for talent.
But leave these semantics aside. There’s a more pressing issue in the case of Sam. Has his draft status been harmed by his public declaration of his sexuality?
Sam’s ranking has fallen on some news media draft boards, including the one prepared by ESPN and Scouts Inc., since he came out as gay. Determining the cause and effect is harder. On the one hand, Sam got middling reviews at the NFL Scouting Combine in February. On the other hand, some NFL scouts and general managers have told members of the media that they’re worried Sam could be a “distraction.” In a league that has employed the likes of Aaron Hernandez, that could be cover for homophobia.
But suppose that Sam were projected as a fourth-round pick, which is how he was often described at the time he came out. Would he be assured of being drafted?
Not quite. Among the 70 defensive ends and outside linebackers projected by Scouts Inc. as fourth-round picks since 2005, 15 – 21 percent — weren’t drafted. Others were chosen as high as the second round.
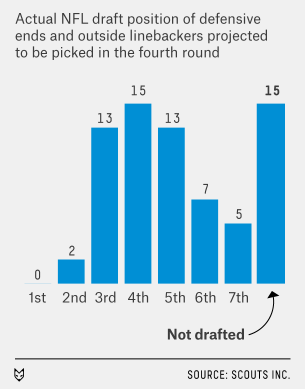
In other words, if Sam is not chosen in the draft, we won’t be able to say for sure it’s because of his sexuality. Draft projections are an inexact science, especially in the late stages of the process. (If Sam is neither drafted nor signed as a free agent, that would be a clearer signal that the league is evaluating him on something other than his football talent.)
Personally, however, if the odds are something like 50-50 on Sam being drafted, I think I’d take his side of the bet. Why? A player only needs one team to draft him. A player like Sam who generates polarized opinions might have a better chance of being chosen in a late round by a team like the New England Patriots or the Seattle Seahawks than one who everyone agrees is mediocre.

May 5, 2014
Good News: You Won Game 7; Bad News: You’re Less Likely to Win Round 2
A close call in the first round of the NBA playoffs doesn’t always doom a team. In 2008, the Boston Celtics, coming off a 66-16 season, needed seven games to get by an Atlanta Hawks team that had gone 37-45. But they wound up winning the NBA title.
Those Celtics, however, may be more the exception than the rule. In fact, an extended first-round series is often an ominous sign for the winning team. If recent history is any guide, then this year’s Indiana Pacers, who needed seven games to defeat this year’s Hawks, may be no better than even money against the Washington Wizards, whom they begin playing Monday night.
Since the NBA went to a best-of-seven first round in 2003, teams that swept their first-round series won their second-round series 76 percent of the time. Teams that needed five games to beat their first-round opponent won the next series 60 percent of the time. But those teams that needed six games to win the first round won the second round only 34 percent of the time, and those that took the full seven games did just 36 percent of the time.
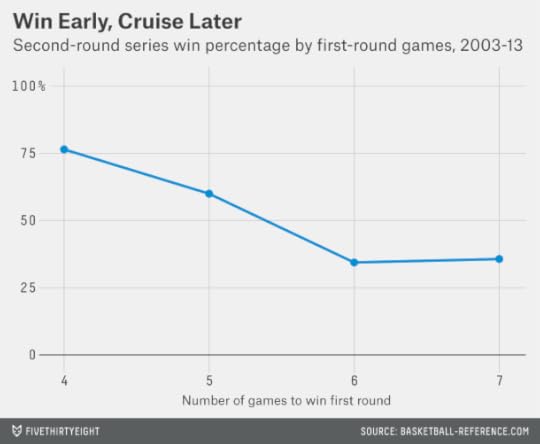
One may assume these results reflect selection bias: The teams that won their opening series in four or five games were presumably better, on average, than those that took longer to do so. But this is only part of the story. Suppose we look only at teams seeded No. 1 or No. 2 in their conferences. Since 2003, teams from this group that swept the first round won the second round 94 percent of the time. Those that required five games won the second around 77 percent of the time. And those that needed six games or seven games won the second round 62 percent of the time.1
Still not convinced this is a real phenomenon? We can further account for the effect of team quality by evaluating how a team performed relative to its regular-season power rating. Specifically, we can formulate a projected scoring margin for each second-round game based on each team’s SRS rating from the regular season and whether it has home-court advantage. (This is equivalent to a point spread.)2
We can then average a team’s margin of victory or defeat throughout the second round and compare it to what was expected from its SRS. The advantage of this approach is that it accounts for a team’s overall strength and that of its opponent based on each team’s regular-season performance.
This analysis produces some highly significant effects. On average since 2003, teams that swept their opening-round series outperformed their SRS projections by 3.0 points per game in the second round. Those that took the full seven games in the opening round did much worse than expected in the second round, by contrast, underperforming their SRS by an average of 5.7 points per game. These are enormous differences in the context of highly competitive playoff series.
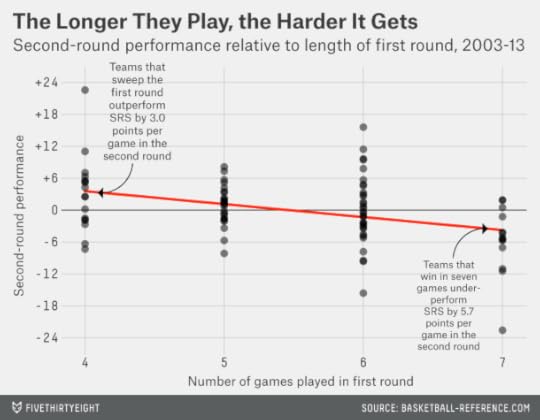
A more complicated version of the analysis accounts both for how many games a team took to win its opening-round series and for how well it performed relative to its SRS projections in the first round. It’s worth distinguishing these because a close call in the first round, like the one Indiana had, could lower our expectations for a team’s second-round performance for either of two reasons. First, if a team plays more games, it could be more fatigued. Second, playoff performance provides some evidence about a team’s quality under playoff conditions.3
If we put both factors into a regression analysis, where the dependent variable is a team’s performance relative to its SRS in the second round, we find that the number of games it played in the first round is by far the more important factor. In other words, the principal worry for a team that takes six or seven games to win the first round is fatigue and not necessarily poor play. In fact, the variable for a team’s margin of victory relative to its SRS in the first round is not statistically significant, although it has some interesting practical implications.4
![Screen Shot 2014-05-04 at 5.07.15 PM[8]](https://i.gr-assets.com/images/S/compressed.photo.goodreads.com/hostedimages/1399335802i/9536945._SX540_.png)
We can use this regression analysis to estimate how much this year’s first-round playoff series should affect a team’s odds for the second round. We accomplish this by computing the probability of a team winning its second-round series based on its regular-season SRS,5 and then, alternatively, with a modified version of SRS that accounts for how many games it took to win the first round and its average margin of victory in those games.
Actually … I don’t have the guts to show you those numbers. The effects are so pronounced that I don’t quite trust them; a number of other studies have documented the importance of rest to NBA teams, but they haven’t shown quite so large a magnitude. More important, if you use the same formula to compute the effect of the second round on the conference finals, for instance, or the conference finals on the NBA Finals, you don’t see anything like this. So what I’m going to show you instead are the numbers based on a toned-down version of the formula that computes the numbers-based data from all playoff rounds, and not just the first round. Perhaps there’s something unique about the first round and how a team transitions to the second round, but I’d have to be convinced. If you want to see the numbers based on that uber-aggressive version of the formula, check the footnotes.6
Indiana Pacers vs. Washington Wizards
Original SRS odds: Indiana 76 percent to win the series.
Modified SRS odds: Indiana 54 percent to win the series.
The formula has the Pacers going from being 3-to-1 favorites to beat Washington to about even money. This is obviously something of an extreme case of a No. 1 seed struggling and facing a No. 5 seed that played very, very well and is much better rested. I might be biased since I’ve been called a wizard, but I can buy that the series is about even given how much Indiana struggled late in the regular season.
Miami Heat vs. Brooklyn Nets
Original SRS odds: Miami 88 percent to win the series.
Modified SRS odds: Miami 95 percent to win the series.
Miami swept its opening-round series, while Brooklyn needed seven games to beat the Toronto Raptors. Hence, the Nets have gone from really big underdogs to really, really big underdogs.
San Antonio Spurs vs. Portland Trail Blazers
Original SRS odds: San Antonio 78 percent to win the series.
Modified SRS odds: San Antonio 69 percent to win the series.
San Antonio needed seven games to beat Dallas, but Portland took six to beat Houston in a very competitive series. Part of this, however, is that the Spurs had more to lose, since they were heavily favored against Dallas while Portland wasn’t against the Rockets.
Oklahoma City Thunder vs. Los Angeles Clippers
Original SRS odds: Los Angeles 51 percent to win series.
Modified SRS odds: Los Angeles 52 percent to win series.
SRS had this series as a toss-up before, and since both the Thunder and the Clippers took seven games to win their first-round series, nothing much has changed.
The good news for the Pacers is that if these results are mostly about fatigue, they could reset the table by beating the Wizards relatively easily. The bad news is that they aren’t likely to do so: The formula gives Indiana only a 21 percent chance of beating Washington in four or five games. By contrast, it gives Miami a 33 percent chance of sweeping Brooklyn, and a 70 percent chance of winning in four or five. So the Pacers’ plodding performance is likely to catch up with them sooner or later, even if they get by Washington.

May 2, 2014
Got a Billion Dollars? Buy the Clippers
A billion dollars? For the Clippers?
That’s the price my Grantland colleague Zach Lowe’s sources are saying the Los Angeles NBA team could fetch if its current owner, Donald Sterling, agrees to sell the franchise or is forced to do so. With stars from Magic Johnson to Floyd Mayweather, Jr., to Oprah Winfrey to Larry Ellison reportedly interested in a piece of the club, it’s not hard to see why league officials have starry-eyed visions about what the team could be worth.
And yet, when Forbes Magazine published its valuations of the 30 NBA teams earlier this year, its figure for the Clippers was considerably more modest: $575 million.1 NBA officials, I’ve found in the past, aren’t fond of the Forbes figures. The league has incentives to underplay its financial performance when in the midst of a labor dispute, and to frame its finances in a more favorable light when it has a couple of franchises up for sale.
In this case, however, there’s reason to think Forbes considerably undervalues the Clippers. You might describe why with the old real estate adage: location, location, location. It’s not breaking news that there are lots of people with lots of money in Los Angeles and its suburbs. What’s more interesting is that the number of billionaires in a given community historically has been a strong predictor of the degree to which its NBA franchise appreciates in value.
Take a look at the annualized change in NBA franchise values from 2004 to 2014, according to the Forbes estimates. In the chart below, we’ve highlighted the teams that played in metro areas that had a gross domestic product of at least $250 billion as of 2004. You can see that there’s a relationship. The New York Knicks, despite their mostly poor play over the past decade, saw their franchise value appreciate by 13.3 percent per year, according to Forbes. The Lakers and Clippers saw theirs grow by 11.7 percent and 10.7 percent per year, respectively. Most other big-market teams, like the Chicago Bulls and the New Jersey/Brooklyn Nets, have also done well.

There are also some exceptions to the pattern, the most obvious being the Seattle Supersonics, who saw their franchise value increase a lot after moving to Oklahoma City and becoming the Thunder.2 The Miami Heat, despite playing in a mid-sized market, have seen a massive increase in franchise value. On the flip side, the Philadelphia 76ers and Washington Wizards have considerably underperformed the rest of the league despite playing in reasonably large markets.
These differences partly reflect on-court success: Building a future around LeBron James is a much more attractive option than building one around Gilbert Arenas. But they also reflect the differences in the number of super-wealthy people in these cities. In 2004, there were 14 people from the Miami metro area3 on the Forbes 400 list of America’s wealthiest people, compared to eight from Washington and seven from Philadelphia. The differences have grown since then: On last year’s Forbes 400 list, whose threshold was about $1.3 billion in net worth, there were 26 really rich people in Miami, compared to eight in Washington and just three in Philly.4
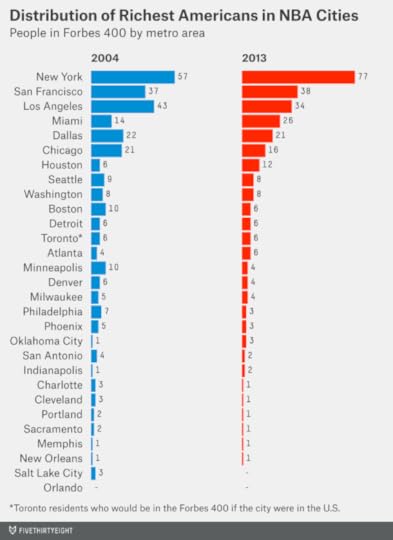
The correlation between the rate of increase in franchise value and the number of billionaires in a metro area has been reasonably strong,5 as I’ve mentioned, with the Sonics/Thunder representing the main outlier. This helps explain why the Golden State Warriors have seen their value increase so much, for instance. The San Francisco-Oakland metro area6 ranks 11th in the U.S. in population and eighth in gross domestic product. But it has ranked second or third in billionaires, behind only New York and sometimes Los Angeles, depending on the year.

Why do we see this relationship? Owners of sports franchises tend to hold onto their teams for a long time — the average NBA franchise last changed hands 14 years ago. In a period that long, the player roster will completely turn over, perhaps several times. The coaching and front office staff will very likely turn over, too. A team’s uniform might change; its
The coefficient on the 2004 franchise value variable is statistically significant and negative. What that means is that a franchise can be overvalued by Forbes, and prone to seeing its value revert to the mean, when that value is out of line with the number of billionaires in the area.
We can use this regression equation to create estimates of NBA franchise values that may be more reliable than Forbes’s. (The process for this is explained in the footnotes.9) I calibrated the estimates such that the average value of an NBA franchise is the same as what Forbes lists — about $630 million. (The NBA would probably contend that Forbes’s estimates are low across the board — based on the recent sale prices of the Sacramento Kings and the Milwaukee Bucks, for instance — but our interest here is mainly in seeing how franchises are valued relative to one another.) Because the estimates are not all that precise, I’ve listed them as a range based on their standard error.
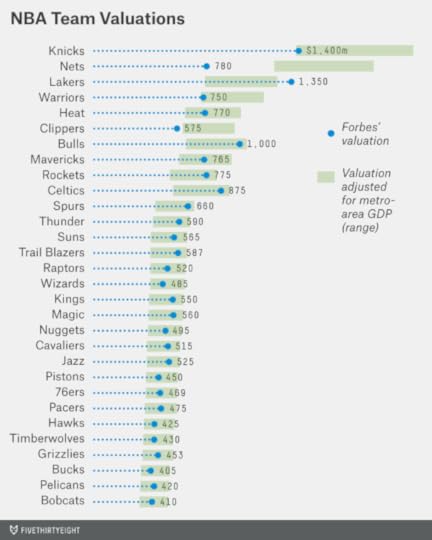
For the Clippers, for instance, the range runs between about $580 million and $950 million. So the billion-dollar estimate might be a little high, but the Forbes valuation of $575 million is probably too low.
There are two other teams whose Forbes valuations fall outside the recalibrated range. One is the Brooklyn Nets, which our formula estimates is worth between about $900 billion and $1.5 billion, and not the $780 million that Forbes estimates. Perhaps Mikhail Prokhorov knows what he’s doing in throwing his resources behind establishing the Nets as a major brand in New York. The number of billionaires in New York continues to skyrocket — so he’ll have plenty of people to sell the franchise to at a profit down the line.
The other team that falls outside of the range is the Lakers. The formula implies that their Forbes valuation, at $1.35 billion, is a little too high.
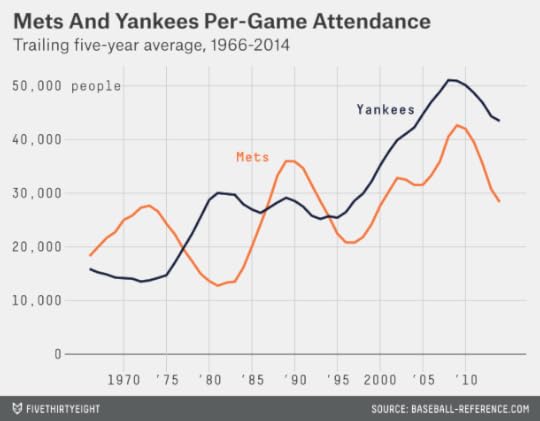
I personally don’t think the Lakers would have much trouble selling for something in that range if the team were put on the market today. But the logic behind the calculation is something like this: Sure, the Lakers have a much more powerful brand than the Clippers, but they don’t have much of an advantage apart from that brand. The two teams play in the same city, in the same arena. The Clippers have the better roster and a very good coach. The brand advantage can shift over time: At various points in the past 50 years, for instance, the New York Mets have outdrawn the New York Yankees. Another couple years of Blake and CP3 making deep runs into the playoffs while the Lakers struggle with the albatross of Kobe Bryant’s contract will erode some of the Lakers’ edge.
Are the Lakers still worth more? Yes, but the formula implies that they should be worth 20 or 25 percent more than the Clippers — and not 135 percent more, as the Forbes valuations say. Perhaps that means the Clippers are undervalued and not that the Lakers are overvalued. If you’d consider buying the Lakers at the Forbes price of $1.35 billion, and would require a 25 percent discount to take the Clippers instead, that implies you’d pay about $1.1 billion for the Clips.
The Clippers’ other big handicap, of course, has been Donald Sterling. But that problem resolves itself the moment he sells. He may be banned from basketball. He may have embarrassed himself and his franchise. But if he sells quickly — before doing further damage to the Clippers’ brand — he could have a billion-dollar check coming his way.

April 30, 2014
Are White Republicans More Racist Than White Democrats?
The comments made by Cliven Bundy and Donald Sterling this month demonstrate that the U.S. is far from a colorblind society. And the reaction to their comments has drawn further attention to the fraught relationship between racism and partisan politics. When racist statements by high-profile figures are made public, some news commentators become preoccupied with trying to discern the speaker’s political affiliation.
We were curious about the long-term trends in racial attitudes as expressed by Americans in polls. Are Republicans more likely to give arguably racist responses in surveys than Democrats? Have the patterns changed since President Obama took office in 2009?
Like The New York Times’ Amanda Cox, we looked at a variety of questions on racial attitudes in the General Social Survey, which has been conducted periodically since 1972. The difference is that we looked at the numbers for white Democrats and white Republicans specifically, based on the way Americans identified themselves in the survey.1 Our focus was only on racial attitudes as expressed by white Americans toward black Americans (of course, racism can also exist between and among other racial groups).
Two warnings about this data. First, survey responses are an imperfect means of evaluating racism. Social desirability bias may discourage Americans from expressing their true feelings. Furthermore, the sample of Democrats and Republicans in the survey is not constant from year to year. If the partisan gap in racial attitudes toward blacks has widened slightly in the past few years, it may be because white racists have become more likely to identify themselves as Republican, and not because those Americans who already identified themselves as Republican have become any more racist.
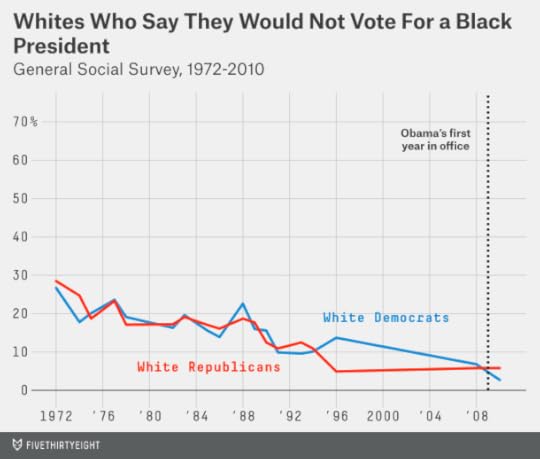
We looked at eight questions from the General Social Survey. First, how many white Americans say they wouldn’t consider voting for a black presidential candidate? In the 2010 edition of the survey, the most recent version to ask this question, 6 percent of white Republicans and 3 percent of white Demorcats said they would not. However, it’s possible that these responses have something to do with Obama himself. In 2008, when Obama was a candidate rather than a president, the numbers were about equal among Republicans and Democrats. And at earlier times, white Democrats were more likely than white Republicans to say they wouldn’t vote for a black president. In 1988, for instance, when Jesse Jackson was running for the Democratic nomination, 23 percent of white Democrats said they wouldn’t vote for a black president, compared to 19 percent of white Republicans.2
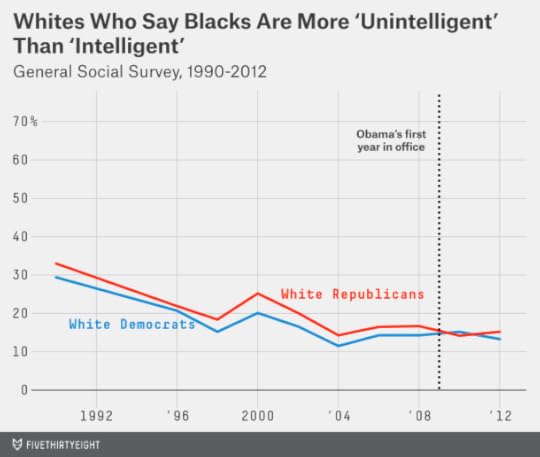
We can also look at whites’ willingness to express negative feelings about blacks. From 1990 to 2008, white Republicans were just slightly more likely than white Democrats to say they considered blacks to be more “unintelligent” than “intelligent.” However, the numbers have fallen over time, and the small partisan gap erased itself in the past two surveys, 2010 and 2012, under Obama’s presidency.
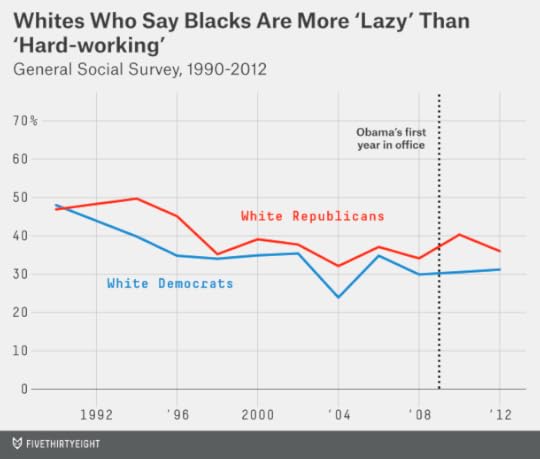
Another question asked respondents whether they regard blacks as more “lazy” or “hard-working.” White Republicans are slightly more likely than white Democrats to characterize blacks as “lazy,” and the numbers haven’t changed much over time.
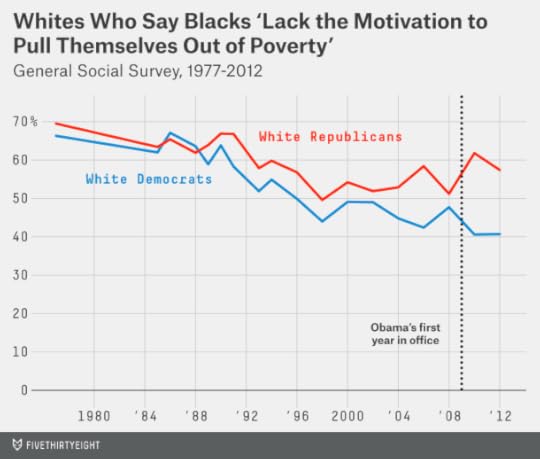
A related question asked respondents whether they think blacks lack the motivation to pull themselves out of poverty. The numbers on this one are high: In the 2012 survey, 57 percent of white Republicans and 41 percent of white Democrats agreed with the statement. This is also one question where the partisan gap has increased since Obama took office.
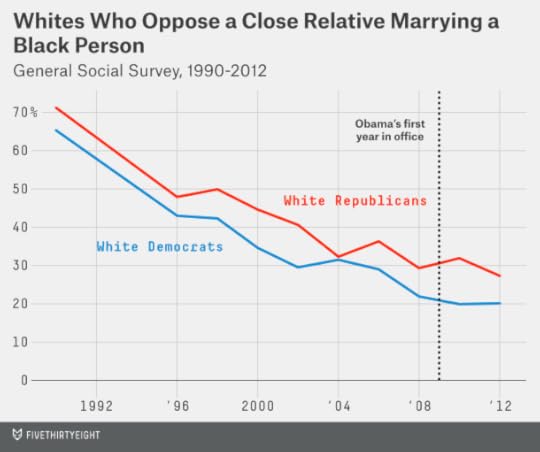
What about more personal attitudes toward interactions with African-Americans? A longstanding question on the survey has asked whites whether they’d object to a close relative marrying a black person. The percentage of white people saying so has fallen drastically over time, to 20 percent of white Democrats and 27 percent of white Republicans as of 2012. In 1990, by contrast, 65 percent of white Democrats and 71 percent of white Republicans said they’d object to an interracial marriage of a close relative.
Another question asked respondents whether they’d object to living in a half-black neighborhood. As with the marriage question, the number of white Americans saying they would object has fallen quite a bit since the 1990s. There generally hasn’t been much of a partisan gap on this question.

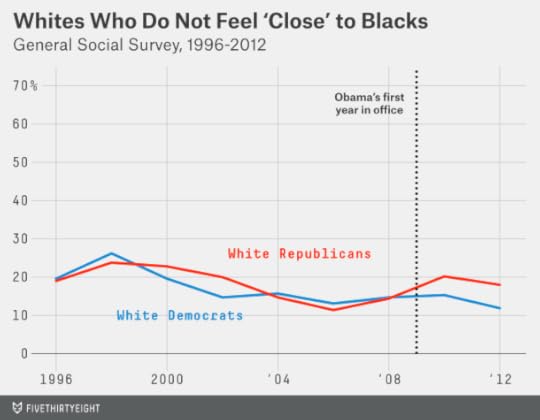
Since 1996, the survey has also asked respondents whether they feel “close” to blacks. Closeness is obviously a subjective quality, and failing to feel close to those in another racial group doesn’t necessarily imply racism. However, a survey question like this one may also be able to pick up on implicit racial attitudes that respondents would feel less comfortable asserting in questions about things like interracial marriage.
This question, in contrast to many of the others, has shown little change over time. It has also shown little partisan gap, although the number of white Republicans saying they don’t feel close to blacks has increased some since Obama took office.
A final question asked Americans whether they think society spends too much money trying to improve the conditions of blacks. This is the most overtly political of the questions that we’ll study. It also shows the largest partisan gap of any of the questions, and one that has increased since Obama took office.
In 2012, 32 percent of white Republicans said they thought society was spending too much money trying to improve blacks’ conditions, compared to just 9 percent of white Democrats. However, it’s important to note that some of the partisan gap may reflect attitudes toward government spending, rather than toward African-Americans specifically. For example, in 2012, 16 percent of white Republicans, but just 1 percent of white Democrats, said they thought the U.S. was spending too much money on trying to improve the education system.

Obviously, measuring racism is challenging – through surveys or by other means. If you take the question about voting for a black president as the best indicator of racism, then only about 5 percent of white Americans admit to racism toward blacks. If you regard the question about whether blacks lack motivation as indicative of racial antipathy, then about half of them do.
We combined the responses from the eight questions into one index of negative racial attitudes. We accomplished this by averaging the number of white Americans who provided the arguably racist response to each survey item, extrapolating the value for years in which the General Social Survey didn’t ask a particular question based on the long-term trend in responses to it.

As of 2012, this index stood at 27 percent for white Republicans and 19 percent for white Democrats. So there’s a partisan gap, although not as large of one as some political commentators might assert. There are white racists in both parties. By most questions, they represent a minority of white voters in both parties. They probably represent a slightly larger minority of white Republicans than white Democrats.
Fortunately, the expression of racism by whites toward blacks has decreased over time, and for Americans in both parties — at least, according to this survey. In 1990, the index of negative racial attitudes stood at 40 percent for white Democrats and 41 percent for white Republicans.
There hasn’t been much of an overall increase or decrease in the index since Obama took office. On average, between the 2004 and 2006 editions of the surveys — the last two before Obama was either a president or a candidate — the index of negative racial attitudes stood at 22 percent for white Democrats and 26 percent for white Republicans. Those values are within the margin of error for those in the 2010 and 2012 surveys.
If there’s a discouraging trend, it’s not so much that negative racial attitudes toward blacks have increased in these polls, but that they’ve failed to decrease under Obama, as they did so clearly for most of the past three decades.

Nate Silver's Blog
- Nate Silver's profile
- 729 followers


