
Nate Silver's Blog, page 175
April 16, 2014
When April Snow Showers Blanket Spring Flowers
It’s the middle of April — and it’s snowing as I write this in New York City. This isn’t quite as unusual as you might have gathered from the reaction on Twitter. Based on data collected in Central Park dating to the 1860s, 64 percent of New York Aprils have experienced at least some snow, although it usually comes earlier in the month.
Nonetheless, New York’s snowfall patterns throw off my Midwestern sensibilities. As compared to the winters I grew up with in East Lansing, Mich., and Chicago, the snow here seems to arrive too late and stay too late.
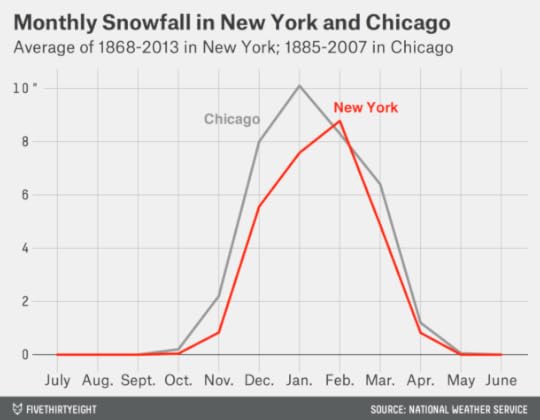
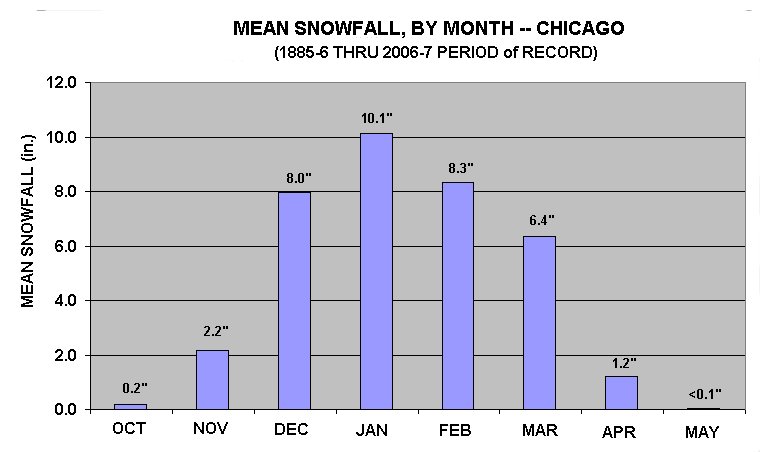
Chicago’s peak month for snow is January — it snows an average of 10.1 inches. This doesn’t make winter much fun to experience. But it gives the season a certain symmetry, a bell curve centered around the turn of the year. By mid-to-late January, you’re over the hump. Michigan’s snowfall patterns are similar, so I’d assumed this it how it is just about everywhere.
But like snowflakes, it seems, no two snowfall patterns are alike. In New York, 51 percent of the snowfall occurs in February or later. (Meteorologists define snowfall totals by the period from July 1 to June 30.) February is the snowiest month in New York, at an average of 8.8 inches. March (4.9 inches) is almost as snowy as December (5.6 inches). April snow is rare, but no rarer than in November.
While New York’s snowfall is shifted late in the season, Buffalo’s comes early. There, 37 percent of snow occurs before Jan. 1, as compared with 29 percent in Chicago and 23 percent in New York. This is not such a relief, however: Buffalo is so snowy overall that it gets more snow than New York and Chicago combined from Jan. 1 onward.

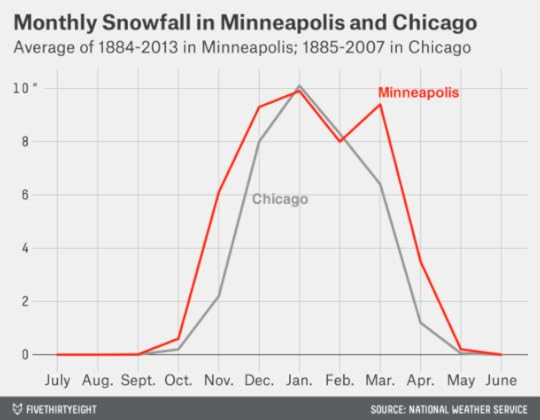
Minneapolis has it a little easier. In the dead of winter there, the air is often too dry to carry much moisture, so the city has a long, flat snowfall peak that persists from mid-November through late March and looks something like Devils Tower in Wyoming. (Oddly, it snows slightly more in March than in February there.)
But Denver’s snowfall pattern might be the most unusual of all. The Mile High City has a dual-peaked distribution, with the first peak of snow in November and December, and a second and higher peak in March and April. It snows an average of 9 inches each April in Denver — more than in Buffalo, Chicago, New York and Minneapolis combined.
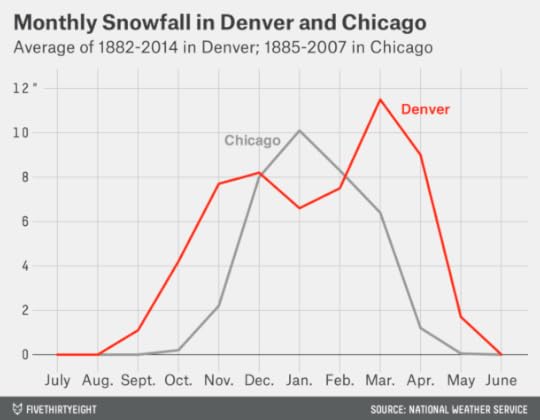
What accounts for Denver’s precipitation patterns? The Western Regional Climate Center has a good explainer. Denver, being a long way from moisture sources such as the Pacific Ocean, is among the drier major cities in the United States. Most storms travel west to east in the Northern Hemisphere, and most of their moisture is soaked up by the Rocky Mountains before they reach Denver. But spring and summer can bring warm, moist air from the south, sometimes producing violent storms. By May and June, most of that precipitation will fall as rain, but it can come as snow — sometimes blizzards — early in Colorado’s spring.


April 15, 2014
Do Pulitzers Help Newspapers Keep Readers?
The 2014 Pulitzer Prizes were announced Monday afternoon. Congratulations to all the finalists and winners of the annual journalism awards. We’re fans of high-quality journalism at FiveThirtyEight, and we’re hoping to see the organizations that produce it succeed financially as well as journalistically.
The economics of newspaper publishing remain very challenging, of course. So I wanted to see whether there was any relationship between the Pulitzer Prizes and a newspaper’s commercial success. Are consumers gravitating toward news outlets that produce work of Pulitzer quality? Or are these newspapers struggling even more than others?
I looked up daily circulation figures for the top 50 U.S. newspapers as of 2004 and how much circulation had increased or decreased as of 2013. I then searched the Pulitzer database for how many winners and finalists those newspapers have had since 1990. We’ve posted all of this data at Github.
Topping the Pulitzer ranks is The New York Times, which by my count has had 117 winners and finalists since 1990. (My totals may be inexact because the Pulitzer database can list a newspaper under different variations of its name, or the attribution of an award may otherwise be unclear.) The Times’ print circulation fell by 35 percent between 2004 and 2013. However, the paper also sells digital subscriptions, which the Alliance for Audited Media now includes as part of its circulation figures. Counting those, Times subscriptions were up 67 percent between 2004 and 2013.
Unfortunately, the Times is something of an outlier. The Washington Post has had 100 Pulitzer winners and finalists since 1990, but its total circulation was down 38 percent from 2004 to 2013 (counting digital subscriptions). The Los Angeles Times, with 85 winners and finalists, saw its circulation drop 34 percent over the same period, while The Boston Globe, with 41 winners and finalists, experienced a 45 percent decline.
Overall, the relationship between Pulitzer Prizes and changes in circulation is very noisy, as can be seen in the chart below. The very modest positive correlation in the chart is mostly the result of The New York Times alone. Were digital subscriptions not counted for the Times and other newspapers, the correlation would be essentially zero instead.

Does that mean that newspapers might as well forget about quality as an economic strategy? That’s not what this data says. There is a relationship between Pulitzer Prizes and circulation (the correlation is .53 among the 50 newspapers listed here). It’s just that this relationship hasn’t changed much from 10 years ago. The vast majority of newspapers have seen their circulations decline; the ones that win a lot of Pulitzers have suffered about as much as the ones that don’t. You could spin this result as a negative for high-quality journalism — newspapers that win Pulitzers are doing no better at retaining their readers — or as a positive — almost all newspapers are struggling, but the ones that win Pulitzers continue to have more readers.
This is just a quick take, of course. Newspaper sales are affected by all sorts of factors, and counting circulation is not straightforward in the digital age. We encourage you to explore the data yourself.
A couple of further notes. First, in the file we’ve provided, we’ve broken down Pulitzer Prizes into two periods, 1990-2003 and 2004-2014. That’s because, if we’re being very precise, the number of Pulitzers since 2004 can’t be said to “predict” circulation changes from 2004 onward because these things occurred concurrently. (It could be that commercially successful newspapers can afford to reinvest in categories like investigative journalism — meaning that sales predict Pulitzers rather than the other way around.) However, taking the Pulitzer numbers from 1990-2003, from 2004-2014 or over the entire period from 1990-2014 makes little difference in the results.
Second, we’ve listed the New Orleans Times-Picayune as having experienced a 100 percent drop in daily circulation. That’s because the paper no longer publishes a daily print edition; instead, it publishes on Wednesdays, Fridays and Sundays.
Finally, the San Jose Mercury News now counts sales of the Contra Costa Times and the Oakland Tribune as part of its figures. To provide for a fairer comparison, we’ve gone back and added the Contra Costa Times’ and Oakland Tribune’s circulation numbers to the San Jose Mercury News’ circulation totals for 2004. We’ve also included the Oakland Tribune’s 1990 Pulitzer Prize in the Mercury News’ figures.

April 14, 2014
What If An Evil Commissioner Turned Hank Aaron’s Homers Into Singles?
Last week I wrote about Hank Aaron, who recently celebrated the 40th anniversary of his record-breaking 715th home run. I concluded that Aaron would still have been a great player — and would very likely have made the Baseball Hall of Fame — even if all of his home runs had been counted as singles instead.
Or at least — that’s almost what I wrote. What I actually wrote left a lot of room for interpretation (emphasis added from original):
What if Aaron had never hit a home run? What if those 755 round-trippers had fallen for base hits instead? (If we’re trying to isolate the effect of his power, that seems like the fairer way to do it, instead of turning them into popups or something.) Would he still be a Hall of Famer?
If all of his homers had been singles, Aaron would still have his 3,771 hits.
The ambiguity is over the means by which we’re turning Aaron’s home runs into singles. When writing the original post, I’d imagined that this was accomplished by some sort of accounting trick. After Aaron retired, some Evil Commissioner decreed that all of Aaron’s homers would be counted as singles in baseball’s record book (like how the NCAA sometimes retroactively forfeits a team’s wins after it’s determined to have used an ineligible player); but it wouldn’t have changed what happened on the field.
But what if the change had occurred on the field instead? So as not to violate any laws of physics, we can imagine it happened by means of a ground rule. Before Aaron made his major league debut, our Evil Commissioner decreed that any ball hit over the fence in fair territory by Henry Louis Aaron would be counted as a single rather than a home run. This rule applied to Hank Aaron and only to Hank Aaron. Everybody knew about the rule, including Hank Aaron, the pitchers who faced Hank Aaron, and the teams who employed Hank Aaron, and they were free to adjust their strategies accordingly.1
This thought experiment is starting to get a bit complicated. Still, it gets to the point that the economists Scott Sumner and Tyler Cowen have made, which is that changing the ground rules for Aaron would have changed the way he and the pitchers who faced him approached the game. It thereby might have affected the rest of Aaron’s batting line and not just his home runs. There are several such effects to consider.
Aaron would have drawn fewer walks
The number of walks drawn by a hitter is partly a function of his plate discipline and partly a matter of how much the pitcher fears him. The reason to risk walking a hitter, as Cowen notes, should be largely a function of his extra-base power. There’s not much reason to pitch around a singles hitter and give him a free pass to first base when most of the time the best he’s going to do is get to first base anyway by means of a base hit.
This is clearest in the case of intentional walks.2 In the 2013 season, the correlation between a hitter’s rate of intentional walks drawn and his isolated power was .44. The correlation between intentional walks and his rate of singles per at-bat was essentially zero (.03).
Aaron’s unintentional walks would probably also have declined if he weren’t allowed to hit home runs. According to data compiled by Fangraphs, the percentage of pitches thrown in the strike zone to major league hitters varies between about 40 percent and 55 percent. The hitters on the low end of the range are power hitters (Ryan Howard, Prince Fielder, Vladimir Guerrero, Pablo Sandoval); those at the top end are singles hitters (David Eckstein, Jason Kendall, Chone Figgins, Juan Pierre). A homerless Hank Aaron would have seen considerably more strikes.
Aaron would have hit for a higher batting average
Seeing more pitches in the strike zone would have made it easier for Aaron to make contact. From 2009 to 2013, the league batting average for at-bats that concluded on a pitch thrown within the strike zone was .291; for pitches outside the strike zone, it was just .175.3 (This research was provided to me by Mark Simon of ESPN Stats & Info.)
A quick calculation from these figures shows that if Aaron finished an additional 10 percent of his at-bats on pitches thrown inside the strike zone, he’d boost his career batting average by 12 points (from .305 to .317). However, that’s a crude estimate. We’d also have to consider how Aaron and the pitchers and defenses who faced him would have changed their whole approach to the at-bat.
There’s reason to think that Aaron would have adapted to these conditions more readily than his opponents. He was a smart and versatile hitter; Sports Illustrated’s 1958 scouting report described how Aaron was very difficult to defend because he could hit to all fields and leg out infield hits (emphasis added from original):
Man who excites the experts is Henry Aaron, of the loose, free swing. Called “best wrist hitter in baseball,” he’s actually an arm hitter, lashing pitch with masterful coordination of forearms, biceps, wrists and bat. Slumped through June but has had best record in league since then. No set way to fix defenses against him, since he hits to all fields, bunts beautifully, is fast enough to beat out infield hits. He’s also a good, if lackadaisical, outfielder, with a fine arm. The team’s big man.
Furthermore, we have some experimental evidence on cases in which Aaron had an incentive to hit for contact. He performed very well in these situations.
Singles increase in value relative to home runs when there are runners in scoring position. For his career, Aaron hit .322 with runners in scoring position.4
Singles become more valuable still when there are runners in scoring position and the score is tied late in the game. In these cases, either a single or a homer will usually score the go-ahead run and win the game, so the hitter should be hitting for contact and the pitcher should be trying to prevent contact. I looked for at-bats on Baseball-Reference.com’s Play Index when Aaron hit with runners in scoring position in the seventh inning or later of a tied game. It’s a small sample — just 139 at-bats. But Aaron hit .331 in these situations for his career.
Another natural experiment comes from cases in which home runs aren’t necessarily less valuable, but are harder to hit. Of the ballparks Aaron played at regularly during his career, the one least conducive to home runs was almost certainly Forbes Field in Pittsburgh, where the left field and right field power alleys were 392 and 395 feet away from home plate, respectively. From 1954 (Aaron’s debut season) until the Pittsburgh Pirates’ last full season in Forbes Field in 1969, the Pirates hit 65 percent more home runs in road games than at Forbes Field. They also hit for a slightly higher batting average in Forbes Field than on the road, although the difference was modest (.267 versus .259).
How about Hank Aaron? He adapted wonderfully to Forbes Field, hitting .338 for his career in 639 at-bats there. That’s a little bit better even than Pirates great Roberto Clemente (.329), whose game was tailor-made for Forbes Field.
Aaron might have seen less playing time
The no-homers ground rule might have made teams more reluctant to employ Aaron, especially toward the end of his career. After breaking the home run record as a member of the Atlanta Braves, Aaron played two farewell seasons as a designated hitter for the Milwaukee Brewers in 1975 and 1976. He hit just .234 and .229 during those seasons. The Brewers were terrible back then, but they might not have had much patience for Aaron if he didn’t compensate for his poor batting averages with occasional home runs.
It’s also plausible that the start of Aaron’s major league career would have been delayed, but this case is more debatable. Aaron’s potential as a singles hitter would have been evident quite early. He began his professional career as a 17-year-old in the Negro Leagues, where he hit .366 in recorded at-bats as a member of the Indianapolis Clowns. Purchased by the Braves for $10,000, he then hit .336 and .362 in minor league seasons in 1952 and 1953.5
Aaron might have stolen more bases
In the comments on my original post, some readers noted that if Aaron had hit more singles, he’d have had more opportunity to steal bases. This is true — although I also have Homerless Hank drawing fewer walks and perhaps getting less playing time than the real Aaron, which would counteract his increased rate of singles.
It’s probably the case, though, that Aaron could have stolen more bases if he’d wanted to. He was reasonably fast early in his career, as the Sports Illustrated scouting report mentions. But the stolen base was not in vogue in the 1950s and Aaron rarely attempted to steal. Steals became a much more popular strategy in the 1960s, however, and Aaron proved to be a proficient base-stealer. He stole 240 bases during his career and was successful on 77 percent of his steal attempts, leading the National League in stolen base percentage in 1966 and 1968. His high rate of success suggests that Aaron may have left a few opportunities on the table. Perhaps if he had been cast as a singles hitter, his teams would have expected him to be more active on the bases. He presumably also would have hit first or second in the batting order rather than third or fourth, which means he’d reach base more often with second base open.
Aaron might have hit doubles and triples at a higher rate
If Aaron had only been credited with singles on balls that cleared the fence, he would have had reason to swing for the gaps more often in an effort to hit doubles and triples.
In general, however, it’s not all that easy for players to try to hit doubles. The league leaders in doubles change quite a lot from year to year and the lists mostly comprise good overall hitters who play in stadiums like Fenway Park that are conductive to doubles. Still, none of those hitters faces incentives where doubles are actually more valuable than balls hit over the fence. As the scouting reports and batting splits makes clear, Aaron could hit to all fields and was smart about adapting his approach to the situation. I imagine that he’d find a way to hit a few more doubles and triples.
Summing up
The real Hank Aaron hit for a .305/.374/.555 “slash line” (batting average/on-base percentage/slugging percentage). If all his home runs had been changed to singles after the fact, his line would have been .305/.374/.371 instead. But this doesn’t account for the changes Aaron and the pitchers might have made as they adapted to the ground rule.
It’s just a guess, of course — but I imagine that Aaron would have hit somewhere in the .320s as a result of seeing more strikes and changing his approach to make more contact. His slugging average would have gone up accordingly, perhaps also boosted by a few extra doubles and triples. However, he would have drawn fewer walks, which could offset any gains in his on-base percentage. I envision his slash line as being something like .325/.375/.405, which is reasonably similar to Rod Carew’s.
I don’t think Homerless Hank would have been in any jeopardy of failing to notch 3,000 hits. He may even have reached 4,000. The real Hank Aaron had 3,771 hits, and I have Homerless Hank hitting for a higher batting average. I also have him drawing fewer walks, which means more opportunities to put the ball in play. In fact, a .325/.375/.405 batting line would translate to roughly 4,150 hits given the number of plate appearances Aaron had. That would put him in striking distance of Ty Cobb, who had 4,189 hits. (Pete Rose surpassed Cobb’s record in 1985 and finished with 4,256 hits.)
I also imagine that Homerless Hank wouldn’t have been very productive in the last couple of seasons of his career; his batting average over his final three seasons was .244. Teams don’t normally have much interest in singles hitters who hit .244. Still, they sometimes find spots for players who are pursuing career landmarks; Rose was somewhere between marginally productive and counterproductive after the age of 40, and yet he got (and gave himself as player-manager) another 2,469 plate appearances. If the Braves or the Brewers had been so generous to Aaron, it’s possible the Home Run King would have ended up as baseball’s Hit King instead.

April 12, 2014
Like Bush, Many Republicans Are Moderate on Immigration
The Republican Party has grown more conservative over the past couple of decades. But news commentators sometimes wrongly imply that GOP voters take an extremist position on every issue.
As I described on Friday, for example, Jeb Bush’s support of Common Core educational standards isn’t likely to hurt him if he runs for president in 2016; the issue is neither all that relevant to most Republicans nor all that divisive. If candidates running to Bush’s right are looking for a wedge issue, they’ll probably have some better choices.
What about immigration policy, for instance? Bush has staked out a moderate position on immigration, both rhetorically and substantively; last Sunday, he described immigrants who come to the United States illegally looking for work as having committed an “act of love.”
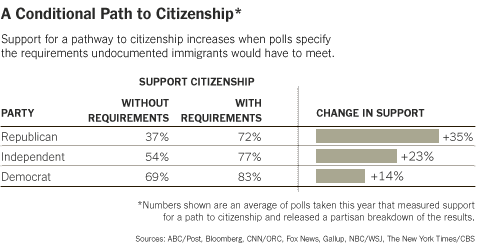
Immigration is a higher visibility issue than education policy. Even so, many Republican voters are sympathetic toward immigrants and immigration reform. Last year, FiveThirtyEight’s Micah Cohen compiled polls on Republican attitudes toward a pathway to citizenship for unauthorized immigrants and found that support varied depending on the requirements. An average of 37 percent of Republicans supported a pathway to citizenship without requirements, while 72 percent supported one if additional conditions, like the payment of back taxes and a criminal background check, were met.
What about attitudes among Republican primary voters, who are often more conservative than Republicans as a whole? Their views are also more equivocal than you might assume from news accounts. The 2012 exit poll of Republican primary voters in Arizona, which has some of the country’s most conservative immigration policies, asked them what should be done about “illegal immigrants working in the U.S.” Only 34 percent said such immigrants should be deported; the same fraction, 34 percent, said they should be offered a chance to apply for citizenship. (The remaining 28 percent of voters said these immigrants should be allowed to stay as temporary workers.)
We can also compare attitudes on immigration to views on other major issues. I’ve done that in the chart below. It provides the partisan split on a pathway to citizenship (both with and without requirements) and on abortion, education, global warming, gun control, health care, inequality, the minimum wage, same-sex marriage and U.S. policy toward Israel, as based on recent polls.
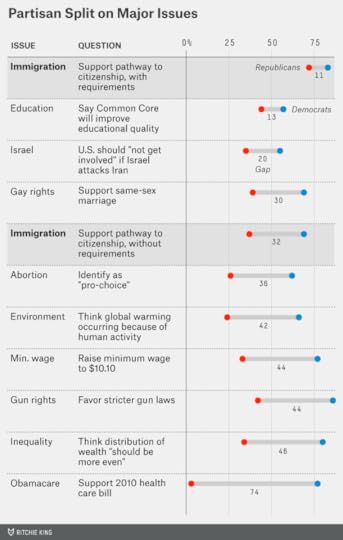
A pathway to citizenship with requirements is the least divisive of these issues; 72 percent of Republicans support one, as compared with 83 percent of Democrats. A pathway to citizenship without requirements is more controversial, and produces a 32-point partisan gap between Democrats and Republicans.
Many issues are more divisive. A recent Quinnipiac poll on the 2010 health care bill — known as Obamacare — found that 77 percent of Democrats supported it, compared to just 3 percent of Republicans, making for a 74-point partisan split. The partisan divide on abortion, global warming, the minimum wage, gun rights and the distribution of wealth was also larger than that for immigration.
This is not to say that Bush’s position on immigration is risk-free. These polls do not measure the intensity of support; it may be that Republicans who are opposed to immigration reform feel more strongly about it than those who support it. And backing immigration reform in theory can be easier than articulating policies toward it; Marco Rubio, a Florida Republican who led an effort to pass an immigration reform bill in the Senate last year, has since seen his standing decline among potential GOP primary voters.
But Bush’s stance on immigration also has rewards. The GOP is trying to improve its performance among young voters and Hispanics, groups that largely support immigration reform. Organizations like the U.S. Chamber of Commerce, which could direct considerable resources toward Bush in the primaries, also support immigration reform.
Furthermore, breaking from the party orthodoxy could allow Bush to portray himself as a “compassionate conservative” at a time when the Republican Party has a strongly negative image among moderate and independent voters. The extent to which the news media exaggerates the uniformity of Republican opposition to immigration reform could help Bush in this regard. The “narrative” of the campaign may be that Bush has taken an exceptionally bold position, when in fact many constituencies within the Republican Party share his views.

April 11, 2014
Vance McAllister’s Days in Congress Are Probably Numbered
Rep. Vance McAllister of Louisiana is feeling the heat after he was caught on camera kissing a married staffer, with some Republican Party officials calling on the congressman of almost five months to resign. But what are McAllister’s chances if he resists the calls to step down and runs again this year?
According to The Washington Post, 15 of 38 elected federal officials caught in a sex scandal in the past 40 years have resigned or retired. Of the 23 who ran for re-election, 15 won, or 65 percent. That re-election rate is much lower than the overall re-election rate for federal office holders, which is close to 90 percent in most years. Still, sex scandals are not always fatal, as Sen. David Vitter, also a Louisiana Republican, can attest.
Assessing McAllister’s odds is complicated for two reasons. One is a statistical issue: There are probably some selection effects for which scandal-plagued candidates choose to run for re-election and which do not. Those who commit the most unforgivable indiscretions — for example, cheating on a wife who is dying of cancer – are presumably more likely not to run. With that said, McAllister’s scandal seems fairly typical, and at least not in the John Edwards category of radioactivity.
However, the nature of Louisiana’s jungle primary system adds a further complication. In Louisiana, any number of candidates, regardless of party identification, run against each other in a first round. If no candidate gets 50 percent of the vote, the two with the highest vote totals face each other in a runoff.
When McAllister ran for his seat in a special election last year, he finished second behind another Republican, Neil Riser, and only 3 percentage points ahead of Democrat Jamie Mayo in the first round of voting. He was also just 7 points ahead of a third Republican, Clyde Holloway. But McAllister beat Riser by 19 points in the runoff after Mayo, Holloway and a number of other candidates were eliminated.
If last year’s election were replayed, now with McAllister facing an electoral penalty because of his sex scandal, he probably wouldn’t make it to Congress. A 2011 study of U.S. senators by Nicholas Chad Long of St. Edward’s University in Texas estimated that immoral behavior lowers the vote share of incumbents by roughly 7 percentage points, on average. If McAllister had seen 7 fewer points in the special election, he would have finished third or fourth in the primary and missed the runoff.
The problem with applying Long’s 7-point estimate here is that it’s drawn from two-way general election races, when each party has one nominee. In a general election, many Democratic and Republican voters have strong partisan and policy preferences that can override any personal reservations they might have about a candidate. When there are multiple candidates from the same party competing for the seat, as in a jungle primary, voters can be pickier, finding candidates they like personally and on the issues, too. The same might hold in a runoff were both candidates were from the same party.
McAllister’s chances of winning re-election depend on a lack of serious competition from other Republicans: If he were to survive the jungle primary and make the runoff against a Democrat, he’d probably win. (Mitt Romney carried McAllister’s conservative district by 23 points in 2012, so even a scandal-plagued Republican would have a good chance of winning in that circumstance.)
McAllister is now the incumbent — something he wasn’t last year. That’s one thing working in his favor. But McAllister is unlikely to get a free pass given how competitive his seat was last year; instead, local officials expect Riser or another credible Republican to challenge him.
Candidates have survived worse scandals — especially in Louisiana, where the former governor Edwin Edwards once claimed he couldn’t lose re-election unless “caught in bed with a dead girl or a live boy.” Still, given the chances that McAllister will resign, or that he’ll run again but finish third or worse in the jungle primary, or that he’ll survive the primary but lose the runoff, he’s an underdog to keep his seat.

Jeb Bush’s Stance on Education May Not Be That Controversial
My colleague Harry Enten wrote Thursday about Jeb Bush, the former Florida governor, and his prospects of winning the Republican nomination in 2016. Harry reviewed the political science research and concluded that, in a wide-open GOP field, Bush’s chances are about as good as any other Republican’s.
The case against Bush, as articulated by Ben Smith of BuzzFeed, turns mainly on the notion that Bush’s moderate stances on immigration and education could prove problematic in the primaries.
According to the polls, however, Republican views on both issues are more flexible than Smith and other news media commentators might assume. This post will look at the polling on education reform — specifically, support for the Common Core, which Bush has championed and which sets a set of recommendations for what students should know in kindergarten through high school. We’ll look at the immigration numbers in a subsequent post.
National polling on educational issues is fairly sparse. This may partly be because the federal government exerts relatively little control over education as compared with states and localities. (In 2013, the federal government represented only about 9 percent of education spending, as compared with 27 percent for states and 64 percent for local governments.)
But the Associated Press and the NORC Center for Public Affairs Research last year conducted a poll on education that included a series of questions on the Common Core. One conclusion is that Americans don’t know a whole lot about it — only 26 percent of respondents said they’d heard a “great deal” or a “lot” about Common Core, as compared with 52 percent who said they’d heard little or nothing about it.
The poll then provided a brief description of the Common Core and asked respondents for their opinion about it:
Most states have adopted the Common Core State Standards in mathematics and English language arts. The objective of the Common Core is to provide consistent, clear standards across all states for students in grades K-12.
The poll’s top-line numbers didn’t detail the partisan split in opinion on the Common Core, but I was able reconstruct them by looking at the microdata files that the Associated Press and NORC provided. Those numbers are as follows:
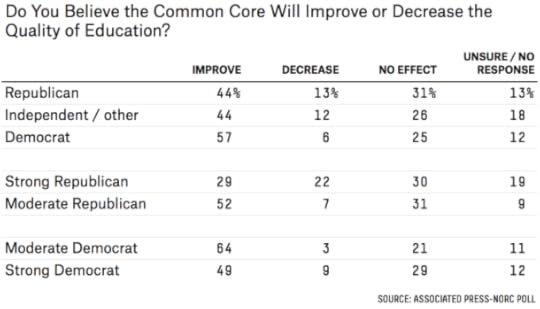
As you can see, the partisan split is not terribly strong on the Common Core. Among Republicans, 44 percent said they thought the Common Core would improve the quality of education, against 13 percent who said it would make things worse. (Another 44 percent either said they thought it would have no effect or had no opinion.) The numbers among independents and voters unaffiliated with a political party were nearly identical to the Republican figures.
Democrats were modestly more likely to be in favor of the Common Core: 57 percent said they thought it would improve educational quality as compared with 6 percent who said it would produce a decline. Still, the partisan split on this issue is mild as compared to most others.
But what about the strongest Republicans, such as those that might participate in the primaries and caucuses in some of the most conservative states?
I also split the results between “strong” and “moderate” Republicans, as respondents described themselves in the survey. Indeed, there is a divide between these groups. Among moderate Republicans, the numbers look a lot like those for Democrats: 52 percent said they thought the Common Core would improve educational quality against just 7 percent who expected a decline. “Strong” Republicans had mixed views; 29 percent said the Common Core would improve educational quality against 22 percent who said it would produce a decline.
So there is some debate within the GOP on the Common Core. But even self-described “strong” Republicans are more likely to think it improves rather than harms educational quality. And relatively few Americans of any political description have strong feelings against it.
Of course, precisely because opinions on the Common Core aren’t all that firm, the politics of it could evolve between now and 2016. Perhaps by that time, a set of voluntary educational guidelines will have come to symbolize an unacceptable intrusion of big government in the mind of GOP primary voters.
If that’s the party’s mood, however, Republicans are likely to nominate an exceptionally conservative candidate who might undermine the party’s chances in the general election. In other words, the universe where the Common Core is a big problem for Bush is one where he had no chance to begin with. In most other universes, Bush’s support of the Common Core should be somewhere between benign and modestly helpful for him.

April 10, 2014
Stephen Colbert Is Popular on the Internet
Stephen Colbert on Thursday was
The third-place entry, just behind Letterman at 13 Arsenios, was a mild surprise: Dave Chappelle, whose show last aired on Comedy Central in 2006. Stewart and Jay Leno closely followed, at 12 Arsenios apiece.
In fairness to Hall, his Google search popularity has significantly increased since his show returned; since September, Colbert’s name has been searched for only about four times as often. But Colbert’s popularity could increase after Thursday’s announcement.
A very technical aside: Our measurement of Arsenios is derived from downloading week-by-week numbers from Google Trends and averaging them, which produces slightly more precise figures than looking at the aggregate numbers. However, there are a number of weeks when Hall’s search popularity was listed as zero by Google Trends. In fact, it was not exactly zero; some people were searching for him. Google Trends lists its numbers on a relative basis, where 100 is the peak week for the most popular search term. When another term is listed at zero, its search volume was very small by comparison, but it may have been anywhere between zero and 0.5, and rounded down to zero. In these weeks, we assume that the host’s search popularity was 0.25 (the midpoint of zero and 0.5) rather than zero exactly.

April 9, 2014
If Hank Aaron Had Never Hit a Home Run, Would He Be a Hall of Famer?
Tuesday was the 40th anniversary of Hank Aaron’s record-breaking 715th home run. Aaron extended his record to 755 home runs, and his record was eventually eclipsed by Barry Bonds in 2007.
I was struck by Joe Posnanski’s reflection on Aaron: The degree to which Aaron’s reputation is associated with the home-run record in some ways does him an injustice. You can think of this post as the nerdier younger brother of Posnanski’s column.
What if Aaron had never hit a home run? What if those 755 round-trippers had fallen for base hits instead? (If we’re trying to isolate the effect of his power, that seems like the fairer way to do it, instead of turning them into popups or something.) Would he still be a Hall of Famer?
If all of his homers had been singles, Aaron would still have his 3,771 hits. Instead of being the second-best home-run hitter of all time, he’d be the third-best singles hitter of all time, after Ty Cobb and Pete Rose. His RBI total would have gone way down; based on the number of runs that Aaron knocked in on home runs and singles throughout his career, I estimate that he’d have 1,232 of them rather than 2,297. But 1,232 isn’t a shabby total; it would rank Aaron 141st all time, in the general vicinity of Derek Jeter, Edgar Martinez and George Sisler. He’d still be a lifetime .305 hitter and have a .374 on-base average.
We can also consider Aaron’s wins above replacement (WAR) and how much of it was produced by home runs. On average, a home run is worth .93 runs more than a single. And according to FanGraphs, each run that Aaron produced above was worth about .11 wins to his team (.1077 if we want more precision). So we can figure out how many wins Aaron created with his home runs by multiplying 755 by .93 by .1077. The calculation comes out to 75.6 WAR. Aaron produced a total of 136.3 WAR, according to FanGraphs. So those home runs, worth 75.6 WAR, represented about 55 percent of his career value.
But Aaron still has 60.7 WAR left over. That’s quite good: Aaron’s revised WAR would rank him 44th among outfielders all time, and there are 67 outfielders in the Hall of Fame (not counting Aaron). Aaron’s WAR without his home runs is comparable to what players like Duke Snider, Kenny Lofton, Willie Stargell, Carlos Beltran, “Shoeless” Joe Jackson, Dave Winfield, Andre Dawson and Richie Ashburn produced with their home runs. A few outfielders with a WAR of about 60 aren’t in the Hall of Fame (Sherry Magee didn’t make it, for example, and Lofton probably won’t get in). But Aaron would seem like a safe bet with his gaudy career-hit total.
I also ran these numbers for the other members of the 500 home-run club. How many of them would have a Hall of Fame case without their home runs?
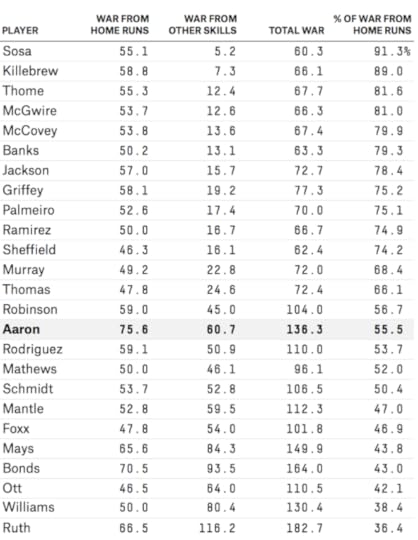
Babe Ruth, Ted Williams, Willie Mays and Barry Bonds (issues with performance-enhancing drugs notwithstanding) would still be slam dunks. A homerless Mel Ott and Mickey Mantle would rate about the same as a homerless Aaron and would probably get in. Jimmie Foxx, Mike Schmidt and Alex Rodriguez would be tough calls. Eddie Mathews and Frank Robinson would probably fall just short. The other 13 members of the 500 home-run club would have no chance.

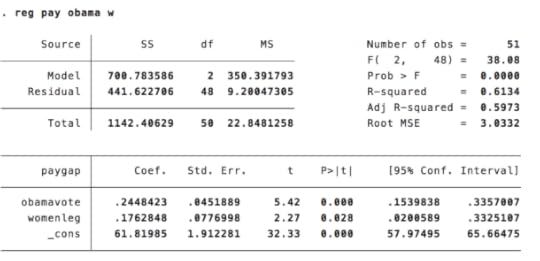
Gender Pay Gap Tracks With Number of Women in State Legislatures
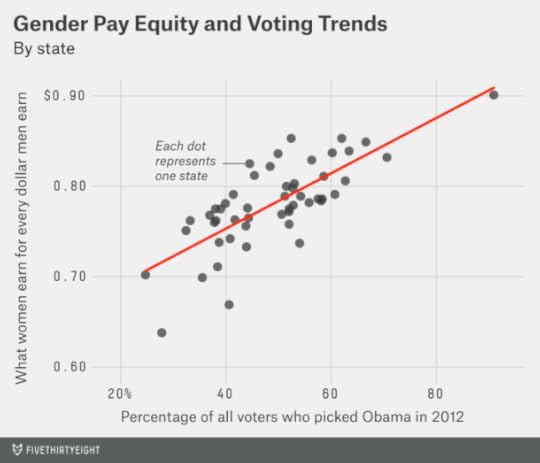
As my colleague Mona Chalabi noted Tuesday, the gap between men’s and women’s salaries varies substantially throughout the country. It’s largest in Wyoming, where women make 63.8 percent of what men do, and smallest in D.C., where they make 90.1 percent as much. (These figures are from the National Women’s Law Center and reflect the “ratio of annual median earnings for women and men working full time, year round.”)
Mona and I were struck by the relationship between the gender pay gap and a state’s political environment. The eight states with the narrowest pay gap voted for President Obama in 2012, as did the District. The six states with the widest pay gap voted for Mitt Romney, often by substantial margins. Overall, the correlation between the share of the vote a state gave to Obama and its ratio of female-to-male earnings is .76.
Just as interesting is that the gender pay gap is correlated with representation in state legislatures. In those states where the pay gap is widest — Wyoming, Louisiana, West Virginia, Utah and Alabama — women occupy an average of 15 percent of seats in the legislature. In places where it is narrowest — the District, Nevada, Maryland, Vermont, New York — they represent 30 percent of the legislature. (I used the D.C. Council as a stand-in for the state legislature.)

For our wonkiest readers: Both variables are statistically significant in a regression where the dependent variable is the gender pay ratio. In other words, they both seem to reveal something about the gender pay gap, independently of one another.
However, it’s still tricky to sort out the cause behind this relationship:
It could be that states with more women in political office pass labor laws that are more favorable to female workers (A causes B).It could be that states where women are earning higher salaries produce a greater number of viable female candidates for political office (B causes A).It could be that both the number of women in office and the salaries earned by female workers reflect the level of discrimination against women or the degree of female empowerment within a state (C causes A and B).It could be that both variables reflect underlying demographic, economic or cultural causes other than discrimination (spurious correlation).The gender pay gap has been the subject of hundreds of academic studies. These studies seek to sort out how much of it has to do with overt or implicit discrimination against women, as opposed to labor force characteristics that are not well accounted for by aggregate statistics.
For example, the gender pay gap is narrower when measured by hourly rather than annual wages; that’s because women tend to work fewer hours than men. Men also tend to be concentrated in higher-paying industries. They may have more educational and work experience, and they may have higher-ranking positions within their organizations.
None of this is easy to sort out. For instance, it may be that women have lower salaries because they have lower-ranking positions, because they have fewer educational credentials, or because they work fewer hours. But those factors could themselves reflect discrimination.
The broad consensus of the literature suggests that while accounting for these factors substantially reduces the gender pay gap, some portion of it remains unexplained and may reflect discrimination instead. That the gender pay gap is correlated with other indicators of women’s status and welfare also suggests that cultural and political factors play some role in determining women’s salaries.

April 7, 2014
Kentucky Injury Makes NCAA Basketball Championship a True Toss-Up
I have a longstanding grievance with the term “toss-up.” It implies an outcome that resembles the toss of a fair coin, one whose prospects are about 50-50. But in political contexts, the term is sometimes applied far too liberally. Any reasonably competitive race is a “toss-up.” On the eve of the 2012 presidential election, for example, Karl Rove described 12 states as “toss-ups,” including Wisconsin and Nevada, where Mitt Romney had not led a poll in months. (Rove nevertheless seemed to be surprised by the election’s outcome.)
Poker players use a related term, “coin flip,” to describe certain hands that get all-in before the flop. Big edges are hard to come by in poker, and so poker players are more precise in their use of probabilistic language. Even so, there is some slack; a matchup between a pair of queens and an ace and king of different suit is often described as a “coin flip,” even though the queens have a 57-43 edge.
But Monday night’s NCAA men’s basketball national championship game? It really is a toss-up, at least according to the FiveThirtyEight forecast model, which gives Connecticut a 50.1 percent chance of winning and Kentucky a 49.9 percent chance.
You may have noticed that our odds changed since Saturday’s national semifinals. (You can find a complete archive of updates to our projections here). Right after Kentucky beat Wisconsin, we had the Wildcats as a 55 percent favorite to beat Connecticut.
But Kentucky’s chances dropped slightly with the
Nate Silver's Blog

- Nate Silver's profile
- 729 followers

