Jeff Seymour's Blog, page 9
May 17, 2013
Have all the shorts covered? - stock market top 2013
The past 2 months -and especially 2 weeks- have seen a rally in risk assets to new record-setting highs. But it has the finger-prints of a short-covering rally.
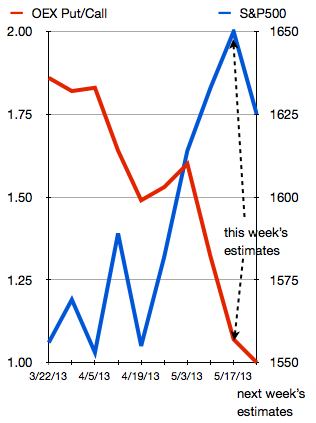
The graph shows the Put/Call ratio for OEX 100 options (the OEX100 being the index for the largest 100 U.S. publicly traded company stocks). The data is weekly. OEX values are an average for the week. The S&P500 shows values at the close of the week.
OEX 100 investors have been covering their short positions at a very fast pace — a major force driving the latest rally. Have all the shorts been squeezed out yet?
Don’t be surprised to see a dramatic rise in the OEX 100 Put/Call ratio as we approach the next rally in early July. Also — don’t be surprised to see the Put/Call ratio on the S&P500 and broad US stock market drop on the next rally –> causing a wide divergence in these put/call ratios — despite extremely high correlations in the underlying assets. I track this divergence in the Greedometer put/call ratio.
May 16, 2013
Greedometer Newsletter posted. Wow! A new all-time record bubble.
This week’s letter is posted. It is full of data showing a wide stretch between the Fed-induced stock market bubble and regional Fed reports showing the U.S. economy at stall speed.
Does the latest record-setting S&P500 bubble cause me concern or doubt about the forecast from the Greedometer and mini Greedometer? Not one bit. Actually, it aligns rather well and reinforces the view that has been slowly painted by the gauges over the past 4 months. The Greedometer has previously warned before 6 collapses in the S&P500 initiated. The fact that the Greedometer has now provided its most violent warning ever does not mean a collapse will not initiate very shortly. It means the pending collapse has more fuel (to drop) than the previous collapses.
May 12, 2013
The Fed is tipping its hand: the QE party is going to end - Let the stock market crash of 2013 - 2014 initiate.
Don’t look now, but Ben Bernanke is warning about excessive risk taking in financial markets, and the use of leverage. Ben is apparently watching for signs of bubbles in asset markets.
“In light of the current low interest rate environment, we are watching particularly closely for instances of ‘reaching for yield’ and other forms of excessive risk-taking, which may affect asset prices and their relationships with fundamentals,” Mr Bernanke said.
I’ve been writing that the Fed must begin to slowly tip its hand that it intends to back away from QE because it knows the point of diminishing returns has been reached. Plus, the Fed knows it must avoid -at all costs- being trapped in a situation where it still has the QE throttles maxxed-out while the US economy enters recession. Were that to occur, the great unwashed would turn desperate because there would be no hope for another magic bullet to save the day. So it must back off the throttles if only to provide the illusion it may come to the rescue once more. The fact that rescue will not work will not be known until further down the road (when someone else has the helm after Ben). Here’s a link to the FT’s article about Ben’s speech –after the market closed on Friday. Link to FT.
As I wrote in last week’s newsletter:
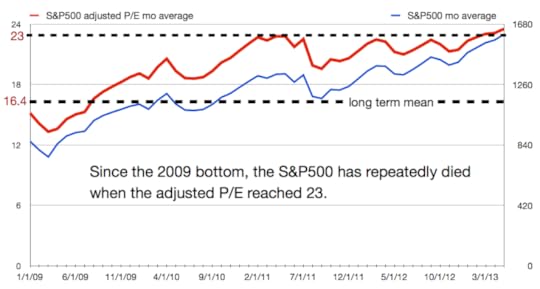
The S&P500 has risen dramatically this year –and none of it from earnings or revenue growth. All of it has been P/E expansion. The adjusted P/E reached 24 last week –46% above the long term average. Bubble!
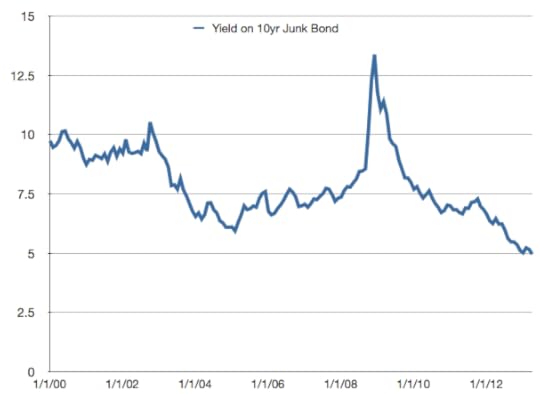
Junk bonds have been bid up in price as investors go in search of yield wherever they can find it — driving junk bond yields down to levels NEVER seen before — to under 5%. Bubble!
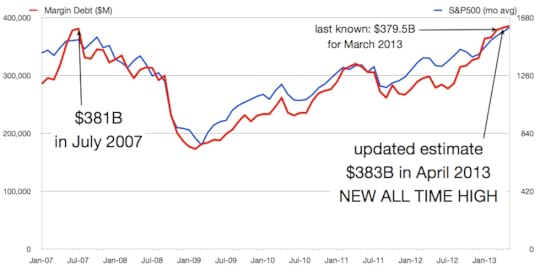
And leverage? How about this fact. NYSE margin debt (buying on margin) almost set a new all-time record in March –and without question will set a new all-time record in April and potentially May as well.
The Fed has to take the training wheels off at some point. Best to do it when the stock market has set a new all-time high. Granted it is unfortunate the S&P500 had to be stretched 155 points above the 200-day moving average (a point only exceeded once — March 2000, so you know what to expect next).
Next week should be interesting.
May 7, 2013
Welcome to the 2013 stock market top - Let the stock market crash begin
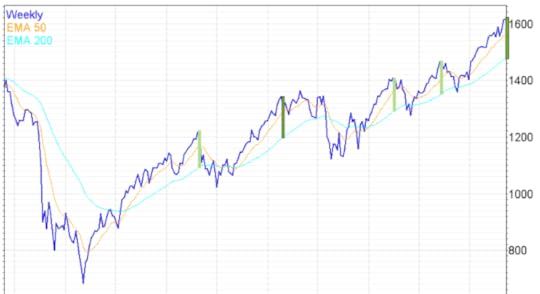
Running out of gas. That’s how I’d describe the latest risk-on rally. I’ll go into this in more detail via examining several Greedometer current input values in this week’s newsletter. But when the market gets this far (nearly 150 points) above the 200-day exponential moving average -and this is somewhat rare- it runs out of gas.
(with thanks to investors intelligence for the data)
The chart above shows the S&P500 and its 50-day & 200-day e.m.a’s. The current bubble is nearly 150 points above the 200-day e.m.a. I’ve inserted a dark green vertical bar to show the extent of the bubble. Only once since the March 2009 bottom has the S&P500 been so bubble-itious. That was in February 2011 (also marked with a dark green bar). What came next was a couple 90-100 point drops and re-tests until early July. Then a very quick drop of nearly 20% ensued that had to be stopped by the Fed and ECB (again).
Look at the other slightly smaller bubbles (light green bars). Each preceded an S&P500 drop. Yet each drop was stopped by Fed / ECB monetary candy. The monetary cavalry had better ride to the rescue later this year or the stock market might just crash next year (where have I read that will probably happen?).
FYI: in order to find a larger bubble (gap above the 200-day ema), I had to go back to March 2000. You remember March 2000 don’t you? The end of the 18-year non-stop U.S. debt party, and the zenith of the tech bubble. Oh yes, and the beginning of a 47% drop in the S&P500 that -you guessed it- was stopped by myopic fiscal and monetary goodies that merely served to re-inflate a larger bubble.
What’s different now? There’s no fiscal candy coming to stop it this time. Nothing but fiscal tightening as far as the eye can see, actually. And what of the monetary cavalry? Think the Fed will be able to stop this one too?
If you’re still holding long equity positions (big, small, value, growth, domestic , international… I don’t care), consider yourself warned. The Greedometer algorithms cannot make a distinction less than 2 weeks, but today sure looks like a good day for a secular stock market peak. Let the stock market crash of 2013 -2014 begin.
May 4, 2013
Acute Risk of Stock Market Collapse Initiating
The highly anticipated Bureau of Labor Statistics (BLS) April Employment Situation (report) was released yesterday morning.
The headline: The U3 rate dropped from 7.6% to 7.5%, and 165,000 new jobs were created. This was better than expected (but still not great). Wall St. had done its usual job of sand-bagging such that many were anticipating a low +100,000 jobs number.
The U3 rate is a near useless statistic since it excludes so many legitimately unemployed people. The much more inclusive U6 rate climbed to +13.9%.
The previous two months employment gains were revised upwards – a combined +114,000 upwards revision.
The household survey showed a spike of nearly +300,000 jobs created, more than reversing a -200,000 hole created in March. But all of that +300,000 figure came from self employment. Not a great sign.
At the rate with which the U3 rate has been dropping, the Fed will reach its targeted 6.5% unemployment rate by January 2014. Never mind the millions of people that have fallen out the back end of the unemployment insurance system without a job — and thus not counted in the U3 or even U6 rate. We’ll have a statistical mirage representing a healthy economy. That’ll be good enough to back off the QE3 – QE4 throttles.
The S&P500 was struggling to get through 1597 — having re-tested it 3 times over the past few weeks. The table was set for the market to begin collapsing if weak employment data came out yesterday. Friday’s report changes little. The risk that has been building for the past 4 months remains acute. We discuss further in the paid portion of the Greedometer Newsletter Special report today.
Greedometer data over the next week is going to be crucially important in understanding the near term risk.
Reminder: The pending collapse will take 1.5 – 2 years to drop 65-70% and come in several dips.
May 2, 2013
Greedometer Newsletter May 2 2013 posted
This week’s Greedometer Newsletter has just been uploaded. You may view it after logging in here: login.
April 26, 2013
The stock market crash approaches. Margin Debt: all time record in sight for April - Greed peaks just before a stock market crash
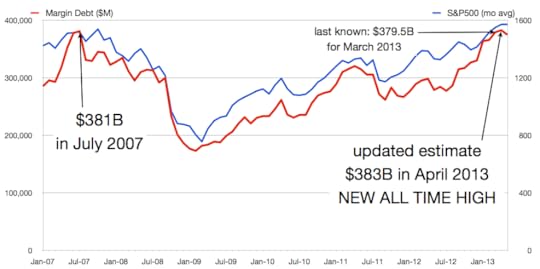
A few minutes ago the NYSE released the Margin Debt number for March: $379.5B. This month’s data (April) will be released near the end of May. My estimate for April is for $383B — eclipsing the all-time margin debt peak of $381B in July 2007 – 3 months before the US stock market peaked in October 2007 and began crashing (albeit less than 1% higher than the July peak).
(Margin debt is the amount of money borrowed from brokerages by speculating investors. It is greed in pure form. Margin debt peaks shortly before stock market crashes begin.)
I’ve made no secret of my forecast for the U.S. to join most of the rest of the developed world economies in recession in June; that the US stock market will see a new all-time peak in April-May; and that Margin debt will approach or set a new all time record in April. We can’t check the box yet on April’s margin debt, but we almost certainly will in 4 week’s time.
This is going to have a direct impact on the Greedometer.
BEA First Estimate of Q1 GDP
This morning the BEA announced they estimate Q1 GDP at: +2.5%.
As you all know, the BEA provides three estimates for a previous quarter GDP, then update it again several years out. So don’t place a lot of weight in today’s estimate. That being said, it is taken seriously by markets.
I estimated the BEA would today provide a 3% GDP estimate, but my estimate was and is 2%. We’ll see how this plays out, but it would be reasonable to see the BEA gradually lower their Q1 estimate in the coming months based on the weaker data later in the quarter that will not yet have been baked-in.
The story with Q1 GDP seems to be that the consumer kept spending by virtue of lowering their savings rate (down to the 2% range). Inventories added to GDP but not as much as I thought they would.
Many of you probably downloaded my book (Greedometer 2.0) from amazon. In Chapter 5, there’s a section called The Happy Government. It’s a discussion about how terrible the BEA has been at first, second, and third estimates of Q3 GDP for the past 10 years. You may want to have another look at it.
I’m sticking with a -0.5% Q2 GDP estimate. That’s my estimate of reality — not what I think the BEA will say on July 31st. To that end, the July 31st -first estimate- of Q2 GDP will include a revision to the BEA’s process of GDP estimates. Much has been made of this in the financial press recently. By some estimates, the US economy may instantly become 3% larger on July 31st due to inclusions of parts of the economy previously not included. Won’t that be interesting if the BEA prints a +2.5% GDP estimate for Q2 GDP (+3% from a process change minus my 0.5% GDP estimate)?
Why the ECB won’t come to the rescue (with printing press) this summer
There’s an undeniable growing amount of economic data -not just in the U.S- indicating the global recession is spreading. This despite the best efforts of central banks. Currency printing presses are running at a near-frenzy pace, yet aggregate demand seems virtually unaffected. As I wrote 2 years ago (www.noQE3.com) QE has the reached the point of diminishing returns and has become as productive as pushing on a string. Yet the U.S., Japan, and the U.K., are busy weakening their currencies. Hopes are high that the ECB will actually fire-up the printing press this summer, not merely threaten to do something (what ever it takes!) like last summer — though I point out Dr. Draghi’s famous threat managed to do a great deal for risk-on speculators in the equity market. Sorry bond market speculators. You got crushed if you applied risk analysis to peripheral European sovereign bonds. You made a killing if you were bet heavily on the trashiest of assets.
Back to the ECB. Since it isn’t actively debasing the euro, international competitiveness of european exports (read as heavily German) are going to find it increasingly tough. The German economy is likely to fall deeper into recession as 2013 unfolds. So bad (economic) news will be good news– for stock market risk-on speculators right? The logic being that bad economic news will make it more likely the ECB will begin debasing the euro in parallel with other large central banks.
Here’s the trouble with that point of view: it underestimates German fear/hatred of inflation. German central bankers are fervent opponents of inflationary monetary policy for reasons that are well known (hyper inflation of 1920-1923). In addition, look at Europe from the point of view of fiscal soundness. It’s a disaster — debt/GDP ratios are unsustainable, and there is a lack of political will to apply responsible budget policy. The icing on the cake is the terrible demographics. The European poster child for bad demographics and monstrous debt — take Italy for example. Enrico Letta has just been appointed Prime Minister of a coalition parliament. He has not been in the job 24 hours and has already announced intentions to reverse austerity plans. This is not going to go over well in Berlin and Frankfurt (and Brussels). Why any ECB member would vote to keep buying Italian -or anyone’s- sovereign bonds when there is no demonstrated will to implement responsible budget plans is beyond me.
I grant that the ECB might announce another 25 basis point cut in short term interest rates. That might stoke a small risk-on rally for a few hours or days, but it will be a pointless exercise. If there’s no demand for money when short term interest rates are 0.75%, what difference will it make if you drop it to 0.50%?
Germans head to the polls in September. I don’t see the ECB provoking Germans -via any inflationary QE efforts- until after their election. A new political party is gaining traction in Germany. Its platform: anti-EU. It’s a long-shot in terms of wining seats, but it could easily cause a groundswell of euro-skepticism causing populist political leaders with a legitimate prospect of wining to adopt similar views.
The ECB is going to have to wait a respectable amount of time after the German election (a month?) before it seriously considers dusting off the euro printing press. By November, the prospects of heavy year-end bond re-financing is going to come into view and the pressure will mount. It’s going to be an interesting year.
April 25, 2013
FREE Greedometer Newsletter Advanced Access. (very limited time)
This week’s Greedometer Newsletter is out. It’s a doozy! Plus….
Free View of Advanced Newsletter (limited time)
The Greedometer and mini Greedometer sections of this week’s newsletter will be viewable to any / all accounts. The newsletter contains a very significant datapoint and supporting analysis. I’m making it viewable to everyone with a login ID through Saturday April 27th only. I’m doing this for 2 reasons:
1: I know there are several hundred of you that are ‘on the fence’ / waiting to see if these algorithms are just hype / bluster. You may have read the book, but you haven’t been following me for years, so you may still think this is just clever back-testing. Unless you have visibility into the Greedometer – and especially mini Greedometer portions of the newsletter, you’re not going to have an understanding of what I’m communicating. After you read the information in the Greedometer and mini Greedometer sections later today, there can be little doubt in the veracity of the algorithms and of the stock market and economic forecast I made in the book — and have been pounding the table about since January. This is clearly not back-testing at play. You’ve got a front row seat to an historic stock market collapse before it starts.
2: I’m paying it forward by providing an extremely valuable look into the newsletter for free. But this is a small business, and I’m a virtual unknown. I’m therefore appealing to you to assist the growth of this newsletter and my book sales. Please post a review of the book on Amazon. There are fewer than 10 reviews so far. I need every (positive) review I can get. Roughly 600 people have signed up for the newsletter –and virtually all of them downloaded the book (mostly free, but some paid). A few hundred reviews would help the book’s credibility a great deal.
I abhor discounting my research. But I need the newsletter to rapidly expand –ahead of the stock market crash– to maximize credibility. I hope to rely on media interviews and word of mouth referrals in the future (as opposed to coupons).
$300 Coupon for Basic Access Subscribers to upgrade to Advanced
Today (Thursday April 25) through Sunday (April 28th) there is a $300 coupon for existing paid basic access clients to upgrade their account to advanced access. I’m effectively tripling the value of your initial $100 basic access subscriber purchase. Enter coupon code: upgrade300 . This coupon will not work after 12:00 midnight east coast (US) time Sunday April 28th. Again, this coupon is only for existing paid basic newsletter subscribers. If you are not currently a paid basic access newsletter subscriber, do not apply this coupon to your order — it will be rejected. Use the one below.
$200 Coupon to become a new Advanced Access Subscriber
Today through Sunday April 28th — there is a $200 coupon for people that are not currently paid subscribers to become advanced newsletter subscribers. Enter coupon code: new200 . This coupon will not work after 12:00 midnight east coast (US) time Sunday April 28th.

