Jeff Seymour's Blog, page 5
November 12, 2013
Greedometer Newsletter Posted
This week’s Greedometer newsletter has been posted.
Lots of interesting things….
You’ll need to be a subscriber to dig-into these charts. The last one is by far the most interesting.
November 7, 2013
An extremely powerful and manipulative cheerleader (Q3 2013 GDP growth was not +2.8%) - BEA GDP estimates are overestimated
Today’s 2.8% real GDP growth estimate from the BEA is absolutely meaningless. That fact did not stop the stock market from selling-off because of fears the Fed may take the QE3 punch bowl away. As much as I firmly believe the Fed should do exactly that, today’s BEA estimate of GDP was not a reason to expect QE3 to be taken away. (Don’t worry, tomorrow’s BLS report on employment for September is likely to be dismal enough to cause the same investors to rush back into the market out of hopes QE3 keeps going.)
The Bureau of Economic Analysis (the BEA) is a section of the Commerce Department. They’ve done a stunningly miserable and misleading job in their estimates of Q3 GDP from year 2000 through present. Since 2013 is still unfolding, we’ll focus on a discussion of Q3 GDP estimates from 2000 through 2012.
First, you must know the BEA provides three estimates of GDP in the months immediately following a quarter. They also periodically update previous year estimates, but no one pays attention to something that happened years ago. That’s too bad. Over the previous 13 years, the BEA has lowered the Q3 GDP estimate -from their initial estimate to their latest- by an average of nearly 0.9%. Considering the average GDP growth over the past 13 years has only been 1.8%, an ongoing average overstatement of GDP by 0.9% is monumentally misleading.
I’m going to break the data into two groups: the non-recession years, and the recession years. This is being done because of the clear distinction in how the BEA represents their estimates.
The non-recession years:
In the 10 years that did not experience recession:
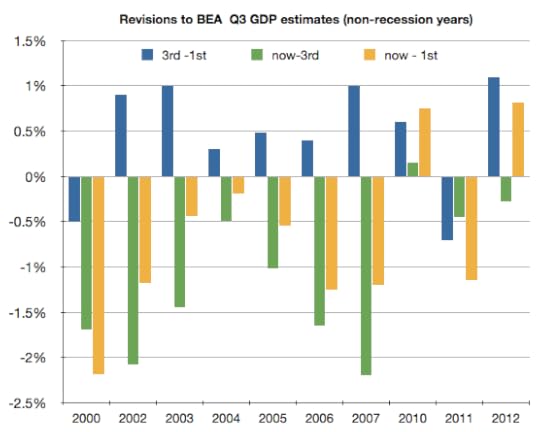
80% of the time, the BEA raised their GDP estimate on the 3rd estimate vs 1st.
On average, the 3rd estimate was raised 0.46% from the first estimate (blue bars above). The BEA admits their first and second estimates are based on thin data representation and therefor suggests their 3rd estimate is more credible. Now some of you are going to think that’s OK, they had more data by the 3rd estimate and the economy was growing, so it makes sense they raised the GDP growth estimate. Hold that thought. It’s about to be torn to shreds….
The most recent estimate (now) of previous year GDP is based on the most complete set of information. So using the same logic as the previous assertion, recently revised GDP estimates for previous years should be higher still. They’re not. 90% of the time, the BEA lowered the GDP estimate from their third estimate.
The most recent estimates for these 10 years show an average drop of 1.12% from their 3rd estimate (green bars above), and 0.66% lower than their initial estimate (yellow bars above).
This sort of revision is nowhere near random! I’m sorry but if 80% of the time your 3rd guess is higher than your first, you’re probably trying to make things look better on the 3rd estimate. It is even more damning if 90% of the time you lower your estimate after the third one. Again, please keep in mind the BEA stresses that the third estimate is the one you should place the most faith in.
In the 3 years that did experience recession, the BEA did an even worse job. Their estimates were even more wrong and even more excessively optimistic:
All three years saw the 3rd estimate lowered vs their first estimate (blue bars above). The average was a lowering by 0.8%. Wow!
The average lowering from their 3rd estimate to their latest (green bars above) is 0.78%.
In sum, the BEA has lowered their Q3 GDP estimate by nearly 1.6% vs their first estimate.
The wrap up:
The BEA’s Q3 GDP estimates are nearly useless until years after the fact.
Their estimates are nearly always a considerable overstatement of GDP growth. 11 of the previous 13 years have seen the BEA lower their most recent GDP estimate from their first estimate. And the two years that were not lowered were 2012 and 2010. Maybe the BEA has not got around to lowering those two yet because they’re too close in memory and might scare someone.
When we’re in a year that experiences a recession, expect the BEA to slowly lower their GDP estimates. They put-off providing any estimates of large GDP drops until it’s undeniable. In 2008, it went like this:
1st est: -0.3%
2nd est: -0.5%
3rd est: -0.5%
years later: -2.0% !
Based on the past 13 years, when it’s all said and done, 2013 Q3 GDP growth is likely to end up:
around 2.1% provided we did not enter and stay in recession for more than 1 quarter this year OR
around 1.2% if we did enter /stay in recession for 2+ quarters (earlier this year). FYI: ECRI seems to think we flirted with recession earlier this year.
If you’re going to be this lousy at providing GDP estimates, why bother? Then again, if your job is to continually present an overoptimistic economic picture then lower it when no ones cares, I’d have to say mission accomplished. But is this what we’re paying for –an extremely powerful and manipulative cheerleader? Can’t we handle the truth?
( December 2007 was when the last recession began, but 11/12ths of 2007 was not in recession, so I’m counting 2007 in with the non recession group).
November 5, 2013
Greedometer Newsletter posted
This week’s newsletter has been uploaded.
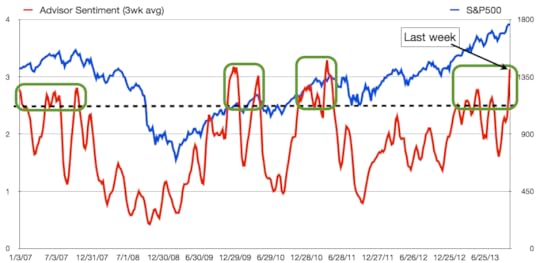
My favorite discussion is regarding the fact that Advisor Sentiment is wildly bullish. Euphoria is widespread. When advisors get this bullish, they’re almost always collectively wrong.
The stupidest thing I’ve read this morning - stock market top 2013
The stupidest thing I’ve read this morning….
“There’s no doubt that stock buybacks have helped boost EPS [earnings per share] growth, although you could make the case that as long as companies are buying back their stocks, people should do it as well,”. This horrendously bad advice was given by someone at a significant investment industry firm this morning.
Truth Points:
When company share buybacks are very high, investors should avoid doing the same. Share buybacks are a tool used by company management to drive the stock price higher via the increased earnings per share (EPS) that result from reducing the number of shares outstanding. 2013 buybacks are very elevated — topped only by 2007 buybacks. 2013 will likely see 3-4% of S&P500 shares outstanding removed via buybacks. That’s more than the pace of EPS growth this quarter and last quarter!
Frequently during years when share buybacks are very high, company management is heavily selling their own shares. Now there’s conviction! Insider selling reached panic levels in 2007 and has been topped…yup… this year!
Sadly, this phenomenon also is frequently accompanied by retail investors buying heavily. Retail investors trampled heavily into stocks, setting records in 2007 and 2000. Those records have been smashed this year.
When these things happen together, the stock market is usually going through a secular topping-out year (before a mammoth market crash). That’s what happened in 2000 and 2007. The data suggests this year is the same –only with even more acute risk.
October 30, 2013
What inflation?
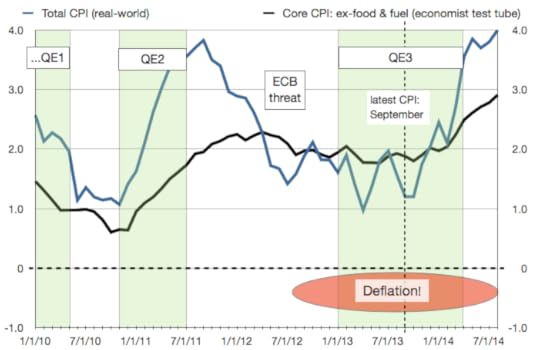
The latest CPI data was released from the BLS an hour ago. September showed benign inflation at the consumer level. It would appear the Fed’s got a green flag to continue QE until January –according to my inflation estimates.
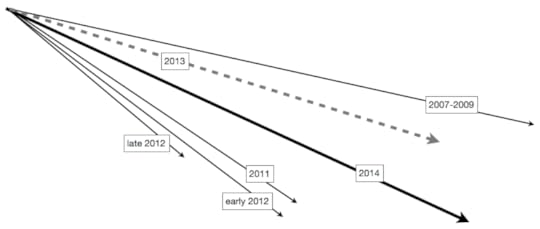
But look at 2014. If the Fed keeps the brick on the gas pedal through April, real-world inflation is likely to reach 4% by next summer.
I don’t have a Ph. D. in economics, but I’m pretty sure 4% inflation will crush a consumer that remains laden in debt with no negotiating leverage for a pay raise.
The Fed is going to have to begin hinting that a QE taper is in the cards for 2014. Maybe not today. Perhaps in the December FOMC meeting. Lump of coal for Christmas?
October 29, 2013
Greedometer Newsletter Posted
This week’s Greedometer newsletter has been posted.
In this week’s letter:
The Greedometer gauges blow-out to epic levels.
A 10th input parameter is added to the strategic Greedometer risk gauge.
Insiders continue panic selling.
Retail investors pile into stocks and stock market call options.
Advisors are uniformly wildly bullish. Euphoria!
US & China manufacturing continue a slow and steady slowing.
If the Fed surprises with a QE taper announcement, things are going to get interesting real fast. Otherwise, risk-on (apparently)!
October 23, 2013
This is going to tick you off - stock market crash 2014
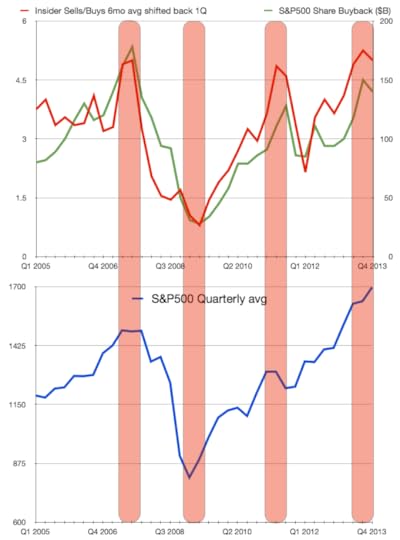
This chart is going to tick you off. The top half shows the pace of S&P500 share buy-backs (green), and the ratio of insider selling. To be more complete, the insider selling data is for the preceding 6 month period, and has been pushed back by 1 quarter. I’ll explain why I’ve done this after you take a look at the chart. The bottom half of the chart is the S&P500 quarterly average.
Observations:
Corporate executives use company money to buy shares at the most expensive times (buy high). They’re doing this in order to remove shares from the public float. In so doing, the earnings per share goes up –since there are fewer shares to distribute the earnings. This drives the stock price up.
Corporate executives sell their own personal shares before the market peaks but capture most of the upside (sell high). Also: when the S&P500 is tanking, they reduce their pace of selling dramatically –again in advance but still manage to time the trough very well.
As has been pointed out previously, insiders were panic selling in 2007 (at the top); in 2011 (before QE2 was switched off, causing the S&P500 to plummet nearly 20% during the summer before being stopped by yet more Fed & ECB intervention); and they’ve been panic selling this year at a sustained pace that exceeds every other point in time.
Among other things, this chart demonstrates that corporate executives are experts at turning shareholder money into their own personal money.
No wonder there has been a steadily increasing concentration of wealth among the top 1% of earners in the U.S. Perhaps it won’t surprise you -but it should disturb you- that the top 1% will earn approximately 24-25% of the pie this year — topping the previous all-time share seen in 1928-1929. Let’s see. I know 1929 is famous for something….
(The data for Q4 2013 was estimated. Obviously.)
2014: the training wheels come off
The European Central Bank (ECB) released more information about the bank asset quality test it plans to conduct. Given that previous european bank stress tests were merely deceptive cheerleading exercises, a legitimate job needs to be done to avoid losing credibility (we don’t want a major central bank to lose credibility…).
What’s different this time (why take this seriously):
The ECB is doing the stress test in concert with the European Banking Authority (EBA). The EBA is based on London, and did the last two white-wash bank stress tests.
The tests will be conducted from November 2013 through November 2014, with the findings/recommendations announced at the end. This is the ECB (doubtless at the behest of the Bundesbank) drawing a line the sand that says Europe’s banking system will be solvent by the end of 2014.
Banks that fail will be told to raise capital buffers.
Politicians will be told to build capital buffers with national public money.
The European Stability Mechanism (bailout fund) will be the final resort to re-capitalize failing banks.
Mario Draghi (ECB Prez) understands he won’t be taken seriously if he makes another threat “to do whatever it takes” unless it is backed-up with an action. Hence he’s laying out a plan to force banks to clean-up their balance sheets so that he won’t have to make threats and deliver on them.
European bank stocks in the riskiest locations (PIIGS) are going to be under pressure in anticipation of new share offerings (used to rebuild capital buffers).
So what?:
1. The Fed-ECB tag-team over the past few years has provided both an ideal interest rate environment for banks to earn exceptionally large profits (so they may rebuild their balance sheets), and it has provided time for this profit-generating exercise to work. With the banking system in the U.S. and Europe able to withstand a harsh but unavoidable economic reality without collapsing, the Fed will end its QE program (probably a taper from April through November). And the ECB’s exceptional monetary policies will end late next year: the ECB’s LTRO 1 program ends / comes due in December 2014, and LTRO 2 is due in January 2015. So this stress test aligns with the wrap-up of exceptional ECB monetary policy perfectly.
2. The JGB 10yr yield is 0.6%. The U.S. 10yr yield is 4X this (2.5%) and the German 10yr bund yeild is 3X as much (1.8%). This year, approximately 50% of government revenue will come from JGB bond issuance. This is a Ponzi scheme if there ever was one. With interest payments on the national debt already at 30% of tax revenues, having to pay competitive interest rates to Germany and the U.S. will consume most or all tax revenue. Game over.
A world without monetary policy training wheels. This will force politicians to enact fiscal policy that begins to solve our collective chronic economic problem. That probably won’t be enjoyable in the initial years, but will pave the way for stability and sustainability down the road. If anyone knows how Japan manages to avoid seeing its JGB interest rates blow-out to levels similar to Germany and the U.S., I’d love to hear from you.
October 22, 2013
Greedometer Newsletter Posted
This week’s letter has been uploaded.
October 21, 2013
New Margin Debt Peak: Greed is alive and well. - stock market top 2013
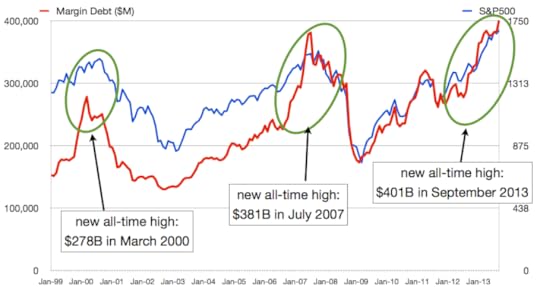
When stock market rallies get long in the tooth, the amount of leverage employed increases. Greed incarnate. This phenomenon is trackable via the amount of margin debt at broker dealers (this essentially represents the amount of money investors/speculators have borrowed “on margin” from brokers).
Margin debt reached new all-time highs in 2000, 2007, and…drumroll please…. again this year. The NYSE released the margin debt data for September a few hours ago. A new all-time high of $401B was seen.
Here’s a chart going back to 1999.
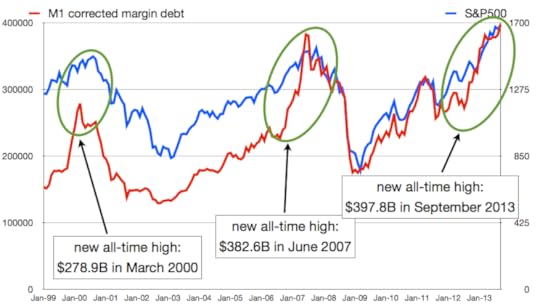
I know some of you are going to take issue with this chart and claim it is nominal — no correction for an expanding money supply. Right! Let’s have the margin debt data corrected for growth in the M1 money supply:
Wow!
M1-corrected margin debt is one of 9 input parameters to the Greedometer® strategic risk algorithm.

