Jeff Seymour's Blog, page 6
October 17, 2013
New S&P500 top. Greater fools rush in. - stock market top 2013
Today’s relief rally / short covering rally was impressive. A new all-time high (1733) was set on the S&P500 (1729 was the previous all time peak). However, once the shorts have fully covered (are they done yet?), we’ll see how much buying support there is.
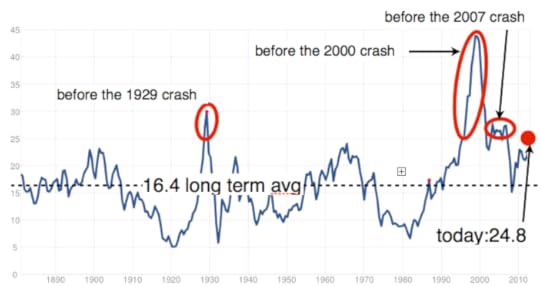
With a P/E (cyclically adjusted P/E) of 24.8, we are now 50% above the long term mean (and that’s 130+ years of data). The only times that saw higher P/Es were circled in red below.
Some will argue this bubble can inflate further. Yes, it can. I don’t see earnings driving this though. Then again, 85% of the gains made on the S&P500 over the past 2 years have come from an expansion of the P/E multiple, not earnings. The hallmark of a hyped, frothy market.
If earnings aren’t going to drive the market higher, we’re left with sentiment (the greater fool theory). Perhaps faith in Fed QE will continue to drive the market higher. However, since QE is -according to the San Fran Fed- having virtually no impact, maybe the currently deployed QE will merely act as a brake that slows the collapse but fails to stop it.
According to the Greedometers, the final peak in the S&P500 should fall within 1% of the previous peak (it did in 2000 and 2007). That translates to 1711 – 1746. We’re certainly there.
October 16, 2013
The short squeeze cherry on top - stock market top 2013
With 1 day left before the Treasury hits the so-called debt ceiling, Congress suddenly found a way to act — I mean kick the can. To no surprise, it has done nothing to solve the broad budget/debt problem, and has not managed to kick the can very far since we’re told this will happen again in February.
The last massive short-squeeze was seen in May. 90 points were added to the S&P500 over two weeks. Then with the shorts squeezed-out, buying pressure stopped, causing all those gains to be lost in the ensuing month. It took the Fed backing away from its QE-taper threat to stop the sell-off. (there’s a healthy market for you…)
The current short squeeze has added nearly 80 points in the past week. Keep your eye on 1729 for the S&P500 since that’s where it ran out of steam in September.
The Greedometer sequences in 2000 (before the 47% drop) and 2007 (before the 47% drop) saw a final S&P500 peak within 1% of the previous peak. So the 1711-1745 range would be an appropriate place for a crash to start (1729 +/- 1%). Today’s 1721 works. So does yesterday’s 1711. So would 1745 on Friday.
If you’re counting on earnings season sustaining the risk-on rally, don’t. Pre-season (sandbagging season) saw the second biggest lowering of expectations for earnings in over a decade. More importantly, so far slightly over 50% of companies reported have beat lowered (sandbagged) consensus earnings estimates. An average beat rate is around 66%.
Gentle reminders:
80% of this year’s S&P500 gains have been attributed to expansion in the P/E multiple courtesy of the Fed fanning the flames, not an expansion of earnings.
Profit margins are mean reverting. The first two quarters of this year saw some of the highest profit margins ever. We’ll have a good view on Q3 profit margins in a couple more weeks, but judging by the poor start, it’s a safe bet profit margins are rolling over.
The S&P500 CAPE is in the 24s – nearly 50% above the long term mean. Mean reversion can be really inconvenient.
Insiders have been dumping their personal shares this year at a pace never seen before -eclipsing the 2007 pace of panic selling (at the top).
Margin debt is near all-time highs (money borrowed to leverage investment bets). This typically peaks at secular stock market peaks (it did in 2000 and 2007).
Breadth has been lousy over the past month. Fewer stocks are participating in the rally — a sign the party is ending.
Retail investors have been buying stock this year at a pace not seen since year 2007 and 2000.
Hmm.
October 15, 2013
Greedometer Newsletter Posted. (this is why the stock market is rolling over) - stock market top 2013
This week’s Greedometer Newsletter has been uploaded.
October 8, 2013
Free Look at Greedometers now
The Greedometer and mini Greedometer sections of this week’s newsletter will be viewable to any valid account. If you have a free section account or Basic Access paid subscription account, you will be able to view the Greedometer section as well as mini Greedometer section.
Please feel free to tell others — unless they work in the investment industry. New accounts may be created. Per usual, new accounts are subject to background checks to validate personal information — to confirm the account does not belong to someone in the investment industry.
This is a very limited time offer. Free access will be turned off tomorrow or the next day.
Greedometer Newsletter Posted
This week’s Greedometer Newsletter has been posted.
October 7, 2013
Stock Market Top 2013
For the past month the Greedometer has been saying it’s time to find your car keys and head for the exit – like insiders have been doing by dumping their shares. The past 4 weeks have seen insiders selling shares at a pace nearly 7:1 vs buying.
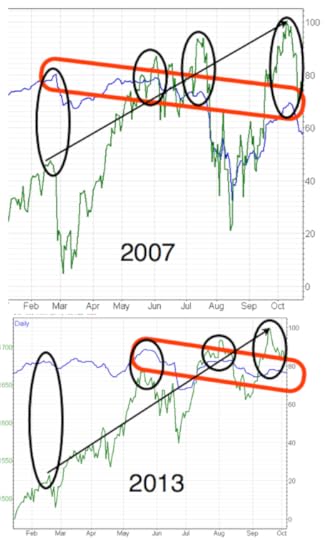
Breadth on the S&P500 has been declining for months –just like in 2007. While breadth is not one of the input parameters to the strategic Greedometer risk gauge, I pay it respect.
Below are charts showing the S&P500 in green, and the breath in blue. Both 2007 as well as 2013 show a steadily climbing market with declining breadth. 2013 has been distorted by numerous Fed threats and head-fakes, so the chart is not quite as textbook as 2007. But it’s good enough to paint an obvious picture.
Reasons to remain long risk assets as of now:
You are blissfully unaware of the extreme levels of risk now –and this year.
You believe the Fed will save the day as it has repeatedly over the past several decades.
You believe the ECB will save the day (LTRO 3?)
You believe Congress will save the day and issue another myopic and irresponsible unfunded tax cut.
You’re a long-only stock fund manager. (Hey, it’s always a good time to buy my fund!)
You’re a stock broker or investment advisor that is either falling victim to #1 or #2 above.
Am I missing any?
October 3, 2013
The rats are jumping ship…still - stock market top 2013
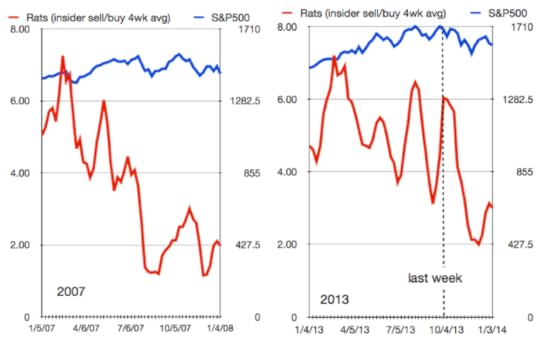
The Rats have been jumping ship recently, and throughout this year like never before:
Last week saw over 9 times the number of shares sold vs bought by insiders. Alas, 1-week might be labelled noise by the long-only-and-always shills of Wall St. — but 9:1 across all U.S stock market exchanges? So, more compelling evidence….
September saw insiders sell in excess of 6 shares vs bought. This is unprecedented in the nearly 10 years of my insider trading data i.e., never have insiders been panic selling in September as they have this year. Still not convinced 2013 is a secular stock market topping out year?
Insiders have dumped a record amount of their own personal shares this year. During the first 9 months, insiders dumped 5.3 shares for every share bought. That is unprecedented in the past 10 years, and probably ever. For comparison purposes, 2007 -the previous 9 month insider selling peak- saw an average pace of 4:1. (S&P500 peaked in October 2007).
Note: while insiders were panic selling their personal shares in September, retail investors were buying stocks in droves. Which group do you think has it right?
October 2, 2013
Cashophobia: The investment industry’s fear of cash.
Many investment professionals have a fear of cash i.e., they rarely accumulate large positions in cash. Doing so would invite criticism from clients. Clients are frequently paying for one of these two:
A service that consists of investment advice.
A service that clients interpret as investment advice, but is really just a sales pitch with trade execution.
For the purposes of the point we’re making here, the distinction in those two services doesn’t matter. In the eyes of the client, they’re paying someone to put their money into various investments that stand a good chance of generating positive returns. As of 2013, money market funds pay virtually nothing, as was the case in 2009, 2010 and 2011, and 2012. Hence, charging a management fee on large client positions in cash is a surefire recipe for negative returns since the investment fee is almost certainly higher than moneymarket returns. This is understandably hard for clients to tolerate. A client might rightfully say “I can do that on my own, for free.”
Ever eager to avoid that stressful situation, investment professionals frequently hold very small positions in cash. The industry has phrases like being “fully invested” that represent having an optimistic view of the future. Perhaps a more suitable phrase would be “all in.” This gambling reference is every bit as applicable, but obviously presents a different / risky / reckless message that would not portray the desired image. Having a perpetually optimistic view is almost a necessity if you plan to be in the investment business.
We can understand why fund managers might want to be fully invested for the same reason. Investors are not paying fund managers to make market-timing decisions (unless the style of active management includes market timing), but are paying for a given fund to remain true to the intent of its investment strategy. In other words, if an investor buys a mutual fund or ETF, they usually rely on that fund to consistently hold the class/style/size of investments stated in that fund’s prospectus. And while we’re discussing fund managers, when was the last time you heard one say it was not a good time to own the type of investments in their fund? I never have. It is “always a good time to buy my fund.” It has to be. It is amazing how often we find ourselves in a “stock-pickers’ market” (meaning you should buy their stock fund because they know which stocks to buy).
Looking back over the past 13 years, there have been times when it would have been wise to be parked in cash for a year or more. The brutal truth is a portfolio consisting of nothing but money market funds would have generated vastly superior risk-adjusted returns for the entire decade of 2000 through 2009. Sometimes the best investment decision is to invest in nothing (own cash) and wait for prices to be more attractive. Would it have been worth paying an investment professional if they could have prevented your portfolio from dropping violently in 2000-2003, and again in 2007-2009? This is likely what’s in store again in 2014, according to the Greedometers®.
This was an excerpt from Greedometer 2.0 The rats are jumping ship.
Greedometer Newsletter posted
This week’s newsletter was delayed until this morning. It is posted now. See greedometer.com .
September 25, 2013
Spot the bubble - stock market peak 2013
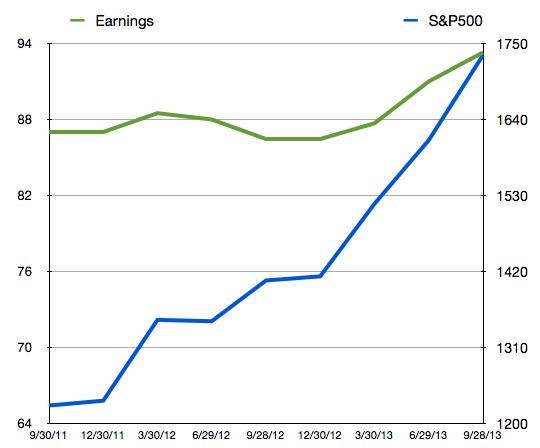
Over the past 2 years, the S&P500 has grown at 5X the speed of earnings growth. Therefore 80% of the reason for the stock market’s climb over the past 2 years may be attributable to P/E expansion alone. Recently, that reached 25 (on a CAPE basis).
Earnings on the above plot are trailing twelve month as-reported earnings. They’ve gone from $87 in Q3 2011 to (what will probably be) $93.30 this quarter. That’s a 7.25% rise spanning 24 months. Meanwhile the S&P500 has climbed from 1226 to 1675 (quarterly averages) — a 36.6% rise. Think this will end well?


