Jeff Seymour's Blog, page 8
August 20, 2013
Greedometer Newsletter Posted
This week’s Greedometer newsletter has been posted.
https://www.greedometer.com/subscription-level/subscribers/
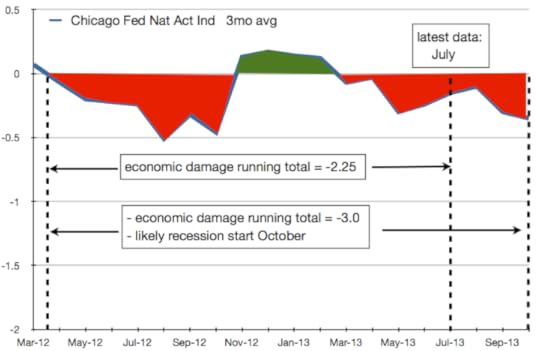
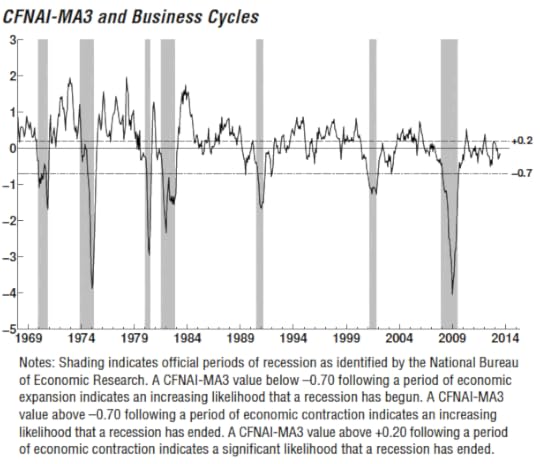
Among other things, we consider the latest economic data from the Chicago Fed….
But most importantly, we identify some key points in the Greedometer sections.
August 17, 2013
Greedometer put/call ratio: Ominous Warning - stock market top 2013, stock market peak 2013, stock market crash 2013, stock market crash 2014, greedometer
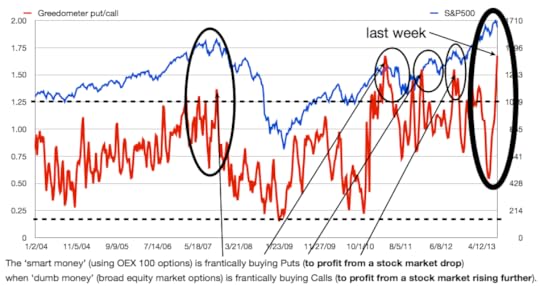
One of the input parameters to the Greedometer strategic risk gauge and the mini Greedometer tactical risk gauge (albeit with different amounts of averaging) is the Greedometer put/call ratio. This tracks the divergence in put/call ratios between the index containing the largest 100 U.S. stocks with the total U.S. stock market index.
Granted it is an imperfect indicator (which is why it is one of 9 used in the strategic risk Greedometer, and one of 4 in the tactical mini Greedometer). With that said, this picture is a wake-up call:
If you still have any long positions in risk assets, you better hope the Fed (& ECB, & BOJ, & BOE) has your back ad-infinitum….
June 26, 2013
FREE TRIAL: Advanced Access Newsletter - stock market top 2013
The Advanced Access Newsletter will have a 14-day Free Trial July 1 – 14. The Advanced Access Newsletter contains:
Free Section: economic news, analysis, commentary.
Greedometer Section: Greedometer reading, sequence, and analysis.
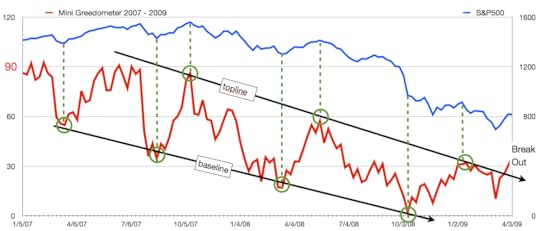
Mini Greedometer Section: Mini Greedometer reading, sequence, estimated topline and baseline, analysis, S&P500 forecast (for the balance of 2013).
July is going to be pivotal, so it’s an appropriate time for this trial. In the book (Greedometer 2.0 The Rats Are Jumping Ship), and in the newsletters, I’ve been writing that the S&P500 will:
Set a new peak in April-May 2013. Granted there was a monstrous short covering rally in early May that pushed the market slightly higher than I forecast, but so be it. (check that)
Take a breather in June. (check that)
In July, rally back to within 1% of the previous peak. (we’ll see)
Initiate a 1.5-year 65-70% collapse. (we’ll see)
The Greedometer gauges -as shown in the weekly newsletter- have supported this view. Your 14-day Advanced Access Free Trial will demonstrate this in real time.
Rules:
1 Free Trial per household. (no repeats)
Persons in the investment industry will not be permitted to participate.
Trial accounts will undergo a 24 hour vetting period wherein information is validated. That will include a check with FINRA and the SEC. When complete, the account will be active.
To protect the interests of paying subscribers, trial accounts will not have visibility of previous newsletters.
The Advanced Access 14-day Free Trial Sign Up will not be on the website until Monday July 1. (not to be confused with the 30-day Basic Access Trial that is on the website now)
link to Sign Up page
June 13, 2013
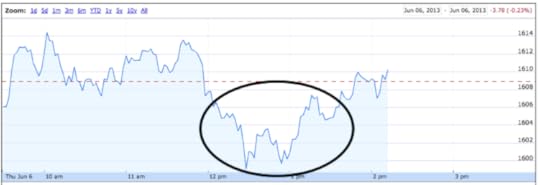
Why did the market bounce today?
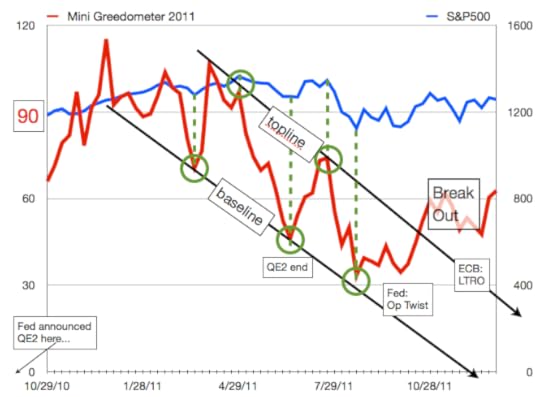
Today, the S&P500 bounced because the mini Greedometer readings for the week would have been considerably below the now well-established baseline had the week closed near this morning’s level. The S&P500 was oversold and had to bounce.
Previous examples of mini Greedometer sequences for 2007-09 and 2011:
When mini Greedometer readings approach/attain the baseline or topline for the sequence, the S&P500 reverses direction. That’s what happened this morning….
More in the Greedometer Newsletter here.
June 8, 2013
Greedometer 2.0 (book) Free Download Day: Monday June 10
Greedometer 2.0 The Rats Are Jumping Ship will be downloadable for free on Monday June 10th (2013).
Here’s the link on Amazon.com: Greedometer Book.
June 6, 2013
Time for another bounce
If today sees the S&P500 close at/above 1605, the 50-day moving average test will have been passed –or at least not failed. Tomorrow we’ll see if there’s any follow through. I suspect there will.
The topping-out process always takes longer than you think it will (or should). Look for the next S&P500 mini rally to be anemic on volume and momentum, and to be lead by another rise in Advisor Sentiment. If so, it will be the last rally, and identify the top. Much more in the Greedometer Newsletter (the paid part).
Greedometer Newsletter posted
This week’s Greedometer Newsletter has just been posted — to its new home at www.Greedometer.com .
May 25, 2013
Greedometer gets a new home
Next week all things Greedometer will move from this website to their own website: www.Greedometer.com. This is being done to consolidate the Greedometer offerings:
the interactive Greedometer gauge
the Greedometer Newsletter
the book: Greedometer 2.0 The Rats Are Jumping Ship
the blog
videos
The separation will allow the Triwealth.com website to remain focussed on being the public face of a Registered Investment Advisory practice.
Buy Climax: was last week a secular stock market peak? - stock market top 2013
Last week saw the second highest buy climax reading -probably ever- but certainly in the past quarter century. A weekly buying climax occurs when a stock hits a 52-week high price, but closes the week at a lower price than where it began. Conversely, a weekly selling climax occurs when a stock hits a 52-week low and closes higher for the week. Weekly buying climaxes tend to cluster near secular stock market highs, while selling climaxes cluster near secular stock market bottoms. There are approximately 5,000 stocks included in the weekly survey. A typical weekly reading sees 25-75 stocks with buy or sell climaxes. Buy climaxes of 400 or more are of interest in identifying secular stock market tops.
The trouble with buy climaxes and sell climaxes is they tend to be more prone to false alarms than I’m comfortable with. So I do not rely heavily on them. Instead, buy and sell climaxes are combined with other input parameters in the Greedometer strategic risk gauge. That said, buy climaxes can be used as a wake-up call. Let me wake you up with this information. The top three buy climaxes (probably of all-time), but certainly for the past 25 years were:
#1 1079. Last week of April 2010.
QE1 was ending.
The S&P500 had stretched 11.5% above the 200-day moving average.
The Greedometer briefly redlined (reached 7000rpm).
What came next:
the Flash crash.
10 weeks after the buy climax, the S&P500 was flirting with a 20% drop. Losing nearly 20% in 10 weeks is brutally fast. Very few periods in the history of the S&P500 have seen a drop this fast — probably just 1929 and 1987.
The Fed stopped the crash by announcing QE2.
The uninformed (and most of the investment industry) treat this period as a mere correction -and an excellent “buy-the-dip” opportunity in hindsight. This is delusional. Without the Fed intervening with QE2, another crash would have continued.
#3 643. First week of May 2011.
QE2 was slated to end 2 months away.
The S&P500 had stretched 12.7% above the 200-day moving average.
The Greedometer had been redlining since the beginning of the year, and reached an all-time high reading of 8000rpm the previous week.
What came next:
The S&P500 once again quickly dropped 20% — this time over 4 months (FYI: it took 8 months to drop the first 20% from the 2007 market peak, so 4 months is quite fast).
It required more Fed as well as the European Central Bank (ECB) efforts to stop the crash.
#2 887. Last week.
QE3/4 was threatened to be reduced or ended.
The S&P500 had stretched 12.7% above the 200-day moving average.
The Greedometer has been redlining since mid January. 8000rpm was reached in the first week of April. The highest average reading has been seen so far this year (5 months) –an epic 7600rpm. This crushes the pre-crash 2007 average, as well as 2010 and 2011.
What comes next?
Will the Fed back off the QE throttles as it seems to be threatening to do?
It’s not a sure-thing that the Fed will begin reducing its current $85B/month QE program. But -per my previous comments- it must at all cost avoid being caught in a situation wherein it is seen to be still doing everything it can while the U.S. economy falls back into recession. It must maintain the illusion it can intervene to squash any inconvenient recessions, therein keeping the great theoretic “wealth effect” moving forward. From recent regional Fed reports and ECRI’s data, I’d say the chances are good the U.S. enters recession in Q3 (and that Q2 shows very anemic economic growth).
If you are interested in what the Greedometer gauge is indicating about the impending stock market collapse, sign-up for a 30-day free trial of the Basic Access service.
May 24, 2013
Greed achieves new all-time high
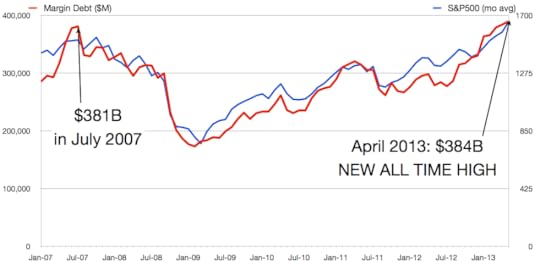
It’s official. The NYSE just released margin debt figures for April. A new all-time high was reached: $384.37B. This eclipses the previous all-time peak of $381B in July 2007. Take a good look at the chart because when margin debt peaks, the S&P500 is usually not far behind.
I had used $383B for an April estimate in the Greedometer algorithm, so this won’t change April’s readings. I’m using $392B as an estimate for May.

