Jeff Seymour's Blog
January 26, 2017
VisionQuest’s Joe Baker interviewed on ABC News in Charleston
VisionQuest’s Senior Vice-President, Joe Baker, was recently interviewed by ABC News 4 television in Charleston, South Carolina regarding the Dow Jones Industrial Average’s (D&J) moving to a historic high. See link: http://abcnews4.com/news/business-new... Joe explains in his interview that there are some psychological benefits for when an index crosses an all-time high, but it has little […]
The post VisionQuest’s Joe Baker interviewed on ABC News in Charleston appeared first on VisionQuest.
December 14, 2016
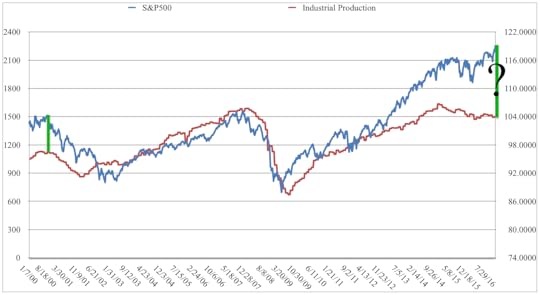
S&P500 and Industrial Production. Biggest gap ever.
The SPX has opened up a gap above industrial production -the economy- that is now exactly twice the previous largest spread. These two data streams spend most of the time being close to one another. So either the economy is about to see its strongest growth in many years (while the dollar is extremely high in price and climbing higher thanks to rate hikes) OR the SPX is going to plummet.
I assume you know industrial production has been contracting for the past 2 years — the longest stretch ever seen outside a recession.
Also, I assume you know the SPX CAPE is approx 29 with the SPX in the 2270s this week. Only 1929 and year 2000 top that valuation. Not a CAPE fan? OK, SPX price to revenue is at all time highs.
It’s all good.
December 11, 2016
1929, 2000, 2007, now
With the S&P500 closing last week at 2259 (new all time highs), here’s how that’s valued….
Now -and throughout 2016, the S&P500 has been trading at the highest price to sales ever. The runner ups are 2007, 2000, 1929. All were launch points for the largest stock market crashes in the past 130+ years.
The highest S&P500 cyclically adjusted P/E (CAPE for short) over the past 130+ years have been:
1st place: year 2000. CAPE at 44. 3rd largest stock market crash followed.
2nd place: year 1929. CAPE at 30. Largest stock market crash followed.
3rd place: now. CAPE at 29.3. Will likely be new 2nd largest stock market crash will follow.
4th place: year 2007. CAPE at 27.7 2nd largest existing stock market crash.
What’s different this time:
global central banks have driven interest rates to new all time lows (negative in Europe and Japan
central banks are printing money to buy sovereign bonds, corporate bonds, and stocks
when the market is falling, one of the key exchanges stops working
What’s the same:
Wall St and their financial press shills are claiming next year will be even better.
Widespread investor euphoria.
Food for thought.
October 28, 2016
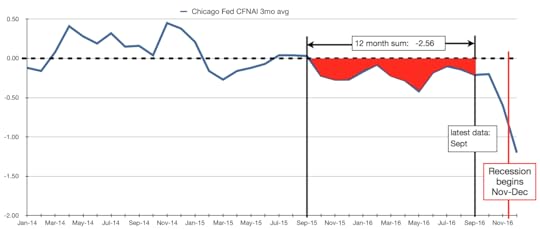
December recession entry point
This week the CFNAI for September was posted. CFNAI is a national economic indicator from the Chicago Fed that is correlated to GDP growth. Here’s what the 3mo avg looks like -along with my forecast through year end….
Based on the CFNAI and other data, I suspect Q1 saw a small contraction in GDP, and Q3 saw a strong bounce back into positive growth. But Q4 sees a fall back into contraction with recession initiating in December.
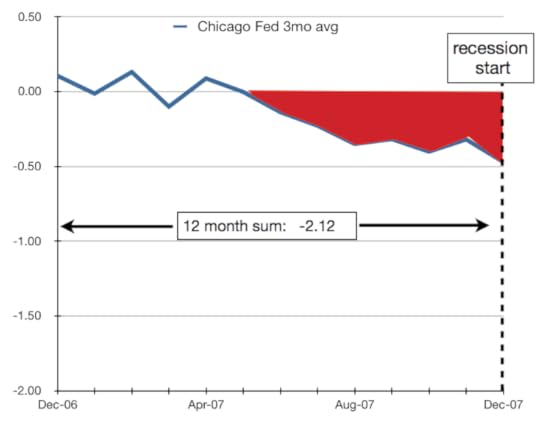
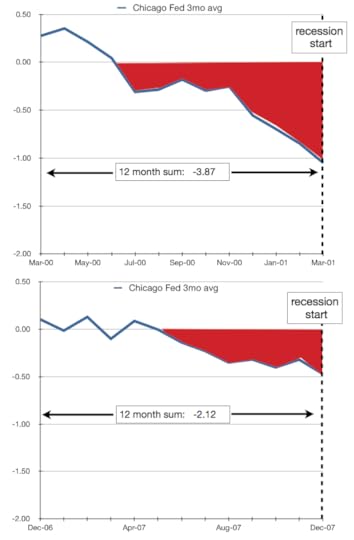
For comparison purposes, here are the CFNAI charts for the entry into the previous two recessions….
Naturally, the forecast for the next two months may be impacted (improved) by more central bank sugar bombs, as it has been repeatedly for the past 18 years. Indeed I will be surprised if we make it to year end without something very big and yummy coming from Europe. Perhaps a formal bank bailout. Of course this won’t happen until there is political cover from a stock market drop. This should be readily available in November. Get your popcorn.
What happens when the music stops? - stock market crash 2017
Central banks have been stopping stock market crashes and crash initiations repeatedly over the past 18 years. You’re probably only aware of the crash of 2000-2003 and 2007-2009 –and that both were stopped by the biggest fiscal and monetary policy support actions ever. My proprietary algorithms show there have been 9 major attempts and 3 minor attempts from the top 4 central banks to stop a stock market crash in the past 18 years. All 12 of these attempts have succeeded at stoping a crash from continuing. In 8 of 12 cases the market was down 10% or less before at least one major central bank (Fed, ECB, BoJ, PBoC) took action to spike the punch bowl and keep the party going. What happens when central bank tools become ineffective or too unpopular to use? What happens when central banks can no longer keep the party going? Let me suggest we will be there next week.
The Fed has repeatedly taken actions to stop the stock market from crashing. Each time it did so it bought a reprieve and we had a risk-on party. Via my algorithms I know the amount of time spent in these risk-on parties has followed an exponential decay. These periods have dropped from years to months to weeks to less than a week (that’s as tight as my algorithms can measure).
You are probably much more aware that there is a central bank in Europe (ECB), Japan (BoJ), China (PBoC), and England (BoE), than you were 5 years ago. These central banks have been doing everything they can to stop stock markets from crashing. Virtually everyone -in the U.S., Europe, Japan, and everywhere else- is aware of central banks keeping the economy and stock market afloat. This result has been slow to arrive, but arrive it has over the past few years. I suspect 5 years ago most Americans were not aware that there were central banks in other countries , much less that those central banks were supporting the U.S. stock market in a similar way as the Fed. Now that everyone knows this it will be all but impossible for central banks to unwind their supportive positions without initiating a panic. The Fed and the other top central banks have painted themselves into a corner.
There is a lie told by central banks -especially the Fed- that they have been taking actions to meet their objectives: stable inflation and full employment. According to the government (BLS), core inflation has been running in excess of 2% for a while now (essentially the Fed’s inflation target), and unemployment is spectacularly low (call it 5%). Never mind that both of these measures are deeply flawed and do not present an accurate portrayal of inflation nor labor markets. These flawed overoptimistic measures have been used by the government to make an ugly reality appear less ugly. Now the government’s own intentionally massaged statistical measures are going to make it difficult / impossible to keep supplying new rounds of supportive policy. You can’t have it both ways. Either everything is great –according to your statistics– and therefore the existing accommodative measures need to be withdrawn to avoid an inflation spike — OR — things are not great at all, your stats are a fraud, and you will need to spike the punch bowl again to keep the party going. Which is it?
For the first time I can recall, the most recent FOMC minutes reflected concern among Feddies that the credibility of the Federal Reserve as an institution is being eroded. This is a long way from the Fed being viewed as savior.
Several years ago (2013 I think) I wrote that there are two potential endings to this story:
Worst case scenario. The Fed is seen to be all-in / out of tricks. The economy rolls into recession. The Fed has nothing left to stop it -and more importantly nothing left to stop a stock market crash. Everyone is aware of this because Fed watching becomes more important than anything else to investors. The largest crash since 1929 ensues.
Second to worst case scenario. Same as above -with one twist. The Fed maintains it has more tricks but things are so good (a lie/bluff) it does not want to use them. The stock market crashes and the Fed does nothing to stop it because it expects the problem to be short lived –or of origin outside its scope.
If no major central bank manages to find something new to pull out if its bag of tricks we will see the largest stock market crash since 1929 over the next 12 months. A down payment in this crash will be seen in November. It does not matter who wins on November 8th.
July 13, 2016
How to run an economy
If you have not seen Richard Koo’s video about how banks and regulators acted in a previous existential crisis, you should. It is very instructive. Here it is.
Based on my observations over the past decade and Koo’s comments, here is my playbook for fiscal & monetary policy. I call it How to run an economy.
Banks:
Bankers should act responsibly. They should be accountable to their shareholders. Don’t make stupid loans (Latin America in the 80s, US subprime mortgages in the 2000s, mortgages with less than 20% down in 2013-now). Sometimes when the music is going, you don’t have to dance.
The above is true unless a bank is insolvent or nearly so.
If banks are nearly insolvent they should lie and cook to books to misrepresent their health. They’ll need a diversion to distract investors from the evidence — a large gap between as-reported earnings vs earnings from operations (earnings before bad stuff).
The larger a bank is the more important that they lie because many $T in credit derivatives may implode, bringing the global banking system down in 24 hours or less.
Bank regulators should be complicit in the lie in order to sell it (see Koo video). Take now for example. It would be really convenient for the Fed to have had undocumented discussions with bank leaders, advising them against recognizing losses on their energy loan portfolio. More helpful still if the Fed were to also recommend against building loan loss reserves since that might give the impression the bank sees losses ahead.
If a systemically important bank fails, the C-levels and board should see their assets seized and jail time. If you want bankers to act responsibly, create an incentive to do so. Fines to shareholders don’t do it.
Fiscal Policy:
When banking systems are at risk of implosion (year 2000 through now in the U.S., Europe, Japan, and 2011-now in China), do not tighten policy. Run up massive budget deficits to keep the music going. If in Europe, find a way to convince Germany to go along with this. Just say “Deutsche Bank”. That should do it.
After a banking crisis is done, begin tightening fiscal policy to pay down the debt racked up during the crisis. Hey, stop laughing. OK, politicians won’t do this because they won’t get re-elected. The solution involves political reform wherein long term responsible policy can be enacted and not overturned by myopic politicians. Wait for it, it’s coming…
More likely the debt gets written off central bank balance sheets (who does this hurt?), and some form of free money program is put in place to relieve the cashflow burden on households loaded with debt. This is where fiscal policy meets monetary policy.
Hello inflation spike. This leads to another problem: those locked out of hard asset markets (housing, stocks) are left behind. Builds societal instability. Here is where your political overhaul happens.
Monetary Policy:
When banking systems are at risk of implosion, do not tighten policy. In fact, create an interest rate environment for banks to make record profits (U.S. 2008-now). Force banks to keep those profits and build a mountain of cash that will then be used to repair the balance sheet when you recognize the brown ink / dog sh*t on their balance sheets. Sadly, bank regulators in the U.S. recently gave the green light for banks to begin pairing that cash pile down. Bankers will deploy large swathes of it in share buybacks. Want to know why you will bail out another large U.S. bank next year? This is why.
When banking systems are at risk of failure, hold “stress tests” that are a farce, designed to sell the lie the system is OK. Be sure to have some banks fail or nearly fail in order to make it credible. Careful! Don’t fail any of the banks that are systemically important unless you tell them how much capital they need to raise and have it cleared with their board before releasing the results. That way the bank can release a statement the same day as the stress test result are announced — saying they have already raised the capital to shore up their balance sheet.
After the risk has passed, don’t begin normalizing monetary policy –>> instead begin inflating away all the debt on central bank balance sheets (any that did not get written off). Sorry pension funds that bought long dated sovereign debt. You’re going to suffer large losses on that asset base. Sorry investors that went in search of yield by walking out the yield curve when the sky was falling.
I hope you found this interesting.
Here’s the rub —- why you can’t bet on stock markets going to the moon over the next 1-2 years. China. Almost every solution above involves weakening your currency. If you do that in China, you’ll see money flee the country at an accelerating pace, leaving banks insolvent in another 1.5 years (or so). The same is not true of the US, Japan and Europe. I suspect / expect things to gradually get out of control where central bankers can no longer contain the contagion.
The Greedometers (my proprietary algos) provide a means of understanding where we are in this gradual process of central bankers losing control — and of what this means to the S&P500.
May 25, 2016
Ding - stock market crash 2016 2017
Four weeks ago when the SPX was flirting with 2100 I began putting an ad together for my market timing newsletter service. It ran May 8th in the local paper and was a half page ad. I thought it was provocative. Here it is …
May 19, 2016
CFNAI: U.S. Recession 2-3 months away
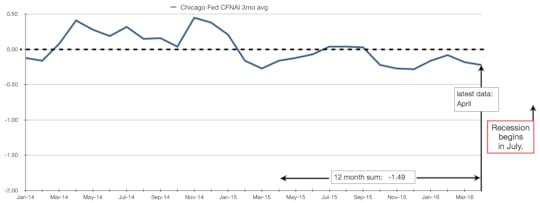
First, the punchline: a case is slowly being built for the U.S. economy to begin contracting in July. This of course supposes there are no new central bank sugar bombs to delay things. We’ll see.
The Chicago Fed National Activity Index (CFNAI) captures data from 85 inputs spanning the national economy and including income, employment, consumption, housing, sales, orders, and inventories. It’s a monthly report. That said, the monthly report tends to be noisy so I use the 3mo moving avg.
When the economy began contracting in the 2001 recession, the 12-month sum of 3mo mv avg was -3.87. With the economy more anemic after the 2001 recession it took less to tip back into another one so the CFNAI value was -2.12 when it entered the last recession.
This morning saw the April 2016 CFNAI data released. The 3mo mv avg was -0.22, and the 12month running sum of 3mo mv avg was -1.49. I suspect the economy will enter recession in July-August with a 12month sum in the -1.8 to -2 range — again since the economy has been even less robust that between the 2001 and 2007-09 recessions. Mind you, the BEA won’t say we’re in recession until some point in Q2 2017. The BEA waited 11 months after the last recession started to publicly confirm we were in recession. Don’t want to alarm anyone.
May 6, 2016
SPX CAPE at 27. Should we heed the warning this time? Yes. - stock market crash 2016-2017
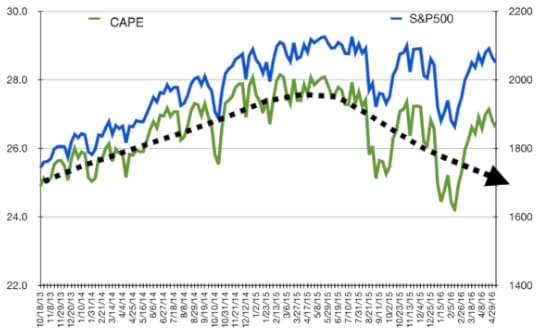
The cyclically adjusted price-earnings ratio (CAPE) is an input parameter to the Greedometer® because it is a reasonable indicator of whether current stock prices are expensive or cheap. On it’s own, the CAPE is not terribly useful as a market timing tool because the value may remain high for prolonged periods. Over the past century, the S&P500 rarely had a CAPE of 25 or higher. This point was breached in December 1995, yet the S&P 500 continued to climb a further 25% higher over the ensuing five and a half years until reaching an all-time peak of 44.
With a long term average of approximately 16.5, the CAPE has been parked at 25+ for the past 2.5 years. That said, it has been rolling over since May 2015.
There is a long way down from the 27.0 reading 2 weeks ago (SPX 2100) to 16.5. A 40% drop in the SPX from 2100 is easily supportable. In fact, since previous secular troughs saw the CAPE at approximately 5, then, 6, then 7, it would be reasonable to expect to see it at the 6-8 range at this trough. Yes a 75% drop in the SPX is supportable given the previous 130+ years of data (SPX at 550). FYI, the CAPE bottomed at 13 in March 2009 when the Fed intervened to stop the crash. Since that crash was stopped by the Fed I do not consider that a secular trough.
February 24, 2016
Client Letter. Don’t Panic. Profit.
Hello folks. The next few weeks are going to be unnerving to a lot of investors (not us though). There are going to be days with very ugly market headlines. Let me take this opportunity to remind you that we’re up almost 6% year to date and it’s been as exciting as watching paint dry. I hope to be up 7-8% by next week. So when you see a headline that the Dow is down 500 points, take it in stride and relax.
I expect the Fed or the ECB (or both) to announce a major new policy change (I call them central bank sugar bombs) in the next few weeks. If/when this occurs the Greedometers will absorb the data and provide an update to the path of this historic crash. Based on the Greedometers, I will make adjustments to protect principal and attempt to opportunistically profit in both directions as I have previously — and per the Investment Policy Statement. Per my track record, the actions will be limited in scale in order to limit risk.
To the best of my recollection I have never asked clients for referrals in building this business. I’m asking now. I would greatly appreciate referrals to anyone you know with $500K+ to manage.
As ever, you’ll continue to receive updates every Friday.
Thank you for your business.

