Jeff Seymour's Blog, page 10
April 23, 2013
Queue the Euphoria. Here comes the crash. - This is what a secular stock market top looks like
Queue the euphoria. The S&P500 is probably going to re-test 1595 this week, and if Friday’s Q1 GDP estimate is north of 3.0%, the S&P500 may even break 1600 for a few minutes. Crack open the champaign. It’s time to sell whatever’s left of your stocks and other risk assets to the same folks that bore the brunt of losses the last time things melted down.
Earnings season is not propelling the U.S. stock market higher. No macroeconomic data (anywhere) is propelling the U.S. stock market higher right now. What’s going on this week is a bounce off last Thursday’s short-term oversold market. I tweeted the market was due for a bounce within a few minutes of last Thursday’s S&P500 trough. How about them apples?
Don’t expect this party to last long. Here’s what I’ll be looking for to prove this point:
Next Tuesday afternoon will see the release of this week’s Advisor Sentiment report. Since you can fairly safely rely on advisor’s groupthink to be wrong when large proportions of them agree, I’ll be looking for the bulls/bear ratio to bounce fairly hard off last week’s 2.26, to something north of 2.75. 3.0 or higher would be downright euphoric, and fit the script. But readings that euphoric are very rare and are normally only seen the week before or first week of earnings season. Sorry. This is week 3. There’s too much weak earnings reality going on right now to see a 3.0 bulls/bear ratio. I’ll take the 2.75 and be happy with it.
Next Monday will see the release of this week’s insider buying and selling data. Expect the rats to resume jumping ship at a near panic pace of 6 or higher.
A decent GDP report will propel the VIX lower on stock market euphoria. Perhaps under 12 again.
I’ll also be looking to see what retail stock options traders are doing versus the institutional money. A strong finish to this week will almost certainly lead to a wide divergence in put/call ratios in these two groups. Guess which group usually makes the right call? Yup — not the retail options player. They’ll be busy buying expensive equity call options this week instead of the cheap put options.
Buy low, sell high. What’s high right now? What’s low right now? There you go. If only there were risk indicators that assembled all this stuff into something easy to use….
Hello horse. This is your water.
Germany still in recession
The latest economic data out of Germany depicts a deepening recession. April’s preliminary (called a flash report) data shows:
Manufacturing Output dropped to 47.9 – a 4-month low.
The Manufacturing PMI dropped to 47.0 – 4-month low.
The Services Activity index fell to 49.2 – a6-month low.
The Composite Output index fell to 48.8 – a 6-month low.
Germany may be one of the last ones into recession in Europe. But the dramatically weaker yen is going to take a toll on the German export machine. Keep in mind, Germans go to the polls this September, so the ECB is not going to be allowed to print its way out of this recession — not until after the German election at least.
April 22, 2013
China PMI rolls over…as expected
In last week’s China update blog posting, I had a chart showing the Purchasing Manager’s Index (PMI) with April’s reading estimated at 51.0. The April PMI was just announced. I was optimistic. Who knew? A 50.5 showed up.
This means the manufacturing sector (in China) is likely still growing, but not by much. And that trend line is really not your friend.
June Recession call — still in tact - U.S. to enter recession in June 2013
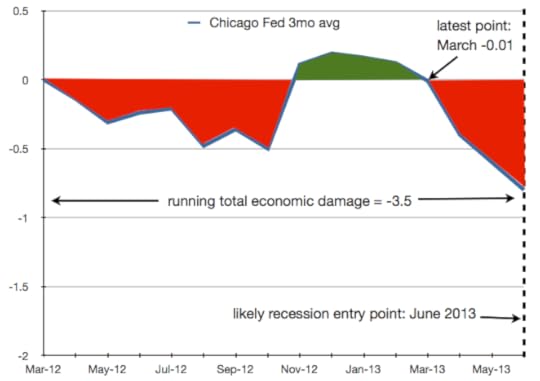
This morning saw the latest Chicago Fed National Activity Index report –always of interest to me. The 3-month rolling average showed continued declines in activity on a national basis -as I’ve been predicting. By the end of July, we’ll have the June data. My forecast calls for a -3.5 running total for the 3-month moving average. It was -2.42 when the US entered the previous recession in December 2007, and -4.4 when the US entered the 2001 recession. The S&P500 tends to peak 1-2 months prior to the economy entering recession. So my April-May call for a secular stock market peak remains in tact (as was made in Greedometer 2.0).
If you found this article by doing a web search for “stock market crash 2013″, relax. The US stock market is not likely to crash this year. This is going to be a topping-out year. The S&P500 will likely end the year only a few % lower than where it began — hardly a crash. 2014 — that’s likely see a crash.
April 18, 2013
Update on Gold
Gold:
Gold routinely (every few years) sheds 30% of its value. It is a volatile asset –which is why I don’t want to have a larger position than 10% of the asset base.
The price (in USD) fell through a technical support level last week ($1520). This initiated volume selling which generated a feedback loop of more selling earlier this week. There are rumors that the Central Bank of Cyprus was liquidating gold reserves to re-capitalize its banking system. This begs the question: what happens if central banks in other PIIGS countries do the same?
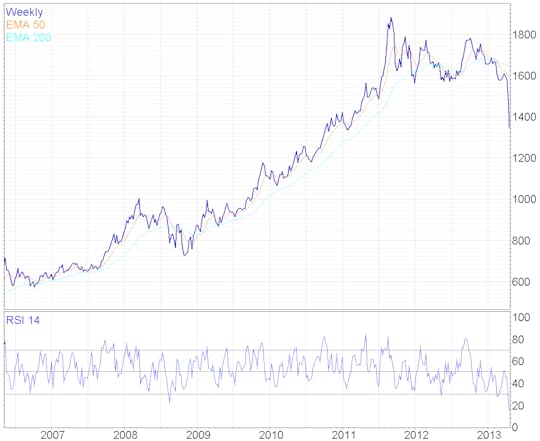
Given that the price has fallen far below the 200-day moving average, and momentum has fallen extremely low, gold is very oversold on a short term basis and due for a bounce. Gold (in USD) has never dropped this far ($280) below its 200-day moving average on an absolute basis (in $). The same is true on a percentage basis — on Monday gold was down 17% below its 200-day moving average. That has never happened –at least not since the US exited the gold standard in 1971. Early 1981 came close — the price of gold fell 16% under the 200-day moving average.
Since it has been trading so weakly, a follow up drop to a lower price is very possible within the next 4 months. Support levels for gold are: $1430, $1340, and $1250. Given that the price to mine gold ore is steadily rising (currently in the $1200 range) as the planet runs out of easily accessible ore, it seems likely the price will find a floor before $1200 is seen. As a long term play, the price of gold is likely to rise steadily and considerably over the coming 15-20 years (and continue afterwards). $10,000 per oz is not outside the realm of possibilities (in 15 years hence).
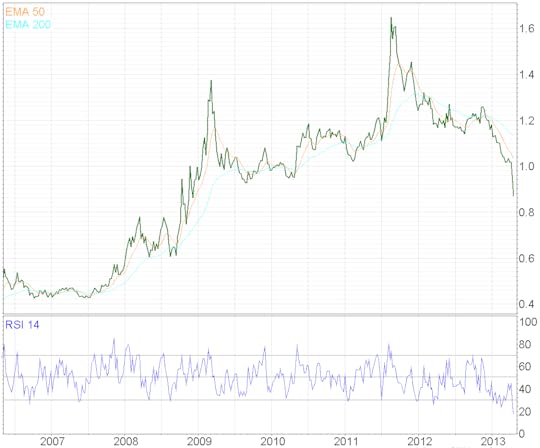
Here are some interesting charts. The first shows gold (in USD) going back 7 years, with its 50-day moving average, 200-day moving average, and relative strength index (momentum). The second chart show the ratio of the price of gold relative to the price of the S&P500.
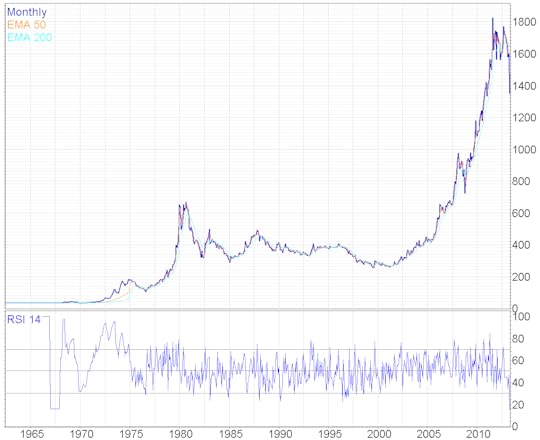
Below is a chart of gold (in USD) going back 50 years –to before the point where the US left the gold standard. Monday’s trough in momentum (RSI), and the extent of the drop below the 200-day moving average were unmatched.
China Economic Update
Q1 GDP came in at +7.7%. Enviable indeed, but lower than the 8.0% anticipated, and lower than the Q4 7.9% rate. Continued slowing the in the Chinese economy will be felt in commodity exporter countries: Australia, New Zealand, Brazil, and Canada.
Manufacturing continues to obey the same shallow declining trend line. April’s PMI data will be out next week (and in next week’s newsletter).
Wednesday saw stock markets spooked by a report from an audit of local Chinese governments that suggested debt was ‘out of control’ and that it risks a financial collapse larger than the US-centric one of 2008. Local governments are sitting on piles of bad loans made during the 2008 Chinese government loan-fest attempt to stem an economic collapse. It is estimated that local governments have between $1.6-3.2T worth of debt (20-40% of GDP). The amount of this that goes bad is not estimable with an precision. China has been playing extend and pretend on debts going bad.
Comments from the Chairman of the Chinese Sovereign Wealth Fund regarding the monetary easing / QE programs being lead by the Fed, BofE, and BoJ:
“Monetary easing might be helpful, but the role is very much limited.”
“It is a necessary but not sufficient condition.”
“If printing money could solve the problem, it would be so easy. Every country can print money.”
” Come people believe Quantitative Easing is a panacea. It is not a panacea. If you don’t do something else to support this policy, it’s a recipe for disaster.”
I could not have said it better myself.
The Shanghai stock market index is having a tough go of it. It isn’t far from its previous bottoms –seen in 2008 and late last year. I’ve included the S&P500 for comparison.
IMF updates global economic forecast with brown ink
The International Monetary Fund has reduced its global economic growth forecast for 2013 by 0.2% to 3.3%, and retained the same 4% growth forecast for 2014. They also expected 2013 US GDP growth to be 1.9%. These forecasts are too optimistic and are written in brown ink. We’re a third of the way through the year, and the IMF (with a cadre of PhD Economists) see +1.9% this year and 3% next year.
Here’s my 2013 quarter by quarter forecast: +2%, -0.5%, -1%, -2%. A -0.75% 2013 US GDP forecast. For 2014: -2.75%. This assumes the current speed of monetary easing continues until year end, then is stopped or cut back considerably in 2014.
The IMF was patting major advanced economies on the back for cutting fiscal deficits from a 9% average in 2009, to a forecast 4.7% in 2013. I don’t see 4.7% being hit this year, but 5 – 5.5% is possible. Whatever low hanging fruit their was has now long since been picked. It will be harder to close the fiscal deficits from 5% to 3% over the next few years.
The IMF apparently indicated it is still concerned about economic problems in: the US, UK, France, Italy, Spain, and of course Japan.
April 18 2013 Greedometer Newsletter is posted
This week’s Greedometer Newsletter has been posted.
April 12, 2013
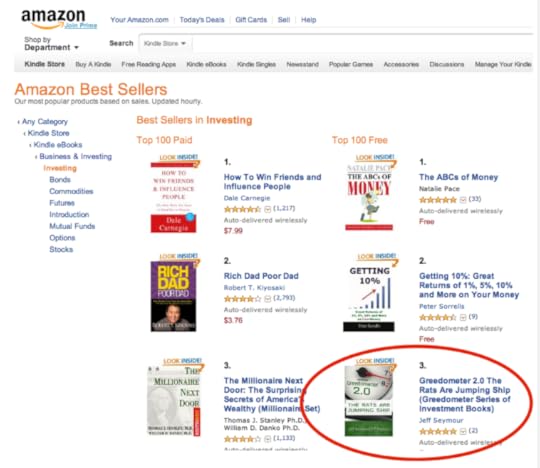
Greedometer ranks #3 on Amazon Best Seller list
I’m pleased to write that my book – Greedometer 2.0 The Rats Are Jumping Ship – has reached #3 on Amazon’s Best Seller list for books about investing. A podium finish. Maybe I should say podium start — since this is the first day the book is advertised.
Thank you to all that sent kind remarks. Please post a review on amazon, and tell your friends.
Download Greedometer 2.0 Free today
Today’s the big day. My book – Greedometer 2.0 The Rats Are Jumping Ship – is available on amazon.com and downloadable for free. The free download is for today only.
link to Greedometer 2.0 on amazon.com.


