Update on Gold
Gold:
Gold routinely (every few years) sheds 30% of its value. It is a volatile asset –which is why I don’t want to have a larger position than 10% of the asset base.
The price (in USD) fell through a technical support level last week ($1520). This initiated volume selling which generated a feedback loop of more selling earlier this week. There are rumors that the Central Bank of Cyprus was liquidating gold reserves to re-capitalize its banking system. This begs the question: what happens if central banks in other PIIGS countries do the same?
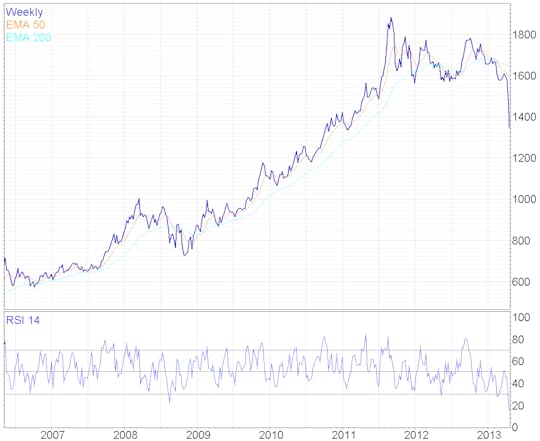
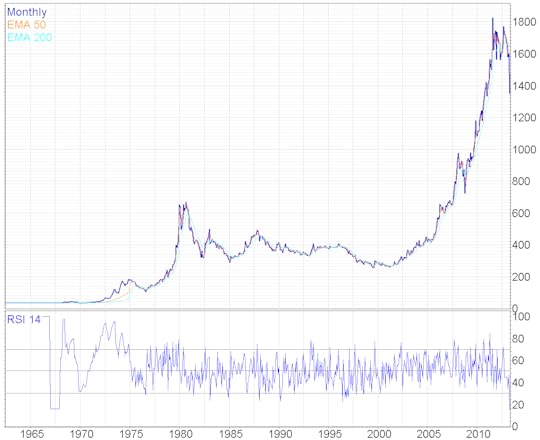
Given that the price has fallen far below the 200-day moving average, and momentum has fallen extremely low, gold is very oversold on a short term basis and due for a bounce. Gold (in USD) has never dropped this far ($280) below its 200-day moving average on an absolute basis (in $). The same is true on a percentage basis — on Monday gold was down 17% below its 200-day moving average. That has never happened –at least not since the US exited the gold standard in 1971. Early 1981 came close — the price of gold fell 16% under the 200-day moving average.
Since it has been trading so weakly, a follow up drop to a lower price is very possible within the next 4 months. Support levels for gold are: $1430, $1340, and $1250. Given that the price to mine gold ore is steadily rising (currently in the $1200 range) as the planet runs out of easily accessible ore, it seems likely the price will find a floor before $1200 is seen. As a long term play, the price of gold is likely to rise steadily and considerably over the coming 15-20 years (and continue afterwards). $10,000 per oz is not outside the realm of possibilities (in 15 years hence).
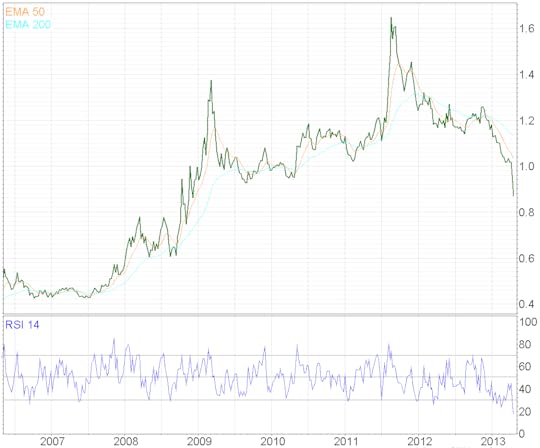
Here are some interesting charts. The first shows gold (in USD) going back 7 years, with its 50-day moving average, 200-day moving average, and relative strength index (momentum). The second chart show the ratio of the price of gold relative to the price of the S&P500.
Below is a chart of gold (in USD) going back 50 years –to before the point where the US left the gold standard. Monday’s trough in momentum (RSI), and the extent of the drop below the 200-day moving average were unmatched.
Published on April 18, 2013 12:00
No comments have been added yet.


