
Nate Silver's Blog, page 163
October 15, 2014
The Polls Might Be Skewed Against Democrats — Or Republicans
This year’s Senate election is close. Republicans have the clearer path to a majority, but it’s a treacherous one. Republicans are favored in Iowa and Colorado, for example, but not by much. If Democrats eked out victories in those states and picked up the seat in Kansas (by persuading independent Greg Orman to caucus with them), they could control 50 Senate seats and keep their majority. Democrats could also still pick up seats from the GOP in Georgia and Kentucky. And Republican gains in Arkansas and Louisiana are probable but far from certain.
So, we’ve not quite reached the point — as we did in the presidential race late in 2012 — when there would have to be a systematic error in polls across the country for the underdogs to prevail. Relatively modest errors in the right states would do the trick for Democrats. These errors occur more often in Senate races than in races for the presidency.
Nonetheless, we’ve reached a stage in campaign season when Democrats have begun to complain that the polls are biased against them. There’s a long tradition of this sort of “unskewing.” The trailing party will say that its internal polls tell a different story or that its turnout operation will save it. It will critique each poll’s demographic cross-tabs. (Because most polls report breakouts for a dozen or more demographic groups, all with small sample sizes, there’s almost always something to argue about.) The party will point toward previous instances when it outperformed its polls. As a last resort, it’ll claim that this election will be different somehow.
Usually this doesn’t end well for the unskewers. In 2004, some Democrats asserted that John Kerry would outperform his polls because undecided voters would break toward him. Instead, George W. Bush won by a slightly wider margin than the polls predicted. Throughout 2012, conservatives argued that the polls had a Democratic bias. The polls did have a bias — but it was a Republican one.
Democrats may not be wrong. The polls could very well be biased against their candidates. The problem is that the polls are just about as likely to be biased against Republicans, in which case the GOP could win more seats than expected.
 In a number of elections, including 2012’s, Senate polls had a systematic bias toward one party. But the direction of the bias has been inconsistent, favoring Democrats in some years and Republicans in others. The chart here depicts the average partisan bias in Senate polls of likely voters conducted in the final three weeks of campaigns since 1990. (For raw data from 1998 onward, see here; for 1990 through 1996, see here). A year indicated as having a Republican bias means the GOP underperformed its polls. A year shown as having a Democratic bias means the Democrats underperformed theirs instead.
In 2012, Senate polls had a Republican bias of about 3.5 percentage points. That means in a state where the polling average showed the Republican ahead by a point, the Democrat would be expected to prevail by 2.5 points instead. If there’s the same bias in the polls this year, Democrats would be very likely to keep the Senate.
But as I mentioned, this bias has flipped back and forth. There was also a Republican bias in 1998 and 2006. But there was a Democratic bias in 1994 and 2002. On average since 1990, the average bias has been just 0.4 percentage points (in the direction of Republicans), and the median bias has been exactly zero.
Democrats might argue that a Republican bias has been evident in recent years — even if it hasn’t been there over the longer term. But the trend is nowhere close to statistically significant. Nor in the past has the direction of the bias in the previous election cycle been a good way to predict what it will look like in the next cycle. For several consecutive midterms, the bias ping-ponged between the parties: There was a big Democratic bias in 1994, then a big GOP bias in 1998, then a Democratic bias again in 2002, then a Republican one in 2006.
There are a number of other examples, apart from Senate races, of polling bias being unpredictable:
Conventional wisdom once held that undecided voters would break toward the challenger (hence some of the predictions for a Kerry victory in 2004). But there has been no evidence for the so-called incumbent rule for almost a decade. It may be that to begin with, the theory relied on a poor interpretation of the data. Or it may be that the pollsters found ways to work around the rule, such as by reducing the number of undecideds by “pushing” voters to reveal their candidate preferences.It was once thought that polls overrated the performance of African-American candidates — the Bradley Effect. But this, too, has disappeared. Barack Obama, if anything, has historically done slightly better than this polls.The generic congressional ballot was previously thought to have a Democratic bias. But it didn’t have one in 2008, 2010 or 2012. Each year featured a modest Republican bias instead.One reason for the lack of a long-term bias is that pollsters are capable of making adjustments to their surveys. What adaptations have they made this year? In contrast to past elections, the vast majority of polls in 2014 have either included cellphones or been conducted wholly or partly over the Internet. The failure to reach voters who can’t be reached by landlines was probably introducing Republican bias into the polls before, but that may be corrected now.
What about the “ground game”? There’s credible reporting that Democrats are investing more into it this year, and that could help them. But the pollsters, at least as a group, are not expecting the sort of turnout gap they did in 2010. That year, the average poll had Republicans doing about 6 percentage points better among likely voters than among registered voters — a historically large difference. The average poll we’ve tracked this year has shown about a 3-point gap (favoring Republicans) instead — in line with the historical average in midterm years.
And remember, the question is not which party has the stronger ground game, but whether a stronger ground game will lead to benefits that aren’t reflected in the polls. An analogy can be made to stock prices. You might think that Apple makes cool, market-leading products, but that isn’t a reason to buy its stock — pretty much everyone else agrees, and that’s reflected in its stock price. It’s much more challenging to prove that the market is undervaluing (or overvaluing) the stock.
One problem with attempting to compensate for bias is that you can potentially overcompensate for it — like a golfer who alternatively shanks shots to the left and right of the fairway. Republican voters report having higher levels of enthusiasm this year (although it’s down for both parties from 2010), and Democrats have grown more reliant upon voting groups that sometimes decline to participate at the midterms. If you introduced a new turnout model this year because your polls had a Republican bias in 2012, you could wind up with a Democratic bias this year if those marginal voters only show up in presidential years.
Nor are the polls asserting we’re in the sort of substantially Republican-leaning national environment that prevailed in 2010, a year when Democrats lost Senate races in purple states such as Ohio and New Hampshire by double-digit margins. Instead, the generic congressional ballot shows a rough tie between Democrats and Republicans on a likely voter basis (or perhaps puts the GOP ahead by a percentage point or so). This is much different than in 2010, when it gave Republicans a 7- or 8-point edge.
The problem for Democrats is that many key Senate races are being contested in red states. They could lose the Senate by losing seats in Alaska, Arkansas, Louisiana, Montana, South Dakota and West Virginia — states that voted for Mitt Romney by an average of 19 percentage points in 2012. In purple states such as New Hampshire, Iowa, Colorado and North Carolina, Democratic candidates are holding their own, slightly trailing in some but leading in others. But Republicans would not need any of those if they swept the races in the profoundly red states (including in Kansas and Kentucky, where their candidates are vulnerable based on the polls).
And yet for all that, the GOP edge is slim. The FiveThirtyEight model accounts for two types of error in its forecasts: state-by-state error and national error. National error accounts for the prospect that the polls could be systematically biased toward one or the other party on average in all states; state-by-state error, as the name implies, pertains to idiosyncratic error in one state only. Ordinarily, when we run the model each day, both factors are treated as random variables and both contribute to the uncertainty in the forecast. But for this article, I’ve taken the national bias as a known quantity instead. I’ve also assumed the election will be held today instead of in three weeks, which further reduces the uncertainty.
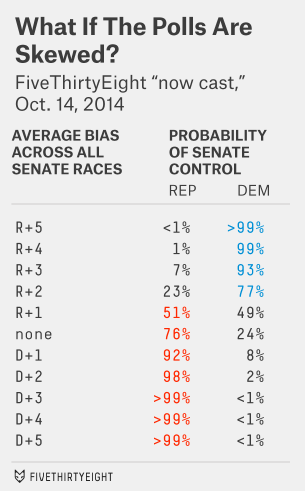
Suppose the polls have just a 1 percentage-point Republican bias, for example, in the average Senate race. In that case, Iowa and Colorado would go from slightly favoring Republicans to being more like true tossups. Democrats would also be slightly more likely to pull off an upset in a state such as Georgia, where the GOP has only a tenuous advantage. Overall, the probabilities for Senate control would come out to almost exactly 50-50.
However, the Democrats’ path would become much steeper if there’s even a modest Democratic bias in the polls. As the race stands, they’ll need to win a couple of states where they are slight underdogs. If they become somewhat heavier underdogs in those states, their chances of getting “lucky” in two or more states on election night will diminish toward zero. According to our model, Republicans would be 92 percent favorites to take the Senate if the polls have a 1-point Democratic bias, and all but certain to do so if it’s any larger than that.
What if the polls prove to have no bias? Our model shows Republicans as about 75 percent likely to win a Senate majority. This may seem confusing: Doesn’t the official version of FiveThirtyEight’s model have Republicans as about 60 percent favorites instead? Yes, but some of the 40 percent chance it gives Democrats reflects the possibility that the polls will have a Republican bias. If the polls were guaranteed to be unbiased, that would would make Republicans more certain of winning. (An additional portion of the Democrats’ 40 percent chance reflects the possibility that the polls will drift toward Democrats between now and Election Day.)
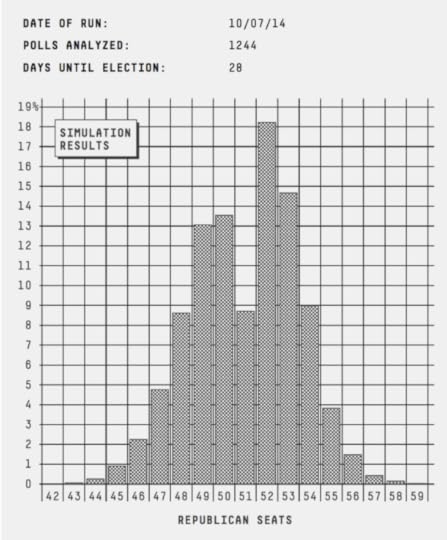
Put another way, the FiveThirtyEight model already accounts for the possibility that the the polls could be biased against Democrats. It also accounts for the prospect that they could be biased toward them. In that case, Republicans could win New Hampshire or North Carolina, where they currently trail in the polls. In about 16 percent of our simulations, Republicans wound up with 54 or more Senate seats. That would probably qualify as a “wave” election.
It’s reasonable — indeed healthy — to be skeptical about the polls. Many of the states on the ballot this year present unique polling challenges. Many have a large number of undecided voters. And the quality of the polling is mixed. Historically, the error in polls is considerably larger than their margins of error alone imply.
Just don’t assume your favorite candidate will catch all the breaks. Sometimes the polls are biased — in the opposite direction of what you were hoping for.


October 14, 2014
Senate Update: The Clock Is Ticking
 New Hampshire’s polling has been strange. Among polls released since Labor Day, eight have shown Democratic incumbent Sen. Jeanne Shaheen ahead by at least 5 percentage points. Three others — including a New England College poll released Tuesday — have shown narrow leads for Republican Scott Brown. Relatively few have been somewhere in the middle.
In my experience, it’s usually not a constructive use of one’s time to look for deeper meaning in these patterns. Over the long run, the distribution of polls in a state tends to form a bell curve around some mean. Over the short run, you may see weirder distributions. Randomness doesn’t always look random, especially over small samples.
Instead, take the macro view: Shaheen probably still holds the lead, but it has narrowed. (Before Labor Day, she hadn’t trailed in a single nonpartisan poll.) The FiveThirtyEight model puts Shaheen ahead by about 3 percentage points, compared with about 5 points when we launched our forecast in September.
But Brown’s chances of an upset have not changed. He had about a 20 percent chance in early September, and he has about a 20 percent chance now. That’s because the clock has been running.
Yep, time for another sports analogy. Say an NFL team leads 17-7 and has the ball at its own 20-yard line to start the third quarter. Its win probability is 83 percent. The third quarter is a bit wild, but the same team leads 27-20 at the end of it. Although its lead has narrowed, its win probability will have barely budged (it’s about 81 percent at the start of the fourth quarter) because there’s less time for the trailing team to complete a comeback.
In general, this dynamic helps the GOP because it holds leads in enough states to be the overall favorites in the race for Senate control. If the election were held today instead of in three weeks, the FiveThirtyEight model would have Republicans as about 2-to-1 favorites to win the Senate — instead of 60 percent. So the GOP’s win probability will gradually increase each day unless Democrats start catching up.
But this phenomenon hurts Republicans in the handful of competitive states where they trail. Like Brown in New Hampshire, Republican Thom Tillis has probably narrowed his deficit in North Carolina against Democratic incumbent Sen. Kay Hagan. But he still trails in the vast majority of recent polls, and his time is running short in a state with a fair amount of early voting.
Still, North Carolina and New Hampshire are by no means locks for Democrats. Republicans could still win them, especially if they’re having a strong night overall.
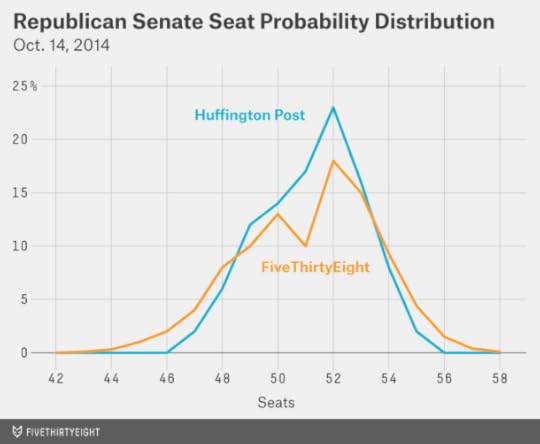
One difference between FiveThirtyEight’s forecast and most other models is that we tend to assume a higher degree of correlation between the various races. This yields a wider spread of potential outcomes.
As compared with the Huffington Post’s model, for instance (which I generally think is nicely designed), FiveThirtyEight’s model currently gives Republicans slightly lower odds of capturing a majority (60 percent versus 66 percent). But our model has Republicans with a slightly higher probability — 16 percent rather 10 percent — of finishing with at least 54 seats, which would almost certainly require them to win New Hampshire or North Carolina.
So even though there’s not much time left, the polls could still break toward one party in the final three weeks of the campaign — or there could be a systematic error in the polls on Election Day. Does that mean the polls might be “skewed”? More about that Wednesday.
Check out FiveThirtyEight’s latest Senate forecast.


October 10, 2014
Royals vs. Orioles Tops Our List Of Comeback Clashes In League Championship Series
The Baltimore Orioles and Kansas City Royals meet Friday night in Baltimore for Game 1 of the American League Championship Series, and they’re no strangers to the ALCS. The Orioles will be making their 10th ALCS appearance — only the New York Yankees (15 appearances) and the Oakland A’s (11) have made it more often. Kansas City will be appearing for the seventh time.
But both franchises’ glory days came long ago. The Orioles last made the ALCS in 1997 and averaged a 73-89 record between 1998 and last season. The Royals last made the ALCS in 1985 and were respectable for the next few years, but Kansas City had an average record of 68-94 from 1996 to 2013.
How unusual is it for two such moribund franchises to get their act together and meet in the League Championship Series?
In baseball, there’s a precedent for pretty much everything — so there are some other examples like this, such as the Seattle Mariners and Cleveland Indians in 1995. Still, the Orioles-Royals series qualifies as being as underdog-y as any other since the ALCS and NLCS began in 1969.
To identify cases in which two franchises with long losing track records met in the LCS, I took a weighted average of each team’s loss totals for the 20 seasons prior to the year it appeared in the championship series. We can call this figure WALT, for Weighted Average Loss Total. In calculating WALT, the most recent prior season is given a weight of 20, while a season from 20 years ago is given a weight of one. (Loss totals are prorated to a 162-game schedule.)
Then I took the harmonic mean of the WALT score for the two teams to appear together in each LCS. The harmonic mean places more emphasis on the lower of the two values. What this means is that a series will rank higher if both teams have been bad, as in the case of the Orioles and Royals, rather than if one has been awful while the other has been OK.
Here are the 10 most underdog-y championship series as rated by this measure:
10. 2007 NLCS: Colorado Rockies (87.8 WALT) vs. Arizona Diamondbacks (81.8 WALT); harmonic mean 84.4. The 2007 NLCS featured the novelty of two 1990s expansion teams facing each other. But the Diamondbacks had gotten off to a quick start, winning the World Series in 2001. The Rockies had struggled more, having reached the playoffs just once before 2007.
9. 1982 ALCS: California Angels (85.1) vs. Milwaukee Brewers (83.7); harmonic mean 84.4. The Angels had been mediocre rather than awful for most of the 1960s and 1970s; they’d reached the ALCS only once before (in 1979) but also never lost more than 95 games in a season. The Brewers were terrible from 1969 (when they began as the Seattle Pilots) to 1977 but were due for a breakthrough by 1982, having posted winning records in each year from 1978 to 1981.
8. 1989 NLCS: San Francisco Giants (86.3) vs. Chicago Cubs (83.0); harmonic mean 84.6. The Cubs have appeared in the NLCS three times — in 1984, 1989 and 2003 — and all three of those cases appear on this list. However, the 1970s and 1980s, what gets factored into their 1989 WALT score, weren’t quite as bad as some other eras for the franchise. The Giants had reached the NLCS in 1987, but that had come after awful play in the early 1980s.
7. 2002 ALCS: Minnesota Twins (86.7) vs. Anaheim Angels (83.7); harmonic mean 85.2. The Twins won the World Series in 1987 and 1991, but they were terrible for most of the intervening seasons before making the playoffs again in 2002. The Angels had been following their usual Atlanta Hawks-esque pattern of being slightly below .500 and never making an impact in the playoffs. In fact, 2002 was their first postseason appearance since their classic series against the Red Sox in 1986.
6. 1991 NLCS: Atlanta Braves (91.0) vs. Pittsburgh Pirates (81.0); harmonic mean 85.7. Atlanta and Pittsburgh would meet in the NLCS again in 1992, which is remembered for Francisco Cabrera’s walk-off single. But their 1991 series also went to seven games and featured four games decided by one run. It ranks slightly higher according to WALT since the Braves made the playoffs for just the second time since 1969 — and after having averaged 96 losses per season from 1985 through 1990.
5. 2003 NLCS: Florida Marlins (88.1) vs. Chicago Cubs (85.6); harmonic mean 86.8. Between 1909 and 2002, the Marlins and Cubs won only one World Series between them, and that went, in 1997, to Florida, who had come into existence as an expansion franchise only four years earlier. But the Marlins blew up their roster a year later and had a losing record for the next five seasons before winning the World Series again in 2003. The Cubs, meanwhile, missed their moment in 2003 in about the most painful way imaginable. But don’t worry, bleacher bums: Your team is going to win the World Series in 2015, according to “Back To the Future Part II.”
4. 1969 NLCS: New York Mets (104.5) vs. Atlanta Braves (75.1); harmonic mean 87.4. Before 1969, the Braves hadn’t made the postseason since 1958, when they did so in Milwaukee. But they had been a winning team for most of the 1960s — the high rank of this series is despite them rather than because of them. Instead it was the “miracle” Mets, who had averaged a record of 56-105 between their inaugural year in 1962 and 1968, who went on to win the NLCS and the World Series.
3. 1995 ALCS: Seattle Mariners (90.0) vs. Cleveland Indians (87.2); harmonic mean 88.6. If I were ranking the series subjectively instead of by a formula, this one would stand out along with Royals-Orioles. The 1995 ALCS fits the template of two notoriously terrible franchises hitting their stride at the same time. The Indians had a winning record just once from 1982 to 1993, and 1995 was their first postseason appearance since 1954. The Mariners had posted a winning record just twice in franchise history and had never made the playoffs before.
2. 1984 NLCS: San Diego Padres (91.7) vs. Chicago Cubs (87.2); harmonic mean 89.4. This has been a painful list for Cubs fans. The ball that went through Leon Durham’s legs in the decisive fifth game of the 1984 NLCS is not remembered as well as a similar play by Bill Buckner in the 1986 World Series (or the Steve Bartman incident in 2003). But it was every bit as consequential; the error improved the Padres’ probability of winning the series by 20 percent — about as much as Buckner’s play did given that the Mets and Red Sox still had a seventh game to play. However, the Padres rank as the slightly worse team by WALT: 1984 was their first playoff appearance and just the second time they finished with a winning record.
1. 2014 ALCS: Kansas City Royals (92.1) vs. Baltimore Orioles (87.7); harmonic mean 89.8. It’s almost certainly just a coincidence, but the other series on this list have given us more than their fair share of extraordinary moments. Here’s hoping the Orioles and Royals will give us a few more.

October 9, 2014
The ‘Maroon 6’: A Better Way To Look At The 2014 Senate Races
It’s natural to group Senate races based on which party controls the seat in the current Congress. The math seems easy enough. If Republicans win six seats held by Democrats without losing any seats of their own, they’ll take control of the Senate.
But this view both oversimplifies and overcomplicates the Senate landscape. It oversimplifies it because the contingency in the sentence above — “without losing any seats of their own” — is a huge assumption. Republicans are more likely than not to lose at least one of their seats. In 56 percent of the simulations the FiveThirtyEight Senate model ran Thursday morning, the GOP lost at least one seat it controls (usually Kansas, Georgia or Kentucky).
Meanwhile, the view overcomplicates the issue because a loss hurts exactly as much whichever party held the seat previously. If Mitch McConnell loses in Kentucky, that will count against Republicans just as much as if they fail to pick off Alaska.
Here’s a different way to think about the math.
Republicans need 51 seats to take control of the Senate.
There are 30 seats held by Republicans that are not up for election this year.
There are 15 more seats that are being contested but which Republicans have at least a 90 percent chance of winning, according to our forecast. These are mostly races with Republican incumbents, but they also include three seats — Montana, South Dakota and West Virginia — held by Democrats. South Dakota is less certain than the others because of independent candidate Larry Pressler — but Pressler, a former Republican, might caucus with the GOP if he wins.
That gets Republicans to 45 seats. They need six more.
Fortunately for the GOP, there are six races that lean toward Republicans: Alaska, Arkansas, Georgia, Iowa, Kentucky and Louisiana. We’ll refer to these states as the “Maroon 6” (because maroon is somewhere between red and purple). In each Maroon 6 state, the Republican candidate has a 65 percent to 75 percent chance of winning, according to the FiveThirtyEight forecast.
This might seem like a flush situation for the GOP. All it needs is to win those races for which they are ahead in the polls. If it does, it won’t need to worry about Kansas, where the independent Greg Orman is favored. And Republicans won’t need to win Colorado, where they have good chances but which is closer to being a tossup.
The problem is that although Republicans are favored in each individual race, it will be hard for them to go six for six. I know we can get obsessed with sports analogies, but another one is helpful here. The Seattle Seahawks are the best team in the NFL and will be favored in just about every game they play for the rest of the season. But it’s very unlikely that they’ll sweep all 12 remaining games to finish their season at 15-1. Sooner or later, Russell Wilson will throw a late interception or Steven Hauschka will miss a field goal or some opposition running back will have the game of his life — and Seattle will be upset. Similarly, it’s likely that one of the Democrats in the Maroon 6 states will find a way to win.
One complication is the outcome in each Senate race is not independent from the next one. If Republicans outperform their polls in Arkansas, for example, they’ll also be more likely to do in Alaska. Indeed, there have been years in which all or almost all of the competitive races broke in one direction.
If we assumed the outcomes in Maroon 6 states were entirely independent from one another, Republicans would have just a 14 percent chance of sweeping them. Our model, which accounts for the correlation among them, gives Republicans a 24 percent chance of winning all six.
But that still means the GOP is an underdog to win all six states. The correlation in Senate outcomes is much less pronounced than in presidential races, where the same two candidates are on the ballot in each state. And the Maroon 6 are a fairly diverse group. They include states with a Republican incumbent, a Democratic incumbent and no incumbent. They include two races (Louisiana and Georgia) that might require a runoff. They include lots of very red states but also Iowa, won by President Obama in 2012. They include Alaska, which presents polling challenges.
What if Republicans win five of the Maroon 6 instead? They’d still be in good shape, winning the Senate 84 percent of the time. Most likely this would be by winning either Kansas or Colorado.
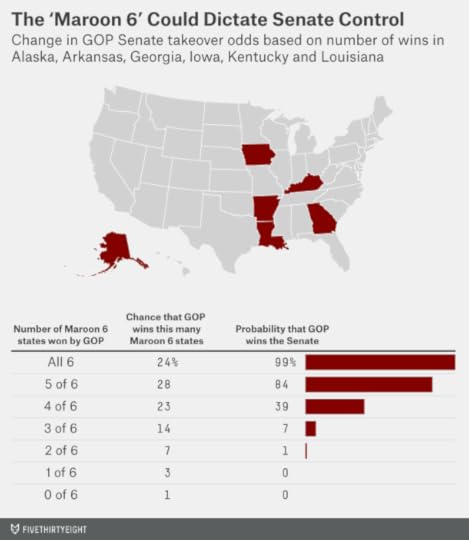
Win four of the six seats, however, and Republicans’ chances of winning the Senate fall drastically — to 39 percent. They’d probably need to win Kansas and Colorado.
And win just three of the six, and Republicans would face long odds. They’d not only have to win Kansas and Colorado, but also North Carolina or New Hampshire, where almost every recent poll has shown the Democrat ahead.
While Republicans have allowed Georgia and Kentucky to remain in play, Democrats have done a better job of locking up their “leaning” states. There have been a lot of recent days when Republicans got a good poll in a high-profile state like Iowa, but when our overall Senate forecast didn’t move toward them because Democrats got a good one in New Hampshire, North Carolina or Michigan. Republicans retain some chance in North Carolina, where the polls have shown a consistent but small lead for the Democratic incumbent Kay Hagan. But Michigan is almost certainly lost to them (the national party is pulling out of the race), and New Hampshire may be on its way there.
This makes a big difference: It means that Republicans’ position has not become analogous to the rich one that Obama had against Mitt Romney in 2012. Obama had hundreds of plausible paths to an electoral majority through various swing states — while almost every swing state was a “must win” for Romney. This year, Republicans have one very promising path — through the Maroon 6 states — and some good backup options by winning Colorado or retaining Kansas. But there’s not a lot beyond that.
The GOP’s situation isn’t bad by any means. But our program, which runs through all these permutations, still has the Democrats clawing their way to victory 43 percent of the time.

October 8, 2014
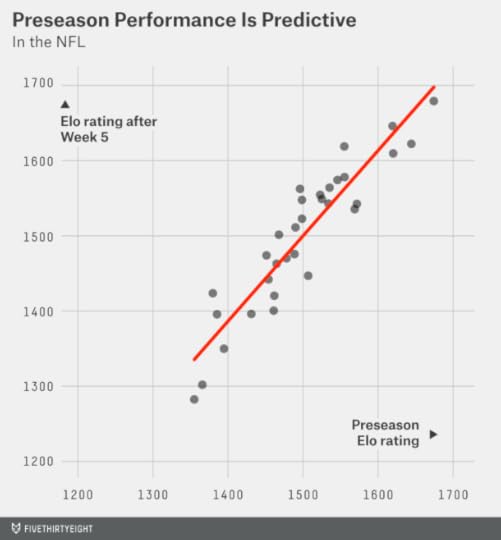
NFL Week 6 Elo Ratings And Playoff Odds
It was a week of fantastic finishes in the NFL. The Buffalo Bills beat the Detroit Lions on a 58-yard field goal by Dan Carpenter just moments after Lions’ kicker Alex Henery shanked his third field goal attempt of the game. The Cleveland Browns came back from a 28-3 deficit to beat the Tennessee Titans, the largest comeback in the history of the franchise. Two other games were decided in overtime.
The reaction to all this from our NFL Elo ratings? Meh.
Last week changed very little as Elo sees things. Elo ratings shift more when there are upsets. But last week, the pregame Elo favorites were 13-2 on the week. The Lions and Titans were the only losers. Elo ratings also shift more when scores are lopsided, so all the close finishes didn’t move the needle much.
There were a couple of exceptions. The New England Patriots’ 43-17 win over the Cincinnati Bengals was the most impressive performance of the week, according to Elo, and earned the Patriots a gain of 29 Elo points. The Green Bay Packers gained 24 points after demolishing the Minnesota Vikings. And the Denver Broncos added 22 points after a big win against the Arizona Cardinals.
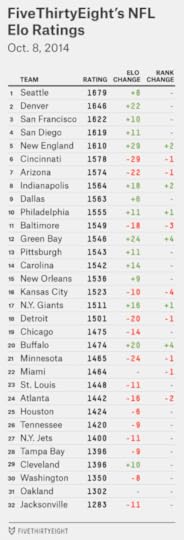
But for the most part, the Elo standings not only look similar to a week ago, they also look much like they did at the start of the season. (Preseason rankings were based on a team’s Elo rating at the end of the 2013 season.) The top five teams in the preseason rankings were the Seattle Seahawks, the San Francisco 49ers, Denver, New England and the Carolina Panthers. Four of them remain in the top five (Carolina is the exception). The bottom five were the Jacksonville Jaguars, the Oakland Raiders, Houston, Cleveland and Washington. Four remain in the bottom five (Houston is the exception).
Although the Elo ratings are a somewhat conservative system, this degree of stability in the standings is unusual. The correlation between preseason Elo ratings and the current scores is .93. My colleague Neil Paine and I have calculated Elo ratings for all NFL seasons since the AFC-NFC merger and found that this is the highest correlation on record; the typical correlation is about .8 instead.
The Dallas Cowboys are the biggest Elo gainers this season, having added 67 points since the start of the year. But for the most part, this has been a season of playing up, or down, to expectations. The San Diego Chargers (+64) are the next-biggest Elo gainers after the Cowboys, and they were ranked fairly well to begin with. The teams that have lost the most Elo points are the Jacksonville Jaguars (-73) and the Oakland Raiders (-64), and they started the year as the two lowest-rated franchises.
Usually, there are more drastic swings: Some team that was expected to be great gets off to a terrible start or vice versa. Since 1970, the team with the largest change in its Elo rating through the first five weeks of the season was the 1987 New York Giants (-152), who started 0-5 after winning the Super Bowl the prior year. The biggest gainers were last year’s Kansas City Chiefs (+141), who started 5-0 (and ran their record to 9-0) after having gone 2-14 in 2012. We haven’t seen anything like that this season.
Playoff odds are also not much changed from last week:

Green Bay saw its postseason chances improve the most. It’s a 54 percent favorite to make the playoffs, up from 38 percent last week. The Packers were helped not only by their big win against a divisional rival, but also by the Lions’ loss. The Bengals saw the biggest decline in their playoff odds, although they retain a 2-in-3 chance of making the postseason.
Also of note is the resurgence of the Indianapolis Colts. After the Colts started out 0-2, we noted that they weren’t in such bad shape because they play in the NFL’s worst division, the AFC South. After three wins in a row, the Colts are more likely than any other team to win their division.
The Bengals’ loss eliminated the NFL’s lone undefeated team. But both the Jaguars and Raiders remain winless, and each has some chance of finishing the season with a bagel. The Raiders (who were idle last week) finished the season at 0-16 in 11 percent of our simulations. The Jaguars (who have a more forgiving schedule) did so 7 percent of the time.
It’s unusual to have two such awful teams in the league at the same time. The Jaguars’ Elo rating of 1283 is the fifth-worst mark after the first five weeks of the season since 1970, while the Raiders’ 1302 rating is the 13th worst. The all-time worst Elo rating through five weeks, incidentally, belonged to last year’s Jaguars (1258). The best Elo rating through five weeks was 1745, from the 1986 Chicago Bears.
Elo ratings can also be used to predict point spreads. Last week, they had a reasonably good record, going 8-5-1 against closing Las Vegas lines (not counting one game where the Elo line exactly matched the Vegas line). But they’re 33-38-3 overall on the season; we do not recommend you bet on them. The Elo ratings have had a good straight-up record so far, having called 54 of 76 winners correctly (71 percent).
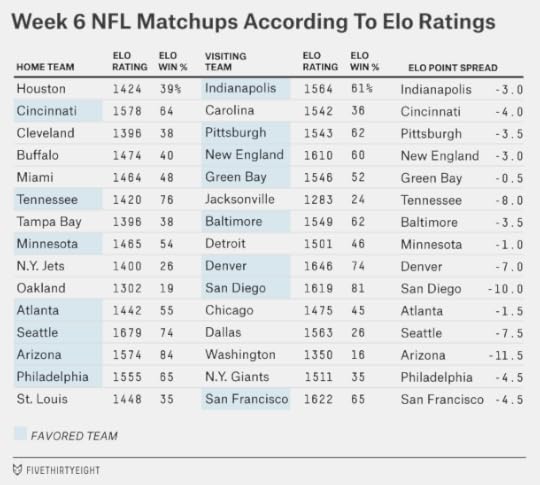
Elo has consistently been bullish about Chargers. Last week, it had San Diego as 10.5-point favorites at home against the New York Jets; Vegas had them favored by a touchdown instead. There’s a similar discrepancy this week; Elo favors the Chargers by 10 points at Oakland, while Vegas has the Chargers as seven- or eight-point favorites.
But there’s a much more significant difference in the game between Arizona and Washington. The Cardinals are playing at home, and the Elo line has them as 11.5-point favorites. Vegas lines have them favored by just 3.5 points. I’m having trouble wrapping my head around why Vegas has Arizona as such a slim favorite. A 3.5-point line implies that the teams would be close to even on neutral turf. Sure, Arizona has some injuries, but Washington has been awful for the past two seasons even when at full strength.

October 7, 2014
Senate Update: What’s The Matter With South Dakota?
Last month, the battle for Senate control was shaken up when the Democrat Chad Taylor dropped out of the race in Kansas, clearing way for a contest between the center-left independent Greg Orman and the unpopular Republican incumbent Pat Roberts. Although Orman, who has led or tied Roberts in all subsequent polls, is not certain to caucus with Democrats even if he wins the race, this is nevertheless a major burden for the GOP. Were Republicans sure winners in Kansas, their chances of keeping the Senate would be 66 percent — instead of 56.5 percent, as it is in Tuesday’s FiveThirtyEight forecast. That’s the difference between being clearly favored and having odds just barely better than a coin flip.
But could Republicans have another problem on their hands — in another prairie state?
South Dakota’s senate race also features an independent candidate: Larry Pressler, the former three-term Republican Senator. In contrast to Orman, who had run a slick campaign even before he’d begun to receive national media attention, Pressler’s bid seemed more quixotic. He’d raised only $107,000 through June 30, has a website that looks more like a personal blog, and had even joked that he “might demand a recount” if he won.
Three-way races are nevertheless quite volatile. So our forecast model had been accounting for some possibility that Pressler could give the frontrunner, the former Republican Gov. Mike Rounds, some trouble — either by winning the race himself or by splitting the vote enough to throw the contest to Democrat Rick Weiland. When it launched last month, the FiveThirtyEight forecast had given Rounds a 86 percent chance of winning — reasonably good, but not quite a sure thing.
Rounds’ position had seemed to become certain in the subsequent weeks. Four polls of South Dakota in September put Rounds ahead by double digits against both Pressler and Weiland. Then this past weekend, a YouGov poll of the state had Rounds 15 points ahead of Wieland — and Pressler with just 12 percent of the vote.
But a SurveyUSA poll of South Dakota on Tuesday told a different story. It had Pressler moving into second place with 32 percent of the vote and gaining ground at Rounds’ expense. Rounds led with 35 percent, and Weiland was in third with 28 percent.
It’s not entirely clear how to reconcile the conflicting polls. YouGov’s low number for Pressler looks like a modest outlier, and it has also had low numbers for independent candidates in other states, including Orman. It may be that the firm’s methodology, which relies on weighting by party identification, is poorly equipped to handle races like these. But for the time being, SurveyUSA’s poll is something of an outlier as well — although SurveyUSA is by far the highest-rated pollster to have surveyed the state.
There’s been more agreement about Weiland’s standing. No poll all year — including his campaign’s internal poll — has shown Weiland with more than 30 percent of the vote. His numbers have consistently been in the mid-to-high twenties. It’s hard to win a race under those circumstances. Even assuming that Weiland picked up some undecided voters and that some votes went to a fourth candidate in the race, the independent Gordon Howie, he’d have to hope that Pressler and Rounds split the rest of the vote almost exactly — hitting an outcome outcome like Weiland 34 percent, Rounds 33 percent, Pressler 32 percent, Howie 1 percent almost on the nose.
This is a challenging race to forecast — both because of the inconsistent polling and the three-way dynamic. But the logic programmed into the FiveThirtyEight model is as follows: because Pressler is more ideologically similar to Rounds than Weiland — at least according to the statistical measures that we use — the model assumes that Pressler and Rounds will mostly trade votes with one another rather than with Weiland. In other words, Pressler’s gains will tend to come at Rounds’ expense, and vice versa. (See here for a more technical explanation.)
That makes Pressler the more likely candidate to pull off the upset; he can gain ground relative to the frontrunner more quickly. The FiveThirtyEight model currently gives Pressler a 9 percent chance of winning the race, versus 3 percent for Weiland. Those chances will grow if more polls come along with results like SurveyUSA’s.
Yet another complication is that Pressler has refused to say who he’ll caucus with. Our ideology ratings imply that he’s equivalent to a moderate Republican — just as they imply that Orman is equivalent to a moderate Democrat. So the model assumes there’s a 75 percent chance Pressler would caucus with Republicans if he wins, just as it assumes there’s a 75 percent chance Orman would caucus with Democrats. But Pressler endorsed Barack Obama in both 2008 and 2012 and has at times implied that he’d refuse to caucus with anybody.
Rounds remains the favorite. It’s not clear that Pressler has enough money to run a substantial number of advertisements in the closing days of the campaign — or to finance a voter turnout operation. And for the time being, the SurveyUSA poll is mostly alone.
But the race increases the chance that we’ll have a “messy” outcome on Election Day. Already, it looks likely that Louisiana will require a December runoff, and Georgia may require a January runoff. Orman, if he wins, will have to decide who to caucus with. Alaska, one of the most important races this year, is usually one of the slowest states to count its vote. There’s also the potential for a recount in one or more decisive states. If you’re an election junkie, you may want to postpone that mid-November vacation.
Check out FiveThirtyEight’s latest Senate forecast.

October 6, 2014
Same-Sex Marriage Is Now Legal For A Majority Of The U.S.
Although the trend toward greater acceptance of same-sex marriage has been evident for some time both in jurisprudence and public opinion, the speed with which it has become the law of the land is striking.
The U.S. Supreme Court’s decision Monday to decline hearing a series of appeals cases on same-sex marriage will have the effect of immediately legalizing gay marriage in Indiana, Oklahoma, Utah, Virginia and Wisconsin. When combined with the 19 states (and the District of Columbia) that had previously legalized same-sex marriage, these states have a collective population of roughly 165 million, according to 2013 census figures.
That means for the first time, same-sex marriage is legal for the majority of the U.S. population. The 26 states where the practice is not legal have a total population of about 151 million.
The Supreme Court’s decision may also lead to the legalization of same-sex marriage in Colorado, Kansas, North Carolina, South Carolina, West Virginia and Wyoming. Those states have an additional 25 million people combined. If they follow suit, 30 states and the District, totaling about 60 percent of the U.S. population, would allow same-sex marriage.
Two years ago at this time, same-sex marriage was legal only in Connecticut, Iowa, Massachusetts, New Hampshire, New York, Vermont and the District, which together have about 11 percent of the U.S. population.

October 5, 2014
Senate Update: Lots Of Polls But Little Change
Sunday morning brought a bonanza of new Senate polls. Marist College, on behalf of NBC News, released new surveys in Kansas, Iowa and North Carolina. YouGov released its latest round of polling in every Senate race in conjunction with CBS News and The New York Times.
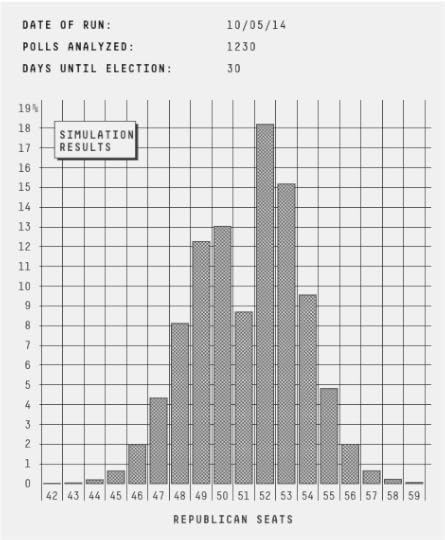
But the polling had almost no impact on the bottom line: Republicans remain slight favorites to win the Senate in the FiveThirtyEight forecast. Their chances are 59.4 percent according to our model, not meaningfully changed from 58.5 percent as of our previous update on Friday.
Why so little change? Neither YouGov nor Marist has had much “house effect” this cycle, meaning that their results have usually tended to match the FiveThirtyEight forecast to begin with. YouGov also re-interviewed many respondents from previous waves of its Senate polling, a technique that tends to produce less change than the traditional method of contacting an entirely new batch of respondents.
YouGov and Marist did have a substantial disagreement in Kansas: Marist showed the independent candidate, Greg Orman, 10 points ahead of the Republican incumbent, Pat Roberts, while YouGov had a tied race. YouGov’s poll is the first to show anything other than a lead for Orman since the Democrat, Chad Taylor, dropped out of the race in early September. Still, it was counterbalanced by Orman’s strong result in the Marist poll.
The outcome in Kansas remains uncertain because of the unusual dynamics of the race and because the polling differs so much from the state’s Republican-leaning “fundamentals,” but our model now has Orman as a 65 percent favorite, his highest figure to date.
In Iowa, Marist had a two-point lead for the Republican, Joni Ernst, while YouGov had the Democrat, Bruce Braley, up by a percentage point instead. Iowa leans slightly toward Ernst, who is about a 60 percent favorite in the FiveThirtyEight model. But the consensus of surveys suggests that the race hasn’t gotten away from Braley as much as last week’s Des Moines Register poll might have implied.
One of Democrats’ better results in the new batch of polling was in Colorado, where the YouGov poll had Mark Udall three points ahead — reversing a string of polls that had the Republican, Cory Gardner, in the lead. However, as we described on Friday, the polls that showed an advantage for Gardner had been a somewhat Republican-leaning bunch. In contrast to Iowa, where it would be worth betting on Ernst if you could do so at even odds, Colorado is close to being a true tossup.
The least favorable results for Democrats were the YouGov numbers in Alaska, Arkansas and Louisiana, all of which had Republican challengers ahead of the Democratic incumbents by margins of about 5 percentage points. Democrats Mary Landrieu of Louisiana and Mark Begich of Alaska each saw their chances decline to about 25 percent from 30 percent with the new polls added.
It would be a mistake to dismiss the importance of these states. If Republicans become more certain to win them, they’ll have a clear path toward picking up six Democrat-held Senate seats, as the races in Montana, South Dakota and West Virginia look like near-certain gains for the GOP. Republicans would then need to win just one of Iowa, Colorado or Kansas to take control of the Senate (or they’d need to convince Orman to caucus with them if Roberts loses). With only 30 days to go until the election, any polling confirming Republican leads in these states qualifies as bad news for Democrats.
But as we’ve said repeatedly, it’s not yet time for Democrats to panic. Republicans retain the clearer path to a majority, but the race is competitive — and the outlook hasn’t changed much.
Check out FiveThirtyEight’s latest Senate forecast.

October 3, 2014
We’ve Added State-By-State Polling Detail To Our Senate Forecast Interactive
Those of you who are as obsessive as we are about checking for new Senate polls might have noticed a change in the FiveThirtyEight Senate forecast interactive. We’re now listing the polls the FiveThirtyEight model uses in each state, along with how the model weights and adjusts them.
Here’s what the data looks like for Colorado, for example:

We’ve listed both the raw and adjusted margin associated with each poll. As we describe here, the model adjusts polls for a few reasons. If a survey is conducted among registered voters (or all adults) rather than likely voters, the model will shift its results toward Republicans because likely voter polls tend to show better results for the GOP (and also tend to be more accurate). However, almost all polls being released now are conducted among likely voters, so this has little effect in most states. Polls are subject to a trend line adjustment based on changes in the generic congressional ballot, but this also has little effect.
Instead, most of the difference between the raw and adjusted figures has to do with our house effects adjustment. Some pollsters consistently show more favorable results for one party or the other compared to other polls. Quinnipiac University polls, for example — although they have a very good track record — have had somewhat Republican-leaning results this year compared with the consensus. So the FiveThirtyEight model treats the Quinnipiac poll that showed Republican Cory Gardner up by 8 percentage points as closer to a 6-point GOP lead instead.
You can also see the weight the FiveThirtyEight model assigns to each poll. Keep in mind: The weights are based on sample size, recency and a firm’s pollster rating. In Iowa, for example, the recent Public Policy Polling survey is weighed about as much as the recent Des Moines Register (Selzer & Company) survey. Although Selzer has a much better pollster rating, PPP took a considerably larger sample; in this case, those two factors roughly cancel out.
If you don’t see a poll listed, it may be because it’s a poll conducted directly on behalf of a candidate or party committee; FiveThirtyEight does not use these polls in its forecast. (We do use polls from interest groups.) Or it may be that we’ve missed the survey, or it’s too new to have been added to our database. Please drop us a line if you think you’ve found a poll we’ve missed.
On the right-hand side of the polls page, you can see the steps the FiveThirtyEight model takes in making its forecasts. Here are those steps for Colorado, for instance.
In this case, the Democrat (Mark Udall) benefits slightly from the polling adjustments because the recent polls in Colorado have been a slightly Republican-leaning bunch (according to our house effects calculation). But this isn’t true in every state.
“State fundamentals” reflects a regression-based estimate of the election result. The factors included in the estimate are described in detail here and include measures of state partisanship, candidate ideology scores, generic congressional ballot polls, fundraising totals and others. In Colorado, the fundamentals calculation has Udall slightly favored instead of slightly behind.
The fundamentals receive little weight in well-polled states like Colorado. Specifically, the model assigns them a weight of 0.35. In Colorado, the polls have a cumulative weight of about 6. That means the polls make up about 95 percent of the forecast.
Finally, the model makes a distinction between the “now-cast” — what we project would happen in an election held today — and the projected Election Day vote shares. This reflects the historical tendency for midterm elections to favor the party that doesn’t occupy the White House. This adjustment is conservative to begin with and then phases out completely by Election Day. Because we’re into October, it has almost no effect now.
Have fun browsing, and let us know if anything looks awry.

October 2, 2014
Yelp And Michelin Have The Same Taste In New York Restaurants
It’s supposed to be the food fight of the century. In the blue corner we have Yelp, the upstart crowdsourced review site that takes on restaurants of all shapes and sizes. Critics allege that Yelp reviewers are unsophisticated, cheap and obsessed with trivial details of the restaurant experience. But Yelp is a heavyweight. The company is now worth about $5 billion, and poor Yelp reviews can knock a restaurant out of business.
In the red corner, we have the Michelin Guide, a 114-year-old veteran of the field. Michelin reviewers are accused of being pretentious and “out of touch” and of enforcing a rigid view of dining that’s biased against certain cuisines. But Michelin still packs a punch — it can make chefs cry. Of the 27 New York restaurants to have lost their Michelin stars since 2005, 10 — or almost 40 percent — have closed.1
But at least when it comes to New York, this isn’t much of a battle. Yelp and Michelin largely agree on the best restaurants.
Michelin revealed its 2015 ratings for New York on Tuesday. I took each restaurant on the Michelin list and looked up its Yelp rating. I also looked up Yelp ratings for restaurants that have lost their Michelin stars since Michelin first published a New York guide in November 2005. This serves as a control group for “Michelin-esque” restaurants that are no longer performing up to the guide’s standards.2
The tale of the tape is below. Most of the columns should be self-explanatory, but a brief explanation of the others follows:
Cost is the price of a restaurant on a scale from one ($) to four ($$$$) dollar signs as listed by Yelp.Average Yelp stars is a restaurant’s average review on Yelp’s scale from one star (awful) to five stars (great).3Adjusted review count is the number of Yelp reviews adjusted for the length of time the restaurant was in business. For more details on this, see the description from our Burrito Bracket project, which used a similar method to evaluate the popularity of burrito-selling establishments.4VORB is a formula that combines the review count and the star ratings. It’s also a relic from our Burrito Bracket project.5 When we rated burritos, VORB stood for “Value Over Replacement Burrito” — here, you can think of it as “Value Over Replacement Bistro.”Here are the restaurants sorted by VORB score:

Keep in mind that VORB reflects both review quality and review volume. Peter Luger Steak House rates high on the VORB list mostly because of its extremely high number of reviews. On the flip side, Chef’s Table at Brooklyn Fare has a low review volume6 but its Yelp rating (4.62 stars) is terrific.
But let’s get back to the food fight (or lack thereof): There’s a reasonably strong correlation between Yelp and Michelin ratings. Of current and former Michelin-starred restaurants, those with the highest VORB scores are Le Bernardin (28.7), Eleven Madison Park (28.2), Gramercy Tavern (27.7), Daniel (26.6), Per Se (25.9) and Jean-Georges (23.3). Four of those six restaurants have three Michelin stars, the top rating. The exceptions are Daniel, which was just demoted to two Michelin stars, and Gramercy Tavern, which has one.
By contrast, most of the restaurants with the lowest VORB scores have since lost their Michelin stars, (and in some cases have also closed). The bottom five are the defunct Vong and the still-open Laut, Pok Pok NY, Lan Sheng and A Voce Columbus. Mind you, these aren’t the worst restaurants in New York. I’d personally vouch for a couple of them as being pretty good. But the standard is high, and Yelpers feel they’re closer to average than to the top tier.
The correlation between Yelp stars and Michelin stars is highly statistically significant.7 Indeed, it forms an eerily linear progression. The restaurants to have lost their Michelin stars have 3.83 Yelp stars on average, barely better than the average for all restaurants citywide. Each additional Michelin star translates to about 0.2 additional Yelp stars. The one-starred Michelin restaurants have an average Yelp rating of 4.02 stars. The Michelin two-star restaurants have a Yelp rating of 4.25. The Michelin three-star restaurants average 4.47 Yelp stars.8
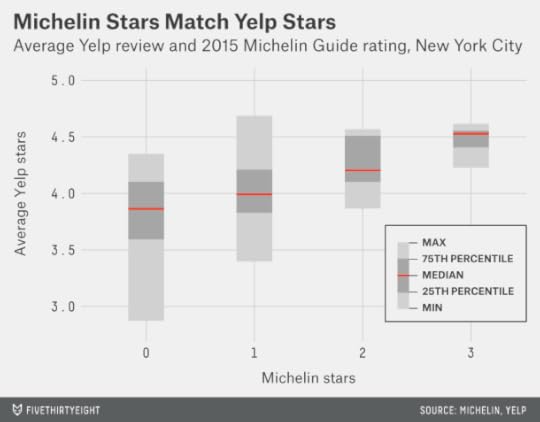
Still, these reflect the group averages, and there are a few restaurants that buck the trend. Gramercy Tavern, as I mentioned, is rated very highly by Yelp but has just one Michelin star.
Where do differences arise? One apparent theme has to do with cost — but it runs in the opposite direction of what you might expect. Controlling for their Michelin ratings, Yelp actually rates restaurants higher when they are more expensive. Each additional dollar sign (e.g. going from $$ to $$$) works out to 0.2 additional Yelp stars; the relationship is highly statistically significant.

What the heck? I can think of several plausible theories:
Generally, service and decor scale up with price more than food quality does. Many people are skeptical about this, but Michelin star ratings are theoretically based on the quality of the food alone9 whereas Yelp reviewers are presumably also concerned with service and decor. Under this theory, it’s not that Yelpers like expensive restaurants. But they’re willing to pay for better service and that’s factored into their ratings.It could also be, as has been shown to be the case with wine, that food tastes better when it’s more expensive, especially to nonprofessional reviewers. Michelin reviewers — who also have the luxury of eating on an expense account — may be modestly better at avoiding this bias.Price may be a proxy for the market’s view of a restaurant’s quality. Maybe you have a Michelin star; if you can’t persuade your customers to pay Michelin prices, it won’t help you stay in business. Prices and Yelp ratings both reflect the wisdom of crowds, and so it shouldn’t be a surprise if they’re highly correlated with one another.Finally, perhaps Michelin does a poor job of picking affordable restaurants that break from the template of the “Michelin-esque” experience. More on this in a moment.Keep in mind that this finding is derived only from New York restaurants that currently or formerly held a Michelin star — a very narrow range of culinary experience. In looking at a vastly different type of restaurant — those which serve burritos — my colleague Anna Maria Barry-Jester instead came away with the impression that Yelp reviewers place too much emphasis on price and portion size as opposed to the quality of the food.
My personal experience has been that perception of price has a lot to do with expectations. You might be outraged when a mediocre sandwich costs $13 at a museum cafeteria or a ballgame — or when a mediocre burrito costs $11. But later that night, you might not flinch at spending $350 while taking your wife out on her birthday because you were expecting the steep bill.10
Another theme is that certain cuisines do poorly in Yelp as compared with their Michelin star ratings. Consider the four restaurants with the lowest VORB scores. They are (or were), respectively, a Vietnamese restaurant, a Malaysian restaurant, a Thai restaurant and a Chinese (Szechuan) restaurant.
It’s not that Yelpers rate these cuisines poorly overall. But in the United States, they tend to be associated with cheap takeout food. Even to a fairly experienced diner, a Michelin-starred Thai restaurant might seem like an oxymoron.11 Michelin’s reviewers may also lack a template for these types of restaurants. Zabb Elee, an unpretentious Thai restaurant in the East Village, earned a Michelin star this year. It’s very good, but most foodies I know prefer SriPhaPhai in Queens (SriPhaPhai also gets much better Yelp ratings).
Outside of the canonical European cuisines (French, Italian) and “new American” food,12 Michelin seems to struggle. Thai restaurants and Indian restaurants, for example, have often won Michelin stars only to lose them a couple of years later. It’s almost as though Michelin is cycling through representatives of these cuisines at random — putting forth some effort to increase the diversity of its list but not going to great lengths to identify the best examples. To a lesser extent, Michelin may struggle with American food served in a more informal setting or for what lack of a better term might be called “hipster” cuisine. The Breslin, a gastropub in the Ace Hotel, has a Michelin star, but there are dozens of similar restaurants with higher Yelp ratings.
Could Michelin also have a pro-Manhattan bias? In one respect, this might seem self-evident. Almost 80 percent of the Michelin-starred restaurants in the 2015 Guide are in Manhattan while only 40 percent of New York’s restaurants are.
One way to test this is to look at whether Michelin-starred restaurants in Brooklyn and Queens13 receive higher Yelp ratings on average. If so, that might indicate that restaurants in the outer boroughs need to do more to receive the same level of recognition from the Michelin Guide.
The evidence is ambiguous. Michelin-starred restaurants14 in Brooklyn and Queens have an average Yelp rating of 4.17, as compared with 3.99 for those in Manhattan. However, the difference is not highly statistically significant and there is no real difference in their VORB scores. This doesn’t mean Michelin is unbiased — it may be that Yelpers have the same biases.
In most respects, the challenge in evaluating restaurants is the same as when looking at any other statistical distribution. It’s easy to identify the outliers — the extraordinary restaurants and the execrable ones. Michelin and Yelp largely agree on those. Distinguishing the very good restaurants from the average ones is more challenging. There may be no substitute for eating your way through them.

Nate Silver's Blog

- Nate Silver's profile
- 729 followers

