
Nate Silver's Blog, page 162
October 31, 2014
FiveThirtyEight’s Gubernatorial Forecasts: A Lot Of Really Close Races
Most of our focus this year has been on the battle for the U.S. Senate. But 36 states will hold gubernatorial elections Tuesday. We hope it’s not too late to give you some polling-based forecasts of how they might turn out.
We’ve adapted a pared-down version of our Senate model to handle gubernatorial races. Unlike the Senate model, these gubernatorial projections use polls only — rather than polls plus “fundamentals.” Otherwise, the models are about the same:
We take polls and weight them based on recency, sample size and the FiveThirtyEight pollster ratings.We adjust polls for house effects, and we adjust registered voter polls to make them comparable to likely voter surveys.We estimate the uncertainty in each projection based on most of the same factors we use for the Senate: the volume and quality of polling, the number of undecided and third-party voters, the amount of variation in the polling and the number of days until the election.11That’s pretty much it; you can read about a few other simplifications we’ve made in the footnotes12.
Three gubernatorial races involve special circumstances this year.
In Alaska, there’s no Democratic candidate on the ballot. Instead, the figures you’ll see below represent the margin between the independent Bill Walker and the Republican incumbent, Sean Parnell.
Georgia’s gubernatorial race — like the state’s Senate race — will require a runoff if no candidate gets past 50 percent of the vote. Our projection reflects the likelihood that Gov. Nathan Deal, the Republican, will win the plurality of the vote Tuesday; we are not making a separate projection for the runoff. (We can tell you how likely a runoff is to occur: Our model estimates there’s a 48 percent chance of one.)
Then there’s Maine, where the gubernatorial race had been a three-way contest among Republican Gov. Paul LePage, Democrat Mike Michaud and the independent Eliot Cutler. Cutler had averaged about 14 percent of the vote in recent polls, while LePage and Michaud hovered at about 40 percent each.
On Wednesday, however, Cutler announced that although he was not dropping out of the race, his supporters should feel free to vote for one of the other candidates. Cutler also lost the endorsement of popular Maine Sen. Angus King, a center-left independent, who endorsed Michaud instead.
This is an unusual circumstance: Cutler, in essence, halfway dropped out of the race. So in the absence of any polls conducted since his announcement, we’re assuming that Cutler will lose half his vote, which will be redistributed to Michaud and LePage. But we’re not assuming those votes will be distributed equally.
Instead, it’s likely that Michaud will benefit more from the news; Cutler takes left-of-center policy positions that are largely similar to Michaud’s. This is confirmed in a number of polls — conducted before Cutler’s announcement — that asked about the second choice of his supporters. They found, on average, that 64 percent of his vote would go to Michaud and 36 percent to LePage.13 So our model takes half of Cutler’s vote from any polls conducted before his announcement and gives 64 percent of it to Michaud (and the rest to LePage). This is enough to make Michaud a narrow favorite in the race (our model gives him a 56 percent chance to win). Without the extra votes from Cutler, his chances would be 36 percent.
Without further ado, here are our projections in each state.
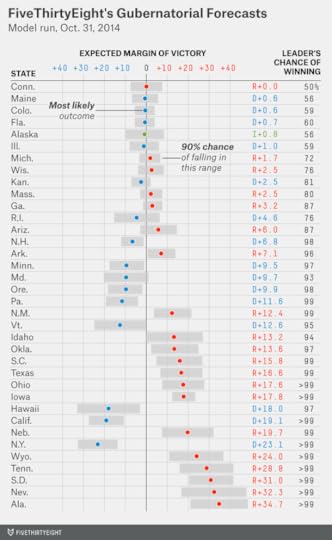
As in the Senate battleground, there are a number of extraordinarily close races: 11 in which the projected margin of victory is within 3 percentage points.
Some of these races, including Alaska and Connecticut, are about as close to true tossups as you can get. In others, one candidate has a slight advantage.
Gov. Scott Walker of Wisconsin, who leads by 2 or 3 percentage points in the polling average, is a 76 percent favorite to win re-election. Another Republican, Rick Snyder of Michigan, has a 72 percent chance.
Charlie Crist of Florida, the former Republican turned Democrat, is just slightly more likely than not to oust Republican Gov. Rick Scott from office. A slightly safer bet for a Democratic pickup is in Kansas, where Paul Davis has a 81 percent chance of beating Republican incumbent Sam Brownback.
Martha Coakley, the Democratic candidate in Massachusetts who famously lost her lead against Republican Scott Brown in a special Senate election in 2010, looks more likely than not to blow a big advantage again; our forecast has Republican Charlie Baker with an 80 percent chance of winning. And Democrats hoping for signs that Texas has turned purple will have to hold on for at least two more years. Wendy Davis, far behind in the polls, has only a 0.6 percent chance of beating Republican Greg Abbott.
We plan to have at least one more forecast of the gubernatorial landscape, along with a deeper analysis of some of the individual races, before Tuesday.


Senate Update: With 4 Days Left, Here’s The State Of The Races

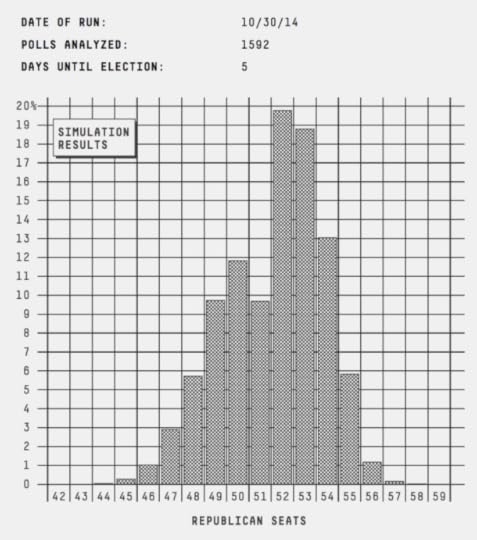
The GOP’s chances of winning the Senate are 68.5 percent, according to the FiveThirtyEight forecast, its highest figure of the year.
Among the 20 new polls released Thursday — it looks like there will be no Great Poll Shortage after all — two were principally responsible for Republican gains. The first was in Kentucky, where a SurveyUSA poll for the Louisville Courier-Journal had Republican incumbent Mitch McConnell ahead 48-43 over Democrat Alison Lundergan Grimes. The poll represented a shift from SurveyUSA’s previous two polls, which had a 1 percentage-point lead for McConnell and a 2-point lead for Grimes. With SurveyUSA (a highly rated pollster) now more in line with other polls of the state, we have a clearer story in Kentucky. It’s one that probably ends in a victory for McConnell, whose chances of winning are up to 87 percent.
The other poll was in Arkansas, which hasn’t been surveyed as often as other key Senate races. That poll, from the University of Arkansas, found Republican Tom Cotton up by 13 percentage points over Democratic Sen. Mark Pryor. No other poll of the state has shown Cotton with a double-digit lead, but he hasn’t trailed in a nonpartisan poll since Sept. 22. When the choice is between polls that show a candidate with a small lead and polls that show him with a large lead, he’s usually in good shape just a few days before Election Day.
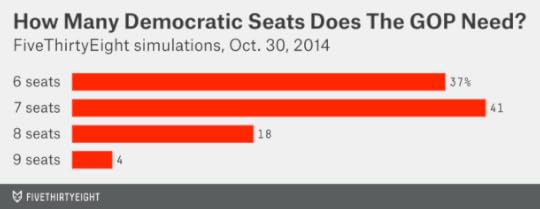
Speaking of which, it’s not too early to look ahead to election night (along with our partners at ABC News, we’ll be covering everything; we hope you’ll join us). The number you’ll be hearing about all night is six — as in, Republicans need to net six seats from Democrats to win control of the Senate.
As we’ve pointed out before, the “net” part of that phrase is key. Republicans will have to win more than six Democratic-held seats if they lose a couple of their own. Their incumbent in Kansas, Sen. Pat Roberts, is only even-money to win re-election (although there’s a chance independent Greg Orman, even if he wins, could caucus with Republicans). The GOP candidate in Georgia, David Perdue, is ahead by only about 1 percentage point against Democrat Michelle Nunn, and that race could go to a runoff. McConnell is likely, but not certain, to survive.
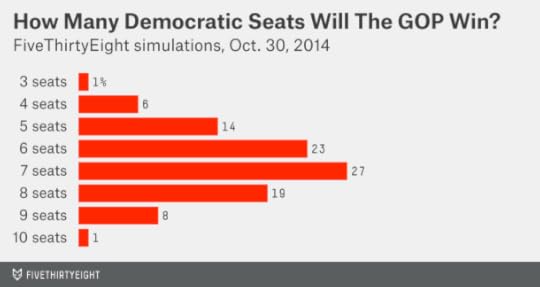
More often than not, in fact, Republicans’ magic number will not be six seats. Instead, in more than 60 percent of our simulations the FiveThirtyEight model ran Thursday night, Democrats won at least one GOP-held seat. And about 20 percent of the time, they won at least two Republican seats. So the GOP’s magic number could be seven, eight or even nine seats instead.
Fortunately for Republicans, they have an abundance of Democratic targets. Running in order from the most likely to least likely pickups:
1. Montana (99.8 percent chance of a GOP win)
2. South Dakota (99 percent)
3. West Virginia (98 percent)
South Dakota looked competitive for a fleeting moment. But otherwise these races, red states where Democratic incumbents have retired, have been in the Republican column all year. The GOP is almost certain to win them, giving it a three-seat head start.
4. Arkansas (90 percent chance)
Pryor trails by 5 or 6 percentage points in the polling average. Few candidates have won a Senate election when trailing by that much so late in the race.
5. Louisiana (77 percent chance)
The Democratic incumbent, Mary Landrieu, also trails by about 5 percentage points — but those are in polls of the Louisiana’s probable Dec. 6 runoff against the Republican Bill Cassidy. She’s ahead in polls of Tuesday’s vote, when there are multiple Republican candidates on the ballot, although she’ll need a minor miracle to get to 50 percent and avert a runoff. Still, because of the runoff dynamic, this race can’t quite be placed into the same category as Arkansas yet.
6. Colorado (75 percent chance)
The polls of Colorado have been subject to more debate than those in any other state. My colleague Harry Enten had a counter-critique last week of those who claim the Colorado polls are “skewed” against Democrats, but let me add just one other simple-minded observation: There are a heck of a lot of polls in Colorado. There have been 23 in October representing 18 distinct polling firms. Excluding polls from firms designated as partisan by Huffington Post Pollster, there have been 14 leads for Republican Cory Gardner compared to just 2 (each by a single point) for Democratic incumbent Mark Udall.
Udall can win. But his chances are inferior to Democrat Michael Bennet’s in 2010, who trailed by a slightly narrower margin in the polling average. And unlike in 2010, when Republicans nominated a problematic candidate in Ken Buck, the GOP has a fairly good one this year in Gardner. (The FiveThirtyEight fundamentals calculation, which doesn’t depend on polls, slightly favored Bennet in Colorado in 2010 but slightly favors Gardner this year.)
7. Iowa (67 percent chance)
True, there’s not always a bright line between states where the polls would have to be wrong for the trailing candidate to prevail and those where it’s not as clear whom the polls have ahead. But Harry and I tend to think of Colorado as falling just toward one side of that line and Iowa just toward the other side.
A handful of recent polls in Iowa have the race tied or Democrat Bruce Braley up by a percentage point. More have Republican Joni Ernst ahead, but they’re not showing as large a lead for her as polls of Colorado are sometimes showing for Gardner.
8. Alaska (67 percent chance)
Alaska is a more emphatic example of this distinction: It’s not clear who’s leading in the polls. Our polling average has Republican Dan Sullivan slightly ahead, and the fundamentals of the race and the state’s history of Republicans outperforming their polls also point his way. This race isn’t really “too close to call,” it’s “too uncertain to call.”
9. North Carolina (32 percent chance)
One backup option for Republicans is North Carolina, where GOP candidate Thom Tillis has gradually drawn closer in the polls against Democratic Sen. Kay Hagan. It still might be a case of too little, too late — especially in a state with lots of early voting — but Tillis’s chances of winning are at their highest point since early September.
10. New Hampshire (17 percent chance)
The notoriously volatile University of New Hampshire poll gave Democrat Jeanne Shaheen an 8-point lead Thursday. She’s unlikely to win by that much — but if you want to discard it as an outlier, you should probably throw out the handful of polls that show Republican Scott Brown ahead, too. The consensus points to a narrow Shaheen lead. Brown has a chance, but our model shows it will mostly be in cases where Republicans are having a strong night nationally and New Hampshire is just one among many Democratic states to fall.
This is about it in terms of viable opportunities for the GOP. There are a few states (Michigan, Minnesota, New Mexico, Virginia) where our model gives Republicans between a 1 and a 4 percent chance of a pickup — but those would be once-a-decade type upsets, like John Engler winning Michigan’s gubernatorial race in 1990 when down by double digits in some polls. Republicans have plenty of more realistic options.
So, what about that tantalizing distinction I teased at before? Would the polls have to be “wrong” for Democrats to hold the Senate?
In my view, we’re not quite at that point yet. There is a reasonably clear consensus among nonpartisan pollsters about which candidate leads in Republicans’ easiest six pickups: Montana, South Dakota, West Virginia, Arkansas, Louisiana and Colorado. Indeed, the Republicans have about an 80 percent chance of winning at least six Democratic-held seats (not necessarily these ones exactly).
Again, the GOP’s magic number might not be six seats; the polling picture is murky in Georgia and Kansas. They might need seven or eight instead, which would require the party winning a state like Iowa or Alaska, where things are more uncertain.
Some of Democrats’ roughly 30 percent chance of holding the Senate represents these cases: where they win squeakers in a number of the closest races and Republicans fall just short of a majority. The other portion reflects cases where there is more of an across-the-board polling failure. This is plausible — sometimes almost all of the competitive races break in the same direction. But an anti-Republican “skew” is just as plausible, in which case Republicans could finish with 54 or 55 seats.
Which states to watch over this final weekend? I’d point to three: Alaska, Iowa and Kansas. Any polling at all in Alaska would be helpful. Iowa, depending on the final few polls there, could wind up anywhere from a true tossup to a case more like Colorado. In Kansas, Roberts’s position is improved from a few weeks ago, but it isn’t clear whether he’s gaining ground or has stalled out. In most of the other states, the possibility of a runoff limits how much the polls can tell us, or we have so much polling that no one further poll is going to move the needle that much.
Check out FiveThirtyEight’s latest Senate forecast.

October 30, 2014
Send Alex Gordon!
It would have been close. Alex Gordon might have scored, particularly if he’d been in the mindset to do so all along. Or maybe not. I’m sure there will be Zapruder-film-type breakdowns, and I’ll look forward to seeing them. It would have been one hell of a moment: Gordon, 220 pounds, who looks like he could have been a strong safety at the University of Nebraska, bearing down on Buster Posey, the catcher whose season-ending injury in 2011 helped inspire baseball’s home-plate collisions rule.
Your browser does not support iframes.Game 7 will leave us with that sense of what might have been. Partly because it involved the Kansas City Royals, who were making their first World Series appearance since 1985. But mostly I’m referring to that penultimate play: When Gordon hit what was officially scored as a single and wound up on third base because of defensive miscues by San Francisco Giants outfielders Gregor Blanco and Juan Perez. It seemed to take an eternity — it was actually just 13 seconds — but I was surprised that Gordon wasn’t rounding third base by the time the TV cameras returned to the infield.
Here’s what I know: Gordon should have tried to score even if he was a heavy underdog to make it. It would have been the right move if he was safe even 30 percent of the time.
Between 1969 and 1992 — I’m using this period because it better approximates baseball’s current run-scoring environment than the offensive bubble of the 1990s and aughts — a runner scored from third base with two outs about 27 percent of the time, according to the tables at Tangotiger.com. We should probably round that down a bit in this example. The Royals had Salvador Perez at the plate — a league-average hitter — and the light-hitting Mike Moustakas due up after that.
More importantly, they were facing Madison Bumgarner. That Bumgarner had been so dominant in the World Series is not as relevant as you might think. There’s extremely little evidence for a “hot hand” in pitching: In-game performance tells you next to nothing about how the pitcher will fare in future at-bats. Instead, you should look toward longer-term averages. Still, I feel comfortable asserting that Bumgarner was an above-average pitcher at that moment: Certainly not the first guy you’d want to have on the mound if you were the opponent. So let’s round that 27 percent down to 25 percent.
So, Gordon should have tried to score if he had even a 25 percent chance of being safe?
It’s just a touch more complicated than that. With the Royals down 3-2, Gordon represented the tying run rather than the winning run. If he’s thrown out at home, the game’s over; it forecloses on the possibility of Perez scoring as the winning run, like with a walk-off homer. What was the probability of that? Perez homered in about 3 percent of his plate appearances this season, but he could also have scored in other ways — by doubling, for example, and then scoring on a base hit by Moustakas. We can turn to Tangotiger’s tables again, which suggest that a league-average batter has about a 6 percent chance (I’m rounding down slightly) of eventually scoring from home with two outs.
So, after Gordon holds at third, he has a 25 percent chance of scoring. Six percent of the time, Perez (or pinch-runner Jarrod Dyson?) also scores, and the Royals win outright. The other 19 percent of the time, Gordon is the only Royal to score in the ninth and the game goes to extra innings. If we assume the Royals are even money to prevail in an extra-inning game, their chances of winning at that point are:
6% + (19% * 50%)
That works out to 15.5 percent. Not coincidentally, this matches FanGraphs’ in-game win probability for the Royals (after Gordon held at third) almost exactly.
What if Gordon rounds third and tries to score? If he’s successful even 30 percent of the time, the Royals’ win probability is at least 15 percent — a 30 percent chance of Gordon scoring, multiplied by a 50 percent chance of the Royals winning in extra innings. But it’s slightly higher than that. The 30 percent of the time that Gordon scores, Perez still has his 6 percent chance of scoring the winning run in the ninth. That brings the Royals’ overall win probability up to about 16 percent.
We’re splitting hairs. The point is that if even Gordon had been a 2-to-1 underdog to score, he should have tried.
These decisions can be counterintuitive. Sometimes a strategy that’s successful less than 50 percent of the time — like splitting eights in blackjack — is still the right move because the alternative is even worse. In this case, the alternative involved trying to score against Bumgarner with your catcher at the plate and two outs, and then having to prevail in extra innings.
It would have made for one of the best plays in baseball history. We’re talking about the tying run with two outs in the bottom of the ninth inning in Game 7 of the World Series: Even a sacrifice fly can be thrilling under those circumstances. But this would have been in a league with Bill Mazeroski and Kirk Gibson and Bill Buckner: under serious consideration for the greatest play of all-time. (The play already had a little Buckner in it, with Blanco’s and Perez’s misplays in the outfield.)
Unlike any of those moments, it would have involved an incredibly gutsy decision. It’s an extraordinary play if Gordon scores. It’s an extraordinary play if there’s a collision at home plate — and baseball needs to decide whether to invoke the “Buster Posey Rule.”
And if Gordon were thrown out, it would have been the most extraordinary way to lose a game in the history of baseball.
CORRECTION (Oct. 30, 11:14 a.m.): A previous version of this article misstated the first name of a Kansas City Royals catcher. He is Salvador Perez, not Santiago Perez.

October 24, 2014
Why Did A Rasmussen Reports Poll Disappear?
Have you ever seen a poll disappear? Over the past few years, we’ve seen a pollster revise a survey once it was made public and another re-poll a race after it claimed there was a “skew” in the respondents.
But what we saw from Rasmussen Reports this month was different: the withdrawal of a poll in a key Senate race without any satisfactory explanation.
On the morning of Oct. 9, Rasmussen Reports released a survey on its premium website that showed independent Greg Orman leading Republican Pat Roberts 52 percent to 40 percent. The poll, conducted Oct. 7 and Oct. 8, was seen by poll watchers and put into our polling database. It was quite different from two polls released the day prior from CNN/Opinion Research Corp. and Fox News giving Roberts leads of 1 percentage point and 5 percentage points, respectively. The CNN and Fox News polls were the first since Democrat Chad Taylor’s name was withdrawn from the Kansas ballot to show Roberts ahead.
But within a few hours of publication, the Rasmussen Reports poll was no longer on its website. We asked Rasmussen why the poll was removed and received this response from Rasmussen Reports general manager Beth Chunn:
Those numbers were basically raw data that we were still processing and were not anywhere near ready for publication. They were inadvertently posted for our subscribers only and not on our public site. They were taken down as soon as we realized the mistake. We don’t hide any of our polling, so you can be assured that when we have numbers that we’re ready to release publicly, they’ll be available right away at rasmussenreports.com.
It’s rare for a poll to be published and then taken offline. We spoke with Jay Leve at SurveyUSA (a pollster rated highly by FiveThirtyEight), which like Rasmussen uses interactive voice response polling technology, about how often his company has published a poll before identifying a mistake in the sample. He told us SurveyUSA has published only one poll in its 22-year history that it later found had a methodological mistake.
Still, FiveThirtyEight was willing to give Rasmussen Reports the benefit of the doubt. Most pollsters agree that if an error is made while commissioning or publishing a survey, it ought to be corrected. We’ve made mistakes of our own: We’ve inadvertently hit the “publish” button on articles that were still being edited or entered polls incorrectly into our database. These things happen; the important thing is fixing them, explaining the mistake and correcting the record.
But then a funny thing occurred: Days passed, and Rasmussen Reports never released its Kansas survey. So we emailed Rasmussen again to see what was going on.
This time, Chunn said:
When reviewing the Kansas sample, we realized that an error was made in the programming of the survey that may have skewed the data. Instead of releasing that data, we elected to scrap the survey and have rescheduled it for later in the month.
We wanted to find out what exactly the programming error was. Leve told us that the term was ambiguous. It could be “anything from a mispronounced word to a question that is skipped-over inadvertently during programming,” he wrote. “Such things occur rarely.”
So we emailed Rasmussen Reports twice more. Chunn did not respond to our inquiries asking for more information.
We also emailed Ted Carroll, a partner at Noson Lawen Partners that is Rasmussen Reports’ majority investor, for comment. (Rasmussen Reports founder Scott Rasmussen left the company in August 2013 after a dispute with its board of directors.) “I don’t have an answer on this one beyond what Beth noted,” Carroll wrote, “Except that if something is found inaccurate with a survey post-publication I’d want it immediately removed also.”
Rasmussen Reports has never been strong about disclosure. It isn’t a member of the National Council of Public Polls and doesn’t participate in the AAPOR Transparency Initiative. But polling firms that have had to rescind or revise polling results have made some effort to describe the nature of the error.
In our view, a highly plausible explanation is that this wasn’t an error per se so much as an example of “herding.” Polls such as Rasmussen Reports’ that take methodological shortcuts reach only a tiny fraction of the voter population, resulting in poor raw data. However, as we’ve described, and as other researchers have found, these polls tend to produce more accurate results when there are other polls with stronger methodological standards surveying the same races. Essentially, the cheap polls may be copying or “herding” off their neighbors. This can take the form of a sin of commission: manipulating assumptions like those involving turnout models and demographic weighting to match the stronger firms’ results. Or it may be a sin of omission: suppressing the publication of polls that differ from the consensus.
In the past, Rasmussen Reports would not have been the first firm you’d accuse of striving to match the polling consensus. Instead, its surveys had a strong Republican “house effect”, meaning that they showed more favorable results for Republicans than other surveys of the same races. On Election Day, this house effect often translated into a Republican bias. Since Rasmussen Reports began publishing polls in 2000, its surveys have been 2.3 percentage points more favorable to Republicans than the outcomes of the elections they polled.
This year, however, Rasmussen Reports polls have shown little house effect, instead closely matching the average of other surveys. This could reflect methodological changes. For instance, Rasmussen has begun to use somewhat larger sample sizes, and it’s begun to conduct polls over two- or three-day windows rather than surveying voters only over one evening.
But the closer match between Rasmussen polls and the polling averages could also be a product of herding. In the case of Kansas, it may have been that Rasmussen Reports was herding off of a Marist College survey, published four days before the Rasmussen poll, which had Orman ahead by 10 points in the race — very close to the 12-point lead that Rasmussen’s disappearing poll showed for Orman. Perhaps Rasmussen got cold feet after CNN and Fox News published polls showing Roberts slightly ahead instead — and after the Rasmussen result came under criticism from poll watchers on Twitter.
Rasmussen Reports did finally publish a Kansas poll Thursday, which had Orman 5 points ahead. We’ve included it in the FiveThirtyEight database, while also restoring Rasmussen’s earlier (Oct. 9) Kansas poll to our database.
We’ve developed a detailed set of rules over the years that cover just about any odd polling situation. But we’ve never been confronted with the case of a disappearing poll before. In the absence of a better explanation, it looks as though Rasmussen Reports didn’t trust its own poll enough to stand behind it.

October 23, 2014
The Democrats’ Path Of Last Resort Is Georgia
The numbers are the numbers. There’s nothing sacred about 51 percent or 72 percent or 95 percent. But certain probabilities, I’ve found, are harder to translate into the right words. For most of 2014, Republicans’ probability of taking over the Senate has been somewhere in the neighborhood of 60 percent, according to the FiveThirtyEight forecast. The gambler in me says that’s not quite close enough to describe as a “tossup”; you’d make a lot of money over the long run betting on a coin toss weighted 60-40 to your side. But it still represents a highly doubtful outcome. A 60 percent chance of an outcome occurring means there’s a 40 percent chance of it failing to occur. As 60-40 underdogs, Democrats’ chances of keeping the Senate would be about as good as Ted Williams’s chances of getting a base hit in 1941.
Over the past week or two, the FiveThirtyEight forecast has drifted slightly more toward Republicans. As of Wednesday night, the GOP’s chances of a Senate takeover were up to 66 percent, its highest figure on the year.
Sixty-six percent might seem a lot different than 60 percent; it tends to read as “2-to-1 favorites” rather than “just slightly better than a coin flip.” But it isn’t much of a change, really; Democrats still have a 34 percent chance of prevailing. The difference between a 40 percent chance and a 34 percent chance is one additional “hit” for every 17 attempts. Essentially, Democrats have fallen from Williams’s chances of getting a hit in 1941 to Tony Gwynn’s in 1989.
With that said, it’s been hard to find good news for Democrats in the Senate polls lately. Colorado has broken against its incumbent, Mark Udall. Sen. Mark Pryor’s odds of holding his seat in Arkansas have become longer. Democratic incumbents are still favored in North Carolina and New Hampshire, but those races have tightened.
Sometimes, Democrats have had to settle for an absence of bad news. Joni Ernst, a Republican, is the slight favorite in Iowa. But her lead is small and steady at 1 or 2 percentage points; it’s not expanding like Republican Cory Gardner’s in Colorado. Greg Orman, an independent in Kansas who could caucus with the Democrats if he wins, no longer holds a consistent lead over the Republican incumbent, Pat Roberts. But Roberts hasn’t pulled ahead either.
The one real exception has been in Georgia. Contrary to some media accounts, it was never out of reach for the Democrat, Michelle Nunn. But Nunn has led Republican David Perdue in the past two surveys by the highly rated pollster SurveyUSA and been very close in just about every other poll. Her chances are as good as at any point in the election cycle.
There are a few complications. The recent polls in Georgia have been a slightly Democratic-leaning bunch, according to our model’s house effects adjustment. But far more important is that the race will require a runoff if neither candidate wins 50 percent of the vote Nov. 4.
The dynamics of a potential runoff are a bit unclear but probably somewhat unfavorable to Nunn:
Georgia’s Senate race went to a runoff in 2008, and Democratic candidate Jim Martin performed drastically worse than he did on the November ballot. But 2008 was a presidential year. There might not be such a disproportionate drop in Democratic turnout in an off-year election.The runoff, if the outcome of the Senate was still undecided, could turn into a referendum on party control. Voters might place more emphasis on the party identification of the candidates and less on the qualities of the individual candidates. That probably helps Perdue because Georgia is Republican-leaning (although becoming less so).A third-party candidate, Libertarian Amanda Swafford, would not appear on the runoff ballot. As a group, voters who hold libertarian positions are more Republican-leaning than Democratic-leaning, which could help Perdue. However, Swafford’s positions are split pretty much down the middle between the major parties. Although fiscally conservative, she supports same-sex marriage, marijuana legalization and a reduced U.S. military presence. She’s more of a Gary Johnson Libertarian than a Rand Paul type.So, there’s a good deal of uncertainty. But the FiveThirtyEight forecast now has Nunn with a 40 percent chance of winning — just slightly worse than a coin flip.
Technically speaking, that projection doesn’t distinguish the Nov. 4 ballot from the runoff. If pollsters were testing a two-way matchup without Stafford on the ballot and trying to evaluate how turnout might differ in a runoff, we might do something more sophisticated, like running separate simulations of the Nov 4. and runoff ballots. Unfortunately, almost none of the pollsters are doing that, so 40 percent has to serve as our stand-in for Nunn’s overall chances of winning the Senate seat.
Nunn does have some chance — about 20 percent, according to our model — of winning an outright majority Nov. 4. (Perdue has about a 35 percent chance of doing so.) Otherwise, Democrats would have to take their chances in a runoff.
Here’s the thing: Taking their chances in a runoff would be a lot better for Democrats than having no chance at all. Nunn’s chances of winning Georgia — 40 percent — are better than Democrats’ chances of keeping the Senate (34 percent). That means Georgia may be more a necessity than a luxury.
From the set of simulations the FiveThirtyEight model ran Wednesday night, I pulled out those cases in which Democrats held onto the Senate with 50 seats (including any independents who might caucus with them). This is the bare minimum Democrats would require, as Vice President Joe Biden’s vote would break the 50-50 tie in their favor.
In the chart below, I’ve listed how often Democrats won the competitive states in those cases where they held control of the Senate 50-50. This isn’t quite the Democrats’ “path of least resistance.” There’s a lot of resistance: Holding the Senate will require Democrats to win some states where they’re underdogs. It’s more like their path of last resort. And more often than not — 57 percent of the time — that path included a Democratic win in Georgia.
 Some of the other figures in the chart are intriguing. Democrats have a 97 percent chance of winning New Hampshire conditional upon the outcome in the Senate being 50-50, for example. That might sound awfully high; Jeanne Shaheen’s overall chances of winning the state are about 80 percent. However, most of the time Shaheen loses New Hampshire, Democrats will have had a poor night nationally and Shaheen’s loss would be superfluous. (At least for now, if Democrats lose the Senate, their margin of defeat will be quite important in 2016.) In fact, in the simulations where Republican Scott Brown won New Hampshire, the GOP finishes with an average of 54 Senate seats, winning the majority with ease.
Georgia has more chance of being a tipping-point state that would determine majority control. It would be too much to call it a “must-win” state for Democrats; they do have some other options. But they have a better chance of winning Georgia than they do of salvaging their incumbents in Colorado, Louisiana, Alaska and Arkansas — or holding the seats in South Dakota, West Virginia and Montana, where Democratic incumbents are retiring. Losing all seven of those seats, but winning Georgia, Kansas and Iowa, is the Democrats’ best chance.
Without Georgia as an option, Democratic chances of keeping the Senate would be down to about 25 percent. Twenty-five percent chances come in fairly often, too — they come in 25 percent of the time! — but Democrats would be downgraded from Gwynn to Alfredo Griffin.
CORRECTION (Oct. 24, 11:45 p.m.): A previous version of this post incorrectly said Democrats would maintain control of the Senate if they lost Colorado, Louisiana, Alaska, Arkansas, South Dakota, West Virginia and Montana, but won two from among Georgia, Kansas and Iowa. In fact, Democrats would need all three.

October 22, 2014
NFL Week 8 Elo Ratings And Playoff Odds
The Denver Broncos, who moved into the top slot in our Elo ratings last week, widened their advantage over the rest of the league in Week 7. Denver looked dominant in beating the San Francisco 49ers, who had been the No. 3 Elo team. The No. 2 Seattle Seahawks lost — greatly imperiling their playoff chances — as did the No. 5 San Diego Shargers. The No. 4 team, the New England Patriots, barely won against an awful opponent, the New York Jets.
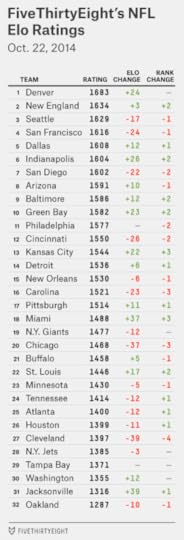
So, it’s time to pose the question Aaron Schatz asked at Football Outsiders. Is this Denver team merely the best in the league — or one of the best teams ever?
The Broncos’ Elo rating is 1683, which translates to being favored by a touchdown in a neutral-site game against an average opponent. It’s also a fairly typical rating for the best team in the league at this point in the season. On average since 1970, the highest-rated team through Week 7 had an Elo rating of 1686, almost exactly matching Denver’s this year.
Let’s pick some nits with the Broncos: They’ve lost once this year. They had a bye week. They fizzled in the second half against the Indianapolis Colts. And they were crushed in last year’s Super Bowl.
Is this unfair? Except perhaps for the Super Bowl part, of course it is. Denver’s loss came on the road at Seattle and may have literally been the result of a coin flip. Beating Indianapolis by any margin looks more impressive given how well the Colts have played since. It’s not the Broncos’ fault that the schedulers gave them an early-season bye (and thereby one less opportunity to improve their Elo rating). More sophisticated statistical treatments — from Football Outsiders’ DVOA (Defense-adjusted Value Over Average) to Benjamin Morris’s assessment of Peyton Manning’s clutchness — tend to have a higher opinion of the Broncos than Elo does.
But if we’re judging whether the Broncos are a historically great team, we have the right — nay, the duty — to be very, very picky.
This is not just an academic question. In the table below, I’ve taken the teams that had the highest Elo rating through Week 7 in each season since 1970. Eleven of the 25 teams that rated higher than the Broncos — or 44 percent — would go on to win the Super Bowl. But just two of the 19 (11 percent) that rated below the Broncos did.
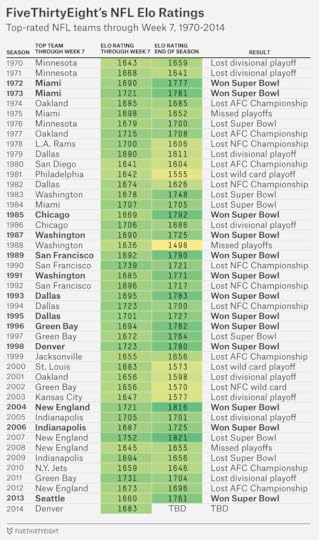
A lot of this is because even small advantages can compound over time. It’s not as though we can say with all that much confidence whether this year’s Broncos are better than, say, the 1998 edition of the team under John Elway. (Elo would have the 1998 Broncos favored, but by only 1.5 points). But a team that’s ever-so-slightly better is more likely to make the playoffs as a division champion rather than a wild card, more likely to have playoff games at home and to get a first-round bye, and more likely to win those playoff games once they occur. A team that’s a 70 percent favorite in each playoff game, and that needs to win three games to win the Super Bowl because it gets a bye, has a 34 percent chance of winning a championship. A team that’s a 60 percent favorite and that has to win four times has just a 13 percent chance.
Elo puts the Broncos’ chances of winning the Super Bowl at 18 percent, somewhere between the two groups. Their Thursday-night home game against San Diego will be highly informative. A win for Denver would put it in a dominant position in the AFC West — it’d be a game-and-a-half ahead of the Chargers and at least two games ahead of the Kansas City Chiefs (with a tiebreaker advantage against each division rival). A loss to the Chargers would instead place Denver half a game behind San Diego with a tiebreaker disadvantage (and with the remaining game between the teams to be played in San Diego).
The Broncos will probably make the playoffs as a wild card even if they lose their division, but the Super Bowl is much harder to win under those circumstances. The Broncos would have to play an extra game, and they’d have to play on the road. In our simulations, the Broncos won the Super Bowl 23 percent of the time as division champs but just 4 percent of the time as a wild card team. There’s not only playoff leverage riding on this game; there’s a lot of Super Bowl leverage at stake.
Here are the current playoff odds for the other NFL teams:

The Colts, who were briefly underdogs to make the playoffs after starting off their year 0-2 (Seahawks fans can take solace in that), are now 95 percent favorites to do so after having won every game since. Some of this is because the Colts are very good, but just as important is their extraordinarily weak division. The Houston Texans project to a record of 7-9, the Tennessee Titans 6-10, and the Jacksonville Jaguars (despite finally winning last week) 4-12. In our simulations, the Colts won the AFC South 82 percent of the time they finished with a 9-7 record and 62 percent of the time they went 8-8. Even a 7-9 record would often be enough to get them in. Andrew Luck is both lucky and good.
Otherwise, the AFC playoff chase is more scrambled than last week. The Cincinnati Bengals are winless in their past three games (they managed a tie against the Carolina Panthers) and down to a 54 percent chance of making the playoffs, in danger of being lapped by Kansas City (41 percent) and the Pittsburgh Steelers (33 percent). Their matchup this week, at home against the division rival Baltimore Ravens, is another high-stakes game.
The NFC, almost inevitably, will feature a ferocious battle for the wild card positions. Dallas, Philadelphia, Green Bay, Detroit, Arizona, San Francisco and Seattle all have somewhere between a 22 and 32 percent chance of winning a wild card. Three of those teams (barring a miraculous run by a team like the Chicago Bears) will win their divisions, but that leaves four teams fighting for two slots.
The Arizona Cardinals, incidentally, have a chance to become the first team to play a Super Bowl in its home stadium. Although Arizona is probably weaker than either San Francisco or Seattle, it has a leg up in the NFC West by virtue of its 5-1 start. Elo gives the Cardinals a 15 percent chance of making the Super Bowl and an 8 percent chance of winning it.
Elo point spreadsRecord against point spread: 49-50-3 (8-7 in Week 7)
Straight-up record: 74-31-1 (10-5 in Week 7)
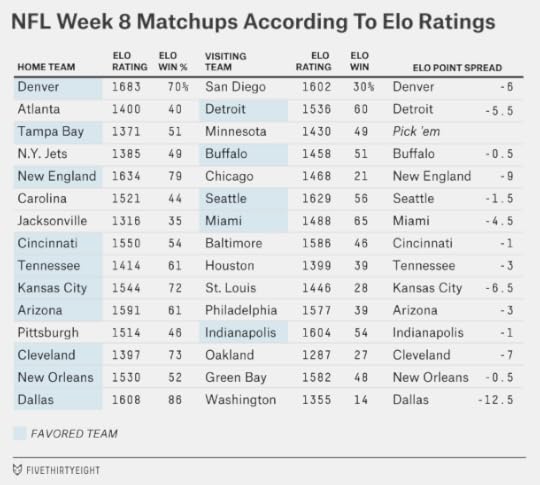
Even if we thought you should bet based on these odds — and we don’t — it wouldn’t be in cases where bookmakers have a team as a 2.5-point favorite and Elo has the same team favored by, say, two points. There are a lot of games like that this week and fewer differences between Vegas and Elo than in past weeks. The biggest split of the week is in an unwatchable game: Elo has the Titans favored by three points at home against Houston, while Vegas has the Texans as one-point favorites.
The Washington Redskins are also a perpetual punching bag for Elo, and the system would have you take the Dallas Cowboys against them (even as 9.5-point favorites, as Vegas has the Cowboys). As Washington was on the verge of losing to the Titans last week — it pulled the game out but didn’t cover the point spread — The Wall Street Journal’s Neil King tweeted that Washington was struggling to beat “the third worst team in the league,” presumably referring to Tennessee. Actually, Elo has Washington rated as the third-worst team! Washington went 11-5 against the point spread in 2012 and perhaps is still getting too much credit for it; it’s 7-16 against the spread since then. The team’s straight-up record, 5-18, is even worse.

October 20, 2014
The Seattle Seahawks Are Now Underdogs To Make The Playoffs
What opponent would you least want to see on your favorite NFL team’s schedule? Most of you, I’d guess, would want to avoid Peyton Manning and the Denver Broncos. But after that?
The Seattle Seahawks, despite their 3-3 record, remain a perfectly reasonable answer to this question. When our NFL Elo ratings come out later this week, they’ll have Seattle in third place — just slightly behind New England (and further behind Denver) and just slightly ahead of Dallas, Indianapolis and San Francisco. You could argue these cases — are you more afraid of the Seahawks defense or Colts quarterback Andrew Luck? Are you sure you’d rather play Seattle than Denver when the Seahawks already beat the Broncos this season — and demolished them in last year’s Super Bowl?
It’s not as though Seattle’s season has been a disaster. The Seahawks have outscored their opponents by 18 points against a very tough schedule. Jeff Sagarin’s ratings at USA Today have them as the third-best team in football based solely on their performance this year.
Our Elo ratings carry over performance from previous seasons, which helps Seattle some. This usually yields more reliable estimates of team strength, especially early in the season (six games is a small sample size). You could argue against accounting for prior years’ performance when a team is old or when its roster had turned over substantially. But Seattle’s hasn’t. It has brought its core back from last year, when it was the third-youngest team in football. Quarterback Russell Wilson is just 25, an age when most QBs are still improving.
Nonetheless, the Elo ratings have the Seahawks as underdogs to make the playoffs. In the simulations we ran after Sunday night’s games, Seattle made the playoffs just 46 percent of the time.
The Seahawks are harmed by playing in the NFL’s toughest division, in a deep conference and against a very tough schedule. A league-average team playing Seattle’s schedule this year would be expected to go 7-9 based on each opponent’s Elo ratings, so the schedule costs the Seahawks about one win.
Seattle will also need to finish with an 11-5 record or better to be assured of making the playoffs. In simulations where Seattle finished 9-7 — its most likely record according to Elo — it made the playoffs just 23 percent of time, well below the historical average for 9-7 teams of about 50 percent.
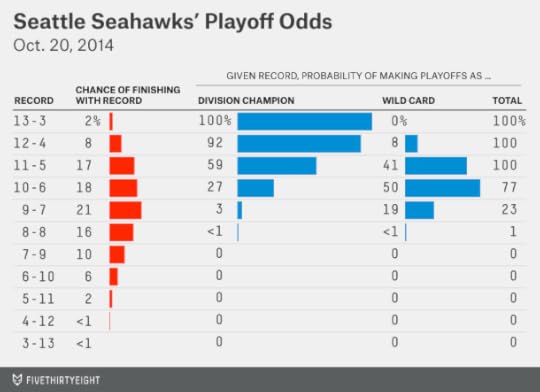
Nor may a 10-6 record be good enough. In our simulations, Seattle won the NFC West only 27 percent of the time with that record. More often, a 10-6 Seattle team made the playoffs as a wild card. But the NFC playoff picture is crowded. Seattle would have to compete for two wild card slots along with whichever team finishes second in the NFC East (probably Philadelphia or Dallas), whichever team finishes second in the NFC North (probably Detroit or Green Bay) and whichever other NFC West team (San Francisco or Arizona) also misses out on the division title.
And while an 11-5 record was almost always good enough for Seattle to make the postseason, it only earned the Seahawks a division title 60 percent of the time. That means they’d start their playoffs on the road — depriving them of the benefit of the NFL’s biggest home-field advantage.
Perhaps the Seahawks don’t have much right to complain — it was only four seasons ago when they made the playoffs as a 7-9 team in an awful NFC West. But the trend toward smaller divisions in sports makes odd outcomes like this more likely. If Seattle makes the playoffs, it will certainly have earned it.

October 17, 2014
Why An Ebola Flight Ban Wouldn’t Work
On Sept. 19, Thomas Eric Duncan boarded a flight in Monrovia, Liberia, possibly after having lied on a screening questionnaire about his contact with persons carrying the Ebola virus. The next day, Duncan arrived in Dallas to visit his fiancée and son. Initially complaining of a fever, Duncan would soon become the first person in the United States diagnosed with Ebola. Before dying of the disease on Oct. 8, Duncan would transmit it to two nurses, Nina Pham and Amber Vinson, who treated him at Dallas Presbyterian Hospital.
Duncan’s case has sparked calls to ban flights to the United States from the countries hardest hit by the recent Ebola outbreak — Liberia, Guinea and Sierra Leone — possibly along with others in West Africa. While some of these arguments have been measured, others seem to convey the impression there are thousands of passengers arriving in cities like Dallas each day from flights originating in these countries.
There aren’t. We searched on Kayak.com, ExpertFlyer.com and airline websites for direct flights from West African nations (as the United Nations defines the region) to destinations outside the African continent. Specifically, we looked for flights available for the week from Jan. 2 to Jan. 8, 2015, a time period far enough in advance that such flights are unlikely to have sold out.
There are no regularly scheduled direct flights to the U.S. from Liberia, Guinea or Sierra Leone — and very few from other countries in West Africa. There are far more flights from West Africa to Western Europe instead. Duncan’s case was typical. Before arriving in the United States, he connected through Brussels.
Here are all the routes we identified:
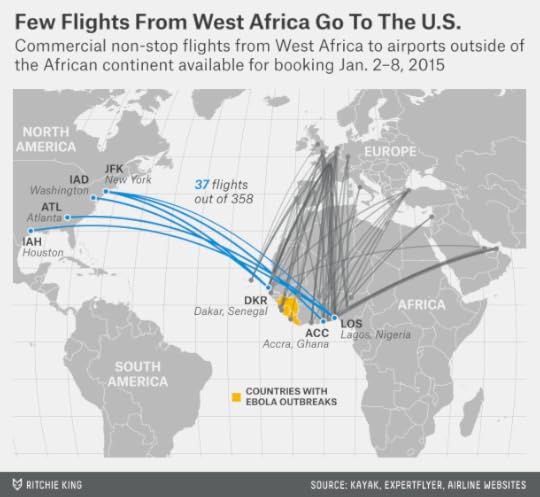
Our search may be missing a few flights here and there, but it ought to be reasonably comprehensive, especially for travel to and from the United States. We found a total of 358 direct flights available for booking that week. Of these, only 37 were to the U.S. They include the following six routes:
United Airlines flies daily from Dakar, Senegal, to Washington Dulles.South African Airways flies daily from Dakar to New York’s John F. Kennedy Airport.Delta Airlines flies daily from Accra, Ghana, to JFK.Delta flies daily from Lagos, Nigeria, to Atlanta.United flies six days a week from Lagos to Houston.Arik Air, a Nigerian carrier, flies three days a week from Lagos to JFK.By contrast, there are hundreds of flights per week to Western Europe from these countries. Paris is the top destination, with a total of 79 flights per week (counting flights on one route that is currently suspended but which may become available again by January). London has 43 weekly flights (again, counting one suspended route). Brussels and Frankfurt have 26 each.
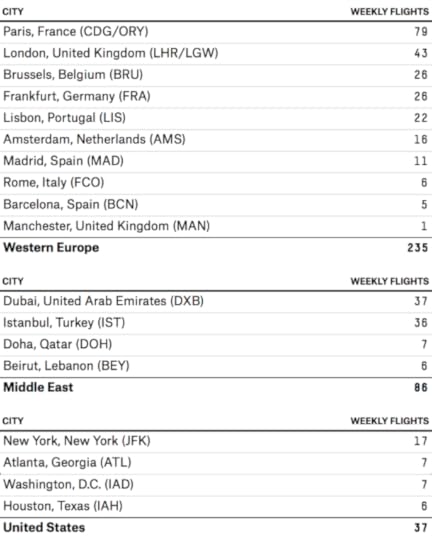
All of those cities, of course, offer abundant connections to the United States. There are about 280 flights each week from London to New York alone, and thousands more involving other transatlantic city pairs.
A traveler from West Africa could also connect through the Middle East. There are as many flights to Dubai from the region each week (37) as there are to the United States, along with regular connections to Istanbul, Doha and Beirut.
However, of the flights from West Africa to Europe and the Middle East, relatively few are from the worst-stricken countries. The flight from Monrovia to Brussels that Duncan boarded was the only transcontinental flight we could find from Liberia. There are flights to Brussels and London’s Gatwick Airport from Freetown, Sierra Leone, but flights to Paris and London-Heathrow have been suspended. Paris is the only non-African destination with a direct flight available from Conakry, Guinea, according to our search, although Turkish Airlines has announced plans to begin service to Istanbul from there soon.
In total, this represents just 18 weekly flights from Liberia, Guinea and Sierra Leone combined, nine of which are currently suspended or are not yet operating. Many of the passengers from these countries are probably connecting through busier airports like Lagos or Dakar before taking the next step on their journey.
Some of the proposals for a travel ban have suggested denying boarding to passengers on the basis of their nationality, rather than the specific route they’re flying. That might or might not be a wise thing to do, considering the epidemiological, economic and ethical implications. But for a ban to be even halfway effective, it would need to be much more sweeping than banning the handful of direct flights from West Africa to the United States. It seems unlikely that travel from Europe or the Middle East will be halted. But the next Ebola patient may be on a flight from London, not Liberia.

October 16, 2014
Senate Fundraising Totals Are A Bad Sign For Democrats
Among the most hopeful signs for Democrats this year have been the strong fundraising totals for their Senate candidates. Through June 30, the Democratic incumbent Mark Udall of Colorado had raised $7.9 million in individual contributions to $3.2 million for his Republican opponent, Cory Gardner. In Iowa through the same date, Democrat Bruce Braley had raised almost three times as much ($5.6 million) as his opponent, Republican Joni Ernst ($2.1 million).
But the latest numbers show Republican fundraising catching up with, and sometimes surpassing, Democratic totals in Iowa, Colorado and other key states.
The Federal Election Commission’s deadline to report third-quarter fundraising totals passed on Wednesday, covering money raised from July 1 through Sept. 30. Comprehensive fundraising totals are not yet available on the FEC’s website, but I was able to find data on most Senate races through local media accounts.
In Iowa, for example, Ernst raised $4.5 million in the third quarter, according to the Des Moines Register, considerably surpassing Braley’s total of $2.8 million. The third-quarter numbers were more even in Colorado — Gardner $4.3 million, Udall $4.0 million, according to the Denver Post — but a big improvement for Gardner over the lopsided numbers we’d seen previously. (Gardner began his campaign only in March of this year, which accounts for his slow start.)
In Arkansas, Republican Tom Cotton outraised Democratic incumbent Sen. Mark Pryor $3.9 million to $2.2 million in the third quarter. Republican David Perdue slightly outraised Michelle Nunn in Georgia, offsetting what had been an advantage for Nunn. In New Hampshire, the Republican candidate, Scott Brown, has been closing in the polls of late, and he also raised a pinch more ($3.6 millon) than Democratic incumbent Sen. Jeanne Shaheen ($3.5 million) in the third quarter.
Fundraising totals for all states in which I was able to find credible figures for both major-party candidates are included in the table below.

As a word of caution, media accounts do not always differentiate between money raised from individual contributions and money brought in from other sources (like candidates contributing to their own campaigns). Nonetheless, the GOP’s gains in fundraising are fairly clear. In the 17 states for which I was able to find data, Republican candidates brought in an average of $2.7 million in the third quarter; Democrats averaged $2.6 million, taking away what had been a two-to-one advantage for Democrats through June 30.
There are a few comparative bright spots for Democrats. Louisiana Sen. Mary Landrieu slightly out-raised her Republican challenger, Bill Cassidy. Sen. Kay Hagan, in North Carolina, retained her fundraising edge over Republican Thom Tillis. In Michigan, the Democrat, Gary Peters, has moved well ahead of Republican Terri Lynn Land in polls, and Land’s campaign has declined to report her third-quarter fundraising to the media, probably indicating an underwhelming figure.
In Kansas, the Republican incumbent, Pat Roberts, whose fundraising totals had been anemic, brought in $1.7 million in the third quarter, roughly matching the amount he’d raised in individual contributions during all previous quarters combined. But the center-left independent, Greg Orman, who could caucus with the Democrats if he wins, nearly matched Roberts, raising $1.5 million. With heavy spending also expected from outside groups, Orman should be able keep pace with Roberts in advertising down the stretch.
Perhaps the Democrats’ biggest fundraising success story has been in Kentucky. Through June 30, their candidate, Alison Lundergan Grimes, had brought in slightly more in individual contributions than Republican Senate Minority Leader Mitch McConnell. Grimes also raised more in the third quarter, $4.9 million to $3.2 million.
The Democratic Senatorial Campaign Committee has ceased its advertising spending in Kentucky; the move was interpreted as a signal that Democrats were conceding the race. But Grimes and McConnell both have so much money — in a state with relatively cheap media markets — that the DSCC’s spending might have provided little marginal benefit to Grimes.
Still, this is a very good set of figures for Republicans. FiveThirtyEight’s Senate forecast model uses fundraising totals as one of the “fundamentals” factors it analyzes along with the polls. The fundamentals receive little weight in the model at this stage of the race, but they nevertheless help to explain some of the polling movement we’ve seen in certain states. In Colorado, for example, the FiveThirtyEight fundamentals calculation had previously made Udall a 2-point favorite over Gardner — contradicting a string of polls that had shown Gardner pulling ahead — but with the new fundraising numbers included, it now has the race even. The fundamentals calculation in Arkansas, meanwhile, now has Pryor as a slight underdog rather than a slight favorite, also matching the polling there.

October 15, 2014
NFL Week 7 Elo Ratings And Playoff Odds
The Seattle Seahawks, No. 1 in our NFL Elo ratings since the start of the season, have relinquished that position after losing 30-23 at home against the Dallas Cowboys. The new Elo No. 1 probably won’t cause much controversy: It’s the Denver Broncos, who are also the betting favorite to win the Super Bowl and the top-rated team in ESPN’s panel of experts. But after that, there’s more disagreement. Should Dallas — now 5-1 and having won against Seattle head-to-head — rank ahead of the 3-2 Seahawks?

The experts panel thinks so: It now has Dallas at No. 3 and Seattle at No. 5. But betting odds still prefer Seattle. The prices at Betfair imply Seattle has a 13 percent chance of winning the Super Bowl; Dallas is at 6 percent.
Elo’s answer somewhat splits the difference. It still has the Seahawks ranked about 50 Elo points higher than Dallas, which translates to Seattle being 2-point favorites in a game played on a neutral field. The gap has closed: At the start of the season, Elo would have had the Seahawks favored by a touchdown in a neutral-site game. However, Elo ratings take past seasons into account. In the system’s estimation, Seattle’s accomplishments from last year still matter enough to outweigh what the Cowboys have done so far this year.
But the Cowboys’ strong start does count for a lot. Because of it, they project to 11.5 wins on the season, as compared with 10 wins for Seattle. Dallas also plays in the easier division and otherwise has the easier schedule, having survived some of its tougher games.
In fact, the Seahawks are at risk of missing the playoffs entirely. In part because San Francisco (No. 3 overall in the Elo ratings) and Arizona (No. 7) also play in the NFC West, Seattle made the postseason only 60 percent of the time in this week’s simulations. Dallas, conversely, made the playoffs 82 percent of the time. Seattle is more likely to win the Super Bowl conditional upon making the playoffs. But since Dallas is more likely to make the playoffs in the first place, the teams’ overall Super Bowl chances are about the same according to Elo: 9 percent for the Seahawks and 8 percent for the Cowboys.
Here are the playoff odds for the those two, and the other 30 NFL teams:

The AFC playoff picture has become surprisingly clear. The most likely teams to earn the conference’s six playoff slots are Denver (86 percent), Indianapolis (also 86 percent — there’s no one to beat them in the AFC South), New England (84 percent), San Diego (81 percent), Cincinnati (67 percent) and Baltimore (66 percent). Then there’s a big drop-off to the next tier of teams — led by Pittsburgh and Kansas City — none of whom is higher than 27 percent.
The NFC’s playoff hunt is more crowded. The aforementioned Cowboys, at 82 percent, are the safest bet to make the postseason. But then there’s a glut of seven teams — San Francisco, Seattle, Arizona, Philadelphia, Green Bay, Detroit and Carolina — all between 53 percent and 65 percent. At least two of those teams won’t make it, unless they knock Dallas out.
This leaves some perfectly decent football teams facing long odds. The Chicago Bears have just a 26 percent chance to make the playoffs. The New York Giants are at 13 percent (and that’s without accounting for the injury to Victor Cruz). New Orleans has a 30 percent chance of overtaking Carolina to win the NFC South, but in our simulations the Saints made the playoffs as a wild card team only 4 percent of the time.
It isn’t very hard for a team with league-average talent like Chicago to back into a 10-6 or 9-7 record. However, the problem isn’t just the number of good teams in the league — the number of really bad ones is also causing issues. The Oakland Raiders, Jacksonville Jaguars, Washington Redskins, New York Jets and Tampa Bay Buccaneers project to a combined record of just 18-62. That’s a lot of extra wins distributed to the other teams in the league. In our simulations, 9-7 teams are reaching the playoffs only 29 percent of the time — much lower than the historical average of 51 percent. Nor is a 10-6 record as safe as usual; those teams are missing the playoffs 25 percent of the time.
Tie for the winWhat about a record of, say, 10-5-1? Both the Carolina Panthers and Cincinnati Bengals now have a tie on their resumes, having drawn 37-37 last weekend in Cincinnati (this was the highest-scoring tie in NFL history, incidentally). This is the third tied game in as many seasons since the NFL changed its overtime rules before the 2012 season; two of those games would not have been ties under the previous rules.
Fans and coaches seem to hate ties — but as soccer fans know, there are some circumstances when ties can play to the teams’ mutual advantage. The Panthers’ playoff odds increased to 64 percent from 59 percent after the tie. The Bengals’ were unaffected, remaining at 67 percent, despite the best competition in their division, the Ravens, having won.
The geeky explanation for this is that teams in a strong position — both Cincinnati and Carolina were favorites to make the playoffs before the game — would prefer to avoid variance. Imagine your team starts its season 7-1; such teams make the playoffs 95 percent of the time. Would you take the option of drawing your eight remaining games — finishing the season with the awkward-looking record of 7-1-8 — instead of playing out the string? If your sole concern is making the playoffs, the math says you actually should. A 7-1-8 record is equivalent to a 11-5 record the way that the NFL scores these things, and 11-5 teams make the playoffs 98 percent of the time.
Indeed, there are some oddball scenarios where teams would have an even stronger incentive to play for the tie. Say the Bills and the Patriots are tied atop the AFC East at 9-6 (with the Dolphins and Jets well behind) and playing the last game of the NFL season on Sunday night in Week 17. Let’s say they know a 10-5 or 9-6-1 record would be good enough to earn a wild card, while 9-7 would not be. A tie gets both teams in (one as division champion and one as the wild card) while any other result knocks the loser out. You think Bill Belichick wouldn’t find a way to win tie?
Elo point spreadsThe Elo point spreads are recovering after an awful start. They went 8-5 against Vegas lines in Week 6 (sitting out two games where they exactly matched the Vegas spread) and are 41-43-3 on the year. Elo’s straight-up record of picking winners is 64-26-1 on the year (10-4-1 in Week 6) or a 71 percent winning percentage. That probably reflects some good luck; historically, Elo ratings have picked the right winner about 65 percent of the time. Either way, we don’t recommend that you actually place bets on these.

One of the games we highlighted last week was Arizona against Washington; I thought it was hard to explain how Vegas had the Cardinals favored by only a field goal at home. Indeed, the line expanded to 5 points to 5.5 points by game time. The Cardinals covered the spread, although barely, on an interception return with 18 seconds left (Rashad Johnson should probably have kneeled the ball) to win by 10 points instead of 3.
There are again some big discrepancies involving the Cardinals and the Redskins this week. Elo has Arizona favored by 9 points on the road against Oakland, while Vegas has the Cardinals as just 3.5-point favorites. And Vegas has Washington favored by 6 points at home against Tennessee, while Elo has the Titans as (very slight) outright favorites.
In a game that may be of interest to people aside from degenerate gamblers, the Broncos will host the 49ers on Sunday night. Elo, despite having Denver at No. 1 overall, is not quite as high on the Broncos as betting markets (it has the Broncos with a 13 percent chance of winning the Super Bowl versus 19 percent for betting lines). So Elo would take San Francisco and the points.

Nate Silver's Blog

- Nate Silver's profile
- 729 followers

