
Nate Silver's Blog, page 160
December 4, 2014
NFL Week 14 Elo Ratings And Playoff Odds
On Sunday, the Green Bay Packers beat the New England Patriots, who had entered Week 13 ranked first in FiveThirtyEight’s NFL Elo ratings. They got there by defeating the previous No. 1, the Denver Broncos, in Week 9. But unlike the Patriots, the Packers didn’t move into the No. 1 position. Instead, Green Bay ranks No. 4, according to Elo, up from No. 6 previously. New England remains in first, barely edging out the Seattle Seahawks, who had a nice win of their own last week against the San Francisco 49ers. The Broncos, in third, are not far behind.
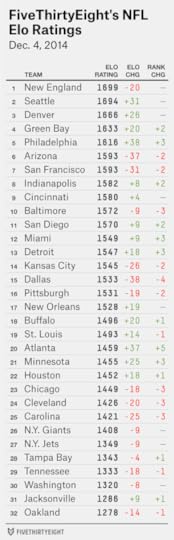
We wouldn’t argue too much if you said the Packers were the best team in the NFL — or if you said the Seahawks or the Broncos were. Vegas point spreads, as analyzed by FiveThirtyEight contributor Mike Beuoy, imply that bettors now think of the Packers as the best team. Football Outsiders’ DVOA has Denver at No. 1.
The Elo ratings have the virtue of simplicity, but they sometimes fail to account for important information. The Packers’ rating is not quite as high at it might be, in part because they started the season with a league-average Elo rating after finishing 2013 poorly.
It’s usually a good idea to consider a team’s performance from the previous season when forecasting how well it will do in the current one. The NFL isn’t as inconsistent as its reputation implies; if the season ended today, eight of the 12 teams that made the playoffs last year would do so again. Three other playoff entrants from last year are a game or less out of playoff position. But the Packers give us a good reason to discount 2013: Their star quarterback, Aaron Rodgers, was injured for much of the season.
But there’s also a more subtle reason why Elo is slightly less keen on the Packers. Their performance has been good but inconsistent compared with teams like Seattle.
In the chart below, I’ve plotted each NFL’s team performance along two dimensions. The horizontal axis measures each team’s average margin of victory, adjusted for home-field advantage and the quality of their opponents as measured by Elo. (This math is pretty simple: If Elo evaluates a team’s opponent as being three points stronger than an average NFL team, a 14-point victory would count as a 17-point victory instead.) The vertical axis measures how consistent each team has been, based on the standard deviation in its adjusted margin of victory. More consistent teams are in the top half of the chart; less consistent ones on the bottom.
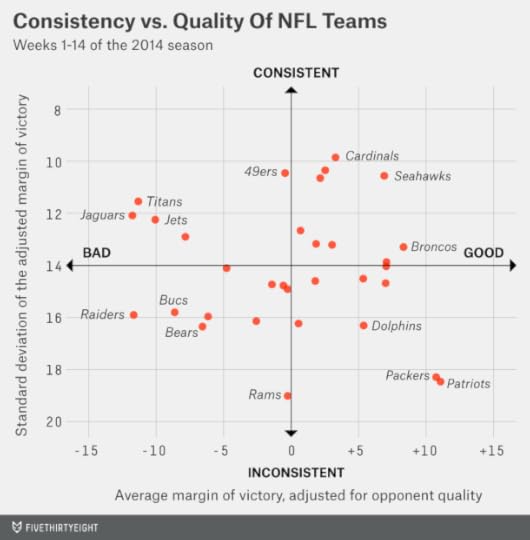
The Packers have been the third-most inconsistent team in the NFL by this measure, behind only the Patriots and the St. Louis Rams. Although a number of Green Bay’s wins have come by blowout margins, its three losses have also been decisive. (This year, Green Bay lost to the New Orleans Saints by 22 points, to Seattle by 20 points and to Detroit by 12).
The Seahawks rate as one of the most consistent teams in the NFL. Their four losses have come by an average of just 5.5 points. And they haven’t won any game by more than 21 points (the Packers have had three such victories).
Elo doesn’t directly reward a team for consistent performance, but it does discount lopsided margins of victory, especially when favorites win. In Elo, a team’s rating will improve slightly more if it beats two teams by 14 points than if it beats one by 27 and the next by just a single point. That helps Seattle, which has won by solid but not blowout margins.
But is this just a quirk in how the Elo ratings are constructed? Or is inconsistency a problem for Green Bay?
Often what looks like inconsistency in the data is just statistical noise. But there’s a case to be made that it’s a real issue for Green Bay based on the long-term historical performance of Rodgers. As my colleague Benjamin Morris has documented, Rogers is one of the best quarterbacks in the NFL at holding a lead, but he has been a mediocre comeback quarterback, perhaps because he plays too conservatively when behind. That pattern will yield relatively clear wins and losses compared with a Tony Romo-esque quarterback who mounts comebacks but also blows leads.
Green Bay, however, will need at least three postseason victories to win the Super Bowl, and it’s likely to fall behind in at least one of those games. Rodgers will have to be up to the challenge, perhaps with more aggressive play.
Elo playoff odds

Beuoy and Reuben Fischer-Baum have already covered the NFL’s increasingly convoluted playoff picture, so I’ll add only a few short comments here. One is about the demise of Romo’s Dallas Cowboys, who have just a 41 percent chance to make the playoffs (down from a peak of 90 percent entering Week 8). The other is how low the Cleveland Browns’ chances are — just 7 percent, according to Elo — despite their 7-5 record. That’s partly because Elo rates Cleveland as still being a below-average team and partly because the Browns don’t fare well according to the various tiebreakers the NFL will use should they be deadlocked for a playoff position.
Elo point spreadsRecord against point spread: 95-81-3 on season (9-6 in Week 13)
Straight-up record: 132-59-1 on season (9-7 in Week 13)
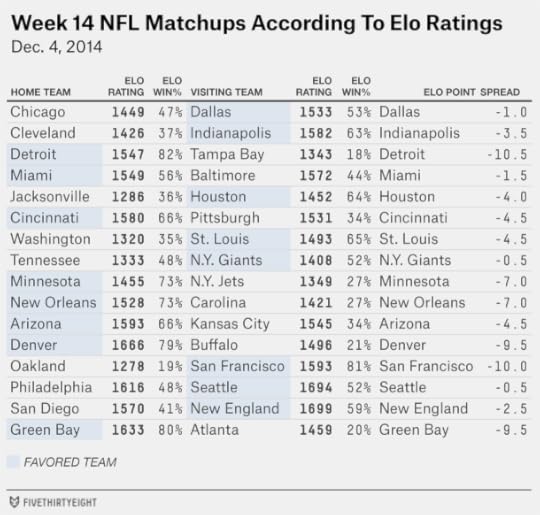
Elo’s performance against Vegas point spreads has become better over the season (we still don’t recommend that you bet on them). But meaningful differences between the two systems have also become harder to find. One disagreement this week involves Green Bay, which Elo has favored by 9.5 points at home against the Atlanta Falcons but which Vegas has favored by an even clearer 12.5-point margin. Arizona has been another source of disagreement between Elo and Vegas, and that’s true this week as well: Elo has the Cardinals favored by 4.5 points at home against the Kansas City Chiefs, while bookies have the game as a pick ’em.


Which City Has The Most Unpredictable Weather?
Most every American has some basis to complain about unpredictable weather. As a mid-latitude country with shining seas and majestic mountain ranges and fruited, wind-swept plains, we’re subject to pretty much every type of weather meteorologists have thought to identify. So perhaps you’ve heard the line: “If you don’t like the weather in Chicago, wait five minutes.” Or you’ve heard it applied to a city nearer to you: Denver or San Francisco or Atlanta or Boston.
But where in the country is the weather truly the most unpredictable?
We’re going to answer this question in a specific way, by comparing daily weather patterns against long-term averages.1 We’ll define the weather as being more unpredictable when it deviates more from these long-term trends.
Meteorologists call these long-term averages climatology. Weather forecasting has moved beyond climatology to embrace more sophisticated techniques, but in some cities climatology does extremely well on its own. Take the case of Phoenix, for example. The chart below compares high temperatures in Phoenix on each day from 2011 through 20132 against the 20-year average for the week3 in question. On a typical day in Phoenix, the high temperature deviated from the long-term average by only 5 to 6 degrees. You could plan a wedding or golf tournament in Phoenix years in advance and be reasonably confident of what the temperature would be.

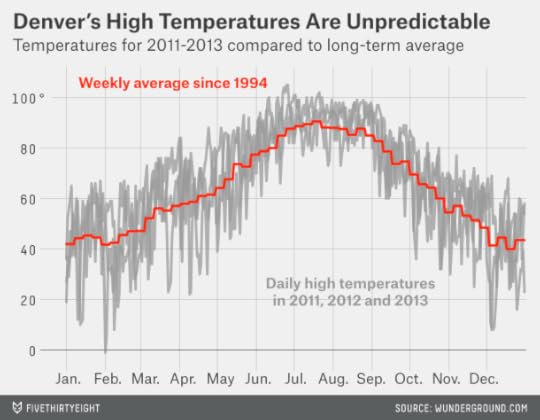
This wouldn’t be true for Denver. Over the past three years, climatology has missed the high temperature there by 9 to 10 degrees on average. And misses of 20 degrees or more, which almost never happen in Phoenix, have occurred, on average, once every other week in Denver.
Get the drift? We’ll do this for 120 American cities, one representative from each of the 120 National Weather Service forecast offices across the 50 states.4 (Generally, we used data from the largest airport-based weather station in the area.)5 And we’ll be doing it for 10 weather statistics rather than just high temperatures. We can then combine the statistics into an overall measure of weather unpredictability for each city.
As a reminder, our goal is to evaluate how unpredictable the weather is — rather than whether the weather is good or bad. In San Diego, to a first approximation, it’s always 72 degrees and sunny.6 In Seattle, to a first approximation, it’s always 59 degrees and drizzly. Most people like San Diego’s weather better, but both cities have fairly predictable weather patterns.
Nor are we concerned about how much the weather varies throughout the year — provided it does so predictably. As a matter of practice, cities with high seasonal volatility usually also have high day-to-day unpredictability, but there are exceptions. Phoenix, for instance, has pronounced seasonal variation in its temperatures (the average high temperature there is 67 degrees in January and 106 degrees in August) but the daily values don’t deviate much around those seasonal averages. So its temperatures rate as predictable. Similarly, a city that routinely has thunderstorms in the spring but rarely throughout the rest of the year will rate as having more predictable weather than one where storms can occur at any time.
The statistics we’ll be evaluating fall into three major categories.
First, temperature:
High temperatures;Low temperatures;Daily mean temperatures.Second, precipitation:
Rainfall, in inches;Snowfall, in inches of snow (rather than the liquid equivalent7);A binary variable indicating the presence or absence of precipitation (without regard to the type or amount of it). If there’s any precipitation at all over the 24-hour day, we score this variable as one. Otherwise, it’s zero.Finally, severe weather and the conditions that contribute to it:
Wind speed;Humidity8;Cloud cover9;A binary variable indicating whether there was a severe weather event (a thunderstorm, tornado or hail) in the city that day.We scrubbed the data to identify extreme outliers and obvious data-entry errors and removed them before calculating the weekly averages.10 Then we calculated the root-mean-square deviation for each variable. Because all the statistics are on different scales — degrees Fahrenheit for temperature, mph for wind speed — we standardized them onto a common scale before averaging them together.
That was a bit of work, but it allowed us to generate this fun map:

Among the cities we tested, the one with the most unpredictable weather is … Rapid City, South Dakota. Congratulations, Rapid City!
The ICAO code for Rapid City Regional Airport is KRAP. That’s also a good description of Rapid City’s weather. Its temperature might be 30 degrees in January — or just as easily -12. It’s snowy and windy and prone to big, unexpected winter storms. And it has a thunderstorm on almost 25 percent of days from July through September, more than the national average.
But Rapid City isn’t alone; other cities in the Great Plains and Upper Midwest dominate the most-unpredictable list. After Rapid City, those with the most unpredictable weather are Great Falls, Montana; Houghton, Michigan; Sioux Falls, South Dakota; Fargo, North Dakota; Duluth, Minnesota; Bismarck, North Dakota; Aberdeen, South Dakota; Grand Island, Nebraska; and Glasgow, Montana.
For the most part, these cities are landlocked. The presence of lakes or oceans can contribute to weather problems — for instance, the huge amounts of lake-effect snow in Houghton, in Michigan’s Upper Peninsula (about twice as much as in notoriously snowy Buffalo, New York). But water usually does more to regulate temperatures and severe weather.
The other common thread between these cities is that not very many people live in them. Indeed, among the top 23 cities on our list, none are within the 50 most populous metro areas in the United States. Among cities that do fall within the most populous metro areas, those with the most unpredictable weather are as follows:
Kansas City, Missouri;Oklahoma City;Minneapolis;Cincinnati;Indianapolis;St. Louis;Birmingham, Alabama;Boston;Milwaukee;Dallas.This list, too, is dominated by landlocked cities in the Midwest (depending on how you define the region). There are a smattering of northeastern cities and a few landlocked cities in the South.
To get more insight into the source of these differences, we can break the ratings down into their three major subcomponents: temperature, precipitation and severe weather. Here’s the map for temperature unpredictability:
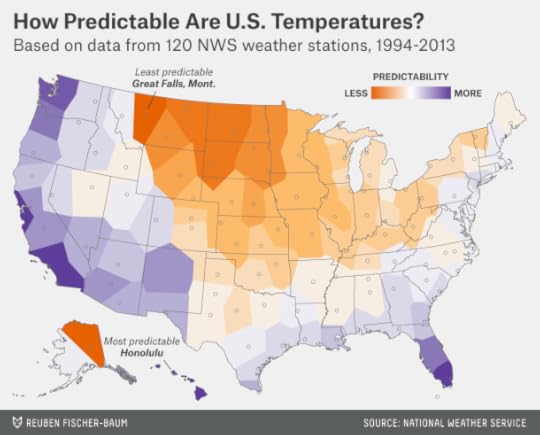
You can easily make out the path of the Rocky Mountains in this map. Cities just to the east of them — like Denver and Great Falls, Montana — have much more unpredictable temperatures than almost any place to the west of them.
Cities just to the east of the Pacific Ocean and the Gulf of Mexico have the most predictable temperatures. San Diego’s temperatures are the most predictable of anywhere in the continental United States (Honolulu’s are the most predictable overall). Seattle and San Francisco have highly predictable temperatures, as does the Florida peninsula.
The map of unpredictable precipitation patterns is dominated by cities in the eastern half of the country:

Nothing tops Houghton, which gets about twice as much snow as any other city we evaluated and can also be reasonably rainy in the summer.
But why don’t notoriously wet cities like Seattle and Portland, Oregon, rank higher? Both have precipitation fairly often; Seattle ranks eighth in the country (out of the 120 cities we tracked) by the number of days with precipitation, and Portland ranks ninth. But they usually have light precipitation. Between 1994 and 2013, Portland got at least an inch of rain only 1.2 percent of the time, for example, as compared with 2.1 percent of the time for the average U.S. city. Their precipitation patterns are also quite seasonal, making them more predictable. Seattle has historically received precipitation on 71 percent of days in January but just 19 percent of days in July.
If you want to have an easy life as a weather forecaster, you should get a job in Las Vegas, Phoenix or Los Angeles. Predict that it won’t rain in one of those cities, and you’ll be right about 90 percent of the time.
The frequency of severe weather conditions is more idiosyncratic than the presence of precipitation in general. But the map of areas most prone to unpredictable, severe weather generally follows Tornado Alley, with cities in the line of states from South Dakota through Oklahoma and northern Texas ranking toward the top of the list.
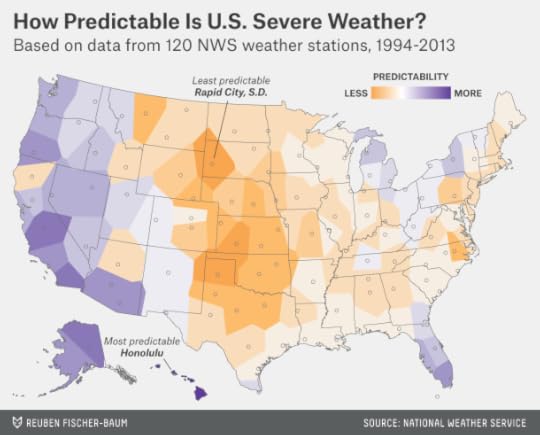
Oceans and lakes tend to reduce severe weather frequency and make its occurrence more predictable. There are some exceptions, however — especially the Atlantic Seaboard from North Carolina through Maine. Cities like Boston and New York don’t have many thunderstorms, but they have fairly unpredictable wind patterns and humidity levels. Those can scale up the severity of a storm in a hurry, especially in the winter months.
Want a more precise estimate of where your city ranks? As we mentioned before, we translated the 10 weather conditions onto a common scale; specifically, it’s a common scale where 66 represents average. Why 66? Because it should be an intuitive value when we’re looking at weather data. The high temperature for the 120 weather stations we tracked was about 66 degrees, on average, throughout the year.11
Higher values indicate more unpredictability:
Scores in the 80s or above indicate very high unpredictability.Scores in the 70s indicate above-average unpredictability.Scores in the 60s indicate average unpredictability.Scores in the 50s indicate comparatively predictable weather patterns.Scores in the 40s or below indicate highly predictable weather.There are some limitations to our method. It reflects day-to-day rather than hour-to-hour unpredictability, for instance. And perhaps the weather is more unpredictable within particular microclimates than at the airport-based weather stations we’ve tracked. Still, a few cities with a reputation for unpredictable weather rank lower than you might expect:
San Francisco’s weather patterns are unusual as compared to the rest of the country (September has historically been San Francisco’s warmest month, for instance). But they’re predictably unusual, at least on a day-to-day (if not necessarily hour-to-hour) basis. And San Francisco, like the rest of the West Coast, rarely gets severe weather.Chicago’s weather is slightly more unpredictable than average but not more than that. It has distinct seasons, and considerable temperature fluctuations, especially in the spring. But it doesn’t have especially unpredictable severe weather or precipitation patterns. It isn’t all that windy, despite its nickname, and it very rarely gets lake-effect snow since the wind usually blows west to east across Lake Michigan rather than into Chicago.Buffalo does get plenty of lake-effect snow and has unpredictable wind patterns. But its humidity levels and cloud cover patterns are fairly predictable, which cuts down on severe weather outside the winter and early spring.Denver, although it has among the most unpredictable high temperatures in the country and can have bouts of severe weather, has fairly predictable rainfall patterns (there usually isn’t much) and cloud cover (it’s usually sunny). And its problems tend to be concentrated in spring; summer days in Denver are often predictably mild.These cities still have plenty of unpredictable weather. But if you don’t like the weather in Chicago or Denver, be thankful you don’t have to deal with the KRAP they have in Rapid City.


December 3, 2014
College Football Playoff Update: TCU Promotion Shakes Up Odds
Sure, the college football playoff selection committee could change its mind at the last minute. Maybe it will decide Baylor deserves to rank ahead of TCU because Baylor won their head-to-head matchup. Maybe the committee will suddenly develop a fondness for Florida State, a team it has liked less than voters in the Coaches and AP polls.
But hoping for a shift in attitude is reminiscent of the line often said by losing political candidates: “The only poll that matters is on Election Day.” True, that’s when the votes are counted, but the pre-election polls predict the final tally pretty well. Voters usually don’t waver at the polling place.
Likewise, the voters on the committee are likely to remain steadfast. In fact, the rankings the committee published Tuesday night look like the work of a group that is doubling down rather than hedging its bets. TCU, which beat Texas badly last week, advanced to No. 3 in the rankings, overtaking Florida State, which won narrowly against Florida. That creates some further separation between TCU and No. 6 Baylor. And Florida State is now No. 4 despite being undefeated. The Seminoles will very probably make the playoff if they win the ACC championship game, but the committee seems to be making clear they won’t get in with a loss.
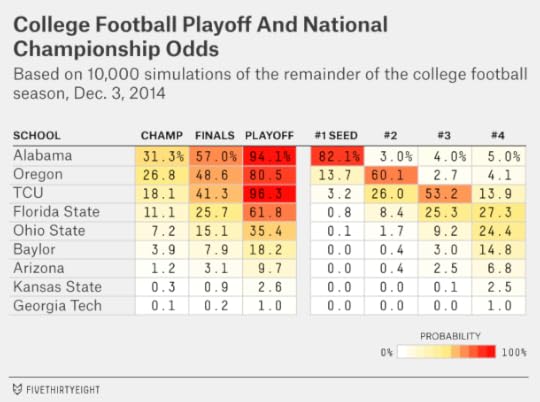
TCU’s chances of making the playoff are now 96 percent, according to the FiveThirtyEight model — up from 80 percent before the committee’s new rankings were released. Those odds might seem incredibly high, but TCU has a cupcake opponent in 2-9 Iowa State, against whom it’s a 97 percent favorite, according to ESPN’s Football Power Index (FPI). TCU remains unlikely to make the playoff should it lose, but it looks safer in the event of a win. That’s bad news for the teams ranking just behind it: Florida State, Ohio State and Baylor.
Arizona’s playoff chances were also helped slightly by the new rankings, rising to 10 percent from 7 percent. The committee slotted the Wildcats at No. 7 after their victory against Arizona State last week, ahead of Michigan State, which also won. Moving ahead of Michigan State is not important unto itself — MSU isn’t playing in the Big Ten championship game and is no real threat to make the playoff — but it’s a sign the committee likes Arizona enough that it could break into the top four if it defeats No. 2 Oregon for the Pac-12 title.
That leaves us with six games of consequence on the college football calendar this weekend: the four major conference championship games and the Big 12 regular-season games involving TCU and Baylor. These six games represent 64 possible permutations of winners and losers. But the simple version is this:
Alabama, Oregon, TCU and Florida State are very probably in the playoff with a win.No other team controls its own destiny. Ohio State is more likely than not to make the playoff with a win, but it’s in trouble if everyone else wins out.Only Alabama can really afford to lose, and even it wouldn’t be totally safe.If you want the more complicated version, read along:
No. 1 Alabama Crimson TideOpponent: No. 16 Missouri, for the SEC championship, on Saturday. Alabama is a 82 percent favorite, according to FPI.Overall chance of making playoff: 94 percentChance of making playoff with a win: 100 percentChance of making playoff with a loss: 68 percentChance of making playoff with a loss if the rest of the top five win: 39 percentAlabama is heavily favored against Missouri, but things could get messy if it loses.
Historically in the Coaches Poll, No. 1 teams that lost their conference championships fell to either No. 3, 4 or 5. The FiveThirtyEight model agrees with that range; it has Alabama as most likely to fall to one of those spots in the committee’s rankings if it loses.
There’s a huge amount of practical difference between finishing at No. 3 and No. 5, of course, but it’s hard to be more precise than that. One problem is that we don’t know whether the committee sees Alabama as a clear No. 1 or just barely ahead of the other top teams. The other complication is that Alabama isn’t playing its game in a vacuum.
The dangerous case for Alabama is if it loses while the rest of the top five — Oregon, TCU, Florida State and Ohio State — win. That scenario would be a nightmare for the committee; it would either have to deny the SEC a slot in the playoff (Missouri and Mississippi State have almost no chance) or bypass a one-loss conference champion such as Ohio State for two-loss Alabama.
Could Alabama wind up behind Baylor, too? Possibly, but the model has Baylor as the team that could break Alabama’s fall in the standings instead. Whereas it gives Ohio State a 60 percent chance of being ranked higher should it win while Alabama loses, it has Baylor with just a 30 percent chance of doing the same.
No. 2 Oregon DucksOpponent: No. 7 Arizona for the Pac-12 championship Friday night. Oregon is a 74 percent favorite, according to FPI.Overall chance of making playoff: 81 percentChance of making playoff with a win: 100 percentChance of making playoff with a loss: 26 percentChance of making playoff with a loss if the rest of the top five win: 10 percentOregon will be an underdog to make the playoff it loses. One problem is that its opponent in the Pac-12 championship game, Arizona, could jump ahead of it. The model has Arizona with a 65 percent chance of ranking ahead of Oregon should it beat it in Santa Clara, California. That seems conservative; the model makes no special consideration for head-to-head play whereas the committee might, and Arizona would then have two head-to-head wins against Oregon (the Wildcats beat the Ducks in the regular season).
Still, the Pac-12 championship is not quite a winner-take-all game. The committee could have some rationale for preferring Oregon to Arizona even if Oregon loses; Arizona played a poor nonconference schedule, and it has a middling rating, according to FPI and other systems. There’s also the chance the committee won’t admit a Pac-12 team.
No. 3 TCU Horned FrogsOpponent: At home against Iowa State on Saturday. TCU is a 97 percent favorite.Overall chance of making playoff: 96 percentChance of making playoff with a win: 99 percentChance of making playoff with a win if the rest of the top five win: 95 percentChance of making playoff with a loss: 12 percentChance of making playoff with a loss if the rest of the top five win: 1 percentThese next two cases are the simplest. TCU is very probably in with a win — even if all the other top teams win. It’s very likely out with a loss. Everyone else will be hoping for TCU to lose because it would be a clean knockout. Unlike Alabama, TCU would be little threat to remain in the top four with a loss. Unlike Oregon, a loss wouldn’t invite another team like Arizona into the playoff conversation. Unfortunately for those other playoff suitors, TCU is a 33-point favorite in Vegas.
No. 4 Florida State SeminolesOpponent: No. 11 Georgia Tech for the ACC championship Saturday night. Florida State is a 64 percent favorite.Overall chance of making playoff: 62 percentChance of making playoff with a win: 94 percentChance of making playoff with a win if the rest of the top five win: 88 percentChance of making playoff with a loss: 3 percentThis is an even clearer win-and-you’re-in, lose-and-go-home case. The model has Florida State as 94 percent likely to make the playoff with a win but gives it just a 3 percent chance with a loss.
You could debate either of those numbers, I suppose, but I don’t know that you’d get very far. Florida State has twice been overtaken in the playoff committee standings despite winning; is it possible that the committee could do that to the Seminoles again? Probably not; those previous demotions came after wins against middling opponents; Georgia Tech is a wholly respectable one. And the model isn’t considering the political consequences to the committee of leaving an undefeated defending national champion out of the playoff.
No. 5 Ohio State BuckeyesOpponent: No. 13 Wisconsin for the Big Ten championship Saturday night. Ohio State is a 59 percent favorite.Overall chance of making playoff: 35 percentChance of making playoff with a win: 60 percentChance of making playoff with a win if the rest of the top five win: 16 percentChance of making playoff with a win if at least one higher-ranked team loses: 86 percentChance of making playoff with a loss: 1 percentFirst things first. The Buckeyes need to beat Wisconsin. What then? As I’ve mentioned, the top four are in a reasonably safe position with a win. That necessarily implies the No. 5 team — Ohio State — needs someone ahead of it to lose to have much of a shot. If Ohio State wins but so does everyone ahead of it, its chances of making the playoff are just 16 percent. If it wins and someone ahead of it loses, those chances jump to 86 percent. Ohio State was hurt slightly by TCU pulling ahead of Florida State; TCU, playing a soft opponent, would have been an easier team to overtake for the No. 4 position.
No. 6 Baylor BearsOpponent: At home against No. 9 Kansas State on Saturday night. Baylor is a 70 percent favorite.Overall chance of making playoff: 18 percentChance of making playoff with a win: 26 percentChance of making playoff with a win if the top five win: 1 percentChance of making playoff with a win if one higher-ranked team loses: 7 percentChance of making playoff with a win if two or more higher-ranked teams lose: 62 percentChance of making playoff with a loss: 0 percentThe model is bearish on the Bears’ chances; it has them favored to make the playoff only if they win and at least two teams ranked ahead of them lose. Conference balance could also work against Baylor. If TCU gets in, the Big 12 will already have a representative in the playoff, and that could encourage the committee to prefer Ohio State or Arizona (or Alabama should it lose to Missouri) ahead of the Bears.
No. 7 Arizona WildcatsOpponent: No. 2 Oregon for the Pac-12 championship Friday night. Oregon is favored; Arizona has a 26 percent chance of winning.Overall chance of making playoff: 10 percentChance of making playoff with a win: 37 percentChance of making playoff with a win if the top five apart from Oregon win: 8 percentChance of making playoff with a loss: 0 percentArizona has come a long way. Its chances of making the playoff were just 0.4 percent two weeks ago. It has since secured big wins against Utah and Arizona State, while getting some help elsewhere (UCLA’s loss to Stanford) to get into the Pac-12 championship game.
The Wildcats will still need to bypass three teams to get in, but they have the advantage of playing one of them. Arizona is more likely than not to overtake Oregon in the standings should the Wildcats beat the Ducks.
No team below Arizona has more than a 3 percent chance of making the playoff. Kansas State is the team with the 3 percent chance after its ranking improved from No. 12 to No. 9. An even longer shot is Georgia Tech, which climbed from No. 16 to No. 11 and has a 1 percent chance. That’s not good, but it’s better than No. 13 Wisconsin or No. 16 Missouri, both of whom are also playing for their conference championships.
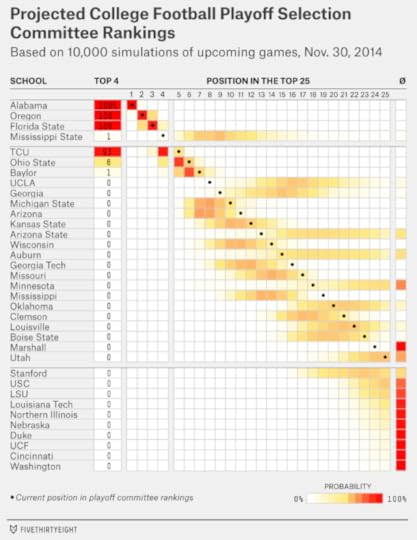
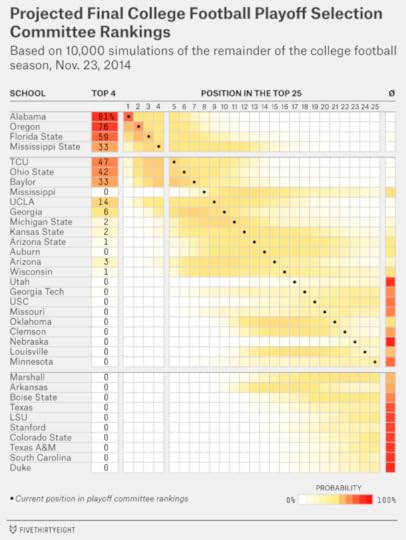
We’ll conclude with the model’s probabilistic take on how the top 25 might look Sunday:
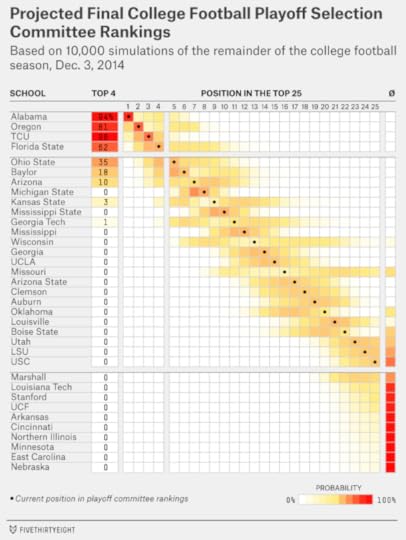
It’s fun to contemplate how things might change if there were eight teams in the playoff instead of four. Michigan State and Mississippi State would still be alive, and Wisconsin, Georgia Tech and Kansas State would have a lot left to play for.

November 30, 2014
College Football Playoff Update: 7 Teams Competing For 4 Positions
The college football playoff picture would have become much blurrier had Auburn held on to defeat No. 1 Alabama on Saturday. Instead, the Crimson Tide prevailed 55-44. There were some losses to teams ranking behind Alabama — No. 4 Mississippi State, No. 8 UCLA and No. 9 Georgia were all beaten — but they tended to clarify how the teams will line up heading into conference championship weekend. Here’s how FiveThirtyEight’s college football forecast model expects the playoff committee’s rankings might look when they come out on Tuesday evening:
The top four seem reasonably clear. Alabama, Oregon and Florida State are likely to remain No. 1 through No. 3 in that order. TCU, No. 5 entering the week, will probably be promoted to No. 4 after demolishing Texas 48-10.
Ohio State, No. 6 last week, might give the committee more to think about. Buckeye quarterback J.T. Barrett was injured (and knocked out for the season) late in a win against Michigan. The committee has said it will consider “key injuries that … likely will affect [a team’s] postseason performance.” (The FiveThirtyEight model does not make any assumptions about injuries and so it might overrate Ohio State’s chances of making the playoff.)
But the team ranking just behind Ohio State, Baylor, turned in one of the less impressive performances of the week, prevailing over Texas Tech by just 2 points, 48-46. Texas Tech, 4-8 on the season, could have tied the game and probably sent it into overtime with a successful two-point conversion.
Michigan State and Arizona, No. 10 and No. 11 entering the weekend, are almost certain to move up in the rankings given the losses ahead of them. But only Arizona has realistic playoff hopes; the Wildcats will face Oregon for the Pac-12 championship after having beaten Arizona State. How far they move up on Tuesday should tell us something about how seriously the committee takes them.
Here’s how the FiveThirtyEight model projects the committee’s final rankings on Dec. 7, which will determine the four teams that make the playoff:

Even with just one one week to play, the scenarios are reasonably complex. So let’s briefly discuss the playoff from the perspective of the seven teams that are most likely to make it:
Alabama (94 percent chance of making playoff). Are the Crimson Tide guaranteed to be in? Not quite. But in addition to catching a few breaks against Auburn, Alabama also benefitted from Missouri winning and advancing to face them in next week’s SEC Championship game. At least according to the computer rankings, Missouri is a weaker opponent than Georgia would have been. And Missouri (No. 17 heading into the weekend) is probably coming from too far behind to leap Alabama in committee standings even with a win in Atlanta. In fact, the model gives Alabama a 67 percent chance of making the playoff even with an SEC Championship loss.
Oregon (82 percent chance). Oregon controls its destiny but has less ability to survive a loss in their championship game; the model gives them a 30 percent chance of making the playoff if they lose. That’s, in part, because Oregon’s opponent, Arizona, could plausibly enter the playoff if it wins the Pac-12 championship.
TCU (80 percent chance). Although TCU will likely remain behind Florida State in Tuesday’s rankings, the model has them as a safer bet to make the playoff. That’s mainly because TCU’s upcoming matchup is easier. TCU will play a previously-scheduled game against a middling Iowa State team next week (the Big 12 does not host a championship game). Florida State will face a more difficult opponent, Georgia Tech, in the ACC Championship.
TCU’s case may be more complicated than the model implies, however, because it lost earlier in the season to Big 12 rival Baylor. But last week’s performance may give the committee a good excuse to ignore the head-to-head result and instead look to factors like results against common opponents like Texas Tech. While Baylor only narrowly escaped Texas Tech, TCU had beaten them 82-27 on Oct. 25.
Florida State (70 percent chance). The undefeated Seminoles helped their cause with a win against Florida. But they’re only 65 percent favorites to beat Georgia Tech in the ACC Championship. If the Seminoles lose, they’ll have only a 15 percent chance of making the playoff, according to the model.
It didn’t help Florida State that the No. 5 through 7 teams (TCU, Ohio State and Baylor) all won last weekend. The committee isn’t especially fond of the Seminoles, and a loss in the ACC Championship could allow TCU, Ohio State or Baylor to leap frog them.
Ohio State (39 percent chance). The model gives Ohio State a 66 percent chance of making the playoff should it beat Wisconsin in the Big Ten championship (and almost no shot if it loses that game). That doesn’t account for the injury to Barrett — although if backup Cardale Jones is good enough to beat the Badgers, that arguably ought to resolve the committee’s questions. Still, this wasn’t a great weekend for Ohio State. In addition to Barrett’s injury, they would have benefited from more chaos ahead of them in the standings. The Buckeyes could beat Wisconsin and still be left out.
Baylor (23 percent chance). The Big 12 doesn’t play a championship game, but the Bears, will have the chance to impress the committee as they’ll face a challenging opponent in Kansas State next weekend. Still, it may be wishful thinking to expect Baylor to suddenly leap ahead of TCU or other teams in the rankings. The committee, to the extent it evaluates head-to-head performance, seems to have decided that Baylor’s win against TCU isn’t enough to outweigh what it sees as TCU’s better resume.
Arizona (7 percent chance). This sounds like a real long shot, but it’s partly because the model gives Arizona just a 26 percent chance of beating Oregon. Should they win that game, the Wildcats will have a 27 percent chance of making the playoff, according to the model. The Wildcats might need one or two of the teams ranked ahead of them to lose (in addition to Oregon) to feel great about their chances.
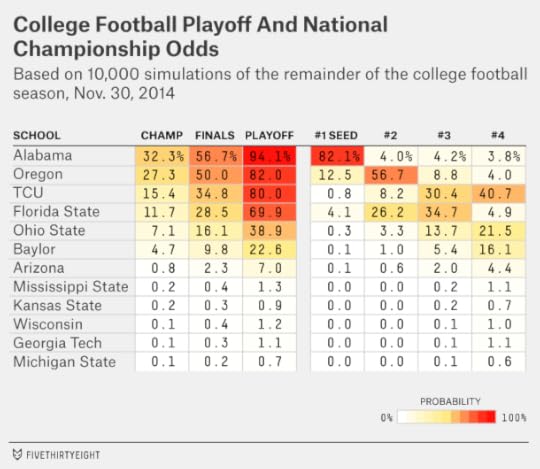
Overall, Alabama and TCU were helped the most by the past weekend’s action. Alabama’s chance of winning the national championship — not just making the playoff — is up from 26 percent last week to 32 percent. TCU’s chances improved from 9 percent to 15 percent.

November 26, 2014
What’s At Stake For Every College Football Playoff Contender
The college football playoff committee didn’t make much news when it released its new rankings Tuesday: The top seven teams remained the same. The biggest shift was for Mississippi, which lost badly last week and fell from No. 8 to No. 19.
This was in line with what our college football forecast model expected. Because the model is based mostly on a historic analysis of the Coaches Poll, this means the committee behaved in the same boring way the coaches usually do — keeping the teams in the same order except when one drops a game and loses its place in line. So, our national championship and playoff odds look very much like they did Sunday.

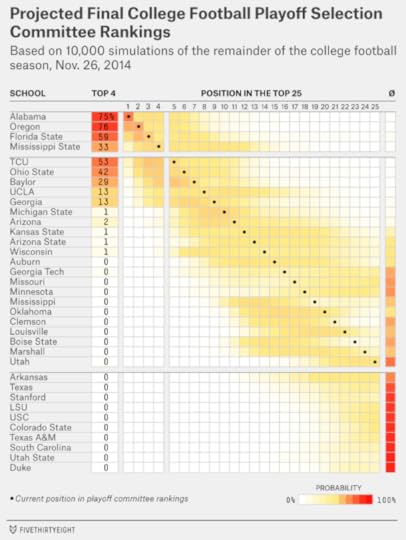
Here’s the more comprehensive version of that chart, which includes the entire Top 25 as they might appear when the committee releases its final standings Dec. 7.
The lack of movement may also have been because last weekend was a sleepy one on the college football calendar. This upcoming weekend features much higher stakes, with the top teams facing more formidable opponents and entries into the conference title games on the line.
I’m going to run through the top 11 teams in the committee’s rankings as the model sees their chances. In each case, we’ll look at how much a win or loss this weekend would affect the team’s playoff odds along with some more complex scenarios: for instance, if the team loses this week but wins its conference championship next week. Some of the more involved scenarios will expose potential blind spots in the model; we hope it’s still a helpful tool for thinking through the various possibilities.
No. 1. Alabama Crimson TideOpponent: No. 15 Auburn on Saturday night. Alabama is a 70 percent favorite according to the model; win probabilities are derived from a simplified version of ESPN’s Football Power Index (FPI).Overall chance of making playoff: 75 percentChance of making playoff with a win: 87 percentChance with a win but a loss in SEC Championship: 60 percentChance with a loss against Auburn: 48 percentChance with a loss but a win in SEC Championship: 75 percentChance with a loss and Mississippi State win (Alabama misses SEC Championship): 40 percentYou might expect the No. 1 team’s path to be straightforward. But Alabama’s is one of the more complex cases. That’s because there are really five scenarios to analyze. Two are straightforward: If Alabama defeats Auburn and wins the SEC Championship game, it’s in the playoff, very likely as the No. 1 seed. And if it loses twice, it’s probably out — unless there’s a ton of chaos behind it.
The other three are trickier. Alabama could win this week then lose in the SEC Championship. It could lose this week and win the championship. Or it could lose this week and fail to make the championship, which will happen if Mississippi State wins.
Failing to make the championship at all is the most dangerous for Alabama; their chances of reaching the playoff would be just 40 percent in that scenario. But the ranking of the other two is debatable.
It’s hard to imagine Alabama would be left out if it lost to Auburn but made the SEC title game and won it. The model puts their chances at 75 percent in this case. And that seems too conservative — the alternative would probably entail no SEC team making the playoff at all. Sure, it’s technically possible. If Oregon, Florida State, Ohio State and either Baylor or TCU all win out, the committee would have to bump a zero- or one-loss conference champion for two-loss Alabama. That would be a predicament. But anything short of that exact scenario, and SEC fans from Gainesville to College Station would put aside their differences and come at the committee with pitchforks.
A more acute danger might be a win against Auburn followed by a loss to Georgia in the SEC Championship. That way, the committee might get an SEC team into the playoff by choosing Georgia. Georgia needs some help to get into this position. The Bulldogs need Missouri to lose this weekend (Missouri probably doesn’t have the resume to make the playoff even if it wins out) and probably to defeat nonconference foe Georgia Tech on Saturday (otherwise, Georgia’s case will be too weak also).
A lot of these questions boil down to how much the committee will emphasize conference championships as opposed to everything else. We don’t have much data on that yet, and neither do the folks in Tuscaloosa. Until we learn more, the only totally safe course for Alabama is simply to win twice.
No. 2. Oregon DucksOpponent: At Oregon State on Saturday night (Oregon is a 90 percent favorite)Overall chance of making playoff: 76 percentChance with a win: 81 percentChance with a win but a loss in Pac-12 Championship: 42 percentChance with a loss: 32 percentChance with a loss but a win in Pac-12 Championship: 49 percentWe might ask the same question for Oregon: If it must lose again, is a loss this week or in the Pac-12 Championship better? This case is simpler because Oregon is already assured of making its championship game.
The model’s answer is that it’s slightly better for Oregon to lose this week — even against unranked Oregon State — and come back to win the Pac-12 title. The danger of losing the Pac-12 Championship is that Oregon’s Pac-12 opponent could possibly get in ahead of them, especially if it’s UCLA.
No. 3. Florida State SeminolesOpponent: vs Florida on Saturday afternoon (Florida State is a 74 percent favorite)Overall chance of making playoff: 59 percentChance with a win: 75 percentChance with a win but a loss in ACC Championship: 18 percentChance with a loss: 15 percentChance with a loss but a win in ACC Championship: 22 percentFlorida State isn’t at risk of being overtaken by anyone in its conference. (It’s clinched a spot in the ACC Championship and its opponent in that game, No. 16 Georgia Tech, almost certainly won’t make the playoff even if it wins out.) But the committee seems to be down enough on FSU that it probably can’t afford a loss at all. Some of FSU’s problem is strength of schedule, as it has been all year. Neither Florida nor Georgia Tech is likely to impress the committee as an acceptable loss for the Seminoles, even if it wins the other game.
No. 4. Mississippi State BulldogsOpponent: at No. 19 Mississippi on Saturday afternoon (Mississippi State is the underdog; it has a 41 percent chance to win)Overall chance of making playoff: 33 percentChance with a win: 74 percentChance with a win and an Alabama win (Mississippi State misses SEC Championship): 77 percentChance with a win and an Alabama loss (Mississippi State advances to SEC Championship): 65 percentChance with a loss: 4 percentMississippi State has to win this week against Mississippi. FPI has them as underdogs to do so. But the Bulldogs’ chances of making the playoff will more than double to 74 percent if they do.
But now we’re going to get a little crazy. Surely, things would be even better for Mississippi State if it won while Alabama lost, which would get them into the SEC Championship game?
The model says no: Instead, the Bulldogs should be rooting for Alabama!
Here’s why: If Mississippi State wins this week and completes its regular season, that’s probably good enough. It’s already No. 4 and will have notched another big win, on the road, against a ranked rival. Sure, it could eventually be surpassed by a team like TCU, but it could also see a team like Florida State ahead of it lose. It’s a reasonably sound position.
But now imagine that Mississippi State wins this week and makes the SEC Championship but loses that game. Instead of a one-loss non-champion, it’s a two-loss non-champion — not so attractive. Furthermore, Alabama would also be a two-loss non-champion in this scenario and one that beat Mississippi State head-to-head late in the regular season. The risk-reward ratio would be poor for the Bulldogs.
No. 5. TCU Horned FrogsOpponent: at Texas on Thursday night (TCU is a 65 percent favorite)Overall chance of making playoff: 53 percentChance with a win: 79 percentChance with a win if current top four also win this weekend: 50 percentChance with a loss: 5 percentTCU was helped by the committee this week, which left it at No. 5 even though it was idle. Indeed, the committee’s affection for TCU is a bit bizarre. TCU lost to No. 7 Baylor in October and the more sophisticated computer systems like FPI also have Baylor ranked higher. There’s some thought that Baylor will suddenly jump ahead of TCU if both teams win out. But if the committee has been placing TCU ahead of Baylor for weeks now despite its head-to-head loss, why would it suddenly shift gears?
In any event, the model now has TCU’s chances of making the playoff at slightly better than even — and their chances will jump to 79 percent with a win against Texas. However, some of that possibility is contingent on one of the teams ahead of them losing. If the top five teams all win out, TCU’s playoff chances will be stuck at about 50 percent.
No. 6. Ohio State BuckeyesOpponent: vs. Michigan on Saturday afternoon (Ohio State is an 89 percent favorite)Overall chance of making playoff: 42 percentChance with a win: 47 percentChance with a win and a win in Big Ten Championship: 73 percentChance with a win and a loss in Big Ten Championship: 6 percentChance with a loss: 2 percentThis is one of the simpler cases. Ohio State isn’t assured much of anything, but the team has about a 3-in-4 chance of making the playoff if it wins out, mostly because there’s likely to be some attrition ahead of it.
One question is whether the Buckeyes will be ranked ahead of teams like Alabama, Oregon and Florida State if any of the three do lose this week. Those could be close calls for the committee. Not that it needs extra motivation against the Wolverines, but Ohio State might be helped by turning up with a dominant performance against Michigan instead of just getting by.
No. 7. Baylor BearsOpponent: at Texas Tech on Saturday afternoon (Baylor is a 94 percent favorite)Overall chance of making playoff: 29 percentChance with a win: 31 percentChance with a win and a win against Kansas State next week: 40 percentChance with a loss: 1 percentThis is a low-stakes weekend for Baylor as compared with the rest of the top teams. The Bears are huge favorites against Texas Tech, and that probable win is already priced into their playoff odds. They have a bigger game against Kansas State next week.
Unlike the six teams ahead of it, however, Baylor would be under 50 percent to make the playoff even if it wins out, according to the model. This is one of the model’s more debatable conclusions and triggers another set of complicated questions.
In that event, Baylor would be the putative Big 12 champion because of its head-to-head victory against TCU, even if TCU wins out also. The Big 12 does not hold a title game. Will the committee value conference championships to the same extent it values wins in conference championship games? If it already ranks TCU ahead of Baylor despite Baylor’s head-to-head win, would the fact that Baylor won the conference title on the basis of that head-to-head victory count as an additional credential, or would the committee see it as redundant?
No. 8. UCLA BruinsOpponent: at Stanford on Friday afternoon (UCLA is a 69 percent favorite)Overall chance of making playoff: 13 percentChance with a win: 18 percentChance with a win and a win in Pac-12 Championship: 47 percentUCLA is about even-money to make the playoff if it wins out and has almost no chance otherwise.
No. 9. Georgia BulldogsOpponent: vs. No. 16 Georgia Tech on Saturday afternoon (Georgia is an 81 percent favorite)Overall chance of making playoff: 13 percentChance with a win: 16 percentChance with a loss: 1 percentChance with a win and a Missouri loss (Georgia advances to SEC Championship): 22 percentChance with a win and win in SEC Championship: 44 percentOur model thought Georgia might be at some risk of ranking worse than No. 9 in this week’s committee standings; it played a Division I-AA opponent last week, Charleston Southern, while several of the teams ranked just behind them won against (slightly) better competition.
The reaffirmation from the committee helps keep Georgia dangerous. The Bulldogs have one more hurdle than UCLA — they need Missouri to lose to make their conference title game while UCLA is in with a win. But if they make the SEC championship and win it, their odds of making the playoff will be close to even.
No. 10. Michigan State SpartansOpponent: at Penn State on Saturday afternoon (Michigan State is a 78 percent favorite)Overall chance of making playoff: 1 percentChance with a win: Still about 1 percentChance with a win, if at least 3 teams ranked ahead of it lose this weekend: 3 percentChance with a win, if at least 6 teams ranked ahead of it lose this weekend: 16 percentI list this case to demonstrate that when you’re on the outside looking in, you’d rather take a high-stakes path (like the one Georgia has). As I mentioned last week, Michigan State — locked out of its conference title game and with a middling opponent this week — just can’t do enough to impress the committee to jump into the top four. Even if there’s total and utter chaos ahead of Michigan State, its best-case scenario is probably finishing at No. 5 or No. 6.
No. 11. Arizona WildcatsOpponent: vs. No. 13 Arizona State on Friday afternoon (Arizona is a 64 percent favorite)Overall chance of making playoff: 2 percentChance with a win: 3 percentChance with a win and a UCLA loss (Arizona advances to Pac-12 Championship): 7 percentChance with a win and a win in Pac-12 Championship: 24 percentArizona, like Georgia, at least has a specific path to follow: It’ll need to beat Arizona State, hope UCLA loses so it can make the Pac-12 title game, then beat Oregon there, then hope that one or two teams lose ahead of it. It’s not likely. But the committee might want to find a spot for the Pac-12 champion; it seems to like the conference; the committee ranks Oregon, UCLA and Arizona higher than the AP poll has them.
There are a few other teams with a snowball’s-chance-in-hell. Arizona State’s case isn’t fundamentally that different than Arizona’s. Kansas State has an outside chance to finish as the Big 12 champion — again, without the benefit or risk of playing in a championship game — and could be more attractive than the likes of Michigan State if the committee is desperate. Wisconsin could also be a two-loss conference champion if it beats both Minnesota and Ohio State. The model says there’s almost no chance Missouri will get in even with an SEC title, but if the SEC goes haywire and the committee is struggling to represent it, who knows.
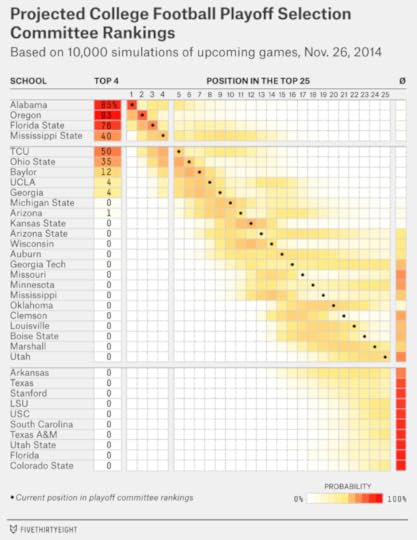
In any event, here is the model’s probabilistic take on how the standings might look a week from now, accounting for both the uncertainty in this weekend’s games and in how the committee will react to them.

November 23, 2014
College Football Playoff Update: High Stakes For Florida State, UCLA
The Florida State Seminoles have not lost a football game in almost two years. After succumbing to Florida on Nov. 24, 2012, they recovered to win the ACC Championship Game and, on Jan. 1, 2013, the Orange Bowl. They went undefeated (14-0) in the 2013 season and won the national championship. And they’re 11-0 so far this year. That’s 27 wins in a row.
But Florida State entered its game against Boston College on Saturday ranked just No. 3 in the playoff selection committee’s standings, behind Alabama and Oregon. The Seminoles’ narrow win over Boston College on Saturday – they won 20-17 on a last-minute field goal – probably won’t help their case much.
Might the Seminoles’ position even fall further when the new committee standings come out on Tuesday night? On Friday, we debuted a college football playoff forecast model that seeks to answer these questions. The good news for Florida State is that none of the teams ranked immediately behind it did anything terribly impressive either. No. 4 Mississippi State won 51-0, but did so against 3-8 Vanderbilt. Fifth-ranked TCU did not play. No. 6 Ohio State also played a 3-8 team, Indiana, winning 42-27 in a game that was close until the fourth quarter.
To find a school with a truly impressive win, you’ll need to scan down to No. 9 UCLA, which won easily against No. 19 USC, its crosstown rival. More about the Bruins in a moment. First, here’s the model’s probabilistic view of what the new committee standings might look like on Tuesday:

The model says last week’s top four – Alabama, Oregon, Florida State and Mississippi State — are likely to remain in the same order on Tuesday.
However, since the committee is new, the model is mostly based on an analysis of how games have historically changed the standings in the Coaches Poll. Perhaps the playoff committee will view things differently. When it comes to Florida State, it already has a significant difference of opinion with the Coaches Poll, which has the Seminoles at No. 1.
Florida State has won by narrower margins, and against a weaker schedule, than the other top teams this year. It’s hard to say which of those factors are producing the difference in the rankings. Perhaps the committee is looking at what it calls “game control” – a team’s ability to remain in a comfortable position from start to finish – and finding Florida State’s series of nail-biting wins faulty. Or perhaps, regardless of the scorelines, they don’t see enough big wins on Florida State’s resume. The Seminoles’ most impressive-seeming win of the season, against then 6-0 Notre Dame on Oct. 18, looks less so now that Notre Dame has lost four of its last five games.
There’s also the issue of how much the polls and the committee are weighing preseason expectations. Our research has uncovered evidence that where a team starts the year in the Coaches Poll affects where it finishes, even after accounting for its performance during the current football season. Florida State started as the preseason No. 1 in the Coaches Poll. The committee, however, did not release its first rankings until Oct. 28, halfway into the season, and had Florida State second.
If your goal is to forecast upcoming games, it’s not wrong — in fact, it’s helpful statistically — to consider results from previous seasons. College football teams play fewer games than those in any other major American sport. Looking at “old” data is better than not having enough data.
But if you want to determine who “deserves” a place in the playoff, it’s more complicated. It might be politically incorrect for the committee to consider last year’s performance in determining eligibility for this year’s playoff.
It’s going to take some time for us to make clear inferences about which factors the committee prioritizes. That’s why we’re treating this year as an experiment for the model rather than something you might bet a lot of money on.
However, if Florida State were to fall to No. 4 or lower this week, it would be a sign the committee places a lot of emphasis on margin of victory and game control. At the other logical extreme – if the committee didn’t consider margin of victory at all — Florida State would have a case for moving up in the standings, since its opponent on Saturday, Boston College, was the best of a very weak lot (Western Carolina, Colorado, Vanderbilt) faced by the other teams in the top four.
UCLA will be another interesting test case for the committee. The Bruins, No. 9 last week, will very likely move up at least one position. That’s because Mississippi, No. 8 last week, lost to Arkansas, taking its third loss and eliminating its hopes of title contention.
But could UCLA move up to No. 6 or No. 7 instead? Historically, voters in the Coaches Poll have not rewarded teams much for “big wins” (instead, they’ve tended to punish them for losses). The committee, so far, has been a little more aggressive about promoting teams after they secure major victories, sometimes jumping them ahead of other teams that also won. USC might or might not qualify as a “big win” for UCLA — the Bruins were favored and playing at home — but it’s impressive compared to the middling opponents the other top teams faced.
UCLA’s placement is relevant because it has a path, albeit a fraught one, into the playoff. The Bruins will need to beat Stanford on Friday and then Oregon in the Pac-12 title game on Dec. 5. If that happens, UCLA will presumably move ahead of Oregon in the committee’s pecking order. But even that will not be enough. Say that Alabama and Florida State also win out. UCLA might also need to jump ahead of potential conference champions like TCU, Baylor and Ohio State. Or imagine that Florida State loses. Would the committee take a two-loss UCLA team ahead of a one-loss Florida State team?
The next chart represents the model’s attempt to sort out all these possibilities and forecast how the standings might look on Dec. 7, when the committee will release its final rankings:
UCLA’s chances of making the playoff are 14 percent — up from 8 percent before its win against USC. That may undersell the Bruins’ chances, however. If they beat both Stanford and Oregon, their chances will be about 50 percent, according to the model.
What about Florida State? The model has the Seminoles’ chances at 59 percent overall, not much changed from 60 percent last week. But it gives them just an 18 percent chance of making the playoff if they take a loss rather than finishing the season undefeated.
We’ll rerun these numbers on Wednesday after the committee has released its new standings. Here’s how the national title odds look in the interim:

There’s not much change from last week, other than for UCLA and Mississippi. If you’re looking for a real dark horse, however, you might find one in the Arizona Wildcats. Like UCLA, they’re 9-2 and they also scored an impressive victory Saturday, demolishing No. 17 Utah 42-10 in Salt Lake City. To make the playoff, they’ll probably need to beat Arizona State on Friday and hope that UCLA loses to Stanford (UCLA beat Arizona on Nov. 1 and so holds the tiebreaker against them if the teams finish with the same Pac-12 record). Then, Arizona would make the Pac-12 title game and have to beat Oregon. The Wildcats would probably also need other teams like Ohio State or Florida State to lose. This parlay is not at all likely — the model puts the chances at about 3 percent — but Arizona isn’t drawing totally dead.
True college football geeks might also pay attention to what the committee does at the bottom end of its new top 25. With No. 17 Utah, No. 19 USC and No. 23 Nebraska all losing on Saturday, a couple of new positions should open up.
The teams that enter the standings will have zero chance of making the playoff. But they may reveal something about the committee’s philosophy. What if Arkansas pops into the standings, for instance? The Razorbacks are just 6-5, but they’ve played the second-toughest schedule in the country according to Jeff Sagarin’s ratings, and they’re coming off shutout wins against LSU and Mississippi. If they enter the rankings, it would be a sign the committee is sympathetic to teams that play tough schedules. If a team like Marshall enters instead — it’s 11-0 but against a pathetic schedule — the committee would be giving a different signal.

November 21, 2014
FiveThirtyEight’s College Football Playoff Forecast
Which teams are most likely to make college football’s first-ever four-team playoff? And which have the best chance of coming away with the national title?
The quick answer is the obvious one: The Alabama Crimson Tide lead the way on both counts. They’re No. 1 in the playoff selection committee’s current rankings and No. 1 according to most computer systems, including ESPN’s Football Power Index (FPI). Alabama is no stranger to postseason success, having won the national title in 2009, 2011 and 2012.
But it won’t be easy for Alabama, or anyone else. To win the national title, the Crimson Tide may need to prevail in four very challenging football games — against arch-rival Auburn on Nov. 29, in the SEC Championship on Dec. 6, and then in the national semifinal and championship games. Alabama is more likely than any other team to win the title, but its chances are still only about 28 percent.
That number comes from a new model we’ve developed that simulates the rest of the college football season and considers how subsequent games might affect the playoff committee’s rankings. The model is speculative: Statistical models are grounded in history and there’s zero history to go by when it comes to the college football playoff. But we hope to have some fun with it over the next few weeks and use this season as a guide for how to improve it in future years.
The key characteristics of the model are that it’s iterative and probabilistic.1 By iterative, I mean that it simulates the rest of the college season one game and one week at a time instead of jumping directly from the current playoff committee standings to national championship chances. By probabilistic, I mean that it hopes to account for the considerable uncertainty in the playoff picture, both in terms of how the games will turn out and in how the humans on the selection committee might react to them.
Games are simulated using ESPN’s Football Power Index. To take one example, FPI has USC with about a 40 percent chance of upsetting UCLA in the game they’ll play Saturday in Pasadena, California.
The next question is how the teams’ standings in the playoff rankings might change given the possible outcomes on the field. We’ve principally used the historic record of the Coaches Poll for guidance. The simulations account for the fact that some wins and losses matter more than others.
Let’s say that USC wins. It’s currently ranked No. 19 in the playoff committee’s rankings. On average in the Coaches Poll, teams ranked in that position have moved up to only No. 17 or No. 16 after a win.
Our model sees more upside potential for USC, however. A victory for the Trojans would come in what is technically a road game for them (a few freeways away from their campus in Los Angeles). More importantly, it would come against a higher-ranked opponent in UCLA. Historically — and quite reasonably — human raters have given more credit to wins like those, so our simulation would have USC moving up to No. 15 or No. 14 on average if it wins instead. But there’s considerable uncertainty in the outcome. We have USC moving as high as No. 10, or even into the high single digits, in some simulations; in other cases, a number of other teams ranked near it in the standings might have impressive wins also, and USC would barely move up at all.
The simulations also account for the potential margin of victory in each game. Voters in the coaches and media polls have mostly looked at wins and losses, but our research suggests they give a little bit more credit to especially lopsided victories or especially close ones.
USC, although an interesting case for the model, is almost no threat to win the national championship no matter the scoreline in Pasadena. Even if it beats UCLA this week and Notre Dame next week — and wins the tiebreaker for the Pac-12 title and then wins that game against Oregon as well, it will be coming from too far behind. Our simulation gives the Trojans only a 0.2 percent chance of making the playoff.
Other teams have a more credible chance of contending. Take Mississippi State. On the positive side for the Bulldogs, four teams will get into the playoff and they’re currently ranked No. 4. But Mississippi State has more downside than upside scenarios. It will almost certainly be out if it loses against No. 8 Mississippi — a game in which FPI has the Rebels favored. And even if Mississippi State wins that game, it won’t advance to the SEC Championship unless Alabama loses to Auburn. If Alabama wins, the Bulldogs would be denied another chance to impress the committee. Thus, our simulation has Mississippi State with just a 27 percent chance of making the playoff.
These permutations can get complicated, which is why it helps to take things one week at a time. What might the playoff committee standings look like after this Saturday’s games, for instance? The heat map you see below reflects our model’s effort to account for all the possibilities:
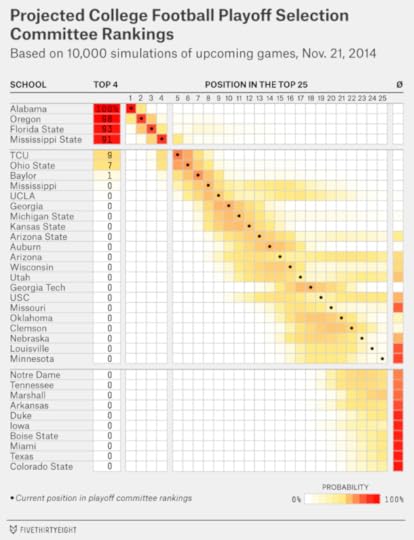
The top four probably won’t look much different when the playoff committee releases its new standings on Tuesday. They all have fairly easy marks: Alabama will play a Division II opponent, Western Carolina. No. 2 Oregon is at home against 2-8 Colorado. No. 3 Florida State is heavily favored at home against Boston College. And Mississippi State is also at home, playing Vanderbilt, the worst team in the SEC.
There’s more action outside the top four. I already mentioned the high-leverage game in Pasadena. If you look carefully at the chart, you’ll see that USC’s probability distribution is bimodal. In other words, it probably won’t stay at No. 19, where it is now. If it beats UCLA, it could gain several positions in the rankings; if it loses, it will have taken its fourth loss and might be knocked out of the top 25 entirely.
USC’s opponent, UCLA, also has a lot on the line. UCLA would need a lot of help, but it still has an outside chance — our model puts it at 8 percent — of making the playoff. Beating both USC and Stanford would give UCLA an entry into the Pac-12 championship game. If it beat Oregon then, and a team or two ahead of it endures a loss, it could get in.
We might compare the Trojans against their Hellenic-themed rivals, the Michigan State Spartans. Not that MSU, already having lost twice, had much chance to begin with (it pains me to say that as an East Lansing High School alum). But the Spartans are a good example of a team that just doesn’t have enough opportunities to impress committee voters even under its best-case outcomes. MSU’s only remaining scheduled games are against unranked Rutgers and Penn State — and it will only make the Big Ten Championship game if it wins twice and Ohio State loses twice.
The Georgia Bulldogs, by comparison, despite being just one position ahead of Michigan State in the rankings, have a better hand to play. They’ll make the SEC Championship if Missouri loses either of its remaining games. If Georgia makes the conference title game and beats Alabama, it would give committee members a lot to think about.
Here’s how our model sees the potential lay of the land on Dec. 7, when the selection committee will release its final rankings:

As you can see, playing out three weeks’ worth of games increases the uncertainty a great deal as compared to just this coming weekend’s outcomes. No team is more than 75 percent certain to make the playoff.
Florida State, despite being undefeated and No. 1 in the Coaches Poll, is not all that well positioned. The selection committee has it at No. 3, which implies that a loss would probably knock it out of contention. FPI, along with other computer systems, is not high on the Seminoles, who have won by middling margins against a so-so schedule.
Oregon’s position is better. The Ducks will probably have to win out also, but they’ve already survived the tougher parts of their schedule. Oregon has been good enough, in fact, to make duck-hunting an appealing proposition; UCLA’s outside shot of making the playoff relies upon the possibility of beating it in the Pac-12 Championship.
Our simulation also accounts for what might happen beyond Dec. 7. Here are the teams most likely to win the national championship, according to our model:

A few teams might be overlooked in the title hunt. Although none of its teams ranks in the top four now, the Big 12 is more likely than not to advance one team (TCU or Baylor) into the playoff. Ohio State’s position as a potential one-loss winner of a major conference will start to look better if any teams ahead of it slip. Ole Miss is a longshot to make the playoff — it will have to beat Mississippi State and perhaps hope that Alabama loses also so that it can get into the SEC Championship — but it’s at the top of the pecking order as far as two-loss teams go.
There’s still a lot that these simulations aren’t accounting for. There’s no mechanism in the model to account for head-to-head results even though the committee has said it will consider them if the standings are otherwise close. That potentially works to the benefit of Alabama, which might finish close to Mississippi State in the standings if it loses to Auburn or in the SEC Championship, but which beat the Bulldogs in Tuscaloosa last week.
The selection committee may also place more emphasis on conference championships than the simulations do. But we have no evidence yet for how that might play out — nor for how resistant the committee might be to choosing two or more teams from the same conference. We hope you’ll join us as we sort through the scenarios.

November 20, 2014
Can Alabama Afford To Lose?
Last Saturday, the Mississippi State Bulldogs — ranked No. 1 in the AP Poll, the Coaches Poll and the College Football Playoff committee’s rankings — lost to the Alabama Crimson Tide 25-20. The loss ruined the Bulldogs’ quest for their first undefeated season since 1940, when they went 10-0-1.
But under college football’s new playoff system, which will select four teams to contend for the national championship, a late-season loss by a No. 1 team isn’t as devastating as in years past. Mississippi State, for instance, fell only to No. 4 in the committee’s rankings after it lost to Alabama.
It’s less clear whether the Bulldogs control their own destiny. They’ll have another chance to impress the committee when they travel to Oxford, Miss., on Nov. 29 to play No. 8 ranked Mississippi. But they probably won’t play in the SEC Championship and could be leapfrogged by a team (such as Baylor or TCU from the Big 12) that runs the table.
The permutations can get intense. To forecast a team’s likelihood of making the playoff, you not only have to account for all plausible outcomes of upcoming football games but also how the set of humans who make up the selection committee might react to those different outcomes. We’re in the midst of investigating these questions and will have some results for you soon.
But we’ll start, in this article, with a simple cut of the data: What’s happened, historically, to the ranking of No. 1 teams like Mississippi State when they lose? Could Alabama, the new No. 1, remain in the top four if it loses one of its remaining games?
Because the playoff committee is new, we’ll be looking at the historical results from the Coaches Poll for guidance. (We figure the Coaches Poll might be a better proxy for the playoff committee than the AP poll since the committee leans heavily on athletic directors and former coaches.) Here are all the teams since 2002 to have lost a game while ranked No. 1 in the Coaches Poll:
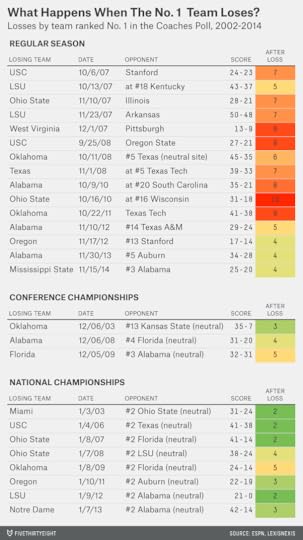
No. 1s that lost a regular-season game wound up anywhere from No. 4 to No. 10 after their defeats. That shouldn’t give much comfort to Alabama. Mississippi State’s case was unusual; most regular-season losses knock a No. 1 team out of the top four.
What accounts for the different outcomes? Well, it’s complicated. The humans voting in the polls are a little forgiving if the loss comes against another ranked opponent. (No. 1s that lost to a ranked opponent fell to No. 6 on average, versus No. 8 for those that lost to unranked teams.) The margin of defeat may matter some as well. The No. 1s that lost regular-season games by the largest margin — Alabama and Ohio State on consecutive weekends in 2010 — fell to No. 8 and No. 10, respectively.
Another factor is whether the year features a deep field of contenders. Part of Ohio State’s steep drop in 2010 may have been because there were an unusually high number of undefeated teams ranked just behind them at the time.
Human voters have historically been more forgiving of losses in the conference championship: No. 1s to lose there have fallen to only No. 4 on average. That could be good news for Alabama. Still, this is a small sample with just three examples. Furthermore, the playoff committee claims it will put a particular emphasis on conference championship results.
As I said, we’ll be making an effort to sort all this out. It will necessarily come with a lot of probabilities and approximations — this is the first year of the new system and we’re not expecting to identify hard-and-fast rules.
There is one rule, however, that has almost always been true. It’s a simple one: A team can’t gain ground by losing.
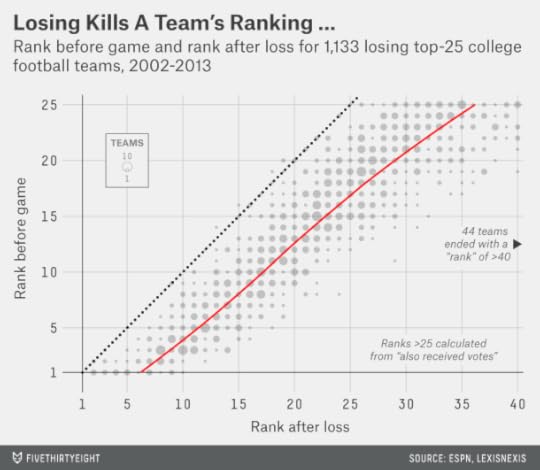
The chart, below, shows what happened to teams ranked throughout the top 25 in the Coaches Poll after they lost a game. (In the chart, read the vertical axis to find a team’s original ranking, then scan across to find the red line, which shows the team’s expected ranking after a loss. The dashed line represents what would happen if a team held its previous position.) Of the 1,133 ranked teams to lose since 2002, only 22 retained their original spot in the rankings. And even fewer — just five teams — improved their position in the poll.
This may not be a surprising result, but it tells us something about how human voters react to college football outcomes. As I mentioned, the evidence suggests that voters pay some attention to margin of victory. A definitive win might get a little more credit than a narrow one.
But what voters almost never do is reward a team because it loses by less than expected. Say, hypothetically, that No. 24 Gotham Tech travels to No. 3 Gotham State’s home stadium and loses on a last-minute field goal despite having been a 17-point underdog. Your esteem for Gotham Tech should probably improve: That’s a much better showing than you really had the right to expect. But a team’s standing in the polls has almost never improved after an outcome like this; the team has just been punished less. (In this respect, human voters seem to behave a lot like our version of NFL Elo ratings, which account for margin of victory but always prioritize a win over a loss by any margin.)
Nor do teams seem to be demoted after narrower-than-expected wins. Take the non-hypothetical case of the 1995 Texas A&M Aggies. On Oct. 14 of that year, they won by just 3 points at home against the SMU Mustangs, an awful team that would go 1-10 that year. If there were ever a time to punish a team for a bad win, this was it. But the Aggies held their position at No. 22 in the polls.
The next chart shows the data for ranked teams after wins since 2002. There are a few cases where a team lost ground in the Coaches Poll despite winning — but from what we can tell these were mostly cases where a team was leapfrogged by another that won in more impressive fashion. (That happened to Florida State earlier this year, for example.)

There are some other interesting characteristics in these charts. After a loss, teams fall more positions in the poll if they are ranked lower to begin with. While No. 1-ranked teams fall five spots, on average, after a loss, teams ranked No. 15 fall eight positions. This may reflect the fact that teams are more closely bunched together toward the bottom of the Top 25 than toward the top, which is what you’d expect if team skill levels abided by a normal distribution.
And a ranked team’s position falls more after a loss than it improves after a win. For example, when the No. 10 team wins a game, it improves only to No. 9, on average. But the same team falls to No. 17 after it loses.
This is mainly a reflection of the fact that ranked teams are expected to win. A successful college football season is mostly a matter of running the gauntlet and avoiding upsets. The playoff system gives teams more slack, but not much.

November 14, 2014
Here’s Proof Some Pollsters Are Putting A Thumb On The Scale
It’s time to stop worrying about outliers and start worrying about inliers. Earlier this year, my colleague Harry Enten documented evidence of pollster “herding” — the tendency of polling firms to produce results that closely match one another, especially toward the end of a campaign.1 What’s wrong with the polls agreeing with one another? The problem is that it’s sometimes a case of the blind leading the blind. Take a look at the polls conducted in this year’s Senate race in Iowa, for example:
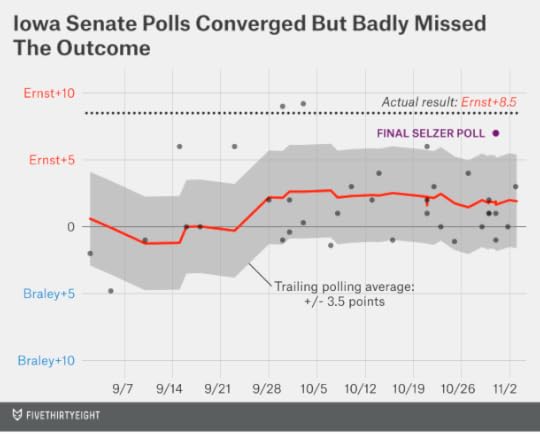
This chart depicts every likely voter poll conducted over the final nine weeks of the campaign and how each compared to the polling average at the time. (We’ll get into more detail about how this polling average is calculated later on.) In September, when many voters (and pollsters) were just tuning into the race, there was plenty of diversity in the Iowa polls. A Loras College poll completed on Sept. 5 put Democrat Bruce Braley ahead by almost 5 percentage points against Republican Joni Ernst. Just 10 days later, Quinnipiac University completed a poll showing Ernst up by 6 points instead. That would soon be followed by a Selzer & Company poll for the Des Moines Register that had Ernst ahead by the same 6-point margin.
By the end of the campaign, however, the polls were in much stronger agreement. Twelve of the final 13 surveys had the race at somewhere between a 1-point lead for Braley and a 4-point lead for Ernst — a tight consensus suggesting a narrow edge for the Republican. Even Quinnipiac had Iowa tied in its final poll. The lone exception was Selzer’s final poll for the Des Moines Register, which had Ernst up by 7 points — a result that pollster J. Ann Selzer would take an awful lot of grief about despite her stellar track record.
Better ignore that “outlier” poll from Selzer, right? Nope, not in this case. Ernst ended up winning by 8.5 percentage points. Most polls correctly identified Ernst as the winner, but Selzer’s poll was the only one in the final days to come close to her margin of victory.
It’s not the inaccuracy of the polling average that should bother you — Iowa was one of many states where the polls overestimated how well Democrats would do — so much as the consensus around such a wrong result. This consensus very likely reflects herding. In this case, pollsters herded toward the wrong number.
In the Iowa chart, the shaded gray area represents the polling average plus or minus 3.5 percentage points. You can see how a number of polls fell outside the shaded area in September but that only the Selzer poll did in the final week or two of the race.
The 3.5 point range is important because it reflects sampling error: the intrinsic, unavoidable uncertainty introduced by taking a random sample of voters rather than surveying the whole population. Specifically, it’s the standard error associated with a poll sampling 800 voters — the typical size of a Senate poll this year — in estimating the margin between the candidates. The standard error is not quite the same thing as the more familiar margin of error, but it gets at the same idea.2 Whereas the “true” result3 should fall within the margin of error 95 percent of the time, it should fall within the range established by the standard error about 68 percent of the time.
This necessarily implies that about 32 percent of results should fall outside the standard error.4 As I said, sampling error is unavoidable — an intrinsic part of polling. If you’ve collected enough polls and don’t find that at least 32 percent of them deviate from the polling average by 3.5 percentage points,5 it means something funny — like herding — is going on.
In fact, 32 percent is an optimistic estimate. It accounts for sampling error alone and not the other sources of uncertainty in polling. It’s hard to reach certain voters and hard to know who will turn out to vote, especially in midterm elections. News events can change the campaign after you’ve conducted your poll.
But sampling error alone produces considerably noisier polling than you might expect. The next table (click to expand) consists of a series of simulations where I’ve conducted “polls” by drawing random numbers from a normal probability distribution with a standard error of 3.5 percentage points. To make things more familiar, I’ve calibrated the numbers so they’re distributed around an average that matches how the Senate polling looked late this year. In Iowa, for instance, the average has Ernst ahead by 2 percentage points and the standard error of 3.5 points is distributed around that number.

People would have freaked out if some of these results were released in the end stages of this year’s campaign. Look at all those “outliers”:
One poll has Republican Cory Gardner up by 8 points in Colorado. Another one has Democrat Mark Udall ahead by 4!Republican Bill Cassidy leads by 9 points in one Louisiana poll. But Democrat Mary Landrieu is leading in another!Two polls have the Democrat Michelle Nunn ahead in Georgia. Another has Republican David Perdue up 12 points!Are these polls skewed? No. This is exactly what polls should look like under ideal conditions — when sampling error is the only thing they have to worry about. Under real-world conditions, where there are other sources of uncertainty, the polls should vary even more than this.
But by the end of the campaign this year, the polls in most states varied only within a narrow range. The next chart describes how much polls across all this year’s Senate races deviated from the polling average in their states at the time they were conducted.6 The polling average is calculated as follows: Each new poll is compared against other polls of the same state conducted somewhere between one day and 21 days beforehand.7 In calculating the average, I used a maximum of one poll (the most recent one) from each polling firm and didn’t compare a polling firm against itself.8
These averages should closely resemble those from sites like Real Clear Politics. Note that they are trailing averages — they don’t reflect any data from after the poll was conducted. I’m limiting the analysis to cases where there had been at least three other polls conducted in the previous 21 days, enough that we have a reasonable sense of where the consensus stood on the race.
There’s a lot going on in this chart, so let’s take a look and then talk about it.
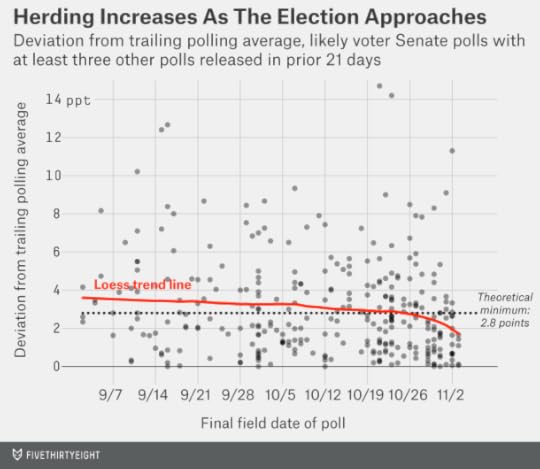
The gray circles represent the results of individual polls (about 300 of them). They show the absolute difference between the new poll and the polling average (without regard to whether the new poll was more Democratic- or Republican-leaning than the average).
The data is noisy. But the red trend line, which is based on loess regression,9 reflects how much polls were typically deviating from the polling averages. In early September, for example, the typical poll deviated from the polling average by about 3.5 percentage points.
As the election season wore on, new polls hewed somewhat more closely to the polling averages. But the change was marginal until the final week or two of the campaign, when they started to track it much more closely. By the eve of the election, new polls came within about 1.7 percentage points of the polling average.
Perhaps you could construct some rationale, apart from herding, for why the polls behaved this way. Maybe it became easier to predict who was going to vote and that made methodological differences between polling firms matter less. As a more technical matter, the volume of polling increased as the election approached; this presents some complications, which I address in the footnotes.10
But there are two dead giveaways that herding happened. One is the unusual shape of the curve. Rather than abiding by a linear progression, it suddenly veers toward zero in the final week or so of the campaign.
What happened during this period? It’s when pollsters were releasing their final polls of the campaign — the ones they think posterity will judge them by. These polls were included in the final Real Clear Politics averages and received a heavy weight in the final FiveThirtyEight forecast.
The impolite way to put it is that this was CYA (cover-your-ass) time for pollsters. Some that had produced “outlier” results before suddenly fell in line with the consensus.
The other giveaway is the one we discovered before in Iowa. By the end of the campaign, new polls diverged from the polling averages by less than they plausibly could if they were taking random samples and not tinkering with them.
As I mentioned before, an 800-person poll has a standard error of 3.5 percentage points because of sampling error alone. A related calculation is the average error introduced by sampling. As a rule of thumb, the average error is equal to about 80 percent of the standard error — or in this case, about 2.8 percentage points.
This is the theoretical limit on how accurate polls can be. Even if pollsters knew, for instance, that David Perdue would win by exactly 7.9 percentage points in Georgia (as he did), they’d still miss this result by 2.8 points on average when collecting 800-person samples.
In fact, however, the new polls deviated from the polling average by less than 2 points by the end of the campaign. How did that happen? To be clear, I’m not accusing any pollsters of faking results. But some of them were probably “putting their thumbs on the scale,” manipulating assumptions in their polls such that they more closely matched the consensus.11
In some cases, the pollsters’ intentions may have been earnest enough. Perhaps they ran a poll in Iowa and it came back Ernst +7. That can’t be right, they’d say to themselves. No one else has the race like that. So they’d dig into their crosstabs and find something “wrong.” Ahh — that’s the problem, not enough responses from Ames and Iowa City.12 Let’s apply some geographic weights. That comes out to … Ernst +3? We can live with that.
Even when the pollsters mean well, this attitude runs counter to the objective, scientific nature of polling. As a general principle, you should not change the methodology in the middle of an experiment.
A few pollsters are shameless about their herding. One of them is Public Policy Polling (PPP), a polling firm that conducts automated polls for both public consumption and for liberal and Democratic clients.
Take a look at this exchange, for example, between The New York Times’ Nate Cohn13 and PPP’s Tom Jensen. Cohn discovered that in 2012, the racial composition of PPP’s polls was correlated in an unusual way with President Obama’s performance among white voters in their surveys. If Obama was performing especially poorly among whites in one PPP poll, it tended to have a higher share of nonwhite voters, which boosted Obama’s result. And if Obama was doing relatively well among whites, PPP projected less nonwhite turnout, keeping his lead in check. As a result, PPP’s polls tended to show an unusually steady race between Obama and Mitt Romney.
I’m picking on PPP for a reason: They’re the biggest herders in the business. Here’s the chart I showed you before, but with only PPP’s polls highlighted. On average, in states with at least three other recent polls, their polls deviated from the polling average by only 1.6 percentage points. The evidence for herding is extremely clear visually and statistically.14
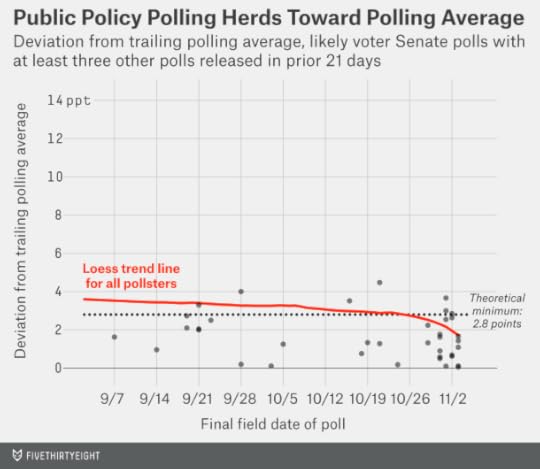
So perhaps Public Policy Polling sits at the opposite end of the spectrum from J. Ann Selzer. But herding may be hard to eradicate. The paradoxical-seeming reason is that herding can make the average poll more accurate even as it makes the polling average worse. (For economics nerds — this is sort of a tragedy of the commons problem.)
To demonstrate this, I created another simulation in which pollsters engaged in herding and compared it to one where they didn’t. The rules of the simulation are as follows:
A series of 10 polls are conducted in sequence (rather than simultaneously) in a state where the Democrat and Republican are tied in the race.15However, the pollsters don’t know the correct result ahead of time. Furthermore, their polls are subject to error. Specifically, their polls miss the correct result by an average of 5 percentage points. This figure corresponds to the historical average error among Senate polls conducted late in the campaign.In one version of the simulation, the pollsters behave independently, publishing their number “as is” regardless of what previous polls have said.In the other version, the pollsters herd. They do this by truncating the results they publish such that they never deviate by more than 3 percentage points from the average of previous polls. For instance, if after the first five polls are conducted the Democrat is ahead by 4 points in the polling average, the sixth pollster will never publish a result showing the Democrat ahead by more than 7 points or less than 1 point.16The next chart shows the accuracy of individual polls in the simulation. If the polls act independently, the error stays constant at an average of 5 percentage points for each survey. If they herd instead, the first poll still has a 5-point error (it derives no benefit from herding since there are not yet any other polls to herd toward) but every subsequent poll does a little better. By the time we get to the 10th poll, it misses the actual result by an average of about 3 points rather than 5.
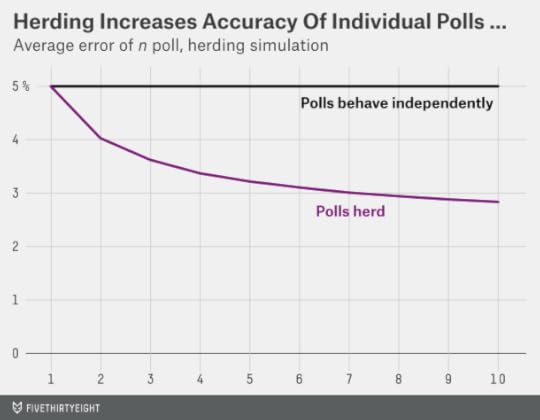
However, as I mentioned, what helps the polls individually hurts them collectively. The next chart shows the accuracy of the polling average as opposed to the average poll.
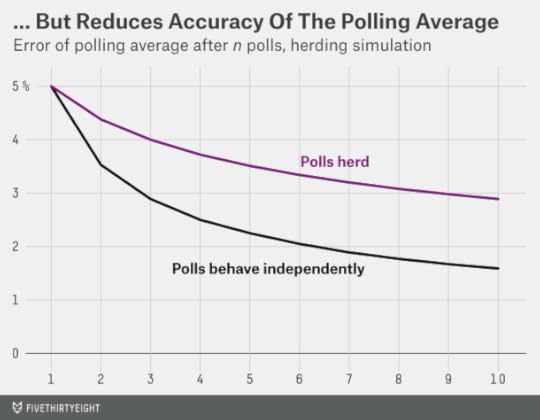
In both versions of the simulation, the polling average becomes more accurate as more polls are added to it. But the benefit is much greater when the polls are acting independently. In the independent case, the polling average has an error of just 1.6 percentage points by the time all 10 polls are included in it. If the polls herd, however, the polling average still misses by about 3 points even if all polls are included.
The problem is simple enough to diagnose: When pollsters herd, if the first couple of polls happen to get the outcome wrong, subsequent ones will replicate the mistake. I wonder if these dynamics explain the poor performance of the polls in some states this year. In Kansas, the final polls showed the independent candidate, Greg Orman, ahead in the Senate race by an average of 1 percentage point to 2 percentage points, but the Republican, Pat Roberts, won by 11 percentage points instead.
The first polls conducted of Kansas after the Democratic candidate dropped out of the race were from Public Policy Polling and showed Orman ahead by 10 points. PPP’s polls can be highly inaccurate when they don’t have other polls to herd toward. In this case, however, other pollsters may have herded toward PPP, producing an incorrect consensus about the race.17
This may also be part of why the polls have frequently proved to be “skewed” toward either Democrats or Republicans. In 2012, there was a significant bias toward Republicans and in 2014 a significant one toward Democrats.
This is not a new phenomenon — similar problems occurred in 1980, 1994, 1998 and 2002, among other election cycles. But 2012 and 2014 ought to disabuse us of the notion that the polls are sure to be more accurate just because there are more of them now than there once were. The whole benefit of the “wisdom of crowds” approach depends on people acting independently. A poll that regurgitates polling averages provides no independent information whatsoever.18
So … what to do about it? If you’ve read this far, you’re undoubtedly highly interested in polling. So my message for fellow polling geeks is as follows: Let’s not give pollsters so much grief the next time they publish what looks to be an “outlier.” Polling data is noisy and polling is becoming more challenging. The occasional or even not-so-occasional result that deviates from the consensus is sometimes a sign the pollster is doing good, honest work and trusting its data. It’s the inliers — the polls that always stay implausibly close to the consensus and always conform to the conventional wisdom about a race — that deserve more scrutiny instead.

November 12, 2014
Week 11 NFL Elo Ratings And Playoff Odds
Who’s the best team in the NFL?
The answer is as muddled as at any point in the season. According to our Elo ratings, the answer is technically the New England Patriots, who overtook the Denver Broncos after beating them in Week 9. But the Broncos gained ground by beating the Oakland Raiders on Sunday while the Patriots had a bye. Just one Elo point now separates the teams; they’re tied for all intents and purposes.
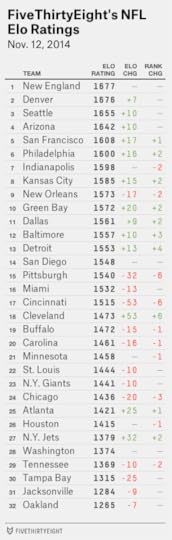
A case could also be made for the Arizona Cardinals, who have the NFL’s best record at 8-1. But the deeper we go, the less impressive the Cardinals look. Jeff Sagarin’s “pure points” rating, based on margin of victory and strength of schedule, has the Cardinals just eighth in the league. Football Outsiders’ Defense-adjusted Value Over Average (DVOA) ratings, based on an analysis of play-by-play data, has them 15th. The Cardinals’ top quarterback, Carson Palmer, is out for the year. Elo, which tends to strike a middle ground between conventional wisdom and advanced statistics, has the Cardinals fourth.
A credible case could also be made for the Seattle Seahawks on the basis of their longer-term performance. They came into the season ranked No. 1 and are the fourth-best team so far this year on the basis of DVOA. And they looked as good as they have since Week 1 while beating the New York Giants 38-17 last week. The Seahawks’ next six weeks consist of home-and-home games against the Cardinals and San Francisco 49ers, and road games at Kansas City and Philadelphia. Within a couple of weeks, we could be talking about how the Seahawks playoff hopes are torpedoed, or how Seattle was the best team in the league all along.
So far, however, this season has been characterized by the lack of any one truly dominant team. It’s also been characterized by a bunch of awful teams, such as the Raiders and Jacksonville Jaguars. The Raiders have a 31 percent chance of finishing at 0-16, according to our simulations. The Jaguars and the Raiders also have an outside shot at finishing with the lowest Elo rating of all-time.
If the elite teams aren’t as great as usual, and the worst teams are worse than usual, that means there are more wins (and Elo ratings points) to go around among the upper-middle class of the league. There is a glut of 12 teams at an Elo rating between 1532 and 1608 — somewhere between “slightly above average” and “pretty good.”
The Cincinnati Bengals, who lost at home Thursday against the Cleveland Browns, fell out of that group last week. These types of games — a clear underdog (the Bengals were 8.5-point favorites, according to Elo) winning definitively (the Browns won 24-3) — produce the biggest swings in the Elo ratings. In fact, the 53-point shift against the Bengals and toward the Browns is the largest of the season so far. (The largest swing of all time, 77 points, came Sept. 21, 2008, when the Miami Dolphins ended the Patriots’ 21-game regular-season winning streak by beating them 38-13 in Foxborough, Massachusetts.)
Even the result in Cincinnati, however, did nothing to clarify the playoff picture. The Browns, at 6-3, are first in the AFC North; the Bengals, 5-3-1, are second. Both have lower Elo ratings than the Baltimore Ravens and Pittsburgh Steelers, who are tied for third at 6-4. No AFC North team has better than a 31 percent chance or worse than a 20 percent chance of winning the division. Playoff odds for the rest of the league follow:
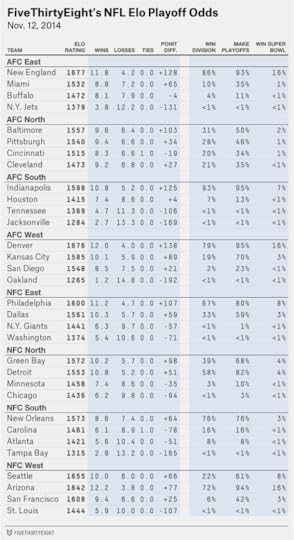
My ESPN colleague Gregg Easterbrook wrote this week about the inequities of the NFL playoff system. As Gregg noted, the 4-5 New Orleans Saints would make the playoffs if the season ended today (as NFC South champions). The 6-3 Green Bay Packers, meanwhile, would miss out.
One might protest that the Saints aren’t such a bad team: They have plenty of talent and a +26 point differential, and they’re 12th in the league in DVOA. Still, what division a team plays in makes a huge amount of difference to its playoff odds.
To demonstrate this, I extracted some additional data from our Elo simulations this week, estimating a team’s chances of winning its division based on its regular-season record. In the NFC North, for example, a roughly average division, teams finishing the season with 10 wins won the division 30 percent of the time.
The same 10-win finish would produce a drastically different result in other divisions. In the NFC West, 10 wins were good enough for the division title just 4 percent of the time. In the Saints’ NFC South, meanwhile, 10 wins took the division more than 99 percent of the time.
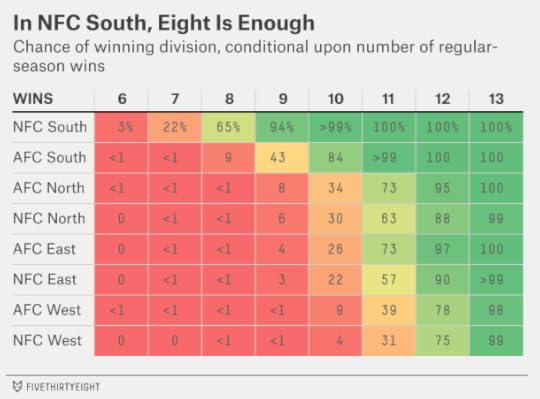
Even an eight-win finish would be good more often than not in the NFC South; teams finishing with that win total won the division 65 percent of the time. (This includes cases where the Carolina Panthers, who tied a game this year, finish at 8-7-1.) Seven wins might be enough. In one of the 5,000 simulations we ran this week, the Panthers even won the division with a 5-10-1 record.
If anything, this understates the importance of divisional placement. Not only are teams from weaker divisions more likely to make the playoffs with, for instance, a 9-7 record, they’ll also have an easier time achieving that record because they’re facing softer competition. And the NFL protects division winners in the playoffs, giving them a higher seed than wild cards and a home game in the opening round.
These problems will be hard to avoid so long as the NFL insists on having such small divisions and placing such importance upon them. In a four-team division, there’s a 1-in-16 chance that all four teams will be below average — one of them will make the playoffs anyway. Because there are eight divisions, a case like that will come up about once every other season.
This is one reason I’d like to see the NFL expand to 36 teams, which would allow for six-team divisions. Short of that, the league could adopt any number of approaches to make division placement less important. The least radical would be to no longer prioritize division winners in setting playoff seedings. (A 7-9 division winner could still make the playoffs, but it wouldn’t get a home game.) More fun: The league could “bump” any division winners that failed to finish with a winning record and replace them with an additional wild-card team.
Elo Point SpreadsRecord against point spread: 70-67-3 (6-5 in Week 10)
Straight-up record: 103-43-1 (9-4 in Week 10)
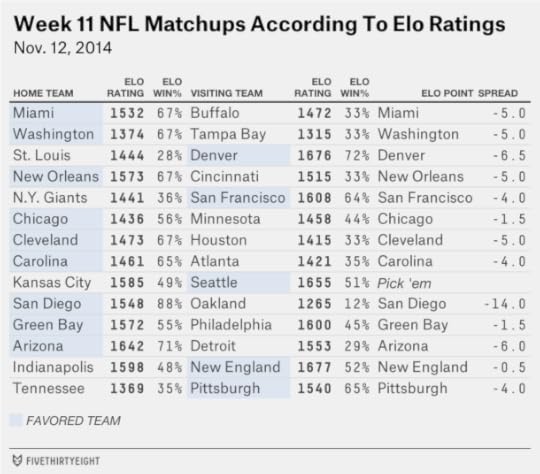
The point spreads implied by Elo ratings have just barely climbed to a winning record against closing Las Vegas lines. Still, we wouldn’t recommend that you bet on them. Indeed, as the season has worn on, there have been fewer and fewer differences between them, and most of those that exist are easy to explain. Elo is more bullish on the Cardinals and Philadelphia Eagles this week than Las Vegas lines imply, for example, but it doesn’t know that their starting quarterbacks are sidelined.
Still, there’s a difference of opinion in what’s undoubtedly the biggest game of the week. Whereas Vegas has the Indianapolis Colts as 2.5- or three-point favorites at home against the Patriots, Elo has the Patriots just slightly favored. New England has been one of Elo’s favorite teams this year. It’s strange to think Vegas could underrate a team as high-profile as New England, but that’s been the case historically: The Patriots have covered the point spread about 57 percent of the time since Bill Belichick took over as coach.

Nate Silver's Blog

- Nate Silver's profile
- 729 followers

