
Nate Silver's Blog, page 156
March 17, 2015
How We Made Our Forecasts For The Women’s NCAA Tournament
FiveThirtyEight has been publishing forecasts of the men’s NCAA basketball tournament since 2011, when we were at The New York Times. Every year, readers asked us why we weren’t forecasting the women’s tournament, too. Wait till next year, we always said. But we got a little tired of that. So this year, we have March Madness predictions for the women’s tournament for the first time.
The basic structure of the women’s forecasts is the same one we use for the guys:
The forecasts are based on a composite of computer power ratings, along with how the teams were ranked by the NCAA selection committee and their rank in preseason polls.The forecasts work by playing out the tournament one round at a time, computing the possibility of any one team beating any other team at any given location. (Location matters a lot in the women’s tournament since the top seeds usually host the first two rounds on their campuses.)The forecasts are probabilistic — although you might hardly notice this given how heavily some teams are favored. Connecticut is almost a 100 percent favorite in its opening-round game, for instance.However, there are several challenges unique to the women’s tournament. One is the comparative lack of data — a persistent problem when it comes to women’s sports:
Two of the five power ratings that we use for the men’s tournament aren’t available for women. Fortunately, that means three of them are: Jeff Sagarin’s “predictor” ratings, Joel Sokol’s LRMC ratings and Sonny Moore’s power ratings. We also use a fourth system, the Massey Ratings.1In the men’s model, we use thePut another way, it’s almost as though the top women’s teams (and particularly UConn) are playing in a whole different league. They’re huge positive outliers relative to the rest of the field. This is something we see more often in European contexts (like the Scottish Premiership, where either Celtic or Rangers have won the past 29 championships) than in American sports.
And even though those dominant teams don’t need any help, the NCAA gives them some. The first two rounds of the women’s tournament are played at campus sites; under the NCAA’s current rules, the top four seeds in each region get to host. So Connecticut is playing its first two games in Storrs, Connecticut, and Notre Dame its first two games in South Bend, Indiana, and so forth. The only exception is Louisville, the No. 3 seed in the Albany region, whose arena (the unfortunately named KFC Yum! Center) is occupied by the men’s tournament; No. 6 South Florida gets to host the first two rounds instead. Our model accounts for home-court advantage as part of its geographic adjustment. On average, it’s worth about 3.5 points — about the same as in the regular season4 — but it depends on how far the road team has to travel.
Add it all up, and UConn is a 74 percent favorite to win the women’s championship — a huge favorite


March 16, 2015
NCAA Men’s Tournament Forecast: The Parity Is Over
Check out FiveThirtyEight’s March Madness predictions.
Not long ago, in a galaxy not so far away from wherever Comcast placed truTV in your cable lineup, the era of the dominant men’s college basketball team was over. Last year, no team had more than a 15 percent chance of winning the NCAA men’s tournament, according to FiveThirtyEight’s pre-tournament forecast (Louisville was the best bet). In 2011, the nominal favorite was Duke, with a 22 percent chance. In 2012, it was Kentucky, at 27 percent, and in 2013, Louisville led with a 23 percent chance. While two of those favorites (Kentucky in 2012 and Louisville in 2013) happened to win, the lack of dominant teams left the door wide open for lower seeds to make a deep run, as No. 7 seed Connecticut did in winning last year’s national championship.
This year is much different — an echo from a bygone era of short-shorts and star players who actually played through their senior seasons. The Kentucky Wildcats are undefeated; they could become the first men’s team to finish the season undefeated since the 1976 Indiana Hoosiers. Kentucky has a 41 percent chance of winning it all, according to our forecast — about double what we’ve seen from front-runners in recent years.
There’s not a lot to critique in the Wildcats’ résumé. While the SEC is not a terrific basketball conference, Kentucky played a reasonable non-conference schedule and won 13 games against other NCAA tournament teams. The Wildcats rank first in all but one of the computer power ratings that the FiveThirtyEight model uses and a close second in the other. They were last year’s national runner-up and the preseason No. 1. They have all the talent in the world, including three possible NBA lottery picks.
But a 41 percent chance isn’t all that high. It remains more likely than not that Kentucky will stumble at some point along the way and won’t win the national championship.
What could go wrong? Some of it is the unforgiving mathematics of a 68-team tournament.
The Wildcats will be a favorite in every game they play for the rest of the year, but they’ll be playing some capable basketball teams. The odds of running into a streak shooter, or having a game in which they miss some free throws down the stretch, are fairly high.
Let’s get more specific. Below, I’ve tallied Kentucky’s chances of winning each round of the tournament, according to our model (the rightmost column). I’ve also listed the Wildcats’ chances of winning each round conditional on them having survived the previous round. So in the conditional column, we’re fast-forwarding the tournament and assuming that Kentucky wins at each stage. For instance, Kentucky has about an 85 percent chance of winning its Elite Eight game and advancing to the Final Four, provided that it’s made it that far.
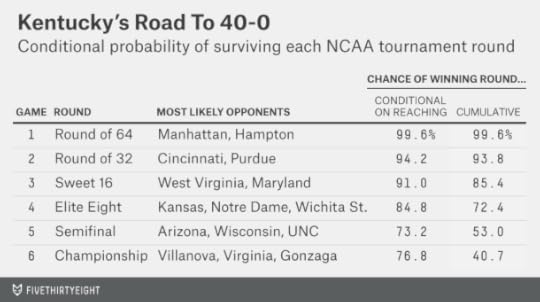
Kentucky is at least a 73 percent favorite in every round. It’s not in an especially tough region, and the team will be able to stay close to home, needing to travel no more than 282 miles from campus (the distance from Lexington, Kentucky, to Cleveland, Ohio, home of the Midwest regional) to win the tournament.
But even with the odds stacked in Kentucky’s favor, winning six consecutive games won’t be easy.
And there are some other excellent teams in this tournament. Suppose that because of some clerical error, Kentucky’s spot in the tournament instead went to Northern Kentucky, which went 13-17 in something called the Atlantic Sun Conference. In that case, the five teams with the next-best chances — Arizona, Duke, Villanova, Virginia and Wisconsin — would collectively have a 68 percent chance of winning the title. That’s better than the cumulative 54 percent chance that the top five teams had last year.
In other words, this would be a top-heavy tournament even without Kentucky. While there’s not a clear No. 2 after the Wildcats, the teams ranked from second through sixth or seventh nationally (in some order) are a strong group, a bit stronger than we’ve seen in the most recent men’s tournaments.
So let’s explore the field region by region. For each one, I’ve listed each team’s rating according to the seven ratings systems that the FiveThirtyEight model averages to generate its forecasts. The rankings from each system are normalized so as to make them directly comparable.
Five of the seven systems are computer rankings, and they tend to produce highly similar results. It will usually be more interesting to compare the computer rankings with the two human-generated polls: where a team ranked in the preseason (teams that overachieve during the regular season have a
While the Wildcats may not quite have even odds of winning the national championship, they are more likely than not (a 72 percent chance) to reach the Final Four.
Kentucky has a favorable draw, but some of that is by the committee’s design. The best No. 1 seed — Kentucky this year — is theoretically supposed to be paired with the worst No. 2, and the committee made good on that by placing Kansas in Kentucky’s region. While Kansas has an entirely respectable record for a No. 2 seed, it ranks behind the other No. 2 seeds (Virginia, Arizona and Gonzaga) by the metrics we track.
Kentucky also faces a relatively easy Sweet 16 game. Maryland and West Virginia, the No. 4 and 5 seeds in the Midwest, are both slightly overseeded, according to our model.
Dark horses in the Midwest include Wichita State and Texas, which are badly underseeded as No. 7 and No. 11, respectively. Even there, however, Kentucky catches something of a break. It can’t face either the Shockers or the Longhorns until the Elite Eight.
But while the draw is reasonably favorable for Kentucky, there’s one potential glitch. In the national semifinal, it will be due to face the winner of the West region. And the West is probably the strongest in the tournament this year:
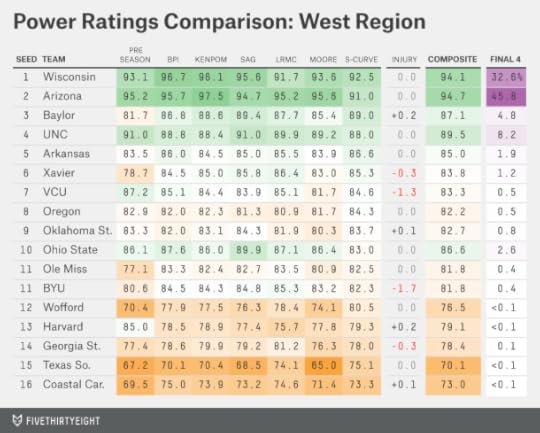
In fact, the top two seeds in the West — Wisconsin and Arizona — rank as the second and third best teams nationally, according to our composite ratings. The No. 2 seed, Arizona, actually rates slightly higher than Wisconsin; Arizona is also the only team ahead of Kentucky in any of the seven systems we track (Arizona rates slightly ahead of Kentucky in Sonny Moore’s power ratings.).
Still, these are marginal differences. (Arizona’s composite power rating is 94.7 while Wisconsin’s is 94.1, which means that Arizona would be favored by less than a point on a neutral court.) So why does the model give Arizona a considerably better chance — 46 percent against Wisconsin’s 33 percent — of reaching the Final Four? Some of it has to do with each team’s Sweet 16 matchup. Wisconsin’s prospective opponent (No. 4 seed North Carolina) rates as being stronger than Arizona’s (No. 3 seed Baylor). But the geography also works in Arizona’s favor; the regional final will be played in Los Angeles.
There’s not much depth in the West after the top four seeds. But one potential exception is the No. 10 seed, Ohio State, which is as strong as a typical No. 5 seed by the computer ratings even though Aaron Craft finally graduated.
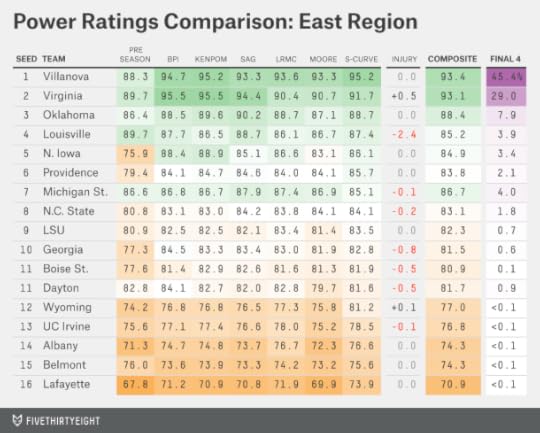
Villanova is the second-most-likely team to win the national championship. That’s a bit misleading; there’s a huge gap between Kentucky (41 percent) and Villanova (11 percent) and a tiny one between Villanova and the next-most-likely champions (Wisconsin and Arizona, at 10 percent each). Still, Villanova will benefit from being on the opposite side of the bracket from Kentucky, Wisconsin and Arizona. Villanova does have a tough No. 2 seed in the East region in the form of Virginia, but there aren’t a lot of easy outs among the No. 2 seeds this year.
Virginia wasn’t done any favors by the committee, by contrast. No. 7 Michigan State, which knocked the Hoos out of the tournament last year, looms as their Round of 32 matchup. Like last year, MSU seems to have been underseeded, even before considering Tom Izzo’s history of postseason overachievement. Full disclosure: I’m from East Lansing.
The East region also features an unusual circumstance: The University of Dayton will get to play on its home court in its “play-in” game against the other No. 11 seed, Boise State. This is part of why our model considers Dayton a 73 percent favorite in that game despite having only a slightly stronger power rating than the Broncos.
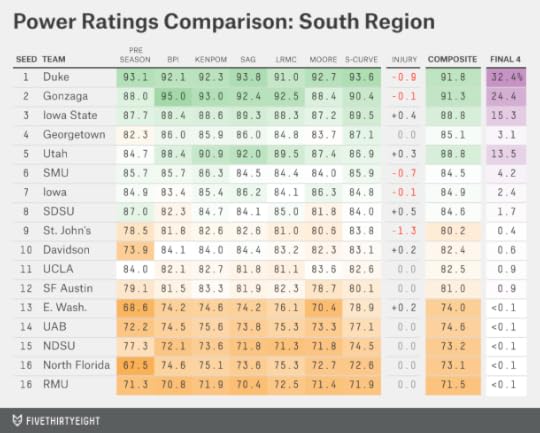
Last up is the South, the most wide-open region this year. Even as a member in good standing of the Christian Laettner Hate Club — we’re automatically enrolled in East Lansing — I don’t mean to disparage No. 1 seed Duke. One can question whether Duke deserved a No. 1 ahead of Arizona and Virginia, but that’s because the No. 2 seeds are really good this year. Duke would be a No. 1 without much question in most recent tournaments.
But the Blue Devils do potentially face a tough No. 2 of their own in Gonzaga. And they’ll have to win their Sweet 16 game to get there, where they may face No. 5 Utah, among the more underseeded teams in the tournament and a favorite against No. 4 Georgetown. The South also runs fairly deep: No. 8 San Diego State and No. 10 Davidson are tough outs, for instance.
What about the
March 15, 2015
How FiveThirtyEight’s March Madness Bracket Works
In contrast to the parity of the recent past, this year’s NCAA men’s basketball tournament has a clear frontrunner: the undefeated Kentucky Wildcats. FiveThirtyEight’s March Madness Predictions give the Wildcats a 41 percent chance to win it all and finish 40-0. Kentucky’s chances are well ahead of a group of teams — Villanova, Arizona and Wisconsin — that have about a 10 percent chance each.
I’ll have a longer take on the Wildcats and this year’s top-heavy bracket on Monday morning. But for now, we wanted to be sure you saw our numbers as soon as they were ready. You can find our interactive here, including the probability of each of the 68 teams invited to this year’s dance advancing to each round of the tournament.
The methodology behind our forecasts is largely the same as in past years. Our forecasts have done reasonably well — “calling” the winner of the tournament correctly in two out of the past three years. And they’ve been well-calibrated historically, meaning the teams we’ve listed as (for instance) 70 percent favorites have in fact won about 70 percent of the time. We don’t see a lot of reason to mess with our system.
At the core of the forecasts is a power rating for each team estimated from a composite of five computer-generated power rankings and two human rankings. By nature, our rankings are pretty conservative since they blend information from several different systems together.1 These are the five computer systems we use:
ESPN’s basketball percentage index (BPI). (Specifically, we use the variant of BPI called PVA, which translates team ratings into point spreads.)Ken Pomeroy’s pythagorean ratings.Jeff Sagarin’s “predictor” ratings.Joel Sokol’s LRMC ratings.Sonny Moore’s power ratings.The two human rankings are:
The selection committee’sWhile all of the Tar Heels’ ratings are pretty close, their worst one is from where the committee placed them on the S-Curve, 13th, suggesting that they were slightly underseeded. Their best rating comes from their preseason ranking, by contrast. We know it might seem unusual to blend preseason rankings with six other systems that rank a team’s current form, but there’s a
March 13, 2015
Virgin America Is The Michael Jordan Of Airlines
The Chicago Bulls won 88 percent of their games during the 1995-96 regular season, going 72-10 and claiming the best record in NBA history. Impressive, right? It’s hard to win that often in any field, let alone one with so much competition.
But there’s an airline that pretty much does exactly that. In 2014, Virgin America was faster than its competition on 87 percent of the routes they had in common.
This week, we rolled out our fastest flights interactive, which seeks to place airlines on a level playing field by looking at what routes each one flew. It’s easier to avoid delays while flying out of Honolulu instead of Chicago, for instance. A fair comparison between the airlines ought to account for this, as ours does.
In the interactive, the method of comparing airlines depends on regression analysis. While there’s nothing particularly complicated about regression, there are various ways it can go wrong. It’s almost always worth it to sanity-check a regression result by applying another (ideally simpler) method to the same data.
So here’s a simple and fun one: We’ll compare airlines head-to-head, as though they’re basketball teams. For instance, American Airlines and United Airlines both fly from Chicago O’Hare to Oklahoma City. American flew the route about nine minutes faster, on average, in 2014, accounting for delays, cancellations and diversions.1 So it gets a “win” on that route, while United takes a “loss.”
We can run this comparison for every competitive route in the country.2 American and United often do battle, for instance — both have hubs at O’Hare and in Los Angeles. Among the 230 routes3 they had in common, American compiled a 148-82 win-loss record.
Here are the standings for every airline matchup:

Some of the comparisons are incredibly lopsided. Alaska Airlines went 35-1 against Southwest Airlines. Virgin went 50-2 against United, 22-4 against American and 15-1 against JetBlue Airways, helping it to a 120-18 overall record. That was the best in the business: a Jordanesque 87 percent winning percentage.
That some airlines are so dominant against others suggests that there’s a lot of “signal” in this data set. After hundreds or thousands of flights on the same routes, luck — like happening to run into a thunderstorm when another airline doesn’t — doesn’t play a major role in on-time performance.
The head-to-head method still has some flaws. For instance, Frontier Airlines, which rates as about average by our regression method, has a stellar 144-47 win-loss record. But that’s partly because it has a lot of routes in common with United and Southwest, two of our more poorly rated airlines.4
But overall the head-to-head comparison backs up our regression results. Hawaiian Airlines ranked fifth out of 10 airlines in our regression, for example. Those results are partly based on the many routes it flies within Hawaii (like from Honolulu to Hilo), on which it has little competition. But Hawaiian faces plenty of competition on routes from Hawaii to the U.S. mainland, and it went 21-15 against other airlines. That’s a perfectly decent record, but not exactly the ’96 Bulls.
CORRECTION (March 13, 12:45 p.m.): A previous version of the chart in this article incorrectly listed Southwest’s record against Alaska Airlines and American Airlines. It also incorrectly listed US Airways as US Airlines.

March 11, 2015
A Better Way To Find The Best Flights And Avoid The Worst Airports
Get stuck at the airport last year? You weren’t alone. In 2014, the 6 million domestic flights the U.S. government tracked required an extra 80 million minutes to reach their destinations. At 80 passengers per flight, that works out to an extra 12,000 years in transit. Hope you brought a good book along.
Our new fastest flights interactive, which launched Wednesday, may help you spend more time at your destination and less at the Sbarro in Terminal D. It can tell you which airlines perform the best on which routes and which airports you should avoid if you can.
Our method operates on the same principle you do when you’re angry because your flight is late: It finds someone to blame.
Here’s one example: Your American Airlines flight from Chicago O’Hare (ORD) to Dallas (DFW) is hopelessly late. After a first look at the airline’s on-time data, you might blame American. Thirty-two percent of its flights were late,1 canceled or diverted on the ORD-DFW route in 2014, considerably higher than the 24 percent that airlines averaged across all routes last year.
But consider American’s main competitor at O’Hare, United Airlines. It was even worse; 40 percent of United’s flights from ORD to DFW were late, canceled or diverted. So should you blame American Airlines for that late flight? Or chalk it up to O’Hare, and count your blessings that you’re not flying United?
The government has one way of assigning blame. It asks airlines to report the reasons for their delays in five categories: security, weather, national aviation system, late arriving aircraft and carrier. You might think of the first three categories as “no-fault” delays (as in: no fault of the airlines), while the airlines deserve blame for the other two.
The problem is these categories are fuzzy. Did that aircraft arrive late because of a thunderstorm at the previous airport (presumably not the airline’s fault) or a mechanical problem (presumably so)? Some airlines are better than others at keeping their networks intact under challenging weather or air-traffic conditions.2 Plus, the causes are reported by the airlines.
We need a better way to measure airline performance, one that adjusts for the routes the airlines fly and doesn’t allow for any gaming of the data. Sure, it’s not easy to fly out of O’Hare, but is that enough to redeem United and American?
There are a few more problems to resolve before we take the step of apportioning blame between airports and airlines. This post about the methodology provides more detail on these, but I’ll cover them briefly here to explain how they affect our rankings.
Problem #1: Not all delays are equalThe majority of flights — 54 percent — arrived ahead of schedule in 2014. (The 80 million minutes figure I cited earlier is a net number: It consists of about 115 million minutes of delays minus 35 million minutes saved from early arrivals.) The government treats all those flights as “on time,” along with anything that arrives up to 14 minutes behind schedule. Anything after that counts as late.
But while a 15-minute delay is an annoyance, a two-hour delay is a scheduling disaster. And a cancellation or a diversion is even worse — equivalent to an average delay of four or five hours by our method (see the methodology post for how this is calculated).
Most of the 80 million minutes of delays every year come from flights like these.
Severely delayed, canceled and diverted flights represent less than 5 percent of flights but account for 75 percent or 80 percent of net delay minutes.
For the most part, airlines with a lot of short delays also experience more long delays and cancellations. But there are some exceptions. In the next chart, I’ve compared the share of an airline’s flights that landed between 15 and 119 minutes behind schedule against the proportion that were at least two hours late, canceled or diverted.
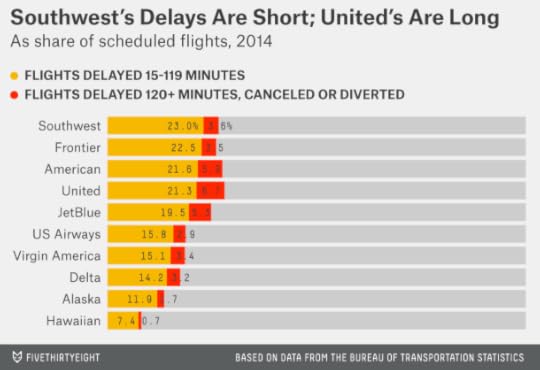
Frontier and Southwest have lots of short delays but only an average number of very long delays and cancellations. So they’ll come out looking a little better in our analysis, which is based on the average number of minutes lost or saved by the airlines, rather than an arbitrary cutoff at 15 minutes.
Problem #2: Many flights are flown by regional carriers — and regional carriers are slowDid you know you just flew from LaGuardia to Bangor, Maine, on Air Wisconsin? Probably not: You bought the ticket from US Airways, and the flight looked and felt like a US Airways flight. About half of U.S. domestic flights are like this — flown by regional carriers on behalf of major airlines.
Our method groups these regional flights together with the major airlines they’re flown for. Unfortunately, some regional carriers (including Air Wisconsin) are too small to meet the government’s reporting requirements. But we do have data for the largest three: Envoy Air, ExpressJet Airlines and SkyWest Airlines.
It’s worth going through this trouble because some of the most delayed flights are operated by regional carriers, especially when flown on behalf of United and American. Envoy flights have an average delay of 26 minutes relative to their scheduled times, for instance, as compared with 13 minutes on routes flown by American itself.
Problem #3: Airlines set their own schedules — and some pad themSome airlines schedule more time to complete the same journey. One can view this practice cynically. About 4 percent of flights arrive somewhere between 15 and 19 minutes late, just past the threshold for what the government considers an on-time arrival. If an airline added five minutes to its scheduled flight times, all of those “late” flights would suddenly be considered “on time.”3
How much effect does this have in practice? I’ve calculated which airlines pad their schedules the most and what effect this has on their on-time performance. The calculations are made by a regression analysis wherein I compare scheduled flight times against the distance and direction of travel and the airports that an airline flies into and out of. I’m being circumspect about describing the method since it will come into play again later, as you’ll see. But the basic idea is to account for how much time an airline adds or subtracts from its schedule relative to other airlines on the same routes.

Frontier operates the tightest schedules, subtracting about six minutes relative to other airlines on the same routes. United runs the slackest, adding about two minutes per flight.
That’s not a huge difference, but it has a noticeable effect on on-time performance. Relative to the schedule each airline publishes, United flies on time 72 percent of the time and Frontier 74 percent of the time by the government’s definition.4 If you standardize their schedules,5 Frontier’s on-time percentage would rise to 79 percent while United’s would fall to 70 percent.
From on-time percentage to fastest flightsSo what’s our solution? We don’t look at airlines’ scheduled flight times at all. Instead, we compare them against the distances they fly and adjust for the airports they fly into and out of.
First, we define something called target time, which is based on only the distance and direction of travel. The direction of travel matters because of the jet stream, which flows from west to east and therefore makes eastbound flights faster — usually somewhere between 45 minutes and an hour faster on a transcontinental route like LAX to JFK.
The more important thing: Target time is calibrated such that if flights hit their target, they’ll run exactly on time on average relative to airlines’ published schedules.6 But flights run late, on average: about 14 minutes late, relative to their published schedules. So likewise, they run 14 minutes late relative to target time. The question is whether to blame the airports or the airlines for these delays.
Here’s our approach — I hinted at it before. We run a regression analysis where the dependent variable is the difference between the actual time a flight took, including delays, and its target time. The independent variables are a series of dummy variables indicating the origin and destination airports and the airline that flew the route.7 This allows us to apportion blame for delays between the airports and the airlines. (We run the regression one month at a time, which allows us to remove potential effects due to the seasonal timing of flights.8)
By default, we blame the airports. As I mentioned, the average flight runs 14 minutes behind schedule, so we assign seven minutes of that to the origin airport and the other seven to the destination airport.
But some airports are much worse than others, of course. The chart below lists the time added on departure and arrival for the 30 largest U.S. airports:
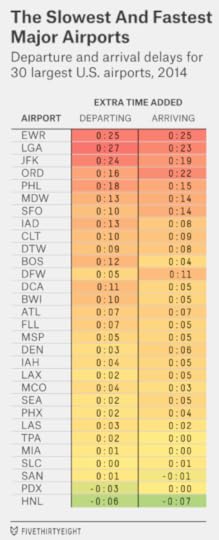
To the surprise of nobody worth her salt in salted peanuts, the three major New York airports and Chicago O’Hare contribute substantially to delays. Besides the New York trio, other large airports on the Eastern Seaboard, like Philadelphia (PHL) and Washington-Dulles (IAD), are pretty bad. Chicago-Midway (MDW) is a little better than O’Hare, but not much. West Coast airports are a lot better on the whole, although foggy San Francisco (SFO) is an exception.
On the flip side, a handful of airports are so efficient that they actually subtract minutes from target time.9 Honolulu (HNL) is the most prominent example among large airports.
We’re almost done. The last step in the calculation is what we call typical time, which is target time plus the delays associated with the origin and destination airports.
Take that flight from O’Hare to Dallas, for example. The target time on this route is 2:22. American flies it, on average, in 2:45, while United flies it in 2:53, both well above the target.
But O’Hare is a pretty awful airport to fly out of (it adds 16 minutes as an origin airport), and DFW isn’t a great one to fly into (it adds 11 minutes as a destination). That makes the typical time on the route 2:49 instead. American is four minutes faster than the typical time, and United is four minutes slower than it.
We perform this calculation for every route in our database; it yields a plus-minus statistic we call time added. In this case, negative numbers are good. For instance, American’s time added is -4 minutes on the ORD-DFW route. It’s not a particularly fast flight, but it’s saving you time relative to the typical (bad) conditions at O’Hare and DFW.
What happens when you aggregate the calculation over every route an airline flies?10 You get the results you see in the table below — what we think is the best overall measure of airlines’ on-time performance.
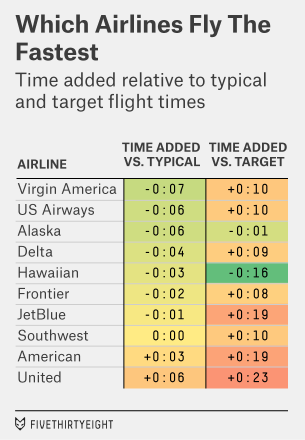
We’ve gone a long way toward reducing the differences between the airlines. For example, as compared to target times, Hawaiian Airlines is about 40 minutes faster than United on average. But when you account for the fact that it’s much easier to fly in Hawaii than out of some of United’s hubs — O’Hare, Newark, San Francisco — the difference is reduced to nine minutes.
Nonetheless, United and American rate as the slowest airlines, in that order. It may be that it’s a dumb idea to have a hub at O’Hare. Perhaps you can forgive them for flying late out of O’Hare itself — everyone does. But if your flight from Denver to Phoenix is late because the plane that was supposed to take you is still stuck at the hub in Chicago, you can’t make as many excuses for the airline. It could have put its hub at a more efficient airport.
Besides, other airlines do perfectly well despite flying year-round out of some really busy airports. US Airways and Delta rate well by our method. So does Virgin America, which flies almost exclusively out of busy, coastal airports. In 2014, Virgin subtracted seven minutes from the average flight, ranking it as the fastest airline in the U.S.
We’ll be tracking these rankings and how they change over time. JetBlue’s numbers improved over the course of the year, and it should move up in the rankings once its disastrous January 2014 rolls out of the sample. US Airways’ performance became somewhat worse as the year wore on, perhaps an early sign that its ongoing merger with American will slow it down. And Spirit Airlines will begin reporting its data to the government for the first time; it’s a good bet to finish somewhere near the bottom of the table, as it does in many customer-service categories.

How We Found The Fastest Flights
Our analysis of the fastest flights has two goals. First, it serves as a quick way to help you find the fastest airline on any particular route. Flying from Atlanta (ATL) to Houston (IAH)? The interactive tells you that Delta took an average of 2 hours and 22 minutes to complete the flight last year; United took 20 minutes longer.
The second goal is to find the best- and worst-performing airlines and airports. Our method apportions blame for delays between them: For instance, it recognizes that all carriers perform worse flying out of Chicago O’Hare (ORD) than flying out of Honolulu (HNL). Accounting for this helps us compare airlines on a level playing field — something the government’s on-time statistics do not do.
Creating that level playing field requires thinking about air travel a little differently. In particular, we’re concerned with which airlines are fastest relative to the distance they travel and the airports they fly into and out of, rather than as compared to the schedules they publish.
We’d encourage you to explore the interactive, and read our article about the fastest airports and airlines. What follows are a series of answers to questions you may have about our methodology.
What data are you using?
This data comes from the Bureau of Transportation Statistics (BTS), which publishes very large files each month that contain delay data on every flight flown by a major airline within the U.S. They cover about 500,000 flights per month, or about 6 million over the course of the past year. Our analysis of the fastest flights is based on the most recent 12 months of available data. As of the launch of the interactive, this covers the period from January to December 2014.11
What do you mean by “fastest” flights? I’m used to hearing about delayed or on-time flights.
Yeah, we know. So let me give you a proposition. Airline A says it will fly you from Seattle to Portland, Oregon, in 45 minutes, but actually takes 60 minutes. Airline B says it will fly the same route in 75 minutes, and actually takes 70 minutes. Which flight would you rather take?
That seems easy. Airline A!
I agree: Airline A saves you 10 minutes relative to Airline B. It’s the “faster” flight — the flight with the quickest average travel time, accounting for delays, cancellations and diversions.
But according to the way the government keeps track of delays, Airline A’s flight is “late” because it comes in at least 15 minutes after its scheduled arrival time. Airline B’s flight is “on time” (a few minutes early, in fact). That seems backward to us.
The problem is that airlines are responsible for setting their own schedules, and they often pad them. On average, United schedules about 8 minutes longer to fly the same routes as Frontier, for example.
We think it’s best to compare airlines against a neutral baseline and not one they set themselves. So that requires us to introduce some new language.
There are more terms I’m not familiar with. For instance, “target time,” “typical time” and “time added.” What does all of that mean?
Let’s define those terms with an example. Here’s how the four airlines that regularly fly from San Francisco (SFO) to Los Angeles (LAX) compared on that route in 2014:
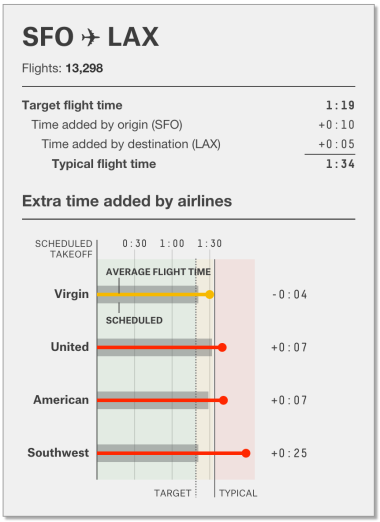
Average flight time is just what it sounds like: how long the airline took to complete the route, on average, over the past 12 months of available data. It includes a way of accounting for canceled and diverted flights in addition to delays (more about that later).
Target flight time is an estimate of how long the flight “should” take based on the distance and direction of travel. It assumes flights travel at about 500 mph, adds a buffer of about 45 minutes for taxi-in and taxi-out time, and adjusts for whether the flight is eastbound or westbound (eastbound flights fly faster because of the jet stream). Note that because target time is based on only the origin and destination airports, it’s the same for each airline on a particular route. On the flight from SFO to LAX, for instance, the target time is 1 hour, 19 minutes. (For a more precise description of how target time is calculated, see the footnotes.12)
But target time is based on somewhat ideal conditions — it assumes flights land exactly on time.13 In fact, the average flight lands about 14 minutes late, by our accounting. Some of this has to do with the airlines, but a lot of it also involves the airports.
That’s what typical time is about. It reflects the target time plus the typical delays associated with the origin and departure airports. Departing out of San Francisco adds 10 minutes to the typical flight. Arriving at LAX adds 5 minutes. So the typical time on this route is 1 hour, 34 minutes, or 15 minutes longer than the target time.
Our measure of an airline’s performance is whether its average flight time beats the typical time on a particular route. We call the difference time added. Negative scores are good — they mean the airline saves you time.
You forgot about “scheduled time.” What does that mean?
It means just what you think it means — how much time the airline scheduled for that route. But the airlines’ schedules aren’t a big point of emphasis in our method.
The SFO-LAX route provides a good illustration of why. Virgin America’s average time is almost half an hour faster than Southwest’s. But Southwest’s scheduled time is the same as Virgin’s and is lower than United’s and American’s, even though its average time is higher.14
So you’re giving credit to flights for arriving early?
As if that’s a bad thing? But I know the circumstance you’re worried about. Your flight lands 10 minutes ahead of schedule, only to sit on the tarmac for 30 minutes because there isn’t a gate open yet. You come out behind instead of ahead.
But the government still considers those 30 minutes on the tarmac part of the flight — it only counts an arrival when the plane gets to the gate. So do our estimates of average flight time. Travel time is measured from the originally scheduled departure time — the one listed on your ticket when you book the flight — until the plane pulls up at the gate at the destination airport.
OK, I got the terminology, but are these predictions of which flights will arrive soonest?
Not really. Our calculations are based on historical data over the past 12 months of performance. With that said, we’ve found airline performance to be fairly consistent from year to year and month to month.
I just flew a route yesterday, and I can’t find it in the interactive. What gives?
It could be a new route, or one that’s flown too infrequently; in the interactive, we only list routes if they had at least 100 scheduled flights over the past 12 months.
But the most likely explanation is that it was flown by a carrier that’s too small to meet the government’s reporting standards. BTS only requires an airline to report its on-time statistics if it accounts for at least 1 percent of domestic passenger revenues. Spirit Airlines met that threshold for the first time last year, for example, so it will begin reporting its data soon, but it didn’t in 2014. Sun Country Airlines still doesn’t account for 1 percent of passenger revenues so its data isn’t listed at all.
But I flew Delta! In fact, I flew the Delta Shuttle from New York to Washington, D.C. That’s one of the more famous routes in the country. It flies about a dozen times per day. And I still can’t find it.
Technically speaking, you didn’t fly Delta. You flew Shuttle America, which operates the flight on behalf of Delta.
That seems awfully confusing. It said Delta when I booked my ticket. I checked in at the Delta counter. The plane was painted in Delta colors.
We agree. If we had our druthers, this would be listed as a Delta flight in the government’s data. Unfortunately, it isn’t. In fact, it isn’t listed at all because Shuttle America is too small to meet the government’s reporting requirements.
About half the flights in the United States are flown on this basis: a regional carrier or a smaller subsidiary operating on behalf of a major airline.
But here’s the good news. Three regional carriers — Envoy Air, ExpressJet Airlines and SkyWest Airlines — are large enough to report their data. Together, they account for about 2 million flights each year. We’ve taken those flights and classified them under the major airlines on whose behalf they’re flown.
How do you assign flights flown by regional carriers to the major airlines?
For Envoy Air, this is simple. Envoy was formerly known as American Eagle and operates all its flights on behalf of American under its American Eagle brand. (In fact, Envoy is a subsidiary of American Airlines.) So all Envoy flights are treated as American flights.
ExpressJet and SkyWest, however, operate on behalf of several major airlines. Fortunately, we were able to infer which flights are flown for which airlines based on the flight numbers. (Our inferences are based on looking at published schedules and the routes flown. For instance, SkyWest operates its Denver to Little Rock, Arkansas, flight only on behalf of United.) You can find which flight numbers our program assigns to which airlines in the footnotes.15
I noticed that you’re still listing American Airlines and US Airways as separate airlines. Don’t you know that they’ve merged?
American Airlines and US Airways are, indeed, in the process of merging. But airline mergers are big, complicated things that can take several years to fully complete. For the time being, the government continues to list these airlines’ delay statistics separately and so we do, too.16 US Airways is one of our highest-ranked airlines while American is among the lowest, so it will be interesting so see which culture prevails.
How about Southwest Airlines and AirTran?
Their merger is complete. The government continued to list a few AirTran flights in 2014, but no longer does so. We classify all remaining AirTran flights as Southwest flights.
How do you compare canceled flights to delayed flights?
We’re glad you saved this question since it’s one of the more complicated ones.
A quick-and-dirty answer is that canceled flights are associated with a delay of four or five hours, on average. However, the calculation varies based on the particular circumstances of each flight. If your flight is canceled, the airline will usually put you on its next flight with an available seat. Our program simulates the process the passenger would have gone through at the time of the cancellation.
In particular, our method assumes it takes three additional flights17 to accommodate passengers from a canceled one (equivalent to a load factor of 75 percent).18 So the program looks for the next three available flights that were flown by the same airline on the same route and assigns the passengers from canceled flights to them.
“Available” is a key term because delays can accumulate. If all an airline’s Tuesday flights are full because they’re carrying passengers from a Monday morning cancellation, passengers from Monday afternoon’s flight will have to wait until Wednesday if their flight is canceled as well. Just like in the real world, it can sometimes take days to accommodate everyone.
So let’s say you originally planned to fly on Saturday, but your flight was canceled and you didn’t get out until Tuesday. Should that count as a 48-hour delay?
In my view, that assumption is too harsh. Instead, the added time associated with a cancellation is capped at four hours (240 minutes), plus whatever additional problems the passenger encounters on her new flight. (The reasoning behind this is explained in the footnotes.19)
For instance, say that the passenger’s original flight is canceled and there’s nothing available within the next four hours. She gets the maximum 240-minute penalty. But her replacement flight is also canceled (another 240-minute penalty). The third flight she’s assigned eventually takes off but arrives 90 minutes late. This counts as a 570-minute (240+240+90) delay. Cases like these are not uncommon since delays and cancellations can pile up.
Our program also assumes passengers will drive to their destination if it estimates driving to be faster than waiting out the cancellation and arriving on a new flight. It calculates driving times from Google Maps, adding a 10 percent penalty for traffic, plus a one-hour penalty for the passenger to arrange for the car. For instance, Google estimates the drive time from JFK Airport to Boston Logan Airport as 203 minutes (3:23) without traffic; accounting for traffic and the time to procure the car brings it up to 283 minutes (4:43). After a cancellation, the program compares this time against how long it expects the journey to take by air, accounting for the delay until the new flight20 plus the scheduled flying time of the new flight, plus a “fudge factor” of one hour to account for the possibility that the new flight will also be delayed or canceled.21
What about diverted flights?
A diverted flight is one that first lands at some airport other than its scheduled destination. Here are three examples drawn from my recent experiences:
A flight from New York to Los Angeles encounters significant headwinds, so the pilot is diverted to Las Vegas to refuel before continuing on to LAX. The refueling stop is planned well in advance and is more or less directly en route. It doesn’t add much time to the journey.A flight from Miami to New York tries to land at LaGuardia in a thunderstorm, then aborts the landing because of strong winds, eventually landing in Boston instead. After sitting on the ground for an hour or two, it takes off for LaGuardia again, this time landing successfully.A flight from Charlotte to New York gets most of the way to LaGuardia when the New York airport imposes a ground stop because of wintry conditions. The plane turns back around and lands in Charlotte. Passengers are told the flight has been canceled and they must find a new one.Most diverted flights eventually land at their scheduled destinations, as in the first two examples. In these cases, calculating the travel time is straightforward. We just compare the actual arrival time at the final destination against the scheduled one, as in the case of a delay. On average, these flights take an extra 3 hours, 15 minutes to reach their destinations, according to the BTS data.
But about 20 percent of diverted flights never reach their scheduled destinations, as in the Charlotte example. This is often even worse than a cancellation since you’ve already spent a lot of time in transit but still need to make a new plan to get to where you’re going. When this happens, our program assumes passengers would either have completed the journey to the original destination by car, or driven back to the origin airport and caught a new flight, whichever was faster.22
This yields some massive delay times: on average, almost nine hours. Fortunately, these cases are rare — only 1 in every 2,500 flights winds up in this category — so how our model treats them matters little to the bottom line.
I have another question!
Great — just shoot us a note or leave a comment. We’ll be updating this FAQ and the interactive periodically.

March 9, 2015
Please Welcome David Firestone, FiveThirtyEight’s New Managing Editor
FiveThirtyEight is approaching one year of publication since we relaunched the site. We’ve learned a great deal, including that it’s usually best to let the quality of our work speak for itself. But we have some exciting news to share.
David Firestone, a 21-year veteran of The New York Times, will be joining us later this month as FiveThirtyEight’s managing editor. David has been a reporter and editor, covering the American South, Congress, the disputed election of 2000, New York City Hall and numerous political campaigns. As deputy editor on the national and metro desks at the Times, he oversaw investigations into Medicaid fraud and the Big Branch mine disaster. He led the national desk’s coverage of the Great Recession, Hurricane Katrina and the rebuilding of New Orleans. Most recently, he was a member of the newspaper’s editorial board, and served as the board’s projects editor.
David received glowing testimonials from his former colleagues at the Times. In some cases, his skills complement our mission — David has been instrumental in making the Times’ newsroom more data-driven, for instance. In others, his experience will help in areas where we’re trying to improve: marshaling resources for high-impact projects, combining statistical analysis with other types of reporting, and creating a sense of mission around the news each day.
He joins us at a key moment in FiveThirtyEight’s life cycle. There were many times during the first year when our execution didn’t match the ambitions we had for FiveThirtyEight. But we’ve started to close that gap. We’re launching longform interactives like this one, releasing documentary films like this one, combining number-crunching with on-the-ground reporting in places like Ferguson, Missouri, and having a lot more fun. Traffic is up: Unique monthly visitors have roughly doubled from 2.8 million in our first two full months of publication (April and May 2014) to 5.1 million in the two most recent ones.1
We’re growing our team and will have some additional hires to announce soon. We’ll also be rolling out a series of partnerships and special projects as we get ready for 2016. We have a lot of work ahead of us. David’s the right person to lead us forward and we’re thrilled to have him on board.

We’re Forecasting The 2015 U.K. General Election
Welcome to FiveThirtyEight’s U.K. election coverage. It’s 59 days until the vote on May 7 and we’re just a few short weeks away from the start of the short campaign. We thought we’d take a moment to explain how we’ll be covering the election and why.
Mona: So Nate, aside from the fact that I’ve obviously convinced you that all British people are fascinating, why do you want to cover the U.K. election?
Nate: Well Mona, as we’ve discussed, it’s a fun election to think about from a forecasting standpoint. But also: It’s the bloody United Kingdom! Sixth-largest economy in the world!
March 6, 2015
Which Flight Will Get You There Fastest?
Related story: A Better Way To Find The Best Flights And Avoid The Worst Airports
Nate Silver Talks With Sheryl Sandberg
I interviewed Facebook Chief Operating Officer Sheryl Sandberg on Tuesday about her new campaign #LeanInTogether, which emphasizes men’s role in improving gender equality. We also spoke about a range of topics: from whether “nerd” usually means “dude” to Facebook’s role in directing Internet traffic in the era of that color-shifting dress.
Watch here:

Nate Silver's Blog

- Nate Silver's profile
- 729 followers

