
Nate Silver's Blog, page 155
April 10, 2015
How Far Is Tiger Woods Behind Jack Nicklaus’s Major-Winning Pace?
When Tiger Woods teed off Thursday afternoon to begin this year’s Masters bid, it was the start of just his third appearance of the 2015 season and his first competitive round since a back injury forced him to withdraw on the first day of the Farmers Insurance Open in early February. As Woods shot a 1-over-par 73 in the first round, all eyes were on his form — even though he’s done little of note over the past two seasons to warrant the attention.
Famously, Woods has won 14 major golf championships over his stellar career, a tally that ranks second only to Jack Nicklaus’s 18 major titles. A win at the Masters would give Woods 15, but he hasn’t won a major since the 2008 U.S. Open. In the intervening years, his game and personal life have been thoroughly ravaged, with injuries taking a particular toll recently. What once seemed to be destiny — Woods’s overtaking of Nicklaus as the winningest major champion ever — now looks like a fool’s notion.
With Woods in action again at Augusta, where he’s won four green jackets, we tried to track how far his major championship-winning pace (and therefore his chances of catching Nicklaus) have fallen in recent years. The biggest strike against Woods? The fact that he is 39 years old — well past the prime of major winners since the PGA Championship switched to stroke play in 1958:
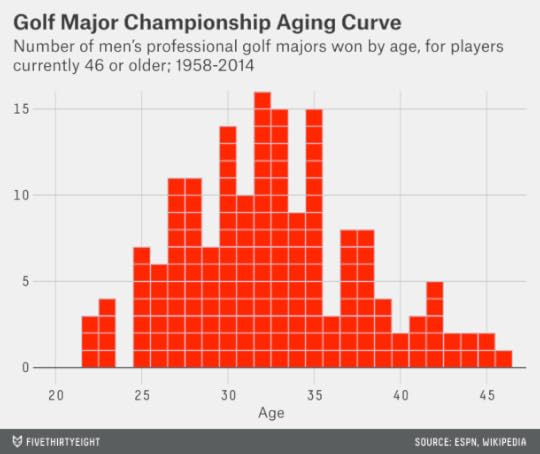
If you toss out all major winners currently younger than 468 to prevent the sample from being skewed toward younger, still-active champions such as 25-year-old Rory McIlroy (whose future major totals are as yet unknown), the average major-winner in golf is about 32.5 years old. And only 12.5 percent of all major titles since 19589 were won by players aged 39 or older. By any measure, the time for winning majors is quickly running out for Woods.
Of course, Woods’s track record is better than just about any other major-winner ever. Through age 32, when Woods last won a major, he led Nicklaus 14-11 in the trophy count. (Even now, after a drought of more than six seasons, Woods is only one major short of Nicklaus’s pace at the same age.) To estimate how many major wins remain in a player’s career, we ran a Lowess regression for players at each age who had won at least one major to that point in their career.10 And by that method, Woods’s mean expectation was to pass Nicklaus for most of his career after his banner 2000 season — even after being afflicted by injury (he missed the second half of the 2008 season with a torn ACL) and scandal (he was limited to 12 tournaments and zero wins in 2010 after his many infidelities came to light):
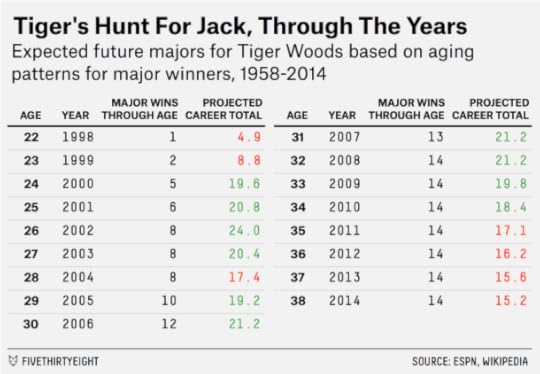
Since a major-less 2011, though, Woods’s projected career major tally dropped below the number necessary to pass Nicklaus. Our system now sets Woods’s expected remaining majors at a mere 1.2 — and that might be too high. The regression uses Woods’s entire track record to date, perhaps not realizing how much his form has slipped in recent seasons. It’s also worth noting that Nicklaus was an incredible outlier. He won more majors after the age of 37 (four) than all but 14 golfers have ever won in their entire careers. So at a certain point, it was probably unrealistic to have expected Woods to follow the same pace, even before witnessing how much his game — and health — have slipped in recent years.
Woods front-loaded so many major titles that he’d only need a comparatively modest per-tournament win rate over the remainder of his career to pass Nicklaus. But even given that head start, Woods’s abrupt decline goes to show that there are no sure things in sports.


April 9, 2015
There Are Few Libertarians. But Many Americans Have Libertarian Views.
The New York Times’ Paul Krugman, assessing the presidential candidacy of Rand Paul, asserts that there aren’t very many libertarians in the United States. Most Americans, Krugman says, take clearly “liberal” or “conservative” positions on both economic and social issues. Here’s the graphic Krugman drew to represent his claim:

It’s correct to say that few Americans identify as libertarian. Only 11 percent said the term “libertarian” describes them well, according to a 2014 Pew Research poll.
Nor do very many Americans self-identify as socially liberal but economically conservative. Just 3 percent did so in a 2012 Gallup poll, in fact. Even fewer Americans — just 1 percent — fall into the category Krugman calls “hardhats,” that is, people who are socially conservative but economically liberal.
But how people label themselves is one thing. Americans sometimes leave a different impression when polled about specific issues. Often, their views are reasonably heterodox and not well represented by a one-dimensional political spectrum.
Take two issues that are taken as emblematic of the split between liberal and conservative viewpoints: gay marriage and income inequality. If Krugman is right, you should see few Americans who are in favor of same-sex marriage but oppose government efforts to reduce income inequality, or vice versa.
As it turns out, however, there are quite a number of them; about 4 in 10 Americans have “inconsistent” views on these issues. The General Social Survey asks Americans whether they favor or oppose gay marriage. It also asks them to rate, on a 7-point scale, whether the government ought to reduce income differences through higher taxes on the rich and income assistance to the poor.11 Here’s how Americans’ responses lined up in the poll in 2010 and 2012:
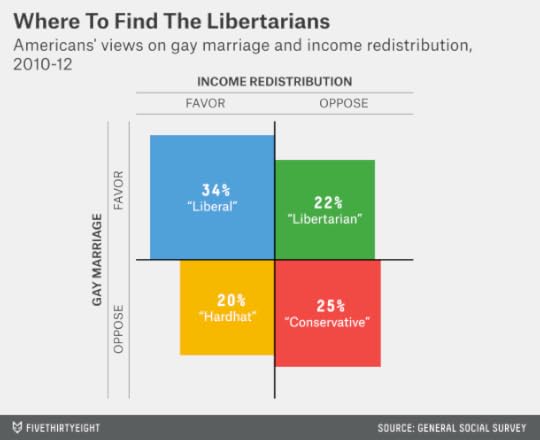
The most popular position (34 percent) is to favor both gay marriage and income redistribution. But 22 percent of Americans are in favor of gay marriage and opposed to government efforts to redistribute income. Another 20 percent are opposed to gay marriage, but favor income redistribution. There’s some relationship in the responses to these issues — but not much. They’re far closer to being randomly distributed (25 percent of voters in each quadrant) than perfectly correlated. (I’ve thrown out responses that were neutral on one or both issues so we get a two-by-two matrix that matches Krugman’s.)
So does that mean Paul has running room after all? No — we’re not that optimistic about his chances here at FiveThirtyEight. Part of that is because the hard-core partisans who vote in presidential primaries are much more likely to take consistently liberal or conservative positions than the broader American population, as Krugman’s colleague Nate Cohn points out.
And the parties themselves — who have disproportionate influence in the primaries — have highly partisan views by definition. Almost all voting in the U.S. Congress, on social issues and economic issues alike, can be reduced to a single, left-right dimension.
Does this make any sense? Why should views on (for example) gay marriage, taxation, and U.S. policy toward Iran have much of anything to do with one another?12 The answer is that it suits the Democratic Party and Republican Party’s mutual best interest to articulate clear and opposing positions on these issues and to present their platforms as being intellectually coherent. The two-party system can come under threat (as it potentially now is in the United Kingdom) when views on important issues cut across party lines.
That’s bad news for candidates like Rand Paul. Nonetheless, the rigidly partisan views of political elites should not be mistaken for the relatively malleable and diverse ones that American voters hold.

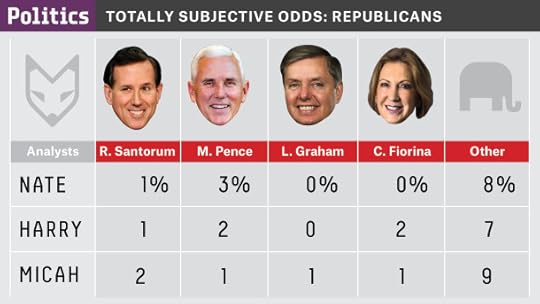
Watch: Totally Subjective Presidential Odds — NY1 Edition
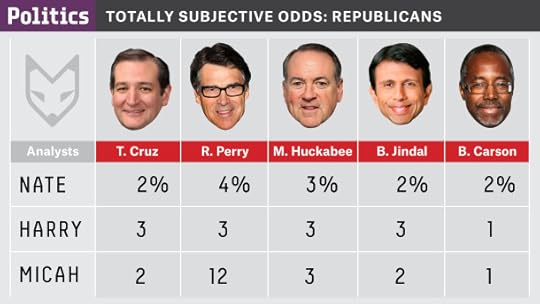
Throughout the (very) early campaign season, we’ve been doing occasional podcasts discussing our “totally subjective odds” — where our analysts get together and riff on the little data we have to handicap the 2016 presidential nominations from each party.
Recently, NY1’s “Inside City Hall” invited the subjective odds team on to the program. Below, find our latest odds, some highlights, and a link to Nate Silver, Harry Enten and Micah Cohen talking with NY1 host Errol Louis.

Why Rand Paul Entered Now
Harry Enten: “You saw with Ted Cruz that when he announced he rose up [in the polls]. You want to keep your name in the discussion, you want donors to believe you have a chance of winning, you want elected politicians to believe you have a chance of winning. With Rand Paul falling, perhaps he felt he needed to get in at this point.”
What Really Matters This Early
Micah Cohen: “The big one is endorsements. Support from the party establishment matters a ton in what we would call the ‘invisible primary’ — before votes are even counted. Christie doesn’t have much of it. He’s not exactly beloved within the GOP establishment.”
Can Huckabee Make a Move in Iowa?
Harry Enten: “Winning Iowa is nice — it’s pleasant — but more often than not, the Republican who ends up winning Iowa doesn’t end up winning the nomination. You run into a wall in New Hampshire, which is pretty much at the opposite end of the spectrum from Iowa in terms of religiosity. So Huckabee could win in Iowa, but when you look at the party apparatus, those party actors who are so important, they are going to stop Huckabee, for any number of reasons.”
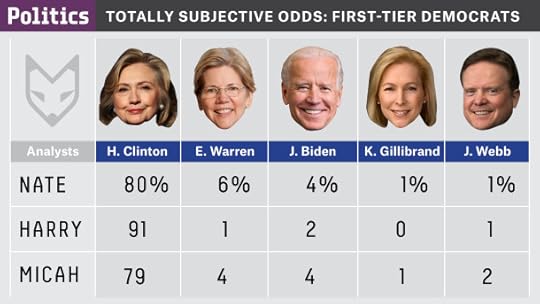
The Scenario in Which Hillary Clinton Isn’t the Nominee
Nate Silver: “If [Clinton] had a vetting issue, a health issue, got sick of it halfway through … it’d be a very different race, and Elizabeth Warren’s one of the only candidates who has a lot of enthusiasm and could raise a lot of money pretty quickly. But I don’t think Elizabeth Warren is going to run and catch Hillary from behind. It’s not an Obama [2008] scenario.”

Watch the full segment by clicking below:

April 5, 2015
Coach Cal Blew It
Even 38-0 teams can go through mistimed offensive slumps, and the Kentucky Wildcats went through one at a very bad time Saturday night. Kentucky went more than 5 minutes without scoring in its loss to Wisconsin on Saturday. Between Karl-Anthony Towns’ jumper with 6:37 to go in the second half, and Aaron Harrison’s layup with 56 seconds remaining, Kentucky was stuck on 60 points, while Wisconsin swung from being 4 points behind to 4 points ahead.
A lot of credit must go to Wisconsin’s stout defense, which looked a lot better than its Pomeroy rating (just 55th best in the country). But the Wildcats didn’t help themselves Saturday night with three shot clock violations down the stretch. Those violations were symptomatic of a larger problem: Kentucky’s torpid pace down the stretch helped doom them.
This will involve more math than the usual “hot take,” so hang tight while we take a tour of probabilities. We’re most interested in one big question: Did Kentucky increase its chance to win by slowing its pace, thereby giving each team fewer possessions?
At first blush, it seems like Kentucky was better off slowing the game down.
The Las Vegas point spread and over-under line projected a final score of roughly Kentucky 67, Wisconsin 62 before the game. (FiveThirtyEight’s model had a similar projection, favoring Kentucky by 4.5 points.) In a game of 60 possessions per team, that translates into 1.12 points per possession for Kentucky and 1.04 per possession for Wisconsin.
I simulated the final six minutes of the game 100,000 times using these offensive efficiency figures and a few guesstimations.1 Up by 4 in a game with 12 more possessions per team2 Kentucky won 81.9 percent of the time. That winning percentage increased to 83.3 percent in a game with 10 possessions per team instead.3
So at a first glance, slowing the game down seems like a good idea for Kentucky — they were ahead, after all.
But there are reasons not to do it. Kentucky is the slightly better team — or at least that’s what Vegas and the FiveThirtyEight model thought before the game — and in the abstract the better team should want to play a longer game (a game with more possessions). Under our assumptions, if Kentucky and Wisconsin played an infinitely long game, Kentucky would always win. So it was slightly unusual for Kentucky, a Goliath of a basketball team, to adopt a “David strategy” instead.
This alone wasn’t enough to make Calpari’s strategy a poor one, however. Even though Wisconsin was the underdog, the difference was small enough that you’d still rather give them fewer chances to catch up, according to the simulations.
But Kentucky also almost certainly made its offense less efficient by slowing the pace down. Rather than looking for good shooting opportunities in the first half of the shot clock, it tried to rush shots near the end of possessions. (Wisconsin’s defense, to reiterate, had something to do with that. But Kentucky hadn’t had much trouble finding shots earlier in the game, shooting 60 percent in the first half.)
Exactly how much less efficient is hard to say, but efficiency declines significantly as the shot clock runs down to zero. NBA teams score about 1.12 points per possession when they shoot in the first 10 seconds of the league’s 24-second shot clock, but that efficiency declines to 0.92 points per possession in the final four seconds of a possession. These numbers aren’t perfect for any number of reasons — not least because they’re drawn from the NBA rather than college hoops — but they give us at least some sense for the magnitude of the effect.
So that got me wondering how much Kentucky’s offensive efficiency would have to decline to render Calipari’s strategy counterproductive. The answer: Not much at all.
In the table below, I’ve used the simulation model to estimate Kentucky’s chances of winning with reduced offensive efficiency. For example, a 10 percent reduction in offensive efficiency — meaning that the Wildcats are scoring at a rate of about 1.01 points per possession instead of 1.12 — would reduce their win probability to 76.8 percent in a game with 10 more possessions per team. That’s considerably worse than the 81.9 percent chance they had by playing regular basketball, but permitting 12 possessions per team. Even a 3 percent reduction in offensive efficiency would reduce Kentucky’s winning chances.

There are a lot of other factors to consider in the real world, of course, like how Wisconsin might have altered its strategy in response to Kentucky. Still, Kentucky seemed to be playing into Wisconsin’s hands, especially given that the Badgers are terrific in half-court sets — but much worse than Kentucky in transition — and ordinarily prefer to play at one of the slowest paces in college basketball. Wisconsin might have found a way to win anyway — they’re a terrific team, and the game wasn’t all that much of an upset. But Coach Cal made their path to the National Championship a little easier.
Podcast from Indy: The Kentucky Loss and Monday Night’s Matchup
Subscribe to Hot Takedown on iTunes here.

Hot Takedown: An Emergency Discussion About Kentucky’s Loss, Live From Our Hotel Room
Welcome to an emergency edition of Hot Takedown, our podcast where, usually, the hot sports takes of the week meet the numbers that prove them right or tear them down. This episode, though, is different. A few FiveThirtyEighters were in Indianapolis to see Wisconsin beat Kentucky live from inside Lucas Oil stadium last night. We were so thrilled by the game that we had to gather in Jody’s hotel room to talk about it; and Nate Silver was so disappointed with John Calipari he had to get some coaching tips off his chest.
Stream the episode by clicking play above, or subscribe using one of the podcast clients below.
Listen: iTunes | Stitcher | Soundcloud | ESPN PodCenter | RSSLinks to a couple things we discuss in this episode are below. We’ll be back with another Hot Takedown with our usual crew — Neil, Kate, Allison and Chad — on Tuesday.
Benjamin Morris found the moment Kentucky came closest to an undefeated season, and the moment it all fell apart.Ken Pomeroy’s ratings for the final two teams.FiveThirtyEight’s continually updated March Madness predictions.If you’re a fan of our podcasts, be sure to subscribe on iTunes and leave a rating/review. That helps spread the word to other listeners. And get in touch by email, on Twitter or in the comments. Tell us what you think, send us hot takes to discuss, and tell us why we’re wrong.

April 2, 2015
A Radical Proposal To Destroy The NHL’s Loser Point
The NHL’s “loser point” is the stupidest rule in sports. For the non-puckheads among you, here’s how it works: The NHL awards one point in the standings to a team that loses a game in overtime or a shootout. But teams get two points for winning a game, whether in regulation or beyond. You don’t need a degree in #fancystats to recognize the problem: There are a total of three points to distribute when a game goes to overtime but just two otherwise. So it really pays off to play for OT. As FiveThirtyEight contributors Noah Davis and Michael Lopez documented Wednesday, this encourages dull, passive hockey. Goal scoring falls dramatically in the third period of tied games, right when a game should be coming to its climax.
This is more than a minor annoyance; the loser point has already changed the identity of at least one NHL champion. In 2012, the Los Angeles Kings finished with 40 wins and 42 losses; they made the playoffs ahead of the 42-40 Dallas Stars because they accumulated 15 loser points to the Stars’ five. Then the Kings went on to win the Stanley Cup.
Fortunately, having a rule as dumb as the loser point means that almost anything would be an improvement. For instance, the NHL could award three points for a win in regulation. An overtime or shootout winner would still get two points. That would at least make each game worth the same amount in the standings.
Or you could eliminate the shootout and go back to having ties. The NHL claims that 70 percent to 80 percent of its fans like the shootout but has never made any detailed data on this available to the public. As regular readers of FiveThirtyEight will know, there are lots of ways to manipulate survey questions to produce a desired outcome. Maybe the same consultants telling Donald Trump that he’d make a great presidential candidate are advising Gary Bettman on the loser point.
But I have something more radical in mind. Here’s the idea: You keep playing hockey until someone wins. You know, like in the NBA and Major League Baseball and pretty much every other sport but soccer — and like the NHL itself during the playoffs.
The usual objection is that this could lead to some extraordinarily long games for two measly points in the standings. What if the Flyers and Penguins play a five-overtime game and the Penguins need to catch a flight to Calgary? Why add even more ice time to a grueling, 82-game regular season?
But these cases are rarer than you might think. If you played every NHL regular-season game under playoff rules — 5-on-5 overtime, indefinitely, until someone scores — it would increase ice time by only about 3 percent. In the chart below, I’ve tracked what percentage of overtime playoff games (since 1995) were resolved within a given number of minutes. In the majority of games — 56 percent — someone scored within the first 10 minutes. Only 7 percent of games, meanwhile, required two or more overtimes.

Overall, the average overtime game required 13.6 minutes before someone scored. Since 23 percent of playoff games went to OT, that makes the average length of a playoff game about 63 minutes, as compared to around 61 minutes during the regular season.
That’s not much of an increase, and if the NHL were concerned about it, it could counteract it by reducing the regular season to 80 games from 82. Then you’d have no shootouts, no ties, no loser point and no overall increase in ice time.
Still, maybe we’re concerned about those cases when one team has played a multiple-overtime game and faces off against another on fresh skates. Equivalent cases come up all the time in other sports — baseball, basketball, tennis — and they deal with it. But you could argue that it’s a bigger problem in hockey given the punishing nature of the sport.
The solution is to take players off the ice, which will increase scoring. This isn’t a new idea at all — during the regular season, the NHL plays 4-on-4 hockey in overtime, and there have been proposals to go to 3-on-3.
But here’s my insight: Goals are scored so quickly during 3-on-3 play that you could play every game to sudden death and pretty much never inconvenience anyone. The players, the referees, the 13-year-old in Winnipeg who refuses to do his algebra homework until the Jets game is finished — they’d all be OK.
You may have noticed, in the graphic above, that I drew a smooth curve (labeled “model”) alongside the historical data. The curve is formed by assuming that there’s a 7.4 percent chance of scoring a goal per minute of overtime play, which is the historical rate in the playoffs since 1995. As you can see, the curve “fits” the historical data extremely well. That means the length of overtime games is easy to model.1 If you know the overall rate of scoring, you can accurately guess how many games will require at least two overtimes, for instance.
In 4-on-4 play, there’s a 9.1 percent chance of a goal being scored each minute (according to research by Stephen Pettigrew), about 20 percent higher than under 5-on-5 conditions. It’s 3-on-3 action that sees a really radical shift, however, with a 16.8 percent chance of a goal each minute.
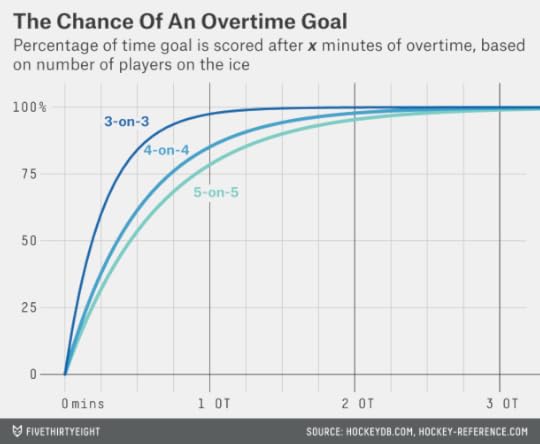
So what if overtime was played 3-on-3? About 60 percent of games would be resolved within the first five minutes, and 84 percent within the first 10 minutes. Only about 3 percent of overtime games would require double overtime, and fewer than 1 in 1000 would go to triple-OT. The average overtime game would require just six minutes to complete, barely longer than under the current rules.2 And with just three skaters on the ice at a time, teams could give their bench plenty of rest between shifts.
The NHL could also adopt some compromise or another. It could play five minutes of 4-on-4 overtime immediately at the end of regulation, as it does now, then clean the ice3 and play an indefinite amount of 3-on-3 overtime if needed. It could declare a tie if no one had scored after a full 20-minute period of 3-on-3 overtime. (Ties would be a rarity, almost like they are now in the NFL.) It could keep removing players from the ice until it was just goalie versus goalie.4 Would you not stop whatever you were doing to watch Henrik Lundqvist versus Tuukka Rask, one-on-one?
Or insert your own proposal: Overtime decided by rock-paper-scissors? Nearly anything would be better than the loser point.

March 27, 2015
Why Harry Reid’s Retirement Will Hurt Democrats In Nevada
Sen. Harry Reid’s announcement Friday that he won’t seek re-election wasn’t a total surprise. Reid is 75 and recently suffered a severe eye injury, and his Democrats lost their majority in the Senate last year, reducing his role to minority leader.
But will Reid’s decision make it harder for Democrats to regain their majority in 2016? The answer appears to be yes.
A Gravis Marketing poll, conducted last month, found Reid narrowly trailing two prospective Republican opponents, Adam Laxalt and Brian Krolocki. Meanwhile, Reid’s favorability and approval ratings remain poor, both nationally and in Nevada.
Facing those circumstances, Democrats might seem just as inclined to take their chances on an open-seat race in 2016. Nevada, after all, was slightly blue-leaning in the past two presidential elections, with President Obama slightly exceeding his national margin of victory in the state both times.
But that analysis is a little superficial. Nevada Democrats were probably better off with Reid than without him.
For one thing, the polls have underrated Reid before. While most public polling projected Reid to lose his seat to Republican Sharron Angle in 2010, Reid won instead, and by a reasonably solid 6-point margin.
In fact, rather than signifying a horribly flawed incumbent, Reid’s performance in 2010 was in line with how other Democratic incumbents fared in the past two midterms. In the table below, I’ve compared the margin of victory or defeat for Democratic senators in 2010 and 2014 against Obama’s margin in each state in 2012. As it happened, Obama’s margin was a good guide for how these incumbents fared. All five Democratic incumbents in states that Obama lost in 2012 lost their races as well, while all but two in states Obama won held their seats. Reid was a typical case, winning by 6 percentage points as compared to Obama’s 7-point margin of victory.
STATEINCUMBENTYEARSENATE MARGINPRES. MARGIN (2012)HawaiiInouye2010D+53.2D+42.7HawaiiSchatz2014D+42.1D+42.7VermontLeahy2010D+33.4D+35.6New YorkGillibrand2010D+27.8D+28.2New YorkSchumer2010D+34.1D+28.2Rhode IslandReed2014D+41.3D+27.5MarylandMikulski2010D+26.4D+26.1MassachusettsMarkey2014D+23.9D+23.1CaliforniaBoxer2010D+10.0D+23.1DelawareCoons2014D+13.6D+18.6New JerseyBooker2014D+13.5D+17.7IllinoisDurbin2014D+10.9D+16.8WashingtonMurray2010D+4.7D+14.8OregonWyden2010D+18.0D+12.1OregonMerkley2014D+18.9D+12.1New MexicoUdall2014D+11.1D+10.1MinnesotaFranken2014D+10.2D+7.7WisconsinFeingold2010R+4.8D+6.9NevadaReid2010D+5.7D+6.7New HampshireShaheen2014D+3.2D+5.6ColoradoBennet2010D+1.7D+5.4ColoradoUdall2014R+1.9D+5.4VirginiaWarner2014D+0.8D+3.9North CarolinaHagan2014R+1.6R+2.0AlaskaBegich2014R+2.1R+14.0LouisianaLandrieu2014R+11.9R+17.2ArkansasLincoln2010R+21.0R+23.7ArkansasPrior2014R+17.1R+23.7At first glance, this might make it seem as though incumbency provided little advantage to Reid or the other Democrats. But that isn’t the case: 2010 and 2014 were strongly Republican-leaning years. The incumbency advantage was enough to allow Reid and many Democrats to overcome the midterm tide and match Obama’s presidential-year performance.
Reid, of course, also benefited from a poor Republican opponent in Angle, whose political platform was far to the right of the average Nevadan and who was an inexperienced and gaffe-prone candidate. Still, Angle raised almost $28 million in individual contributions to her Senate bid in 2010 (double Reid’s $14 million), and she’d at least held elected office before (unlike say, Christine O’Donnell in Delaware). FiveThirtyEight’s “fundamentals” analysis had Angle slightly favored in 2010, as did the polls.
So Reid’s experience in running Nevada campaigns and his ability to turn out his voters went some way in overcoming his personal unpopularity in Nevada. The quality of campaigns can matter considerably in Nevada because it’s a low-turnout state, full of shift workers and recent transplants. Persuasion may be less important there than getting voters to the polls, something Reid (and Obama) were highly skilled at.
The problem for Democrats is that, other than Reid and Obama, their candidates haven’t had such an easy time turning out the vote. Republicans control Nevada’s governorship, its state assembly and (narrowly) its state senate, along with three of its four U.S. House seats. Democrats have sometimes come up short in the state even under seemingly favorable circumstances, such as Nevada’s 3rd Congressional District in 2006, when Republican incumbent John Porter narrowly defeated Democratic challenger Dana Titus in a Democratic “wave” year 1, or when the Democratic candidate Shelley Berkley lost the U.S. Senate race in 2012 even as Obama was re-elected.
The Nevada political guru Jon Ralston, who correctly predicted that Reid would hold the Senate in 2010, points out that Democrats have a “weak bench” in Nevada, consisting mostly of retreads like Titus. A budding star’s charisma might outweigh Reid’s experience, but Democrats don’t have one. Their best-known candidate, Catherine Cortez Masto, is a former state attorney general who is no longer in office.
This isn’t a total disaster for Democrats by any means. Perhaps the race is a true tossup now, whereas, with Reid on the ballot, they would have been only slightly favored. But, even for all his baggage, Democrats may miss Reid.
Related: Harry Enten wrote about why Reid endorsed Chuck Schumer to be his replacement.

March 23, 2015
Duke, Arizona And Michigan State Are Biggest Tourney Gainers
Pretty much every team that survives its first two games and advances to the Sweet 16 has the right to be pleased with its performance. But four men’s teams — Duke, Arizona, Michigan State and Gonzaga — should be especially giddy. Their odds of winning the championship have improved the most so far.
In the table below, I’ve compared the 16 surviving teams in two ways: First, by the change in their power rating in the FiveThirtyEight forecast since before the
Teams’ power ratings can change for two reasons. Our model updates the power ratings at the end of each game based on how a team performs relative to its expectations. A team that wins by an especially wide margin, or that wins as an underdog, will see the largest gains. By contrast, a team’s power rating may decline if it wins by a smaller-than-expected margin.
We’re also continually updating the model with new data on player injuries. Two injury situations are the most critical so far: North Carolina’s Kennedy Meeks’ Sweet 16 status is uncertain after he hurt his knee in the Tar Heels’ Saturday win against Arkansas. And Wisconsin point guard Traevon Jackson has yet to play despite hopes that he might have returned.
Apart from the changes in its power rating, a team’s chances of winning the tournament can change because its draw becomes harder or easier. Michigan State’s probability has improved not just because they beat Virginia, for instance, but also because the No. 1 seed in the East region, Villanova, was ousted by North Carolina State.
Here’s a quick look at the teams with the largest shift in their probability:
Duke’s championship probability has roughly doubled to 11.9 percent from 5.7 percent. The Blue Devils won their first two games easily, and they were helped by losses elsewhere in the bracket, especially to Iowa State, their one-time potential opponent in the Elite Eight.Arizona’s chances have improved to 14.5 percent from 9.5 percent. The Wildcats have also been helped by an upset: Instead of facing No. 3 seed Baylor in their Sweet 16 game, they’ll get Xavier. It helps, too, that Wisconsin, Arizona’s potential Elite Eight opponent, has not looked as strong as the model had them originally.Almost everything has gone Michigan State’s way: The Spartans beat the No. 2 seed in their region, Virginia, and got a lot of credit for it in the model. But the No. 1 seed in the East, Villanova, was eliminated too. The Spartans are now the favorite to reach the Final Four from the East and have some chance to go further than that — they were underseeded to begin with, and will stay reasonably close to home for the rest of the tournament with the remaining games in Syracuse and Indianapolis. (Plus, there’s Tom Izzo’s amazing run of postseason success, although the model doesn’t give them any extra credit for that.)Gonzaga won easily on Sunday against an Iowa team that looked excellent in its opening game. Its path has also gotten easier because of the elimination of Iowa State, a team they could have played in Sweet 16. Instead, they’re 75 percent favorites to win their grudge match against UCLA.By contrast, Wisconsin and North Carolina’s probabilities have declined slightly, partly because of their injury issues and partly because Arizona looms large in the West regional, which will be played in Los Angeles. Wisconsin also played a closer game against Oregon than the model expected.
Still, Wisconsin retains the fourth-best overall chance to win the tournament, after Kentucky, Arizona and Duke. And even if the Badgers don’t win the tournament, their chances of winning an NCAA spelling bee are up after they learned all about stenography this weekend. What’s a 10-letter word for “in the hunt?”
Check out FiveThirtyEight’s March Madness predictions.

March 21, 2015
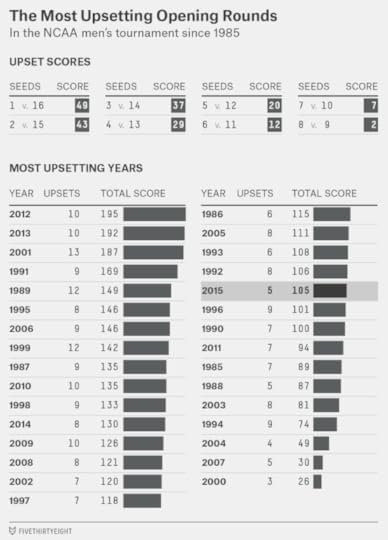
Less Madness, More Chalk
The first two days of March Madness came in like a lion and went out like a lamb. On Thursday, two of the first three games in the men’s tournament featured major upsets, with No. 14 seeds UAB and Georgia State defeating No. 3 seeds Iowa State and Baylor. Those games were enough to ruin more than 99 percent of people’s prefect brackets.
Then No. 6 Southern Methodist lost to No. 11 UCLA on a
This year, underdogs scored 105 upset points in the round of 64:
No. 14 UAB got 37 upset points for beating Iowa StateNo. 14 Georgia State got 37 points for beating BaylorNo. 11 UCLA got 12 points for beating SMUNo. 11 Dayton got 12 points for beating ProvidenceNo. 10 Ohio State got 7 points for beating VCUThis total is below average, especially by the standard of recent tournaments. Last year, there were 130 upset points in the round of 64. In 2012 and 2013, there were 195 and 192, respectively, the highest totals since the tournament expanded to 64 teams. However, this year’s tournament hasn’t been an outlier, by any means. The first round of the 2000 tournament featured just 26 upset points, while 2007 had just 30.
In theory, we might expect to see upsets increase as parity increases in the men’s game and the differences between the teams becomes smaller. And it might not be so surprising that there have been fewer of them in this year’s tournament, which
March 18, 2015
The Odds That You’ll Have A Perfect March Madness Bracket
Good news: Your odds of finishing with a perfect NCAA men’s tournament bracket are far better than last year. If you follow FiveThirtyEight’s March Madness predictions in every game, you’ll have a 1 in 1,610,543,269 chance of calling every game right.
That’s barely worse than a billion-to-one against! Last year, the chances were 1 in 7,419,071,319 — almost five times worse. Why is this year’s so much easier? The 2015 men’s bracket is
Check out FiveThirtyEight’s March Madness predictions.

Nate Silver's Blog

- Nate Silver's profile
- 729 followers

