
Nate Silver's Blog, page 153
May 23, 2015
Same-Sex Marriage Wins Easily In Ireland
Ireland voted “yes” on gay marriage on Friday, approving a constitutional amendment that made it the first country to legalize same-sex marriage by popular vote.
The amendment was approved 62 percent to 38 percent. By comparison, the past five polls had shown the “yes” side ahead, on average, 64 percent to 23 percent, with 13 percent undecided. So the polls did a pretty good job of projecting the “yes” vote, but most of the undecided voters turned out to vote “no” instead, a reasonably common pattern for ballot propositions of this kind.
What’s more impressive is how quickly Irish opinion on gay rights has changed. The country once had a reputation for being homophobic, and it did not decriminalize homosexuality until 1993. And in a 2006 Eurobarometer poll, only 41 percent of Irish residents say they favored same-sex marriage. That means the pro-gay marriage side gained more than 2 percentage points of support per year to have reached 62 percent now, a rate of change similar to or slightly faster than the United States over the same period.
Which European countries might be next to legalize gay marriage? In the 2006 poll, 12 countries were more supportive of gay marriage than Ireland. They were The Netherlands (82 percent), Sweden (71 percent), Denmark (69 percent), Belgium (62 percent) Luxembourg (58 percent), Spain (56 percent), Germany (52 percent), the Czech Republic (52 percent), Austria (49 percent), France (48 percent), the United Kingdom (46 percent) and Finland (45 percent).
Gay marriage is now legal in nine of those countries, and it will become legal in Finland in 2017. The exceptions are Germany and Austria, where polls show large majorities in favor of gay marriage, but which currently have registered partnerships for gay couples instead.


May 22, 2015
The Best NBA Teams Of All-Time, According To Elo
The stakes in the NBA are incredibly high. Superstar players so dominate the league that decisions on trades, draft picks and free-agent signings could gut a franchise for years or make it a perennial contender. But unlike in sports like baseball and hockey, where luck plays a larger role, in the NBA, the best team usually wins. There’s little forgiveness when a star player gets hurt, and when a team misses its first chance at a title, it may not get another.
We wanted a way to visualize each team’s ups and downs. You can find that in the form of our new interactive graphic, “The Complete History Of The NBA,” which tracks each franchise through all 63,145 games (and counting) in NBA and ABA history.1
Elo ratings, the basis for the interactive, should be familiar to regular readers of FiveThirtyEight. We introduced them for the NFL last year, and they proved to be a popular feature.2 But we didn’t invent the idea: Elo ratings were originally developed to rate chess players and have also been used in soccer, baseball and other sports.
Elo is like the iPad of sports power ratings: Their design is quite simple, and they do a lot with a little, depending only on the final score of each game and where it was played. Teams always gain Elo points after winning games — although more for upset wins and for winning by wider margins — and lose ground after losing them. They account for both regular-season and playoff games. If you want (much, much) more detail, see here. For the rest of you, here’s a quick guide on how to interpret different Elo ratings and about how many wins they’d translate into over the course of an 82-game regular season.
ELOEQUIVALENT RECORDTEAM DESCRIPTION180067-15All-time great170060-22Title contender160051-31Playoff bound150041-41Average140031-51In the lottery130022-60LOL120015-67Historically awfulElo ratings above 1800, which imply a team would be able to sustain at least a 67-15 record over the long term, are extremely rare. Only three teams have achieved them: the 1995-96 Chicago Bulls (whose 1853 Elo rating from June 9, 1996, is the all-time record), the 1996-97 Chicago Bulls and the 1985-86 Boston Celtics. This year’s Golden State Warriors have a chance at an 1800-plus rating, depending on how the rest of the playoffs go.
A 1700 rating is more typical for a title contender. The Cleveland Cavaliers, with a 1689, are currently somewhere near that mark, for example. A 1600 rating represents a playoff team that’s likely to lose in the first or second round. And Elo ratings can go way lower, of course. The all-time NBA low, 1111, belongs to the Dallas Mavericks after they went 4-57 to open the 1992-93 NBA season.3
So where do, say, the 1982-83 Philadelphia 76ers rank? Here are Elo’s ratings of all seasons in NBA and ABA history:4
You can sort the teams in several ways: by their season-ending Elo rating, by their peak rating or by their average rating throughout the season.5 A team’s composite Elo rating is a simple average of these three.
For the very best teams — and I already mentioned some of Elo’s favorites, like the Jordan-era Bulls and the 1985-86 Celtics — the ratings are high across the board. The ’82-83 Sixers are another of these, ranking as the 10th-best team all-time.
But in other cases, there’s a pretty big difference between peak, year-end and average ratings. The 1999-2000 Los Angeles Lakers achieved the 11th-highest peak rating ever (1779). But their year-end rating is a pedestrian 1690 because they coasted down the stretch and then struggled (relatively speaking) in the playoffs, getting outscored by both the Portland Trail Blazers and Indiana Pacers despite winning those series. Conversely, the 1988-89 Detroit Pistons got better and better as the season went on, going 35-6 in the second half of the regular season and then 15-2 in the playoffs against opponents that included the Lakers, Celtics and Bulls.
The list might seem to be biased toward relatively recent teams: Among the top 50 seasons all-time, only six from before 1980 make the list. This is mostly a consequence of there being more teams than there once were. Simply put, it’s much more impressive to be the best team in a 30-team league than in a 10-team league.
But it’s also hard to say the NBA is watered down, at least right now. In fact, it’s barely expanded in recent years, adding just one franchise since 1995. That makes recent teams’ performances more impressive than those from, for example, the early 1970s, when the NBA almost doubled in size over a few seasons. When Elo ranks a team higher or lower than you might expect intuitively, it’s usually because it perceives the team’s competition to be especially strong or especially weak.
Some teams, meanwhile, do their damage over the long run instead of having any one standout season. The best team from the Celtics dynasty of the 1960s ranks only 47th all-time. But the Celtics of that era were incredibly consistent, with a composite Elo rating falling somewhere between 1627 and 1704 over 11 consecutive seasons. The San Antonio Spurs, meanwhile, have placed 13 teams in the all-time top 100 since 1994-95, but their highest-ranked individual season (2013-14) is only 12th.
And what about this season’s Warriors ranking as the fourth-best team of all time? Obviously, that’s a provisional score: They may rise or fall a couple of slots depending on how the rest of the playoffs go (although they almost certainly won’t pull ahead of the 1995-96 Bulls). But even though the conventional wisdom has been skeptical about the Warriors at times, we think Elo’s case is pretty easy to defend.
Here’s how it goes. As we’ve said, Elo is all about accounting for the strength of a team’s competition, and the Western Conference over the past dozen or so years has featured about the toughest basketball competition imaginable. The Warriors’ 67-15 regular-season record is as good as any other Western Conference team from this era, and their regular-season point differential (+10.2 points per game) is better than anyone else’s. If they follow that up with a title, there really won’t be much to find fault with. Whether they’re a one-year wonder or will prove to be a perennial contender is another question, of course. We hope you’ll enjoy exploring the interactive and tracking their progress.

May 21, 2015
How We Calculate NBA Elo Ratings
Hopefully if you’re reading this, you’ve had a chance to explore our new interactive graphic, “The Complete History Of The NBA,” which tracks each NBA and ABA franchise’s performance through every game of its history.
So now for the exciting part: 2,000 words about autocorrelation and the Akron Firestone Non-Skids.
Actually, this won’t be too bad because Elo is a pretty simple formula. The guts of the system are the same as we used for the NFL and which other researchers have applied to competitions ranging from chess to soccer. For those new to Elo, here are its essential features:
The ratings depend only on the final score of each game and where it was played (home-court advantage). They include both regular-season and playoff games. The principal source for game-by-game scores is Basketball-Reference.com.Teams always gain Elo points after winning games and lose ground after losing them. They gain more points for upset wins and for winning by wider margins.The system is zero-sum. When the Denver Nuggets gained 30 Elo points by upsetting the No. 1 seed Seattle SuperSonics in the first round of the 1994 NBA playoffs, the Sonics lost 30 points.Ratings are established on a game-by-game rather than a season-by-season basis. So you can see changes in a team’s “form” over the course of the year: The Toronto Raptors had a much higher rating early in the 2014-15 season than at the end of it, while the reverse has been true for the Cleveland Cavaliers.The long-term average Elo rating is 1500, although it can vary slightly in any particular year based on how recently the league has expanded (more about that below). More than 90 percent of team ratings are between 1300 (pretty awful) and 1700 (really good), but historically great or truly execrable teams can fall outside that range:
ELOEQUIVALENT RECORDTEAM DESCRIPTION180067-15All-time great170060-22Title contender160051-31Playoff bound150041-41Average140031-51In the lottery130022-60LOL120015-67Historically awfulThere are just a few NBA-specific parameters to set, which we’ll describe below.
The K-factorElo’s K-factor determines how quickly the rating reacts to new game results. It should be set so as to efficiently account for new data but not overreact to it. (In a more technical sense, the goal is to minimize autocorrelation.) If K is set too high, the ratings will jump around too much; if it’s set too low, Elo will take too long to recognize important changes in team quality.
We found the optimal K for the NBA to be 20. This is higher than we expected; it’s in the same range as the K used for NFL and international soccer Elo ratings even though the NBA plays far more games than those sports. It’s much higher than the optimal K for baseball. It implies that you ought to give relatively high weight to an NBA team’s recent performance.
One way to interpret this is that NBA data is subject to relatively little randomness. This makes it different from sports like baseball and hockey, whose game-by-game results are pretty noisy; in those sports, your default assumption should be that a winning or losing streak is mostly luck. That isn’t so true for basketball. Streaks may reflect true, if perhaps temporary, changes in team quality. When the Atlanta Hawks went on a 19-game winning streak this season, for instance, they were undoubtedly getting a little lucky, but they were probably tougher to beat than at other points in the season.
There are still some cases in which Elo seems too slow to catch up to reality, like when Michael Jordan left the Bulls or LeBron James left the Cavs. But remember: Elo is only looking at game scores and not the composition of the roster. If that’s all the information you have, setting Elo to react more quickly to these cases would make it overreact to others. The Oklahoma City Thunder’s Elo rating never dipped below 1508 this year despite its 3-12 start, for instance, and that proved to be prudent since the team went 42-25 the rest of the way and ended the year with an Elo rating of 1583.
Home-Court AdvantageHome-court advantage is set as equivalent to 100 Elo rating points. One hundred Elo points is equivalent to about 3.5 NBA points,1 so that’s like saying the home team would be favored by 3 or 4 points if the teams were otherwise evenly matched.
In practice, the magnitude of home-court advantage has waxed and waned over the NBA’s history. Home teams won by an average of 5.8 points in the 1987-88 regular season, for instance, but by just 2.4 points in the past season. And some teams (especially those like Denver and Utah that play at high altitudes) have historically had slightly larger home-court advantages.
Still, the spirit of the Elo system is to keep things simple. We experimented with a dynamic home-court advantage rating that changes over time, but we found that it made almost no difference to the overall ratings, partly because each NBA team plays about half its games at home and half on the road. So we’re using the constant 100-point home-court advantage instead.
Margin of VictoryElo strikes a nice balance between ratings systems that account for margin of victory and those that don’t. While teams always gain Elo points after wins and lose Elo points after losses, they gain or lose more with larger margins of victory.
This works by assigning a multiplier to each game based on the final score and dividing it by a team’s projected margin of victory conditional upon having won the game. For instance, the Warriors’ 4-point margin over the Rockets in Game 1 of this year’s Western Conference finals was lower than Elo would expect for a Warriors win. So the Warriors gain Elo points, but not as many as if they’d won by a larger margin. The formula accounts for diminishing returns; going from a 5-point win to a 10-point win matters more than going from a 25-point win to a 30-point win. For the exact formula, see the footnotes.2
Year-to-Year Carry-OverInstead of resetting each team’s rating when a new season begins, Elo carries over a portion of a team’s rating from one season to the next. In our NFL Elo ratings, teams retain two-thirds of their rating from the end of the previous season. In our NBA ratings, by contrast, they keep three-quarters of it. The higher fraction reflects the fact that NBA teams are more consistent from year to year than NFL squads.
For example, the Miami Heat ended the 2012-13 NBA season with an Elo rating of 1754. The team’s Elo rating for the start of the 2013-14 season is calculated as follows:
(.75 * 1754) + (.25 + 1505) = 1692
Detail-oriented readers may see something that seems amiss here. Each team’s Elo rating is reverted to the mean, and — as we’ve said — the long-term mean Elo rating is 1500. So why does a slightly different number, 1505, appear in the formula?
Expansion, Contraction and MergersThe reason has to do with the way we handle expansion teams. In principle, the implementation of this is pretty simple. Each franchise begins with an Elo rating of 1300 in its inaugural professional season. The reason we revert to a mean of 1505 rather than 1500 is that there are liable to be a couple of relatively recent expansion teams in the league at any given time. Giving established teams a rating very slightly higher than 1500 counteracts the expansion teams and keeps the league average Elo close to 1500 over the long run.
But the league average Elo rating will be slightly different from 1500 in any given season, depending on how recently the league has expanded. It was 1504.5 during the 2014-15 NBA season, for instance, slightly higher than the long-term average because the NBA hasn’t expanded much recently.
The league average tended to fluctuate more in the early years of the NBA because of constant expansion, contraction and mergers with other leagues. (We’ve learned way more than we wanted to know about the early history of American professional basketball, like that you could have once watched a game between teams named the Indianapolis Kautskys and the Akron Firestone Non-Skids.) The league average reached a peak of 1534.5 in 1954-55 after a number of losing teams had disbanded. By contrast, it was just 1440.5 in the 1970-71 season after the NBA expanded rapidly.
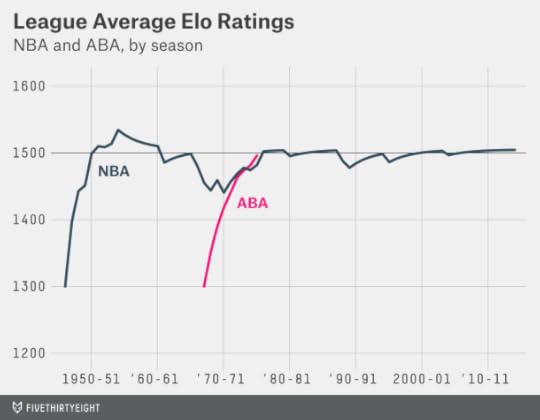
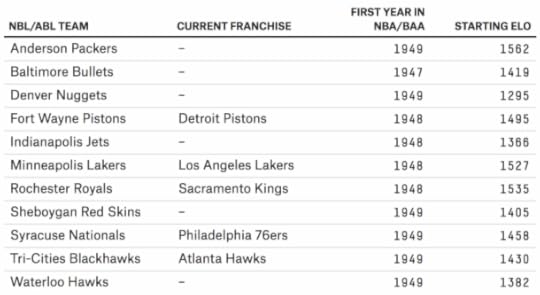
There’s one other tricky part. We said a team begins with a rating of 1300 in its first professional season. That doesn’t mean its first NBA season. Instead, teams get credit for their performance in predecessor leagues that merged with the NBA:
The Basketball Association of America (BAA), which began play in 1946-47, is usually considered the official predecessor of the NBA. So we track all BAA teams’ Elo ratings explicitly, starting them at 1300 in 1946-47.We also track American Basketball Association (ABA) Elo ratings explicitly — yes, that includes The Floridians! — starting them at a rating of 1300 in the ABA’s inaugural season of 1967-68. The year-end adjustment takes care of the rest, allowing the ABA’s performance to gradually improve over time. The four ABA teams that joined the NBA in 1976-77 simply carry over their ratings from ABA. Because these teams — the Indiana Pacers, San Antonio Spurs, Denver Nuggets and New York Nets — had been among the more successful ABA franchises, Elo ratings imply that the merger with the ABA did not weaken the NBA much. The four ABA imports averaged a respectable 40-42 record in their first three NBA seasons, in fact.The National Basketball League (NBL) was a competing professional basketball league that began play in 1937-38 and included colorfully named franchises like the Non-Skids. It merged into the BAA in advance of the 1949-50 season, at which point the combined league was renamed the NBA. In fact, most of the better franchises in the early days of the NBA originated in the NBL rather than the BAA, including the Minneapolis Lakers, Rochester Royals and Fort Wayne Pistons. While we could not track down game-by-game results for the NBL, we inferred Elo ratings for NBL teams based on the season standings and playoff results, and these ratings carry over when teams enter the NBA. For instance, the Syracuse Nationals (now the Philadelphia 76ers) begin with a rating of 1458 in their first NBA season in 1949-50.Finally, one early NBA team, the Baltimore Bullets, originated in a third early league, the American Basketball League (ABL). Confusingly, that original version of the Baltimore Bullets bears no relationship with the team that would later play as the Baltimore Bullets from 1963 to 1973 (and which is now known as the Washington Wizards). However, Elo gives the original Baltimore Bullets credit for the seasons they played in the ABL.3 You can find the starting Elo ratings for the Bullets and NBL teams below:
Teams retain their prior Elo ratings when they change cities or nicknames. This includes the teams now known as the New Orleans Pelicans and Charlotte Hornets. The NBA, in a bit of revisionist history, considers the current Charlotte Hornets (who were known as the Charlotte Bobcats until this season) to “own” the statistics of the team that played as the Charlotte Hornets from 1988-89 through 2001-02, before they moved to New Orleans. We instead link those Hornets seasons with the New Orleans Hornets, who are now the New Orleans Pelicans.

May 19, 2015
Podcast: Clippers’ Collapse, Rangers’ Squeakers, And Baseball Embraces Statcast
Welcome to this week’s episode of “Hot Takedown,” our podcast where the hot sports takes of the week meet the numbers that prove them right or tear them down. On this week’s show (May 19, 2015), we look at the matchups in the NBA’s conference finals, whether the Houston Rockets are winning with analytics and why the Clippers collapsed. Nate Silver discusses why the New York Rangers continue to win so many close NHL games. And we ponder whether baseball needs even more statistical analysis as MLB embraces Statcast. Plus, our Significant Digit of the week on Chelsea’s oft-disciplined Cesc Fabregas.
Stream the episode by clicking the play button, or subscribe using one of the podcast clients we’ve linked to above.
Below are some links to what we discuss in this week’s show:
The Clippers’ win probability during Game 6 against the Rockets peaked at 98 percent.Stephen Curry is unguardable.Lebron James is dominant in the conference finals.The future of MLB stats and video tracking.Analyst vs. Statcast, who should you trust?Nate Silver on postseason goaltending and the Rangers’ ability to win close game after close game.Significant Digit: 14 points. In a game in which Chelsea clinched the Premier League title, Cesc Fabregas also pulled into a tie for the most discipline points among all players.If you’re a fan of our podcasts, be sure to subscribe on iTunes and leave a rating/review. That helps spread the word to other listeners. And get in touch by email, on Twitter or in the comments. Tell us what you think, send us hot takes to discuss, and tell us why we’re wrong.

The Complete History Of The NBA
How do you rate an NBA team across decades of play? One method is Elo, a simple measure of strength based on game-by-game results. We calculated them for every NBA (and ABA) franchise after every game in league history — over 60,000 ratings in total. Read about our methodology.
Elo ratings have a simple formula; the only inputs are the final score of each game, and where and when it was played. Teams always gain Elo points for winning. But they get more credit for upset victories and for winning by larger margins. Elo ratings are zero-sum, however. When the Houston Rockets gained 49 Elo points by winning the final three games of their Western Conference semifinal during this year’s playoffs, that meant the Los Angeles Clippers lost 49 Elo points.
A rating of 1500 is approximately average, although the league average can be slightly higher or lower depending on how recently the league has expanded. (Expansion teams begin with a 1300 rating.) Select a team above, and zoom in to explore its history.

It’s no surprise that the 1995-96 Chicago Bulls — with an NBA-record 72 regular-season wins — have the best Elo rating ever. The team picked up its fourth NBA championship at the end of that season, but the Bulls hit their peak Elo (1853) a few games earlier when they stomped the SuperSonics 108-86 in Seattle to take a 3-0 lead in the finals and improve their playoff record to 14-1. Chicago went into a “slump” for the next two games — losing both by double digits — before clinching the title in Game 6.
The Lakers’ 33 Games To Greatness
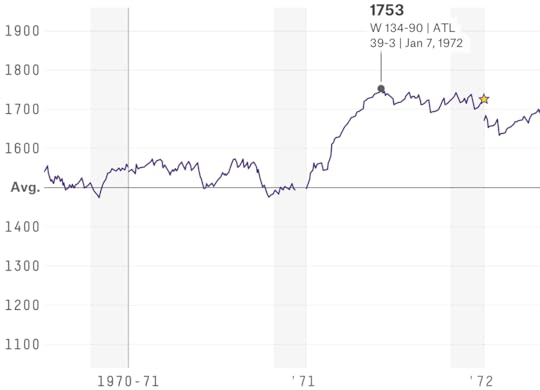
Going into the 1971-72 season, the Los Angeles Lakers had a middling 1496 Elo rating, in part because their competition was watered down by the NBA’s rapid expansion (the league had gone from nine to 17 franchises in the span of several years). And anchored by aging veterans Elgin Baylor (37 years old), Wilt Chamberlain (35) and Jerry West (33), the team was supposed to be approaching the end of the era, a perception strengthened by Baylor’s retirement just nine games into the season.
Then: the streak. From Nov. 5 through Jan. 7, the Lakers reeled off 33 consecutive wins, raising their Elo rating over 200 points, from 1544 to 1753. That was the team’s peak rating for the season, although the Lakers did go on to win the 1972 title, the franchise’s sixth and its first since 1954.
The ’60s Celtics Don’t Get Any Respect
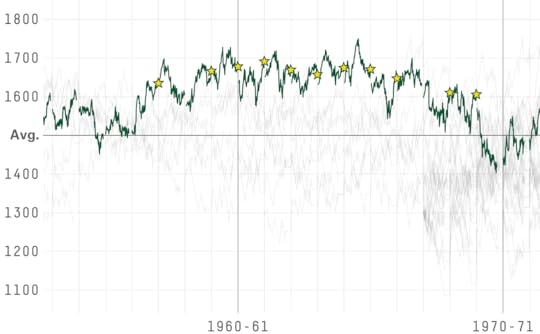
The Boston Celtics won 11 of 13 NBA titles from 1957 through 1969, a dominance unparalleled in modern sports. Elo doesn’t care about rings, though, and knocks the Celtics for their weak opponents and occasionally lackluster regular seasons (at least relative to their playoff achievements). Still, the Celtics’ Elo rating hung around 1700 (really good) for much of the era, and the team maintained an above-average Elo rating for over 13 years. Only the 1980s-era Lakers and the current San Antonio Spurs, a team with which those Celtics have a lot in common, put together similar streaks.
The Knicks Peaked A Long Time Ago

The 1969-70 season was a great one for New York basketball. Led by Willis Reed, Walt Frazier and Dave DeBusschere, the Knicks were 23-1 through Nov. 28 and hit an Elo rating of 1712 — the highest in franchise history. Things were a little less smooth after that: New York went 37-21 to close out the regular season and was taken to seven games twice in the playoffs. By the time the Knicks won the franchise’s first title in May, their rating had fallen to 1591.
It’s been awhile since Nov. 28, 1969. No other active team has an Elo peak so long ago; the next closest are the Bucks (March 8, 1971) and Nets (Feb. 23, 1975, when they were still in the ABA). Every moment of Knicks daylight since — from Linsanity to Larry Johnson’s 4-point play — has not quite lived up to their former glory.

May 14, 2015
The Rangers’ Stranger And Stranger Statistical Feats
Now and then a Game 7 can be an anticlimax, like when the Kansas City Royals won the 1985 World Series by blowing out their cross-state rivals, the St. Louis Cardinals, 11-0 in the finale. But Game 7 of the Rangers-Capitals playoff series lived up to every inflated expectation. Like the previous six games of the series, Wednesday’s featured some great goaltending: Netminders Henrik Lundqvist of the Rangers and Braden Holtby of the Capitals combined to stop 72 of 75 shots (96 percent). And like the other six games, it was decided by one goal, with the Rangers coming back to win 2-1 on Derek Stepan’s overtime goal.
The Rangers have now played 14 straight one-goal games in the playoffs, an NHL record. All five games of their first-round series against the Pittsburgh Penguins were decided by one goal. So were the final two games of their Stanley Cup Final last year against the Los Angeles Kings.
What are the odds of a streak like this? More NHL playoff games are decided by one goal than you might expect. The NHL has become a low-scoring league — but also, the sudden-death playoff overtime format facilitates one-goal margins, since every game that goes to OT will be won by exactly one goal by one team or the other.
Specifically, since the start of the low-scoring “dead-puck era” in 1998,4 722 of 1,453 NHL playoff games have been decided by one goal. That’s 49.7 percent, or almost exactly half.
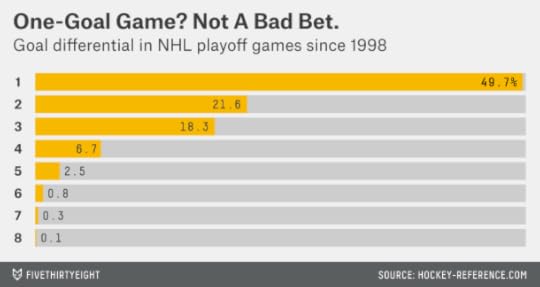
So playing 14 consecutive one-goal games is roughly equivalent to having a fair coin come up heads 14 times in a row. The probability of that is 1 chance in 16,384. This has been a pretty unlikely and uncanny streak for the Rangers.
You can quibble with that calculation if you like. The Rangers have a great goalie in Lundqvist, who might lead to tighter and lower-scoring games. They also have a pretty good offense, though, at least by contemporary standards, having tied for third in the NHL in goal scoring during the regular season. If you supposed that the probability of a Ranger playoff game being decided by one goal was 60 percent instead of 50 percent, the streak would still be unlikely: a 1 in 1,276 chance.
The Rangers have also come back from near-certain death. With 1:41 to go in the third period in Game 5 on Friday, they trailed 2-1 in the game and 3-1 in the series. Their chance of winning the game was down to about 4 percent, according to rinkstats.com, which means their chance of winning the series was around 1 percent.5 But Chris Kreider scored, then Ryan McDonagh did in OT, then the Rangers won Games 6 and 7.
Game 7 also contributed to the case for this having been one of the best playoff goaltending battles ever. In the series, Lundqvist and Holtby together had a .946 save percentage and a 1.71 goals against average. And based on the metric that I developed Wednesday, they combined for 2.4 wins above average relative to average playoff goaltenders. That ranks the series as the eighth-best goaltending duel since 1988: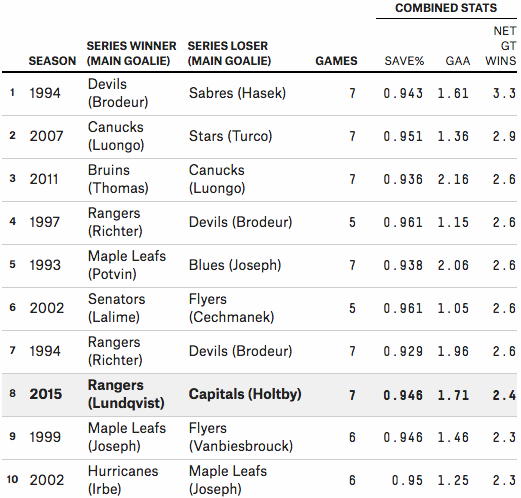
Lundqvist’s next test will be the Tampa Bay Lightning, who led the NHL in goal scoring and shooting percentage this year. Given the Rangers’ comparative lack of superstar talent and their relatively even distribution of goals and assists from their skaters so far in the playoffs, Lundqvist should be the favorite for the Conn Smythe Trophy if the Rangers bring home the Stanley Cup. Just don’t expect it to be easy.

May 13, 2015
And Now, The Roy Awards For The Best NHL Playoff Goaltending Performances
UPDATE (May 14, 7:28 a.m.): Game 7 between the Rangers and Capitals on Wednesday night featured more top-notch goaltending from Lundqvist (35 saves) and Holtby (37 saves). The Rangers won 2-1 — every game in the series was decided by one goal — and both goalies beat their combined save percentage for the series.
Who says low-scoring hockey games are boring?
The New York Rangers’ Henrik Lundqvist and the Washington Capitals’ Braden Holtby have put on a heart-stopping and spectacular goaltending duel in Round 2 of the Stanley Cup playoffs, which will conclude with Game 7 in New York on Wednesday night. So far, every game in the series has been decided by one goal, with Lundqvist and Holtby combining for a 1.80 goals against average (GAA) and a .943 save percentage.
Lundqvist and Holtby have been among the better playoff goalies in recent NHL history, and the Rangers-Caps series has been in the upper echelon of goaltending battles. But a few have been even better. In their honor, we’re going to be handing out some Roy Awards for the best postseason goaltending performances since 1988. (Why are they called Roy Awards? That will become clear in a moment.)
How to measure goaltending success is a subject of debate among hockey geeks. But here’s one approach, which is inspired by Baseball Prospectus’s Support Neutral Win-Loss (SNWL), a statistic designed to evaluate baseball pitchers. As SNWL seeks to evaluate pitchers while controlling for their run support, our goalie statistic will seek to give goaltenders credit for wins and losses without being biased toward those goalies who have better offenses scoring goals for them. It will also control for the number of shots the goaltenders faced and the quality of their opponents. Allowing three goals — as Lundqvist did Sunday — is not that impressive, but it looks a lot better when you consider he faced 45 shots against the Capitals, who have one of the NHL’s best offenses.
Here’s how it works. I downloaded data from Hockey-Reference.com on all NHL playoff games since 1988. (Hockey-Reference, as terrific as it is, doesn’t have detailed game-by-game data before then.) For each game, I compared each goalie’s actual GAA against a benchmark GAA that represents how you’d expect an average playoff goalie to perform under the same circumstances. The benchmark GAA is calculated6 based on the number of shots the goalie faced, his opponent’s goal-scoring and shooting percentage during the regular season, and whether he was playing at home or on the road. During Friday’s Game 5, for instance — with the Rangers playing at home and the Capitals generating relatively few shots — Lundqvist’s benchmark GAA was 2.17. But on Sunday, on the road and with the Caps taking 45 shots on goal, his benchmark GAA was 3.56.
The next step is to translate the benchmark GAA and the goalie’s actual GAA into win probabilities,7 assuming that the goalie had average offensive support.8 For Friday’s Game 5, for instance, Lundqvist’s benchmark 2.17 GAA translates into a 52 percent win probability. But Lundqvist’s actual performance, allowing just one goal, raised the Rangers’ win probability to 80 percent. So Lundqvist gets credit for 0.28 net wins, the difference between the two figures. (Actually, he gets credit for slightly more than that, since the game went to overtime.)9
First up, here are the Roys for goaltending in a single playoff series:
Best Performances

In the chart, MP/60 stands for minutes played divided by 60. Since a regulation NHL game is 60 minutes long, it essentially just means games played, although goalies will get extra credit for games that go to overtime.10 The next column shows the goalie’s net change in win probability per 60 minutes played. Multiplying this number by MP/60 produces net wins — how many wins a goalie added or subtracted from his team relative to an average playoff goalie. That’s what we use to hand out Roys.
So the Roy for best goaltending in a single playoff series goes to… Tim Thomas of the Boston Bruins, for his performance in the 2011 Stanley Cup Final against the Vancouver Canucks. The Canucks had been the NHL’s highest-scoring team in the regular season and launched more than 35 shots per game at Thomas. And yet he allowed only eight goals in the seven-game series, including a shutout in the final.
Thomas is followed by his fellow Bruin, Tuukka Rask, who allowed just two goals against Sidney Crosby and the Penguins in the 2013 Eastern Conference finals. He was even more effective than Thomas on a per-shot basis, with a .985 save percentage. Perhaps he was too good for his own good, in fact — the Bruins swept the series, so he played substantially fewer minutes than Thomas. In third place is Ottawa’s Patrick Lalime, who allowed two goals in five games against the Philadelphia Flyers in 2002.
The performance by Buffalo’s Dominik Hasek in the Sabres’ 1994 opening-round series against the New Jersey Devils ranks fourth, and Hasek also holds a couple of other distinctions. First, he wins the Roy for the best performance in an individual game, stopping all 70 New Jersey shots in a legendary four-overtime shutout in Game 6 of the series. And he and the Devils’ Martin Brodeur share the Roy for the best combined goaltending performance in a single series: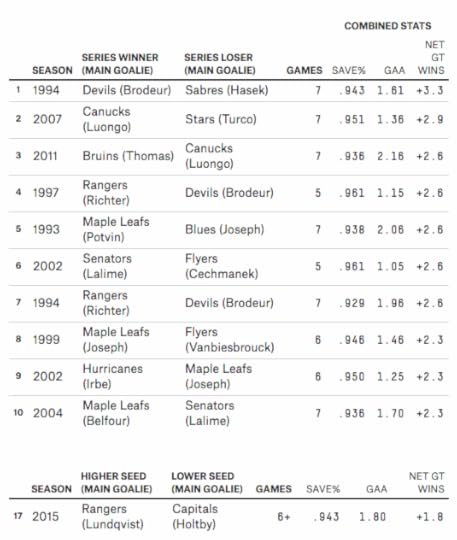
Why does that Devils-Sabres series rank so highly? Hasek and Brodeur’s conventional statistics were great, but not obviously better than some other goaltending duels, like that between the Canucks’ Roberto Luongo and the Dallas Stars’ Marty Turco in 2007. One reason is because of that quadruple overtime game, which made the matchup the equivalent of an eight-game series. But another is because the series was played in 1994, when goal-scoring was about 20 percent higher than it is now. So it stands out more by comparison.
The current Rangers-Caps series ranks as the 17th-best goalie duel so far: Holtby has contributed 1.0 net wins and Lundqvist 0.8, for a combined 1.8. It could plausibly move into the top 10 if Game 7 is low-scoring.
We can also award a Roy for the best goaltending in a single playoff season. It goes to … Patrick Roy, who added 4.2 wins in the 1993 NHL playoffs. Roy’s performance ranks highly in part because it came against some high-flying offenses. His playoff opponents — the Nordiques, Sabres, Islanders and Kings — had each averaged about four goals per game during the regular season.
Best Performances
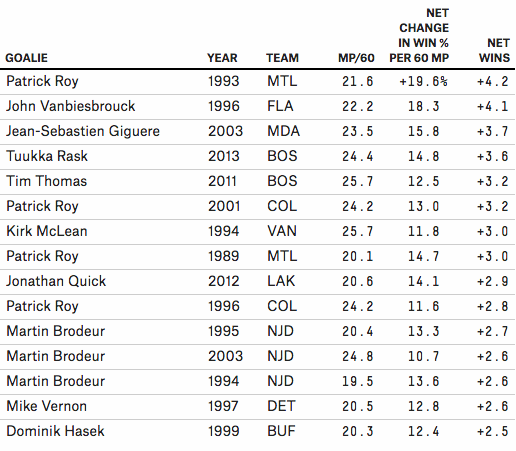
Most of the Roy winners in this category comport well with the conventional wisdom. Four of the top six goaltenders — Roy in 1993 and 2001, Thomas in 2011 and Jean-Sebastien Giguere in 2003 — also won the Conn Smythe Trophy for being the MVP of the NHL playoffs.
Finally, the Roy for the best lifetime playoff performance goes to … Patrick Roy.
Best Performances

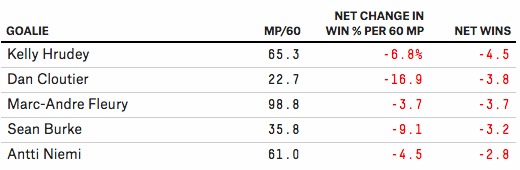
From 1988 onward, Roy was 15 wins better than an average playoff goaltender, easily outdistancing second-place Ed Belfour. And that under-rates Roy, since it doesn’t give him credit for 1986, when Roy, then 20 years old, had a 1.92 postseason GAA in leading the Canadiens to the Stanley Cup. Roy also does really well by conventional playoff statistics — he had 151 career playoff wins, easily the best all-time — but he earned them.
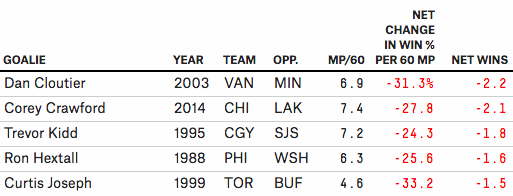
In other cases, however, the advanced stats provide some insight that isn’t as clear from traditional stats. While Brodeur had a considerably better career playoff GAA than Roy, for instance, he’s relatively far behind him in net wins, since the Devils’ neutral-zone trap prevented him from facing all that many shots and since he played in a low-scoring era.
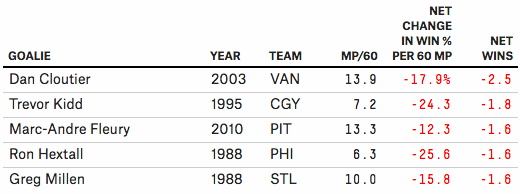
Meanwhile, the Penguins’ Marc-Andre Fleury ranks as the third-worst playoff goaltender since 1988 despite a winning (53-44) career playoff record. That’s because it’s easy to win games when you have Crosby scoring goals for you. Our support-neutral stat detects that Fleury really hasn’t been much good in the playoffs.
Lundqvist, meanwhile, ranks as the sixth-best playoff goaltender since 1988, while Holtby ranks ninth — despite being in just his fifth NHL season. After Wednesday night, one of them will have the chance to add to his legend, while the other will have plenty of time to watch Patrick Roy clips on YouTube.

May 12, 2015
There Is No ‘Blue Wall’
If you were browsing campaign coverage at this point in advance of the 1992 election, you’d be reading a lot about the Republicans’ impregnable “red wall.” OK — it wouldn’t have been called the “red wall” (the association of Republicans with red states and Democrats with blue states came about more recently). But you’d have been reading a lot about Republicans’ supposed “lock” on the Electoral College.
The argument was something like this. During the past six presidential elections, from 1968 through 1988, 21 states voted Republican every time. These included almost all states in the fast-growing West — most importantly, California and its trove of electoral votes — along with some wealthy, suburban states (Illinois, New Jersey and Virginia) and a couple of traditionally Republican states in New England (including Vermont).11
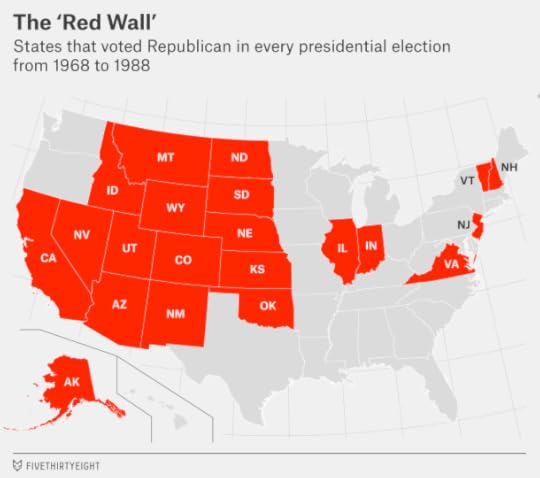
Together, these states accounted for 191 electoral votes. They weren’t quite enough to clinch victory for the Republicans, the argument went, but they put the GOP at a substantial advantage. The Democrats, who’d won only the District of Columbia every time, had to win more than three-quarters of the electoral votes from the remaining, “competitive” states.
You probably know what happened next. In 1992, Bill Clinton won nine Republican “lock” states, containing 118 of the red wall’s 191 electoral votes, en route to a 370-168 overall Electoral College victory. Four of the GOP “lock” states — California, Illinois, New Jersey and Vermont — haven’t voted Republican since. Democrats obliterated the red wall.
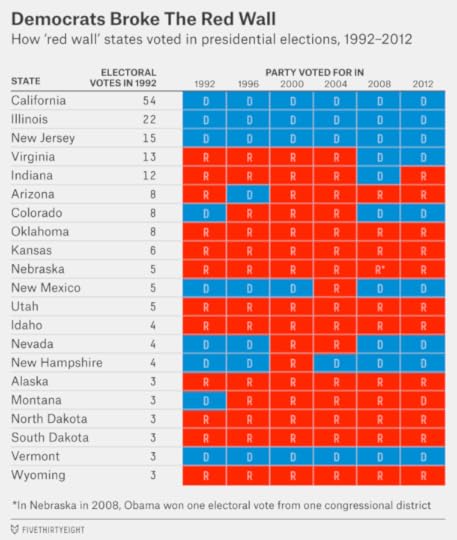
Nowadays, of course, it’s become common to hear talk about the “blue wall” — the set of 18 states that, along with the District of Columbia, have voted for the Democrat in each of the most recent six presidential elections, from 1992 through 2012. Together, they represent 242 electoral votes. Many pundits, ignoring the lessons of history, claim the “blue wall” or some close variation of it puts the Democratic nominee (likely Hillary Clinton) at a substantial advantage for 2016.
The error that these commentators are making is in attributing the Democrats’ recent run of success to the Electoral College. In fact, the Electoral College has been a minor factor, if it’s helped Democrats at all, and one probably best ignored until the late stages of a close presidential race.
But wait. Wasn’t Barack Obama’s margin in the Electoral College in 2012 — 332 electoral votes, to Mitt Romney’s 206 — awfully impressive given that he won the popular vote by only a few percentage points?
Actually, it was pretty much par for the course. The nature of the Electoral College is to accentuate small margins in the popular vote; Obama’s electoral vote tallies have been fine, but historically ordinary.
In the chart below, I’ve plotted the past century’s worth of presidential elections (from 1916 to 2012). The horizontal axis shows the Democrat’s margin of victory or defeat in the popular vote and the vertical axis how many electoral votes he received. (Totals are prorated to 53812 electoral votes, the current total.)13 Then I’ve drawn an “S”-shaped curve to show the long-term relationship.
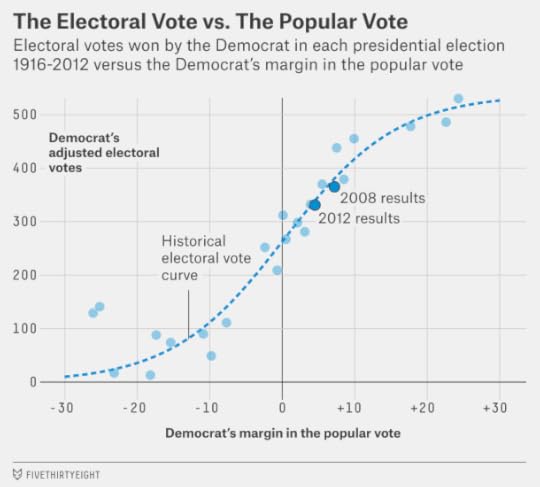
Based on the past century’s worth of data, you’d expect a Democrat who won the popular vote by 3.9 percentage points — as Obama did against Romney — to win about 330 electoral votes. That pretty much exactly matches Obama’s 332.
And you’d expect a Democrat who won the popular vote by 7.3 percentage points, as Obama did in 2008 against John McCain, to claim about 380 electoral votes. Obama won 365 that year instead. By comparison, when F.D.R. won the 1944 popular vote by 7.5 percentage points, he won the Electoral College 432-99.
So when commentators talk about the Democrats’ “blue wall,” all they’re really pointing out is that Democrats have had a pretty good run in presidential elections lately. And they have, if you conveniently draw the line at 1992 (it doesn’t sound so impressive to instead say Democrats have won five of the 12 elections since 1968). During that time, Democrats have won four elections pretty clearly, lost one narrowly and essentially tied the sixth. This has been evident from the popular vote, however. The one time the Electoral College really mattered — that was 2000, of course — it hurt the Democrats.
Republicans, in all likelihood, would have won by similar Electoral College margins if they’d done as well as the Democrats in the popular vote, casting all sorts of cracks in the blue wall. Suppose, for instance, that Romney, rather than Obama, had won the 2012 election by 3.9 percentage points. What would the map have looked like?

It would have looked pretty red. A 3.9-point Romney victory represents a 7.8-point swing from the actual result. So if the swing were distributed uniformly, Obama would have lost every state that he won by 7.8 percentage points or less. That means he’d have lost three “blue wall” states — Minnesota, Pennsylvania and Wisconsin — along with Colorado, Florida, Iowa, Nevada, New Hampshire, Ohio and Virginia.
An alternative technique is to assume that some states are more “elastic” than others, meaning that they contain more swing voters and are more responsive to national trends. Based on our previous calculations, for instance, New Hampshire is relatively elastic — its vote swings a lot — whereas Georgia (where there are a lot of black voters and a lot of conservative whites and not many voters in between) is less so.
But running the calculation that way changes the outcome of just one electoral vote. Romney would have narrowly won the rural, 2nd Congressional District of Maine, which like Nebraska awards one electoral vote to the winner of each congressional district, in addition to his other spoils. That would have put Romney on 332 electoral votes — exactly the total that Obama finished with, as it happens.
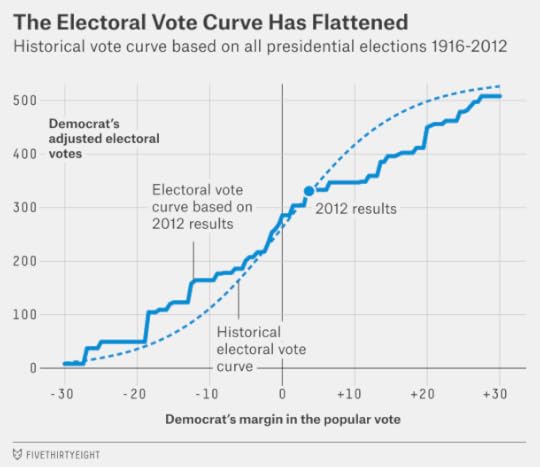
Where you’d see more evidence of an impregnable “blue wall” is in the event of an extremely lopsided election. Suppose that Democrats had lost the 2012 election by 18.2 percentage points, as Walter Mondale did to Ronald Reagan. In 1984, Mondale won only 13 electoral votes — 10 from his home state of Minnesota, plus D.C.’s three. In contrast, I estimate that a Democrat losing by that margin now would still carry states totaling 104 electoral votes: California, New York, Maryland, Vermont, Hawaii, and D.C. That’s a reflection of the fact that the country is far more geographically polarized than it once was.
But this cuts both ways. If Obama had won by Reagan’s 1984 margin, Republicans would still have won Texas, Tennessee, Alabama, South Carolina, Kentucky, Louisiana, Oklahoma, Arkansas, Kansas, Mississippi, Utah, Nebraska,14 West Virginia, Idaho, North Dakota, South Dakota and Wyoming — for 136 electoral votes. Neither party’s slate is close to a majority, however, and they mostly offset each other. (In the chart below, I’ve run this calculation for all possible outcomes, up to a 30-point win for either party.)
What about in the event of an extremely close election, instead of a lopsided one? Another election as close as 2000, for instance?
Obama would probably have won such an election in 2012. My method has him winning the Electoral College 285-253 in the event of an exactly tied popular vote, for instance.
But it would have had to be very close indeed. If Obama had lost the popular vote by just 1 percentage point, for instance, I have him losing the election 279-259, as highly elastic states like New Hampshire and Colorado would have fallen out of his column.
The net impact of this is minor. Our Election Day forecast in 2012 estimated that there was about a 5 percent chance that Obama would win the Electoral College but lose the popular vote (and about a 1 percent chance that Romney would do so).15 So if you want to argue that Hillary Clinton’s chances of winning the popular vote next year are 50 percent but that her Electoral College chances are more like 53 percent or 55 percent instead, go ahead — that’s probably about what the “blue wall” amounts to. (And even that advantage is tenuous, possibly reflecting Obama’s superior turnout operation in swing states — an edge that Clinton might or might not replicate.)
Hey, look: I can get carried away, too.16 If the 2016 election turns out to be close, we’ll be sweating the small stuff by October and November. The difference between a 50 percent and a 55 percent chance of victory for Clinton or Marco Rubio or whomever because of Electoral College dynamics will seem like a pretty big deal.
But for now? The Electoral College just isn’t worth worrying about much. If you see analysts talking about the “blue wall,” all they’re really saying is that Democrats have won a bunch of presidential elections lately — an obvious fact that probably doesn’t have much predictive power for what will happen this time around.
I’m not saying Clinton is doomed. Rather, I think the “fundamentals” point toward her chances being about 50-50, and I wouldn’t argue vigorously if you claimed the chances were more like 60-40 in one or the other direction. But Clinton is no sort of lock, and if she loses the popular vote by even a few percentage points, the “blue wall” will seem as archaic as talk of a permanent Republican majority.

May 10, 2015
The Rangers Are The San Antonio Spurs Of The NHL
It was Chris Kreider and Ryan McDonagh’s turn to play hero for the New York Rangers on Friday. Kreider’s goal to tie the game against the Washington Capitals with 1:41 left in regulation and McDonagh’s overtime winner saved the Rangers from elimination and sent the Eastern Conference semifinal back to Washington for Game 6 on Sunday.
The Rangers aren’t a bunch of scrappy underdogs, exactly. They reached the Stanley Cup Final last season. They won the Presidents’ Trophy this year by being the NHL’s best regular-season team. And they play in New York.
But they’re unusually well-balanced, running three or four lines deep with quality forwards and defensemen. They don’t have a superstar with the wattage of the Capitals’ Alex Ovechkin, however. What about their goalie, Henrik Lundqvist? He’s almost certainly the most popular Ranger, and he’s among the best goalies in the NHL. But Lundqvist started only 43 of the Rangers’ 82 regular-season games; he missed several weeks of action after being hit in the throat with a puck Jan. 31. Fortunately for the Blueshirts, Lundqvist’s backup, Cam Talbot, was just as effective.
Here’s one way to measure whether an NHL team is star-dominated, like the Capitals, or balanced, like the Rangers. Take what’s essentially each team’s first line — their top three forwards, top two defensemen and best goaltender — according to Hockey-Reference.com’s point shares (an all-in-one statistic that’s equivalent to wins above replacement) and divide the first line’s point shares by the total for all players on the team.
For the Capitals, the top forwards by point shares are Ovechkin (12.6), Nicklas Backstrom (8.1) and Marcus Johansson (5.4), the top defensemen are John Carlson (10.0) and Mike Green (8.6), and the top goalie is Braden Holtby (14.4), who’s been spectacular in both the regular season and the playoffs. Together, they accounted for 56 percent of the 104.7 point shares the Caps accumulated during the regular season. That’s a reasonably high figure.
For the Rangers, the top forwards are Rick Nash (11.4), Derek Stepan (7.0) and Derick Brassard (6.9), the top defensemen are McDonagh (7.3) and Kevin Klein (6.5), and the top goalie is Lundqvist (9.2). As good as they were, they were responsible for just 42 percent of the Rangers’ team point share total.
That’s a low figure. In fact, it’s the lowest for any Presidents’ Trophy winner1 in the NHL’s expansion era (since 1967-68):
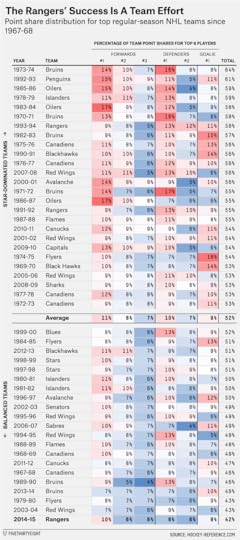
So, by this measure, the Rangers are one of the most balanced great teams ever — the hockey equivalent of the NBA’s San Antonio Spurs or the “Bad Boys” Detroit Pistons. The second-most-balanced team was the 2003-04 Detroit Red Wings, although they were something of an unusual case, with a combination of rising stars (Pavel Datsyuk, Henrik Zetterberg) and waning ones (Steve Yzerman, Brett Hull, Brendan Shanahan).
The list of the most star-dominated teams will come as no surprise. It includes Wayne Gretzky’s Edmonton Oilers, Mario Lemieux’s Pittsburgh Penguins, and the early 1970s Boston Bruins, led by Bobby Orr and Phil Esposito. (The 1973-74 Bruins have the top slot; 64 percent of their point shares come from their top line.) The 1993-94 Rangers, who won both the Presidents’ Trophy and the Stanley Cup, also had a top-heavy roster, with Mark Messier, Adam Graves, Brian Leetch and Sergei Zubov.
Unfortunately for the Rangers, neither the star-dominated nor the well-balanced Presidents’ Trophy winners have had all that high a success rate at turning regular-season success into a Stanley Cup. So they’ll have to find a few more heroes to survive against Washington and bring the Stanley Cup back to New York.

May 7, 2015
Video: It’s Election Day In The U.K.
We’ve been gearing up for weeks to cover the vote in Great Britain and Northern Ireland and now the election is here. Below, FiveThirtyEight’s Nate Silver, Mona Chalabi and Jody Avirgan discuss Thursday’s parliamentary election, how U.K. voters are strategically weighing their range of choices, and what our polling model predicts.
Be sure to follow our coverage all day:
FiveThirtyEight’s general election predictions.Is our model right?Nate Silver on tactical voting and the other factors that make U.K. voting unique.Mona Chalabi’s glossary of U.K. politics.Our live blog starts at 5 p.m. EDT, 10 p.m. BST.
Nate Silver's Blog

- Nate Silver's profile
- 729 followers

