
Nate Silver's Blog, page 150
August 7, 2015
Donald Trump Won’t Win A War Against Fox News
Donald Trump is a master at playing off the public’s distrust for the news media, portraying every negative story as a needless distraction from his quest to “Make America Great Again.” You’d think this strategy would become tiresome, but there’s a market for it, especially among Republicans, who are more distrustful of the mainstream media than Democrats.
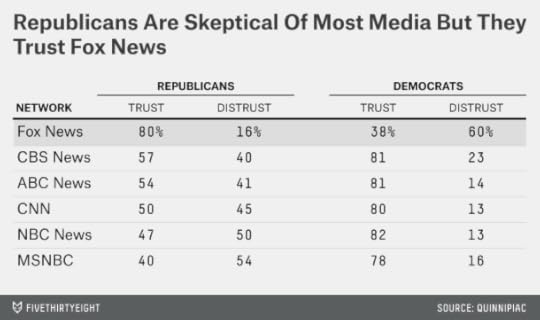
But one exception to this distrust is Fox News, which hosted the first GOP debate in Cleveland last night. According to a March Quinnipiac poll, 80 percent of Republicans say they trust Fox News either “a great deal” or “somewhat,” as compared to 16 percent who say they trust the network “not so much” or “not at all.” Those numbers are almost identical to the high marks Democrats give MSNBC and the other news networks.
So a Republican complaining about unfair coverage from Fox is like a Democrat complaining she’s been thrown under the bus by MSNBC (or at least anyone at MSNBC other than Joe Scarborough). Regardless of the merits of the case, the plea is likely to fall on deaf ears.
But that didn’t stop Trump from attacking Fox after last night’s debate. Trump told reporters that Fox anchor and debate moderator Megyn Kelly had “behaved very badly” and that the questions he received were “inappropriate.” One of Trump’s lawyers, Michael Cohen, went a step further, alleging the debate and the post-debate coverage had been a “setup” by Fox News.
A total setup by @FrankLuntz and #FOXNEWSDEBATE to try to lower #Trump2016 high poll numbers. American people will not fall for your tricks.
— Michael Cohen (@MichaelCohen212) August 7, 2015
I personally thought Kelly and her co-moderators did an excellent job with the debate. They were tough on Trump, but they were tough on many of the candidates, and candidates like Trump who are polling as frontrunners often receive somewhat more scrutiny.
So let me put this very carefully. It might not be paranoid of Cohen to worry that there are powerful forces out to get his boss. Consider the case I made yesterday for why Trump’s candidacy is eventually doomed: Most importantly, the Republican Party is vehemently opposed to his nomination, a wee bit of a problem for Trump since it’s the Republican Party’s nomination to bestow. Yes, there are rules that govern the nomination process, but it’s the Republican Party that establishes the rules, interprets the rules and, if it absolutely had to, could change the rules. In the (unlikely) event that Trump survived the campaign long enough to have a mathematical chance at the nomination, influential members of the Republican Party would be expected to coordinate — some might even say conspire — to deny it to him.
The party has a lot of other tricks to deploy before it comes to that, however, including working to influence the tenor of the media coverage of the campaign. Does that mean Fox News is part of the Republican Party’s coordination process? That’s a complex subject. It’s not quite that Fox News is taking orders from the GOP, so much as that they’re an unofficial part of the GOP as a political scientist might (broadly) define the party. Furthermore, large media organizations like Fox News are complex places. There are reports of disagreements between Fox News president Roger Ailes and parent company News Corp.’s executive chairman, Rupert Murdoch, about how the network should cover Trump, for instance. There are undoubtedly disagreements among various reporters, anchors and producers within Fox News, which variously produces excellent nonpartisan journalism, explicitly partisan opinion shows and a lot of things in between.
As a Republican candidate for president, though, you’d much rather have Fox News on your side than not. The 16 percent of Republicans who distrust the network might be really, really into you, but they aren’t going to be the basis for a winning campaign.


August 6, 2015
Donald Trump’s Six Stages Of Doom
The recent polling surge by Donald Trump has launched a thousand stories about Trump’s “unprecedented campaign.” But it’s nothing all that unusual: Similar surges occurred for almost every Republican candidate four years ago, including Herman Cain, Michele Bachmann, Rick Santorum and Newt Gingrich (twice).
History’s lesson isn’t necessarily that Trump’s candidacy will go bust tomorrow, however. There are plenty of examples of fringe or factional candidates who held on to their support for much longer than the month or two that Cain and Bachmann did. Sometimes, they did well enough in Iowa or New Hampshire, or even won them. Pat Buchanan claimed New Hampshire in 1996, for instance, while Mike Huckabee won Iowa in 2008. Steve Forbes took 30 percent of the Iowa vote in 2000.
The lesson, rather, is that Trump’s campaign will fail by one means or another. Like Cain, Bachmann and Gingrich, Buchanan, Huckabee and Forbes came nowhere close to winning the Republican nomination.
If you want absurd specificity, I recently estimated Trump’s chance of becoming the GOP nominee at 2 percent. How did I get there? By considering the gantlet he’ll face over the next 11 months — Donald Trump’s Six Stages of Doom:
Stage 1: Free-for-allWhen it happens: This is the stage we’re in now; it will continue through the next couple of months.
Potential threat to Trump: Increased attention to other GOP candidates.
One of the occupational hazards for those of us who write about politics for a living is a kind of time dilation. If you’re charged with filing several campaign stories a week, then two or three weeks can seem like an eternity.
But most Americans have other things on their minds right now. Paying the bills. Finally taking that vacation. Baseball. They’re not really paying a lot of attention to the campaign. Based on historical patterns of Google search traffic, the level of public interest in the primary campaign right now is less than one-tenth as high as it will be later in the cycle.
This is why it’s absurd to focus on how Trump’s polling is changing from day to day. When Trump made his idiotic comments about John McCain’s military service a few weeks ago, there were a few news outlets like the New York Post who suggested it might bring about his immediate demise. We were skeptical of that conclusion at FiveThirtyEight. For a variety of reasons, Trump isn’t affected much by negative media coverage — it may even help him. But a lack of media coverage might be a different story.
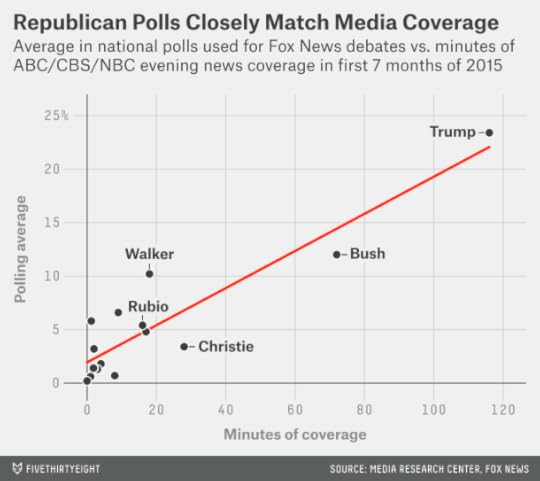
If, like most Americans, you’ve been paying only passing attention to the GOP campaign, then pretty much the only candidate you’ll have been hearing about is Trump. According to data compiled by the Media Research Center, Trump has received more network news coverage than Jeb Bush, Scott Walker and Marco Rubio combined. So if a pollster calls you and rattles off 17 names, and there are six or seven candidates you like well enough, which name might you mention when asked for your first choice? Possibly Trump, since his name will be top-of-mind. There’s a near-perfect correlation, in fact1 between how much news coverage a candidate has received and where they rank in recent national polls:
The causality here is murky. Do candidates receive more news coverage because they’re polling well? Or do they poll well because they receive more news coverage? Undoubtedly, there’s some of both, which creates the possibility of a feedback loop.
But the circuit could be broken once there’s some news about another candidate. Every Republican on stage will have the opportunity to make news in the debate tonight, for instance. It’s possible we’ll still be talking about the Trump surge in a few weeks, but it’s also possible that we’ll be contemplating the Ben Carson or Ted Cruz or Chris Christie surge instead.
Stage 2: Heightened scrutinyWhen it happens: Mid-November or thereabouts, as voters up their level of attention to the campaign
Potential threat to Trump: Polling support doesn’t translate to likely, more-informed voters.
In the general election, Labor Day is the traditional benchmark when there’s a substantial acceleration of public interest in the campaign. I’m not sure there’s quite the same demarcation in the primaries, but, in my experience, the timbre of the race will have changed by Thanksgiving or so. Voters, especially in the early voting states, will be doing less “window shopping” and instead will be thinking about who they might cast a ballot for. The polls will change too, starting to home in on what they deem to be “likely voters.” There’s some evidence that Trump is over-performing among “low-information voters.” By November, their ranks will decrease: They’ll either have become more informed, or they’ll be screened out by pollsters because they aren’t likely to vote.
Stage 3: Iowa and New HampshireWhen it happens: Feb. 1 and Feb. 9, based on the provisional calendar.
Potential threat to Trump: Middling performance in one or both states, either in an absolute sense or relative to polls.
Eventually, we’ll have some real votes to test the polls against. The odds are that the polls will be pretty far off in the first few states; they’re historically not very accurate in primaries and caucuses. One reason for this, perhaps the principal one, is because turnout is hard to predict. Trump has built some semblance of an organization in Iowa (he has less of one in New Hampshire), but it probably won’t be the best in the state at persuading voters to turn out.
Despite the relatively poor track record of polls in Iowa and New Hampshire, however, they have a major influence on how the results are interpreted by the press. Historically, the candidates who get the most favorable media coverage and receive the biggest “bounces” out of Iowa and New Hampshire are not those who perform the best in an absolute sense but instead those who beat the media’s expectations. It’s possible that Trump will master expectations management between now and Iowa, but, given his tendency to trumpet every favorable poll, he could also set himself up for a fall. A Trump who finishes in third place with 14 percent of the vote in Iowa won’t have much to brag about.
Stage 4: WinnowingWhen it happens: mid-February through mid-March
Potential threat to Trump: Other candidates drop out, and remaining ones surpass Trump.
But some candidates with parallels to Trump have done perfectly well in Iowa and New Hampshire. In fact, there’s been about one such Republican, on average, in every contested election cycle. Below, I’ve listed past Republican candidates who (i) had less than 5 percent of the party’s endorsement points as of the date of the Iowa caucuses, meaning they had very little support from the party establishment, but (ii) won at least 20 percent of the vote in Iowa anyway. There are six of these candidates, ranging from rabble-rousers like Buchanan to religious-right candidates like Huckabee, to another self-funded billionaire in Forbes.
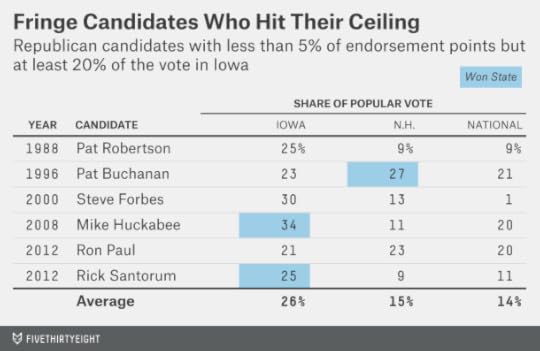
The problem is that they didn’t go very far from there, winning an average of just 14 percent of the popular vote across all the remaining primary and caucus states that year. Even a candidate who did a little better than that, retaining 25 or 30 percent of the vote, would soon be bypassed as the rest of the field consolidated down to one or two other establishment-backed alternatives. This is especially likely to be a problem for Trump. Contrary to what you may have read elsewhere, he’s actually not all that popular among Republicans. His favorability ratings among Republicans have improved since before he declared himself a candidate2 but remain in the bottom half of the GOP field and well below the standard of candidates who have been nominated in the past.
We’ll handle the final two stages together:
Stage 5: Delegate accumulationWhen it happens: mid-March through final primaries in June
Potential threats to Trump: Poor organization in caucus states, poor understanding of delegate rules, no support from superdelegates.
When it happens: June through Republican National Convention, July 18-21
Potential threat to Trump: The Republican Party does everything in its power to deny him the nomination.
If Trump makes it past Stage 4, we’ll have to consider his campaign successful, up to a point. He’ll have gotten further than any similar candidate has in the past. But he’d still be a long way from winning the nomination, and the final two stages might be his hardest yet.
The Republican Party’s delegate selection rules are straightforward in some states but byzantine in others, especially in caucus states where delegates are sometimes not formally pledged to the candidate who apparently earned their support on election night. Furthermore, about 7 percent of delegates to the RNC are party leaders — what Democrats would call “superdelegates” — who are usually not bound by the results of the popular vote in their states at all.
This introduces a little bit of slack into the system. It works in favor of establishment-backed candidates, or those who have an intricate understanding of the delegate rules. And it works against candidates like Trump.
Regular FiveThirtyEight readers will be familiar with “The Party Decides” paradigm of the nomination process. It posits that the nominee represents the consensus choice of influential members of the party, and that rank-and-file voters serve mostly to vet and validate the candidates in the event of a close call.
Much of the party’s influence consists of what you might call “soft power,” the ability to influence outcomes by persuasion rather than coercion. But the party also has some “hard power”: It literally makes the rules. It can rule against candidates it doesn’t like in the event of delegate-counting disputes. It can probably even change the rules midstream. There isn’t a lot of precedent to worry about violating, since it’s been 40 years since Republicans came close to a brokered convention.
If Trump made it this far, the Republican Party would go to extraordinary lengths to avoid nominating him. In “The Party Decides” view, parties are basically looking for two things from their nominees: They want them to be reliable (meaning, they can be counted on to enact the Republican agenda once in office), and they want them to be electable (meaning, they can win in November). It’s hard to think of a candidate who does worse on those two measures than Trump. He’s exceptionally unpopular among independent voters. But he also has a checkered political past that includes once having supported abortion rights and universal health care. For the Republican Party, he’s the worst of all possible worlds.
So, how do I wind up with that 2 percent estimate of Trump’s nomination chances? It’s what you get3 if you assume he has a 50 percent chance of surviving each subsequent stage of the gantlet.4 Tonight’s debate could prove to be the beginning of the end for Trump, or he could remain a factor for months to come. But he’s almost certainly doomed, sooner or later.
Check out our live coverage of the first Republican debate.

August 4, 2015
Did Your Team Blow It At The Trade Deadline?
The Blue Jays bought, the Tigers sold and the Mets couldn’t make up their mind. Baseball’s trade deadline, which passed last Friday afternoon, is all about balancing the present against the future. Whether they’re buyers or sellers (or just renters), all deadline-dealers have to evaluate both their World Series chances for the current season and where they will be in the “success cycle” going forward. Blunders in either type of assessment can haunt a franchise for years.
It’s a lot to deal with, and not every team manages the process perfectly. To help model these deadline decisions, we developed a metric we’ve nicknamed the “Doyle Number.” It’s named after the infamous 1987 trade in which the Detroit Tigers sent future Hall of Famer John Smoltz, then a 20-year-old prospect, to the Atlanta Braves for 36-year-old Doyle Alexander.
In principle, the definition of the Doyle Number is simple. It represents the rate at which, at the trade deadline, teams should be willing to trade talent in the future for talent in the current season in order to maximize the total number of World Series that it wins. For instance, if a team has a Doyle Number of 2, that means buying a win’s worth of talent in the current season1 at the trade deadline is worth giving up two wins in the future. By contrast, a team with a Doyle Number of 0.25 should only be willing to give up one-quarter of a future win for a win now. Not only should such a team not buy wins at that price — it should probably sell veteran talent at the deadline instead, in exchange for prospects.
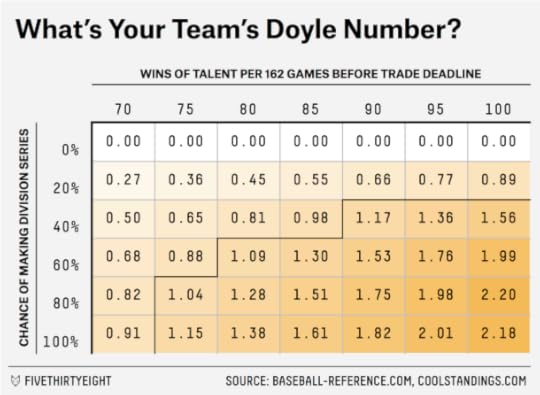
The Doyle Number is calculated based on a team’s estimated “true talent,” a concept that’s equivalent to its projected winning percentage for the rest of the year, as of the trade deadline.2 The Doyle also includes the team’s odds of making the divisional playoff round.3 In practice, the calculation gets slightly involved, so we’ve reserved most of the methodological discussion for the footnotes.4
But it’s important to pay attention to that two-word phrase we used above: “World Series.” In Doyle, it’s all about the rings! A lot of previous analyses, including some that we’ve published ourselves, have focused on a team’s chance of making the playoffs. If that’s your main goal, you’ll eventually encounter diminishing returns: A team with 100-win talent as of the trade deadline is all but certain to make the playoffs, for instance, so adding more talent won’t accomplish very much.
Winning a championship is another matter, however. It’s hard for any team to win the World Series, but it’s much harder for a team, like the 2005 San Diego Padres, that sneaks into the playoffs with a league-average roster. Just as in the NCAA basketball tournament, relatively modest talent differentials can compound over several playoff rounds. A team with 80-win talent has only about a 5 percent chance of winning the World Series, conditional on making the divisional playoffs; a team with 90-win talent has a 12 percent chance. A team with 100-win talent has a 24 percent chance.
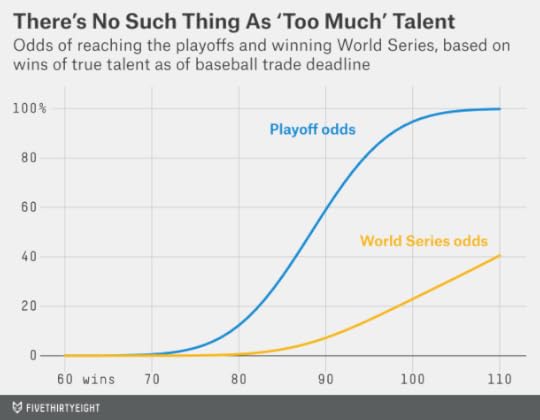
One of the biggest lessons of Doyle, in fact, is that adding the talent to win once you’re in the playoffs is probably more important than picking up enough talent to merely get there. The point at which adding an extra win of talent stops accelerating a playoff team’s World Series odds upward is about 118 wins — a level of true talent reserved for the best All-Star teams ever. Realistically, you can never add too much talent if you’re gearing up to win a World Series.
But let’s see how this plays out in practice. Below, we’ve listed the Doyle Number for the 30 major league teams as of the trade deadline last week.
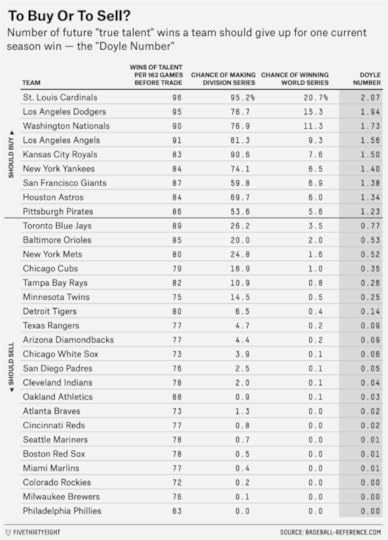
The highest Doyle Number (2.07) belongs to the St. Louis Cardinals, who are probably the best team in baseball, with more than 96 wins of talent and a 21 percent likelihood of winning the World Series. Even though St. Louis already had a completely stacked roster and a very high likelihood of making the division series without any trades, the increase in championship probability upon entering the MLB postseason would have made even a lopsided long-term trade worth it. The Cardinals should have been prepared to give away as many as two wins of future talent to get one win at the trade deadline.5
That the Cardinals (and the Los Angeles Dodgers and Washington Nationals) top the Doyle rankings runs a bit counter to the conventional wisdom, which says that less-talented teams have the most to gain from a big splash at the trade deadline. However, as long as a team’s Doyle Number is above 1, they’d be better off buying than selling. That’s why Doyle also would have recommended a classic buyer’s mentality for the Kansas City Royals, New York Yankees and Houston Astros — three teams that have found themselves in the midst of far better seasons than would be expected from their talent. This suggests the Royals were right to go for broke in the short term; for them, each marginal win of talent added in 2015 is worth forsaking about 1.5 wins of future talent.
Of course, while we’ve focused exclusively on trade-deadline buyers thus far, other teams had to decide whether they’d be better off selling current assets for future wins. The Philadelphia Phillies, to take an extreme example, have literally no use for extra talent in 2015 because they’re all but eliminated from the playoffs. Therefore, their Doyle Number was 0.00.
The Detroit Tigers had a Doyle Number of just 0.14, which would heavily recommend selling. In fact, the Tigers dealt stars David Price and Yoenis Cespedes at the deadline; it didn’t make manager Brad Ausmus happy, but Doyle was pleased.
Indeed, selling is almost always right for teams on the outer fringes of playoff contention (before the deadline, the Tigers had only about a 7 percent chance of reaching the divisional playoffs). The average team begins the regular season with a 27 percent chance of making the divisional playoffs. If a team’s playoff odds are lower than that as of the trade deadline, it should usually sell.
The in-between cases can be tricky, however. Despite having a talented roster, the Toronto Blue Jays entered the trade deadline with only about a 26 percent chance of making the playoffs. But they probably added the most talent at the deadline of any team in baseball in the form of Price and Troy Tulowitzki, sending numerous prospects packing.
Their Doyle Number of 0.77 is slightly below 1, which might initially suggest that they made the wrong move. In fact, however — and we’ve avoided introducing this complication until now — a team’s Doyle Number varies based on how many wins of talent it might add or subtract. Teams like the Blue Jays actually enter the trade deadline with a ‘U’-shaped curve like the one you see below.
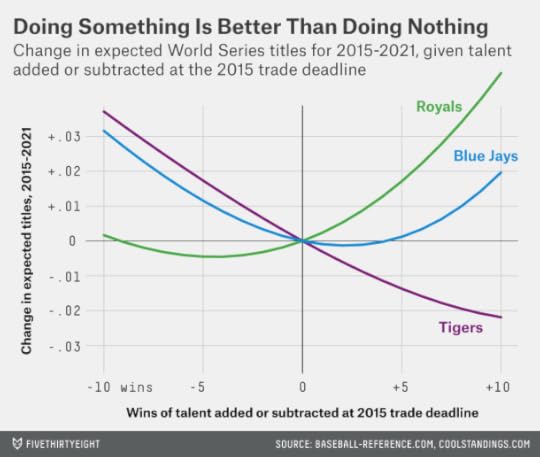
We know this is getting abstract, but it has a really important baseball implication. It means that for a team like Toronto, the worst strategy is standing pat. In terms of maximizing its total number of World Series championships, it should either add talent at the deadline or punt on the season and play for future years. By Doyle’s logic, in fact, teams should be going “all-in,” moving as aggressively as possible in one or the other direction at the deadline. Adding two stars, like the Jays did with Tulo and Price, is better than one.6 This also applies to the Mets, who, after getting cold feet on Carlos Gomez, eventually did deal for Cespedes. Doyle’s complaint might be that the Mets weren’t aggressive enough: They could have added a Cespedes for the rest of us and a star second baseman too!
The Doyle system admittedly represents a vast simplification compared with all the considerations that could be included in such a model. Future iterations might take into account factors like a team’s financial situation and the quality of its minor-league system, among other things.7 But it at least offers a broad set of guidelines upon which to judge a front office’s decision-making process.
While Doyle doesn’t vindicate every dubious decision — the Tigers had a 34 percent chance of making the playoffs on the date they traded for Alexander in 1987, which would have made for a close call — it suggests that teams should often be quite aggressive at the deadline. A team needs to be honest with itself about whether its World Series chances are legitimate, but if they are, it might never get a better chance at a championship.

August 3, 2015
Joe Biden’s Schrödinger’s Cat Campaign
Pundits — bored with the prospect of a Hillary Clinton coronation — have conjectured for months that Joe Biden might run for president, but the vice president has remained on the sidelines. So you’d be right to indulge some skepticism toward the latest round of speculation about Biden running.
But let’s consider Biden’s position from our outsider’s view. Does it make sense for Biden to enter the race? Not so much for Biden himself, but does it make sense for the Democratic Party to have Biden run? That’s the relevant question from the “The Party Decides” paradigm, which would claim that Biden’s candidacy would be futile unless he can win the backing of a substantial constituency of influential Democrats.
The problem for Biden is that under this “The Party Decides” view, the Democratic Party has already decided in favor of Clinton. As measured by her level of endorsements, Clinton has more support at this stage of the primary campaign than any Democrat in the modern era.8
Rank-and-file Democratic voters love Clinton too. Her favorability ratings within her party range from 75 percent to 85 percent, depending on the poll, which are among the highest intraparty ratings ever for a non-incumbent candidate. (Most of the recent slippage in her ratings has come from independent voters instead of Democrats.)
Oh, and Clinton has already raised $68 million.
These indicators of party support don’t tell us very much about what sort of general election candidate Clinton might be.9 But you’d have to lose the forest in a field of cherry-picked trees to suggest that Clinton is in all that much trouble for the nomination. Betting markets put her chances at about 80 percent.
Furthermore, it’s not clear what advantage Biden would offer Democrats relative to Clinton. As The New Yorker’s Ryan Lizza put it on Sunday:
What is the case for Biden over HRC?
Youth?❌
Gender?❌
Broad party support?❌
Lefty cred?❌
Money?❌
Superior campaigner?❌
Makes no sense.— Ryan Lizza (@RyanLizza) August 2, 2015
As Lizza intimates, the demographics don’t work in Biden’s favor. In a primary electorate that’s 55 percent to 60 percent female, he’d deny Democrats the opportunity to nominate a woman for the first time. And while Clinton isn’t new to the political scene, Biden is five years older than her.
Nor is it apparent what message Biden would campaign on, since he and Clinton have extremely similar policy positions and were both members of President Obama’s administration. Biden isn’t a natural fit for Sen. Bernie Sanders’s constituency either. Instead, when he and Clinton were in the Senate together, Biden usually rated as being slightly more conservative than Clinton.
What about general election strength? You’d have to read the evidence selectively to conclude that Biden has any edge on Clinton. General election polls don’t mean much at this stage, but Clinton generally performs better than Biden in head-to-head polls against prospective GOP opponents. And while Clinton’s favorability ratings have worsened, Biden’s are generally no better even though he hasn’t received the same degree of media scrutiny lately.

INTERACTIVE: We’re tracking 2016 presidential primary endorsements. Check out the most important race before the actual race »
So “The Party Decides” view would imply that Biden shouldn’t run, right? Not so fast. What Biden offers Democrats is a sort of insurance policy. What if Clinton is linked with some new, very serious scandal? What if she has a health issue? What if the Democratic Party suddenly turns against her?
None of this is likely. To repeat: Clinton is doing very well in the nomination race. But presidential nomination contests don’t provide for the same sort of astronomical certainty that you get from the sun or the moon or the tides. The sample size of competitive primaries in the reform era (since 1972) is relatively small, and the processes that govern them are complex, probably more complex than in the general election. I’d take the “over” on the 80 percent chance that betting markets give Clinton to win the nomination, but that doesn’t mean it’s 100 percent sure.
Should one of those wild-card scenarios transpire, Biden is probably the Democratic establishment’s best choice by process of elimination.
Sanders, although in second place in the polls, has received almost no support from the party establishment. That’s for good reason. Candidates as far to the left (or the right) as Sanders have historically made for losing general election nominees. He’s also had trouble winning the support of nonwhite voters, an enormous Democratic constituency, and his unwillingness to accept super PAC money, noble though it might be, would put him at a major financial disadvantage. Sanders is not even officially a Democrat, something primary voters probably won’t care about, but party elites might.
What about former Maryland Gov. Martin O’Malley? He’d make for a more traditional nominee, but his campaign has gotten off to such a slow start that he could plausibly lose to Sanders if Clinton bowed out of the race.
There are other Democrats, such as Sen. Elizabeth Warren, who are not yet running but could generate significant enthusiasm within the party base. But they’d be entering the race at an awfully late date. Raising money, hiring staff, building relationships with key constituencies within your party and learning how to navigate the media shit-storm are skills that take months to become competent at and years to master. Just ask Fred Thompson.
Then there’s Biden. He’s run for president or vice president several times and has been vetted by his party and the national media, and if he needs a staff, he can borrow from his White House allies as a starter kit.
But here’s the dilemma: The longer Biden waits to officially enter the race, the more of a problem his late start would become. He couldn’t easily make up for lost fundraising opportunities, for example. And at some point — likely in mid-November — he’d begin to encounter logistical challenges, like having failed to meet the filing deadline in New Hampshire and other early states.
At the same time, Biden has little rationale to enter the race this late except as a break-glass-in-case-of-Clinton-emergency candidate. His formal entry into the race would imply that Clinton’s campaign was under serious threat. The party establishment, most of which is extremely supportive of Clinton, wouldn’t like the signal that sends out.10
So instead, Biden is left running a Schrödinger’s cat campaign, neither wholly in the race or wholly out of it. That helps to explain why this past weekend’s press coverage of Biden was awfully strange. Maureen Dowd, a columnist who does not ordinarily break news, asserted that Biden was “talking to friends, family and donors about jumping in” the race and included intimate detail about conversations between Biden and his sons, but provided no source for her reporting and buried it beneath a belabored anecdote comparing Hillary Clinton to New England Patriots quarterback Tom Brady. Other accounts, such as those from the The Washington Post and The Associated Press, were full of qualifications and relied heavily on anonymous or opaque sourcing.
But one detail that made it into several of these stories is that he plans to wait until September to make any decision. Although there are other plausible explanations,11 the simplest one is that Biden is biding his time, waiting as long as possible to see if Clinton is in more trouble than she appears to be right now.

July 29, 2015
Donald Trump Is The Nickelback Of GOP Candidates
Despite what you may have read elsewhere — or heard from the man himself — Donald Trump is not all that popular with Republican voters. Sure, he’s in first place in many polls. But Trump is near the back of the pack by another important measure.
In the chart below, I’ve taken an average of favorability ratings from seven polls of Republican voters that were conducted wholly or partly after Trump made his comments about John McCain on July 18. They include national polls from CNN, Public Policy Polling and YouGov, along with polls of Iowa and New Hampshire from each of Marist College and Monmouth University.1

On average in these polls, Trump’s favorability ratings among Republicans are barely better than break-even: 47 percent favorable and 43 percent unfavorable. Among the 17 Republican candidates, Trump’s net favorable rating, +4, ranks 13th, ahead of only Chris Christie, Jim Gilmore, Lindsey Graham and George Pataki.
And yet, in these same polls, Trump is the first choice of an average of 20 percent of Republican voters — the highest in the field, ahead of Scott Walker (14 percent) and Jeb Bush (12 percent).
What’s going on? On Twitter yesterday, I likened Trump to the band Nickelback: disliked by most people but with a few very passionate admirers. The best contrast to Trump is Marco Rubio: like a “lite rock” radio station, he’s broadly acceptable but few people’s favorite. Rubio’s favorable ratings are much higher (56 percent) than The Donald’s, and his unfavorable ratings are much lower (16 percent). But only 6 percent of Republicans list Rubio as their first choice.
The Nickelback analogy isn’t perfect. As the Republican strategist Patrick Ruffini points out, the bulk of Trump’s support in polls isn’t necessarily coming from passionate Republicans but rather from “low-information voters” who may not turn out in Iowa and New Hampshire. That doesn’t mean none of Trump’s support is real, however. There’s another factor that helps him: He’s highly differentiated from the rest of the Republican pack.
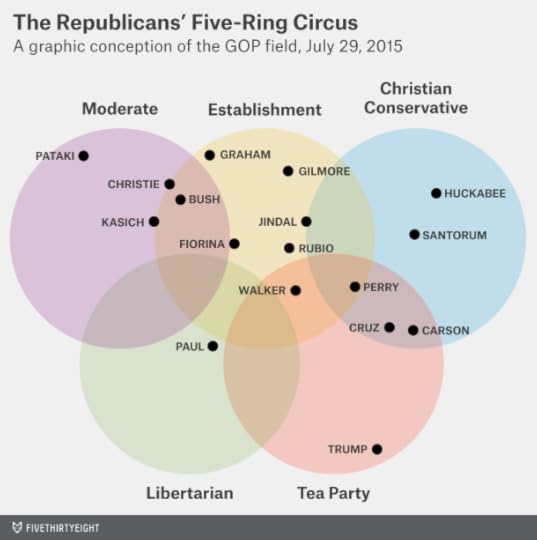
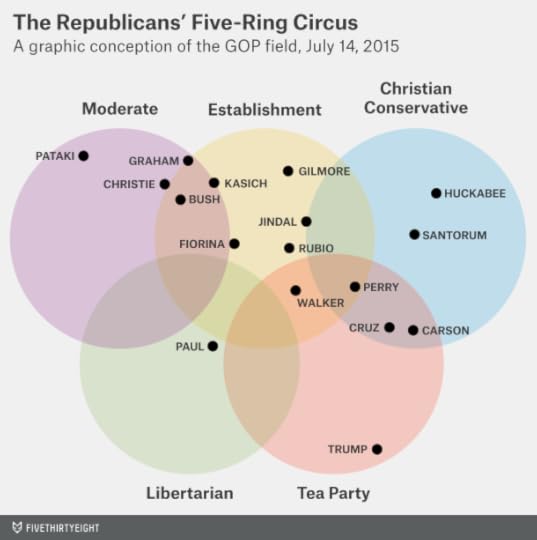
Real Clear Politics’ David Byler, analyzing the text of Republican candidate announcement speeches, found that Trump was bringing up far different concepts and issues than any other Republican, including his personal wealth, business success and ability to negotiate deals. FiveThirtyEight’s own, more subjective way of analyzing the Republican candidates — what we call the “five-ring circus” — comes to a similar conclusion. Given the ever-changing grab-bag of issues that he’s campaigning upon, Trump is hard to classify, but his stylistic flourishes (if not his background) probably place him closest to the tea party or populist wing of the Republican Party. Either way, there’s no one else quite like him.
Rubio, by contrast, has lots of competition. He’s well-liked by voters across different constituencies of the Republican Party. That’s potentially a good position, since the nomination race has historically been a consensus-building process. But he isn’t necessarily anyone’s first choice. Voters who are just slightly to Rubio’s left may prefer Jeb Bush, while those just slightly to his right may prefer Scott Walker. It could work out for Rubio, but he also runs the risk of being this election’s version of Tim Pawlenty, a candidate whose resources dry up because he fails to differentiate himself from the pack early enough.
I’ve seen a lot written about how these primaries are unlike anything we’ve seen before. What’s undeniably different is that Republicans have an unprecedentedly broad and deep group of candidates. That means it might take longer to winnow down the field to one or two establishment-backed choices.
It isn’t so unusual, however, to see a candidate like Trump polling at 20 percent. That happened for several Republican candidates in 2012, including Newt Gingrich, Michele Bachmann and Herman Cain. While their support mostly faded before the first states voted,2 there have been other occasions when factional candidates such as Pat Buchanan, Pat Robertson or Ron Paul held on to their support through Iowa and New Hampshire.
The problem for these candidates is that support never grew much beyond 20 or 30 percent of the vote, so they were lapped by others. The same is likely to happen this year, eventually. Suppose that Rubio bows out of the race, for instance. Where is his 6 percent of the vote likely to go? Probably to Bush or Walker before it goes to Trump. Relatively few voters say Trump is their second choice,3 and many Republicans dislike him. The same goes for Christie’s 3 percent or Kasich’s 4 percent. That will add up for someone. (Candidates who fall within the establishment “ring” of our circus diagram have 53 percent of the vote in polls already.)
I don’t mean to suggest that favorability ratings are foolproof. Like the first-choice numbers, they can fluctuate. Before Trump officially declared for the presidency last month, his favorability ratings among Republicans were execrable. They improved after he announced his candidacy but have since slipped back to mediocre (well below the standard of candidates who have won their party’s nomination in the past).
But if you’re going to imply that a candidate is popular based on their receiving 20 percent of the vote, you ought to consider what the other 80 percent thinks about him. Most Republicans who don’t plan to vote for Trump are skeptical of him instead.

July 20, 2015
Donald Trump Is The World’s Greatest Troll
“A troll,” according to one definition, “is a person who sows discord … by starting arguments or upsetting people … with the deliberate intent of provoking readers into an emotional response or of otherwise disrupting normal on-topic discussion.”
The goal of the troll is to provoke a reaction by any means necessary. Trolls thrive in communities that are open and democratic (they wouldn’t be invited into a discussion otherwise) and which operate in presumed good faith (there need to be some standards of decorum to offend). Presidential nomination contests are highly susceptible to trolling, therefore. Access is fairly open: There’s no longer much of a filter between the campaigns, the media and the public. And it’s comically easy to provoke a reaction. How many times between now and next November will we hear that a candidate’s statement is “offensive,” whether or not it really is?
Trolls operate on the principle that negative attention is better than none. In fact, the troll may feed off the negative attention, claiming it makes him a victim and proves that everyone is out to get him.
Sound like any presidential candidates you know?
There’s a notion that Donald Trump’s recent rise in Republican polls is a media-driven creation. That explanation isn’t entirely wrong, but it’s incomplete. It skims over the complex interactions between the media, the public and the candidates, which can produce booms and busts of attention. And it ignores how skilled trolls like Trump can exploit the process to their benefit.
Let’s look at some data. In the chart below, I’ve tracked how media coverage has been divided among the Republican candidates over roughly the past month (the data covers June 14 through July 12), according to article counts on Google News. In turn, I’ve shown the share of Google searches for each candidate over the same period. The data was provided to FiveThirtyEight by Google but should closely match what you’ll get by searching on Google Trends or Google News yourself.
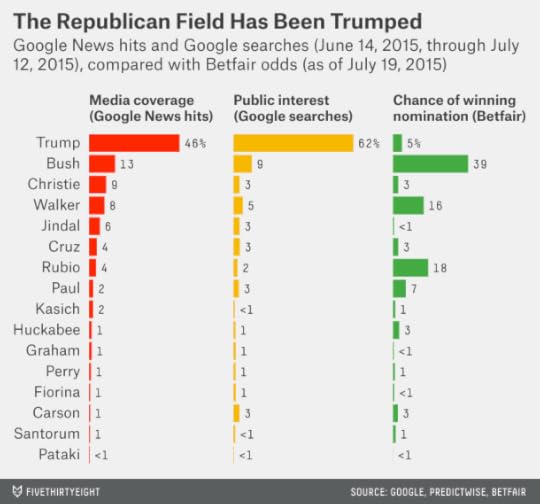
Even before his imbecilic comments about Sen. John McCain this weekend, which came too recently to be included in this data, Trump was receiving far more media attention than any other Republican. Based on Google News, 46 percent of the media coverage of the GOP campaign over the past month was directed toward Trump, more than for Jeb Bush (13 percent), Chris Christie (9 percent), Scott Walker (8 percent), Bobby Jindal (6 percent), Ted Cruz (4 percent) and Marco Rubio (4 percent) combined.
And yet, the public is perhaps even more obsessed with Trump. Among the GOP candidates, he represented 62 percent of the Google search traffic over the past month, having been searched for more than six times as often as second-place Bush.
So if the press were going purely by public demand, there might be even more Trump coverage. Instead, the amount of press coverage that each candidate has received has been modulated by the media’s perception of how likely each is to win the nomination.
The chart I showed you above contained data on each GOP candidate’s chances of winning the nomination, according to the prediction market Betfair.1 Candidates who are perceived as having a credible chance to win the nomination — like Bush, Walker and Rubio — receive proportionally more media attention than public attention. The reverse is true for candidates who are seen by the press as long shots, such as Rand Paul and Ben Carson.2
As is usually the case, however, life gets more complicated when we go from identifying correlations to trying to understand their causes. As we’ve seen, press coverage is highly correlated with the level of public interest in a candidate and the candidate’s perceived chances of winning the nomination. It could be, however, that public attention to a candidate is triggered by media coverage rather than the other way around. Likewise, while the media might be fairly sophisticated at identifying which candidates are more likely to win and provide correspondingly more coverage of them, the media can also produce a self-fulfilling prophecy. Being ignored by the media or labeled as a loser can make it hard for a candidate to attract money, endorsements and other resources that might allow them to make a comeback.
We can aspire to determine causality by comparing the timing of Google News and Google search hits for a candidate. If the press drives public interest in the candidates, spikes in Google News should precede spikes in Google searches. If instead the press is reacting to the public, Google News hits will lag search.
Unfortunately, this isn’t so easy to determine. Shifts in public and media attention tend to occur at about the same time — as you can see, for example, in the graphic below, which compares Trump’s Google News and Google search traffic from week to week.

But a regression analysis — you can read the gory details in the footnotes3 — suggests that press attention both leads and lags public attention to the candidates. This makes a lot of sense. The public can take cues from the media about which candidates to pay attention to. But the media also gets a lot of feedback from the public. Or to put it more cynically: If Trump-related stories are piling up lots of pageviews and Trump-related TV segments get good ratings, then guess what? You’re probably going to see more of them.4
This creates the possibility of a feedback loop. Some event sparks a news story about a candidate, which triggers more public attention, which encourages yet more media attention — and so on. It may help to explain why we’ve repeatedly seen the so-called “discovery, scrutiny and decline” cycle in the past two primary campaigns for candidates like Trump, Newt Gingrich and Herman Cain — bursts of attention that coincide with spikes in the polls but then fade or even burst after several weeks.
These “bounces” aren’t entirely new. Presidential candidates usually get a temporary bounce in support following their party’s convention, for example. But the polls in the 2012 Republican campaign were far more volatile than those in any previous nomination race. We’re really just getting started in 2016, but it’s been pretty wild as well. Bounces that might have happened once in a cycle now seem to occur all the time.
So if these spikes are media-driven, they seem to be driven by some particularly modern features of the media landscape. Social media allows candidates to make news without the filter of the press. It may also encourage groupthink among and between reporters and readers, however. And access to real-time traffic statistics can mean that everyone is writing the same “takes” and chasing the same eyeballs at once. Is the tyranny of the Twitter mob better or worse than the “Boys on the Bus” model of a group of (mostly white, male, upper-middle-class, left-of-center) reporters deigning to determine what’s news and what isn’t? I don’t know, but it’s certainly different. And it seems to be producing a higher velocity of movement in the polls and in the tenor of media coverage.
Trolls are skilled at taking advantage of this landscape and making the news cycle feed on its own tail, accelerating the feedback loop and producing particularly large bounces and busts in the polls. In 2012, Gingrich’s whole strategy seemed to involve trolling the media, and he went through a couple of boom-and-bust cycles in polls. In 2008, Sarah Palin, though beloved by Republicans, was brilliant at trolling Democrats and the media. She was extremely popular at first, although her popularity was ultimately short-lived.
Trump has taken trolling to the next level by being willing to offend members of his own party. Ordinarily, this would be a counterproductive strategy. In a 16-candidate field, however, you can be in first place with 15 or 20 percent of the vote — even if the other 80 or 85 percent of voters hate your guts.
In the long run — as our experience with past trolls shows — Trump’s support will probably fade. Or at least, given his high unfavorable ratings, it will plateau, and other candidates will surpass him as the rest of the field consolidates.
It’s much harder to say what will happen to Trump’s polling in the near term, however. That’s in part because it’s hard to say exactly what was driving his support in the first place. Trump wasn’t doing especially well with tea party voters or with any other identifiable group of Republicans. My guess is that his support reflected a combination of (i) low-information voters who recognized his name and (ii) voters who share Trump’s disdain for the trappings of the political establishment and (iii) voters who were treating him as an inside joke or a protest vote, making him vaguely like an American equivalent of Beppe Grillo. None of them will necessarily be deterred from declaring their support for him because of his comments about McCain. Some of them might even be encouraged.
But what if you want Trump to go away now?
The media isn’t going to stop paying attention to Trump. Nor should it, really: His candidacy is a political story and not just “entertainment.”5
Republicans are another matter, however. They might rightly be concerned that Trump is tarnishing their brand image or at least meddling with their already-challenging task of choosing a candidate. Other Republicans should resist the temptation to extend the news cycle by firing back at him, however — even when what he says is genuinely offensive.6
After 12 years of writing on the Internet, I’ve learned that the old adage is true. Don’t feed the troll. The only way to kill a troll like Trump is to deprive him of attention.

July 15, 2015
The Bernie Sanders Surge Is About Bernie, Not Hillary
“The recent rise of Bernie Sanders,” wrote Vox’s Jonathan Allen last week, “points as much to [Hillary] Clinton’s vulnerability as Sanders’s strength.” Allen went on to argue that Joe Biden should run for president. “The Sanders surge shows that Democratic activists want an alternative to Clinton,” he explained.
We’ve seen this idea before. For at least a year, journalists have been urging, sometimes almost begging, Biden to enter the race. The more elaborate versions of the idea liken the 2016 campaign to 1968, a year in which the incumbent president, Lyndon B. Johnson, withdrew after the liberal, anti-war candidate Eugene McCarthy finished a close second in the New Hampshire primary. The nomination was eventually won by Johnson’s vice president, Hubert Humphrey, after Robert F. Kennedy (who had entered the race after New Hampshire) was assassinated. In the 2016 narrative, Clinton is Johnson, Sanders is McCarthy and Biden is some composite of Kennedy and Humphrey.
But these comparisons suffer from a fatal flaw. Unlike LBJ, who (mostly because of the Vietnam War) had approval ratings only in the mid-50s or low 60s among Democrats during the 1968 campaign, Hillary Clinton is beloved by voters in her party. In national polls, her favorability ratings among Democrats usually exceed 80 percent.
Nor do Sanders’s gains in Iowa and New Hampshire say much about Clinton’s vulnerability. This is easy enough to test. When a candidate gains relative to another, it could be because he is growing more popular, or because his opponent is becoming less popular. Horse-race polls, in which voters reveal only their first preference, won’t always be able to distinguish between these causes.
Favorability ratings allow us to say more. If Allen’s assertion is right — that Sanders’s gains represent an “anybody but Hillary” vote that could go to Biden — we should have seen a significant deterioration in Clinton’s favorability ratings. That’s not what we see, however. In the charts below, I’ve compiled all the favorability rating polls I could find among Iowa and New Hampshire Democrats since the start of the year. In Iowa, there’s been no change at all in Clinton’s ratings. Her favorability rating is about 85 percent, and her unfavorable rating is around 10 percent, right where it was in January.
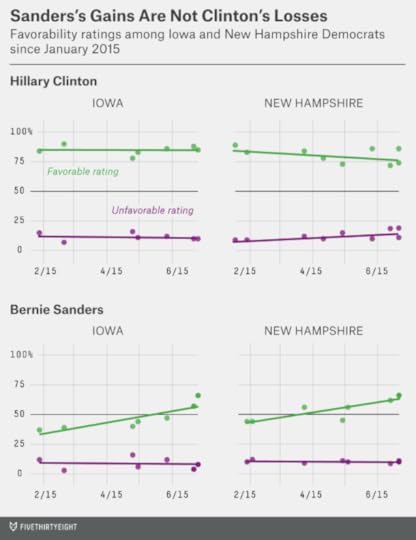
Perhaps you can perceive a slight downturn in Clinton’s favorability numbers among Democrats in New Hampshire — they’re now in the high 70s instead of the mid-80s, while her unfavorable ratings have grown by a few percentage points. Her ratings are still very good, however, and (given the noise in the polling) the change isn’t statistically significant.1
Instead, it’s the Vermont senator’s ratings that have shifted dramatically. In Iowa, Sanders’s favorability rating has grown from about 35 percent at the start of the year to 60 percent now. And in New Hampshire, it has improved from around 45 percent to 65 percent. Some of that is from improved name recognition, but Sanders’s unfavorable ratings haven’t increased even as he’s become better known, remaining at about 10 percent in each state.
The Bernie Sanders surge, in other words, has a lot more to do with Bernie Sanders than with Hillary Clinton. More specifically, it has to do with his left-populist politics. We’re going to break some news here: It turns out that some Democrats are really liberal, and they like a really liberal candidate like Sanders. Right now, Sanders is winning about half the support of white liberal Democrats, but little support from other groups within the party. That works out to around 25 or 30 percent of the vote in Iowa and New Hampshire but more like 15 percent among Democrats nationally.
It’s possible that Sanders’s standing will continue to improve. If he goes from winning half of the white liberal vote to most of it, he could win Iowa and New Hampshire, though not very many other states.
But he could also encounter some headwinds. Sanders’s name recognition is now 70 to 80 percent in Iowa and New Hampshire, so he doesn’t have that much more room to grow on the basis of improved name recognition alone. And while he’s an appealing choice to some very liberal Democrats, Democrats who describe themselves as “somewhat liberal” may instead prefer Clinton. The policy differences between the Democrats aren’t all that profound; Clinton is pretty liberal herself, and she and Sanders voted together 93 percent of the time in the two years they spent in the Senate together.
Sanders may also be benefiting from media coverage of his campaign, which has been favorable to him recently. Polls that show him gaining in Iowa and New Hampshire receive lots of press coverage, whereas those that show him stalling out, like this one released late last week, are all but ignored. Meanwhile, it was described as a “game-changer” when Sanders announced he’d raised $15 million in the spring, even as Clinton raised $45 million during the same period.
Some of this has to do with the longstanding antipathy between the Clintons and the news media (a phenomenon that Allen has written about). But the media have another incentive to paint Sanders’s candidacy in a favorable light, the same one that encourages them to call for a Biden candidacy: Coronations are boring. They’d rather see a competitive Democratic primary, which means more to talk about and analyze, and thus more viewership and traffic. This isn’t an anti-Clinton thing, necessarily; in the past, the dynamic has sometimes worked toward Clinton’s benefit. The 2008 Democratic nomination was portrayed as anyone’s race until the bitter end, for instance, even though Barack Obama’s substantial lead in delegates made it difficult for Clinton to win.
Ordinarily, Democrats might push back against what they perceived to be unfair or inaccurate coverage about Clinton. But Democratic activists and commentators are more liberal than Democrats as a whole. Many of them like Sanders’s policy positions — and even though they may also like Clinton, they’d like to see her pulled further to the left before the general election gets underway.
What about the Clinton campaign itself? So long as Clinton retains 80 percent favorable ratings among Democrats, she has little reason to deflate the Bernie bubble. Sanders may satiate the media’s desire for a “competitive” Democratic primary without really making her vulnerable. Clinton has plenty of ammunition, however, including her money and the endorsements she’s received from her fellow Democrats (including many Democrats who are almost as liberal as Sanders). That’s likely enough to secure her the nomination without her going negative. If needed, she could also press concerns about the electability of Sanders, a 73-year-old self-described socialist who hasn’t run a national campaign before.
In the meantime, you’re likely to see journalists misunderstand the reasons for Sanders’s gains, attributing them incorrectly to criticisms of Clinton. Her email scandal, for example, has received plenty of press coverage, but it isn’t likely to weigh her down in the primary. While only 42 percent of Americans overall say that Clinton is honest and trustworthy — a potential concern for her in the general election — 73 percent of Democrats think she is. And 80 percent of Democrats say Clinton cares about people like them.
There isn’t much of a market among Democrats for an “anybody but Hillary” candidate, in other words. And it’s particularly illogical to argue that Biden might serve as a better foil to Sanders. Biden has lower favorable ratings and higher unfavorable ratings than Clinton and by statistical measures is further to the right.
So if you’re going to speculate about a new candidate entering the race, at least do it in a way that’s consistent with the evidence. Since Sanders’s surge is mostly about Democrats liking a really liberal candidate, you could argue that Massachusetts Sen. Elizabeth Warren should run for president. She’s also extremely popular with liberals but carries less baggage than Sanders.2 But it’s going to be hard for any Democrat to beat Clinton as long as she has an 80 or 85 percent favorability rating within her party.

July 14, 2015
Republicans Are Acting Like Democrats. Democrats Are Acting Like Republicans.
“You know the difference in Democrats and Republicans?” Bill Clinton said in a 2003 speech. “In every presidential election, Democrats want to fall in love. Republicans just fall in line.”
Clinton’s aphorism — which he attributed to a friend — has become a part of the conventional wisdom about how the parties behave. And there was more than a bit of truth to it when Clinton made his remarks. The previous three open Republican nominations — in 1988, 1996 and 2000 — had been won easily by establishment-backed candidates. Vice President George H.W. Bush won 41 of 50 states in the Republican primaries of 1988, Bob Dole won 44 in 1996, and George W. Bush won 43 in 2000. With the exception of Al Gore’s 50-state sweep in 2000, Democratic nominations during this period, including Clinton’s win in 1992, took longer to resolve, with several candidates competing for different factions of the Democratic Party before it settled on a nominee.
Long before these patterns became clear in primary and caucus voting, however, they were presaged by the endorsements that each candidate was racking up. Endorsements, especially from elected officials like U.S. senators and governors, have historically been the most reliable leading indicator of nomination success.
INTERACTIVE: We’re tracking 2016 presidential primary endorsements. Check out who is in the lead, and compare each candidate’s progress to past nominees »
In 2000, for example, Bush had received 369 “endorsement points” (a simple scoring system we developed that assigns 10 points for endorsements from governors, 5 points for U.S. senators and 1 point for U.S. representatives) at this point in the nomination process, 200 days before the Iowa caucuses. That dwarfed the total for the second-place Republican, Dan Quayle, who had only 31 endorsement points. Dole was nearly as dominant in 1996, with 225 endorsement points to Phil Gramm’s 46. These candidates effectively wrapped up their races during the “invisible primary.”
Bill Clinton, by contrast, had no endorsements at this point during the 1992 Democratic cycle. The only Democrat with any was Paul Tsongas, who had been endorsed by two representatives from his home state of Massachusetts. Nor were there many endorsements at this stage of the 1988 or 2004 Democratic nomination races.
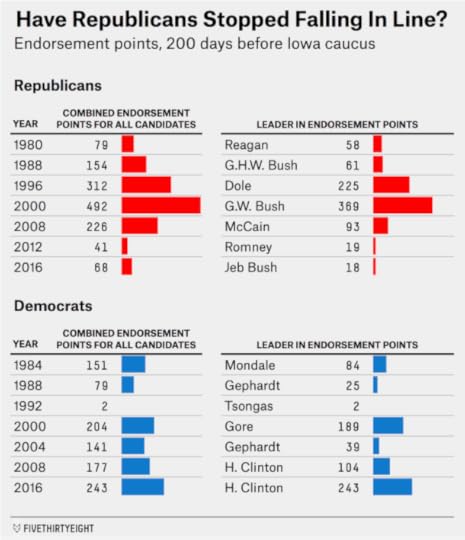
But this year, the historical trend has reversed itself. On the Democratic side, Hillary Clinton is the only candidate with any endorsements from current governors or U.S. senators and representatives. And she has a boatload of them: 88 representatives, 27 senators and two governors have endorsed Clinton, giving her 243 endorsement points, the highest figure ever at this stage of the race for a Democrat.
Republicans, however, haven’t fallen in line behind anyone. Jeb Bush is the nominal endorsement front-runner, but his 18 endorsement points are the lowest total for any leader at this point in the campaign since Tsongas in 1992. Only two Republican governors and three Republican senators have endorsed any candidate at all.
Endorsements also came slowly in the 2012 Republican nomination contest. As of June 17, 2011 — 200 days before the Iowa caucuses — Mitt Romney was the leader, but with only 19 endorsement points. That race got off to a later start than this one did, however, with candidates waiting until relatively late in the cycle to begin campaigning for president.
It may be that would-be Republican endorsers suffer from a paradox of choice. By most definitions, the 2016 Republican field is the largest ever since the modern primary system began in 1972. It’s probably also the deepest, given that many of the candidates are governors or senators from high-population states — yes, there are exceptions.
But the Republican Party is also divided between at least five identifiable constituencies: moderates (who still have influence in states like New Hampshire), establishment voters, Christian conservatives, libertarians, and populist (or so-called tea party) voters. These constituencies overlap, but each has several candidates to choose from:
These constituencies are different from the factions that have traditionally made up the Democratic Party in that the GOP wings are less clearly divided along demographic and racial lines. Tea party voters are hard to distinguish from Christian conservatives on the basis of demographics alone, for example.
But they’ve proved to be real fault lines for Republicans. The establishment prevailed in the 2012 presidential race: Romney, after his slow start, developed a clear lead in endorsements by late 2011 before going on to win the nomination. But the establishment lost some battles when Republicans chose gubernatorial and Senate candidates in 2010 and 2012.
The smart money is still on the GOP eventually falling in line. Unlike Senate and gubernatorial primaries, which are one-off deals, the presidential nomination process proceeds for months, with states voting one at a time or in small groups. An anti-establishment candidate who wins a couple of early states, as Newt Gingrich did in 2012, may be quashed later on as the party rallies its resources against him. So it’s worth tracking endorsements, both for establishmentarian candidates like Jeb Bush and for others like Scott Walker who toe the line between running as “insiders” and “outsiders.”
But what if the GOP decides it needs to fall in love instead? It might make for the most fascinating nomination race of all time.
Follow FiveThirtyEight’s updating tally of the endorsement primary.

July 8, 2015
Bernie Sanders Could Win Iowa And New Hampshire. Then Lose Everywhere Else.
Hillary Clinton’s campaign is now telling reporters that she is at risk of losing Iowa to Bernie Sanders in the February caucuses. One ought to view these stories a bit cynically: It almost always benefits a candidate to lower expectations in Iowa, and these warnings are often designed to activate lethargic supporters. At the same time, the campaign press loves stories that suggest it’ll have a competitive Democratic primary rather than a walkover.
But in this case, Clinton’s campaign is probably right: Sanders could win Iowa. He’s up to 30 percent of the vote there, according to Huffington Post Pollster’s estimate. What’s more, Sanders could also win New Hampshire, where he’s at 32 percent of the vote. Nationally, by contrast, Sanders has just 15 percent of the vote and has been gaining ground on Clinton only slowly.
One theory to explain these numbers is that Iowa and New Hampshire Democrats are early adopters of Sanders’s populist-left message. It isn’t a bad theory. These states have received the most intense campaign activity so far, and Sanders’s name recognition is higher among Democrats in Iowa and New Hampshire — perhaps about 70 percent or 80 percent, based on recent polls — than it is nationally. If the theory is true, Sanders’s numbers will improve nationally as Democrats in other states become as familiar with him as those in Iowa and New Hampshire are.
There’s another theory, however, that probably does more to explain Sanders’s standing in Iowa and New Hampshire, and it’s really simple. Democratic caucus-goers in Iowa and Democratic primary voters in New Hampshire are really liberal and really white, and that’s the core of Sanders’s support.
Sanders, who has sometimes described himself as a socialist, isn’t likely to do so well with moderate Democrats, of course. That’s a problem for him, since a thin majority of Democrats still identify as moderate or conservative rather than liberal. But Sanders has a few things working in his favor. The share of liberal Democrats is increasing — pretty rapidly, in fact — and those Democrats who turn out to vote in the primaries tend to be more liberal than Democrats overall.
What’s received less attention is that Sanders has so far made very little traction with non-white Democrats. The most recent CNN poll found his support at just 9 percent among non-white Democrats, while the latest Fox News poll had him at only 5 percent among African-American Democrats. (Fox News did not provide crosstabs for Hispanics or other minority groups.)
In Iowa and New Hampshire, that isn’t a very big deal. In 2008, 93 percent of Democrats who participated in the Iowa caucus were white, while 95 percent of those who voted in the New Hampshire primary were.
In fact, along with the Democratic electorate in Sanders’s native Vermont, those in Iowa and New Hampshire are as favorable to him as any in the country. In the chart below, I’ve listed the share of Democratic voters who identified as liberal, and as white, in the 39 states where the networks conducted exit polls during the 2008 Democratic primaries. Then I’ve multiplied the two numbers together to estimate the share of Democrats in each state who were both white and liberal.1
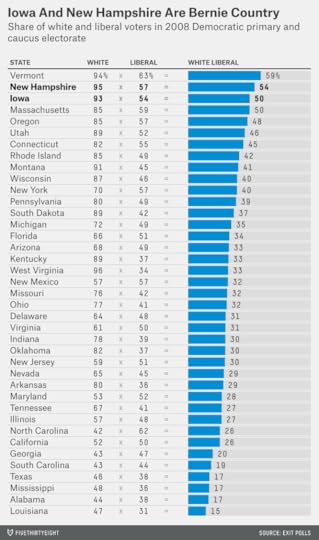
I estimate that 54 percent of the voters in the New Hampshire Democratic primary were white liberals in 2008. That’s the second-highest figure in the country,2 after Vermont (59 percent). In the Iowa caucus, meanwhile, white liberals made up 50 percent; that put the state in a tie with Massachusetts for the third-highest percentage.
The percentage of white liberals isn’t so high in other early primary states, however. It’s just 29 percent in Nevada and 19 percent in South Carolina. The percentage is also low in high-population, delegate-rich states like California (26 percent) and Texas (17 percent).
Put another way, Iowa and New Hampshire aren’t representative of the more diverse electorates that Democrats will turn out elsewhere. It just so happens that the idiosyncrasies of the first two states match Sanders’s strengths and Clinton’s relative weaknesses.
Clinton performed well among Hispanic voters in 2008, and while her failure to win African-American votes was a central reason her campaign failed, she now has excellent favorability ratings among black voters that are nearly as high as Barack Obama’s. If Clinton begins to see her support erode among those groups, her campaign will have some real reason for concern. Otherwise, just as was the case throughout the 2008 campaign, the media will misconstrue voting patterns that occur because of demographics and attribute them to “momentum” instead.

July 7, 2015
The Polls Were Bad in Greece. The Conventional Wisdom Was Worse.
Coming on the heels of the U.K. general election, the Israeli general election, the Scottish referendum and the U.S. midterms, Sunday’s Greek referendum looks like the latest in a series of bad outcomes for pre-election polls across the globe. While the last few polls before the vote showed “Oxi” (“no”) ahead by just 3 to 4 percentage points, it in fact took 61 percent of the vote to 39 percent for “yes,” a margin of more than 22 percentage points. It was a landslide: “Yes” didn’t win a single parliamentary constituency.
But Greece’s pollsters have some pretty good excuses. The referendum was only called on June 27, meaning that the campaign was compressed into a period of about a week. (It’s a rough analogy, but American readers might recall how wild polls of the New Hampshire primary can be in the week after the Iowa caucus.) Furthermore, there was widespread uncertainty about what a “no” or “yes” vote meant, with voters and campaigners on both sides interpreting the referendum in ways that went well beyond the highly technical language on the ballot itself. Public opinion is liable to be volatile under these circumstances, so the polling will be volatile too if it reflects public opinion accurately.
And that’s what happened in Greece. The first several surveys after the referendum was announced showed “no” ahead by margins ranging from 10 to 25 percentage points. “Yes” then pulled ahead in a handful of polls, although never by more than a couple of percentage points. “No” rebounded late last week and led narrowly in the last few polls before election day.
Not all the failure can be explained by a last-minute swing in public opinion, however. Three polls conducted Sunday, the day of the election, also showed “no” winning by only 3 to 4 percentage points, much less than its actual margin. Another challenge is that the polls were conducted at a time of crisis in Greece. Beyond the depression-like conditions it was already facing, Greece defaulted on its debt Wednesday. Normal ways of life were disrupted, to the point that it was hard for Greeks to purchase ordinary goods and services. In other words, Greek voters may have had more pressing concerns than sitting around at home and waiting for a pollster’s phone call.3
It’s also plausible that those voters whose lives were most disrupted — those who were standing in line for hours to get cash, for example — were less likely to have the luxury of answering a poll but also more likely to vote “no” on the referendum. That could have biased the polls against “no” voters.
All of this is easier to consider after the fact, of course.4 Still, these are not arcane or abstract problems. The polls were conducted at a time of national emergency, on a referendum that was called just one week prior and that nobody was quite sure how to interpret. That seems like a recipe for a polling disaster.
And yet, rather than being appropriately cautious, the conventional wisdom was reasonably confident that the “yes” side would prevail.
When I use the term “conventional wisdom” in this article, I mostly mean the opinions of political pundits and journalists. In the case of Greece, however, the failure also extended to betting and financial markets.5 One bookmaker, Paddy Power, was so convinced that “yes” would win that it pre-emptively paid out “yes” bets. Most banks and financial institutions expected a “yes” vote. Betting markets like Betfair continued to show “yes” favored even after the polls had turned back toward “no.”
It’s not quite clear why these markets were so confident. The largest margin for “yes” in any poll during the campaign was just 3 percentage points, and even that poll showed support below 50 percent, an important consideration because undecided voters often vote “no” on referendums. Even under the best of circumstances, the polls ought not to have inspired all that much confidence in a “yes” vote, and these weren’t the best of circumstances.
There is another possible problem in Greece, however: pollster herding, which is the tendency of some polling firms to suppress (or manipulate6) results that are out of line with the consensus view of the election. In the U.K. general election in May, for example, the pollster Survation declined to publish a poll showing the Conservatives up by 6 points — about their actual margin of victory — because the company said it was “so ‘out of line’ with all the [other] polling.” And in the Virginia Senate race last year, at least two polling firms suppressed results showing a tight race between Mark Warner and Ed Gillespie because they evidently didn’t believe them. (Warner won, but by a much narrower margin than the polls predicted.)
When pollsters start herding, everything becomes a hot, sticky mess. Polls lose their independence from one another, and also from the conventional wisdom, since pollsters may be reluctant to publish “outliers” that are deemed out of line with the consensus.
There were some signs of herding in Greece. Whereas the first few polls were all over the place, the polls began to track one another closely by a few days into the campaign. And all polls conducted on election day itself showed nearly identical results, each with “no” ahead by 3 or 4 percentage points.
Considering how challenging it was to conduct polls under the conditions of the Greek referendum, we should have expected to see some healthy disagreement. Instead, we got a consensus, which proved to be quite wrong. As a practical matter, unfortunately, herding probably becomes more common the more challenging it is to conduct a poll. (And bad news: It’s becoming more challenging to conduct a poll.) Would a Greek pollster have been willing to publish a poll showing a 20-point lead for “no” when other polls — plus financial markets and commentators — expected a much tighter outcome? We don’t know, but based on the U.S. and U.K. experience, it might not.
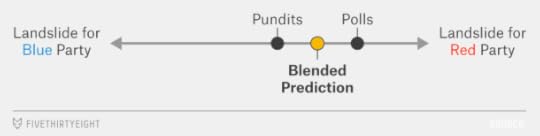
Herding can also yield some funny outcomes when it comes to comparing the polls with the pundits. Imagine an election between two parties, the Red Party and the Blue Party. The polls show the Red Party ahead by, say, 5 percentage points. But the pundits read the “vibrations” and say the election is too close to call. A forecaster might aggregate this information and predict the Red Party to win by 2 or 3 percentage points, somewhere in between where the polls and the pundits have the race. If you prefer a diagram, it might look like this:
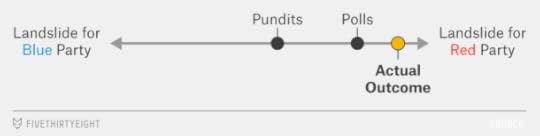
Sometimes this approach is a good idea. It wouldn’t have worked in the case of Greece, however, or in the U.S. elections of 2012 and 2014. Instead, in several of the recent cases in which the polls have been wrong, they’ve been wrong in the opposite direction of what the pundits anticipated. In the 2012 U.S. election, pundits saw the race as too close to call while polls showed Obama narrowly ahead. In fact, Obama not only won, but he also beat the polls (by about 3 percentage points in the average swing state). In the 2014 midterms, likewise, some mainstream and left-leaning commentators believed that polls showing Republicans ahead in key Senate races were underestimating Democratic turnout and were therefore “skewed” toward the GOP. In fact, Republicans won by wider margins than polls predicted. And in Greece, the conventional wisdom was more confident of a “yes” vote than the polls were (indeed, the polls showed “no” ahead by the end). Not only did “yes” lose — it got crushed.
Put another way, in several of these elections, the best forecast wouldn’t have come from blending polls with pundits’ opinions. Nor would it have come from using only polls (after all, the polls weren’t very good). To match the actual result, a forecast would have needed to employ a contrarian strategy of blending polls with the opposite of what pundits say:
So … the pundits are so bad that you should literally bet against whatever they say? Even I wouldn’t go that far. I’m happy to mostly ignore them instead. The problem, though, is that because of herding, it’s become harder to get what I really want — an undiluted sample of public opinion. Instead, there’s sometimes quite a bit of conventional wisdom baked into the polls. Be wary when there’s a seeming consensus among the polls, especially under circumstances that should make for difficult polling. There’s a good chance the polling will be wrong — but in the opposite direction of what most people are expecting.

Nate Silver's Blog

- Nate Silver's profile
- 729 followers

