
Nate Silver's Blog, page 161
November 11, 2014
The NFL Should Expand To London. But First: Canada, Mexico And LA.
It might seem like a matter of time before the NFL and London stop flirting and start going steady. Six NFL teams have flown across the Atlantic to play a football game this year — most recently, the Dallas Cowboys and Jacksonville Jaguars, who squared off on Sunday in the third and final London game of the season. (Just as if they were playing on home soil, the Jaguars lost badly.) The league would have to inconvenience only two additional teams1 to host a franchise in London full-time.
Most commentary on the possibility of a London NFL team has been skeptical. Bill Barnwell, of Grantland, worried last year about travel and timing logistics and the potential disadvantages a London franchise would face in recruiting free agents.
My view is more optimistic, at least when it comes to whether a London team could find a sufficient fan base. I’m not sure a franchise in London would be a smashing success. But even given conservative assumptions, London’s huge population and revenue base are probably enough to outweigh the relatively low level of NFL interest there. Perhaps more important, in contrast to some U.S.-based candidates for expansion or relocation, a London team would not cannibalize much of the fan bases of existing NFL franchises.
Still, if London got first dibs on a team, the NFL would be overlooking a couple of more obvious candidates much closer to home.
Last year, I looked at the National Hockey League’s allocation of franchises, estimating the size of each market’s NHL fan base using the population of its metropolitan area and the number of Google searches for the term “NHL.” (The analysis concluded that the NHL is overextended into smaller U.S. markets while underserving Canadian fans.) Here, I’ll perform the same analysis for the NFL, comparing cities that already have a team to potential new markets in North America and Europe.
As with the hockey analysis, I’ll assume the popularity of the NFL in a given market is proportional to the number of Google searches for NFL-related topics,2 as according to Google Trends. Google searches might not be a perfect measure of popularity but they correlate reasonably well with other measures of franchise success3 and allow us to compare domestic and international markets by the same standard. The only ad-hoc adjustment I’ve made is to lump Green Bay together with Milwaukee for purposes of calculating the Packers’ fan base.
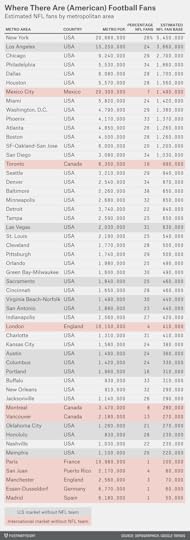
Otherwise, this is pretty simple: We’re just multiplying a metro area’s population4 by the volume of Google searches it conducts on NFL-related topics. The estimated number of fans in each market is calibrated to the U.S. national average of 28 percent of Americans who say they are “very interested” in the NFL. Our estimates of the number of NFL fans in the 30 existing NFL markets5 — and about two dozen plausible expansion destinations — follow6:
In contrast to the NHL (or college football), the level of interest in the NFL is fairly consistent from place to place in the United States. There’s also relatively little difference between those markets that have an NFL franchise and those that don’t.
In some ways, these are signs of the league’s success: The NFL has conquered Sunday afternoons in just about every nook and cranny of the United States. And it’s principally a television sport. In the NFL, it’s not quite as important where the franchises are located — so long as you can transmit a TV signal from there.
But partly because of the NFL’s pervasiveness, it has run out of highly attractive American markets other than Los Angeles. (Other than that, Mr. Goodell, how was the play?) Even Los Angeles provides some evidence of the league’s saturation: NFL interest there is only mildly lower than the national average despite the city not having hosted a team since 1994. Let’s say, however, that the NFL comes to its senses and places a team in Los Angeles soon. Where else is there to go in the U.S.?
Las Vegas has high levels of NFL avidity and ranks as the next-largest untapped U.S. market by the number of NFL fans. But given the NFL’s longstanding paranoia about associations with gambling, putting a team there would be as much of an adventure for the league as going to a foreign market.
After this are a series of markets — Orlando, Florida; Sacramento, California; Virginia Beach, Virginia; San Antonio; Austin, Texas; and Columbus, Ohio — where a team would play in the shadow of a more established franchise: The San Francisco 49ers in the case of Sacramento, for instance, or the Dallas Cowboys in the case of San Antonio. We’ll seek to measure the effect of this in more detail later on. It’s not that these markets are necessarily any less NFL-worthy than, say, Nashville or Jacksonville. But they’d reshuffle existing fans around more than they’d allow the league to expand its footprint.
The foreign markets are more intriguing. Let’s start with London.
I estimate from the Google data that only about 4 percent of Londoners are NFL fans now. However, the city’s metro area has about 10 million people. That means it has about 400,000 NFL fans. That isn’t great, but it’s comparable to a few existing NFL markets (Cincinnati, Indianapolis, Charlotte, Kansas City) and slightly larger than a few others (Buffalo, New Orleans, Jacksonville, Nashville). A London franchise might be the equivalent of a “small-market” team — but it would hardly be a huge outlier.
There are a number of reasons to think this underestimates London’s potential. London is wealthy, with a GDP per capita of somewhere around £37,000 ($60,000 at current exchange rates). That means higher ticket prices and more billionaires to buy the team when it goes up for sale. London is also among the most-visited cities by tourists in the world with about 15 million international visitors a year.7
More important, our estimate that 4 percent of Londoners are NFL fans is based on the volume of Google searches since 2004. Those searches have increased recently, and there’s reason to expect a further increase in fan interest if a team is located in the city permanently. As measured by Google searches, interest in the NHL increased by about 80 percent in the province of Manitoba, Canada, after the league relocated a franchise to Winnipeg in 2011. The NBA experienced a similar increase in Oklahoma City when it moved a team there.8 Because the NFL is already so saturated in the United States, I wouldn’t expect an 80 percent increase in NFL interest if you placed a team in Orlando or Austin. But London, and other foreign markets, have a much lower baseline and more room to grow.
A London-based team could also have some appeal across the rest of England and the United Kingdom. One precedent comes from the Toronto Blue Jays and Toronto Raptors, the only Canadian teams in Major League Baseball and the NBA, respectively. Each one generates about 20 percent to 25 percent as much search traffic in other Canadian provinces as it does in its native Ontario. That doesn’t sound great, but it’s higher than most U.S.-based franchises, many of which generate only about 5 percent as much search traffic outside their home states. With no other franchise to compete against geographically, a London team could be regional in the way the Denver Broncos, Dallas Cowboys and Boston Red Sox are, covering a larger footprint than you’d infer from its metro area alone.
You might think these are pie-in-the-sky assumptions; I think they’re pretty reasonable. The only issue is that there are two other international destinations that rank better still.
They’re not among the more exotic choices. Paris, Dusseldorf9 and Madrid almost certainly would not have the fan bases to support an NFL team at the present time. A second U.K.-based team, in a place such as Manchester, would not do much better. Nor in all likelihood would San Juan, Puerto Rico, which is a baseball town.
But the Toronto metro area is highly populous and NFL interest is already reasonably high there. I estimate T Dot has about 1 million NFL fans — more than the majority of U.S. markets to host an NFL team. As with the Raptors and Blue Jays in their sports, there could also some residual gains in NFL interest across the rest of Canada.
Mexico City ranks even higher. Although only about 7.5 percent of people there are NFL fans, 7 percent of 20 million residents is still 1.5 million NFL fans.
Could those Mexico City fans afford tickets and licensed replica jerseys and the products sponsors might want them to buy? Mexico gets pigeonholed as a developing country and that’s true for much of the nation, but Mexico City itself has developed into a thriving, bustling city with many of the creature comforts available in the other great metropolises of North America. Mexico City’s metro-area GDP is about $30,000 per capita and GDP per capita is nearing $50,000 in the city proper, comparable to that in U.S. cities. Levels of NFL interest in Mexico City, while not extraordinarily high, are higher than in London: An NFL game there in 2005 drew more than 100,000 spectators.
The international markets also offer the advantage of being unconquered territory rather than existing in the shadow of any current NFL team. To measure this, I ran another series of Google Trends searches on topics related to individual NFL teams (e.g. searches for topics related to the Seattle Seahawks) to see how they compared to interest in the NFL as a whole.
In existing NFL markets, Google search traffic for the local team is generally about 65 percent to 70 percent as high as that for the league as a whole. See here for the Detroit Lions, for example. Of the Detroit area’s roughly 840,000 NFL fans, Google search volume would suggest we’d allocate about 480,000 of them to the Lions. Another 200,000 or so would go to the next-most popular NFL teams there, the Green Bay Packers and the Chicago Bears. That leaves relatively few “free agent” fans.
In the foreign markets, however, including in Canada, fans are largely not committed to any one NFL franchise. In the table below, I’ve estimated the number of fans for the three most popular teams in each market and calculated how many fans remain after allocating fans to those teams.10
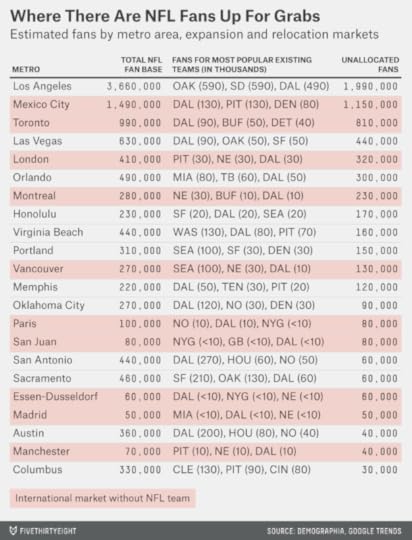
In Mexico City, for instance, the Cowboys, Pittsburgh Steelers and Broncos are probably the most popular teams. But searches for those three teams combined represent only 20 percent to 25 percent of searches for NFL-related topics as a whole. Contrast that with Columbus, where searches for the Cleveland Browns, Steelers and Cincinnati Bengals represent about 90 percent of searches for the NFL as a whole. That’s not to say a Columbus-based team wouldn’t pick up some fans of its own, but they might come largely at the expense of the Browns, Bengals and Steelers rather than acquainting new fans with the league.
Toronto, like Mexico City, has only about 20 percent of NFL fans allocated to one of the three most popular NFL teams there. The Buffalo Bills have sometimes protestested that Toronto is part of their market, but NFL fans in Toronto take only a modest interest in the Bills according to search data and other metrics like merchandise sales.
I estimate there are about 50,000 Bills fans in greater Toronto. That isn’t nothing when there are only about 300,000 NFL fans in metro Buffalo itself. But that’s Buffalo’s problem, not Toronto’s. If the NFL wants to have a franchise in Buffalo, it should have one in Buffalo. It should also have one in Toronto. The league would come out ahead if it had to slightly subsidize the Bills with the extra revenues it gained from a Toronto team.
How about Montreal or Vancouver instead? If you could combine the virtues of the two — Montreal’s larger population with Vancouver’s greater NFL interest — you’d have an NFL-worthy city. As it stands, however, both are decidedly inferior to Toronto. Montreal comes out slightly better than Vancouver in our reckoning because, while each has about the same number of NFL fans, a fair number of those in Vancouver are committed to the Seattle Seahawks.
Among U.S. cities, Los Angeles remains No. 1 with a bullet after allocating fans to existing teams. Las Vegas’s numbers also hold up well. So, to a lesser extent, do Orlando’s, a surprising result given that there are three other NFL teams in Florida. But Orlando, like other cities in the state, has a lot of expats from the north who root for teams like the New England Patriots and New York Giants and who might or might not be intrigued by an expansion team. The state of Florida has produced its fair share of disappointments in cultivating loyalty toward new franchises. Most of the other American candidates could wind up like Jacksonville — at best just barely big enough to support a team on its own and with that team having barely any footprint beyond the city’s borders.
A final question is about the NFL’s endgame. If the NFL merely needs a couple of credible candidates for relocation — whether as leverage against existing teams or as genuine alternatives — Los Angeles and London should more than suffice. But if the league is thinking about expansion, it might have to do it in a big way. Thirty-two teams is a convenient number, readily divisible into two conferences and eight divisions of four teams each. A 33-, 34- or 35-team league would be awkward, however. The next equilibrium would be 36 teams instead, which could be divided into six divisions of six teams each.
In that case, the NFL ought to return to cultivating the Mexico City market and treat Toronto as more than a token alternative for the Bills. An expansion to those cities along with London and Los Angeles would be the boldest thing the league has done in years — and possibly the smartest.
CORRECTION (2:15 p.m.): An earlier version of a chart in this article misstated the number of unallocated NFL fans for Mexico City. That number is 1.15 million, not 1.49 million.


November 6, 2014
Why Polls Missed A Shocker In Virginia’s Senate Race
Projections from early exit polls have a well-deserved reputation for being dubious — just ask President John Kerry. But early Tuesday evening, they suggested a potentially shocking outcome in Virginia. Ed Gillespie, the Republican U.S. Senate candidate, was in an extremely close race against Democratic incumbent Mark Warner, who had led by about 9 percentage points in pre-election surveys. If the exit poll was even close to accurate, it was one of the early signs Republicans were due for a huge night.
Warner will probably survive his race, but not by much. As of Thursday afternoon, he led by about 17,000 votes — or 0.8 percentage points — and the few remaining areas yet to report their vote seemed slightly favorable to him. The exit polls got the race just right. The pre-election polls — in an election for which they had plenty of misses — did not.
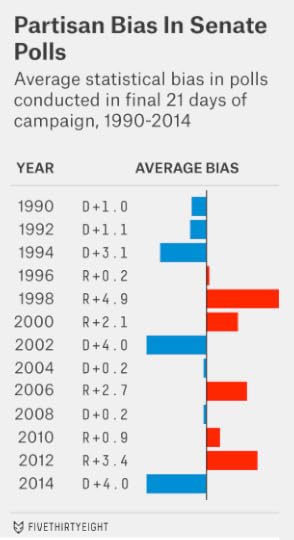
If Gillespie had won the race — or if he eventually does — he’d be the most unlikely candidate to do so in a Senate or gubernatorial race since 1998, at least based on the final polls. (I’m limiting this analysis to races that had at least three polls released in the final 21 days of the campaign, according to the FiveThirtyEight polling database. Sparsely polled races, like the Maryland gubernatorial race this year, present a different problem.) In 1998, Democrat Ben Cayetano was re-elected as Hawaii’s governor despite trailing Republican Linda Lingle by 11 percentage points in pre-election surveys. That same year, Reform Party candidate Jesse Ventura won the Minnesota governorship despite being 9 points down.
So, we’re talking about a once-or-twice-a-decade error — the point on the probability distribution where an outcome goes from being impossible to merely improbable. (The FiveThirtyEight model listed Gillespie’s chances at 0.5 percent.) But there have been dozens and dozens of races where candidates led by a similar margin in the polls and never had to break a sweat.
Where the exceptions occur, the problems are sometimes easy to diagnose. Minnesota in 1998 was a three-way race — Ventura prevailed over Republican Norm Coleman and Democrat Hubert Humphrey III — and those are far more volatile than races where there are just two viable candidates on the ballot. Hawaii, meanwhile, has a long history of terrible polling, perhaps because of the state’s demographic makeup. Between 1998 and 2012, polls of gubernatorial and Senate elections there missed the final margin by an average of almost 12 points, the largest error of any state but Wyoming, according to the FiveThirtyEight database.
Virginia’s result is harder to explain. Since 1998, the average polling miss there in Senate and gubernatorial races had been about 4 percentage points — meaning polls there had been slightly more accurate than average. Nor have Virginia’s polls shown much long-term bias toward either Democrats or Republicans.
Did the “fundamentals” of the race favor Gillespie or at least project a photo finish? In some of the states the polls miscalled, the fundamentals — as FiveThirtyEight’s model evaluates them — pointed in the right direction. Our fundamentals calculation had Republican Thom Tillis of North Carolina slightly favored over the Democrat Kay Hagan, for instance, and Republican Pat Roberts heavily favored to hold his seat against independent Greg Orman.
But this wasn’t the case in Virginia. Our fundamentals calculation had Warner up 9 points — just where the polls had the race. Weighing in Gillespie’s favor was that Virginia is a purple state in a red-leaning national climate in a year where incumbents of all stripes were unpopular. But everything else favored Warner. He’d raised considerably more money than Gillespie and won overwhelmingly in 2008. Gillespie — while an experienced political hand as the former head of the Republican National Committee — had never run for public office before. Warner has a fairly moderate voting record that squares well with those of voters in Virginia.
The FiveThirtyEight fundamentals calculation does not consider a candidate’s favorability or approval ratings, but those looked good for Warner, too, having usually been in the range of 55 to 60 percent. More astoundingly, they were 56 percent among voters surveyed in Tuesday’s exit poll — the voters who nearly booted him out of office.
The Virginia result reminds me of two other cases — one where a heavily favored incumbent did lose and another where there was a near-miss.
The near-miss was in New York’s mayoral election in 2009. Incumbent Michael Bloomberg, up by about 15 points in the polls against Democrat Bill Thompson, instead won by just 4.
The loss is one I remember from my childhood: Republican John Engler defeated two-term incumbent James Blanchard in Michigan’s gubernatorial race in 1990. I wasn’t a polling geek back then, but I remember everyone being shocked by the outcome. Sure enough, the race soon became infamous among pollsters. Blanchard had led by 14 percentage points in the final Detroit News poll. The Detroit Free Press showed a closer race, with Blanchard up 4 points among likely voters. Even Engler’s internal polls had him slightly behind.
The races in Michigan, New York and Virginia have a few things in common:
Popular but longstanding incumbents. One of the odd things about New York’s race in 2009 was that Bloomberg, like Warner, had strong approval ratings even among the voters who nearly defeated him. The exit poll that year had Bloomberg with a 70 percent approval rating. But one-quarter of voters who approved of his performance voted for Thompson anyway.
Some of this may have been because Bloomberg encouraged a change to New York’s term-limit laws to allow himself to run again (voters changed them back a year after Bloomberg was re-elected). New Yorkers thought Bloomberg had done just fine, but they didn’t like how he’d changed the rules and were ready for a change.
Blanchard, likewise, had served two terms at the time of his defeat. The 1990 exit poll in Michigan did not ask about his approval rating, but there’s reason to think it would have been fairly high. Blanchard defeated Republican William Lucas by a record margin — 37 percentage points — in 1986 and was considered a potential vice-presidential candidate. A CBS News report from Sept. 10, 1990, described him as “the popular governor of Michigan.” Michigan’s unemployment rate had fallen considerably during Blanchard’s tenure, although it was rising again by 1990.
Warner is serving his first Senate term — but he’s a familiar face to Virginia voters, having been the state’s governor between 2002 and 2006. Warner’s 10 years in office is a lot of time by Virginia standards. Uniquely among the states, it limits governors to one consecutive term. And while John Warner served the state for 30 years, all the other senators it has elected since 1982 have served just one or two terms.
Low turnout. Another unusual facet of Virginia’s gubernatorial races is that they are held in odd-numbered years (2005, 2009, 2013) rather than in conjunction with federal races. That can contribute to middling turnout in midterm years even as Virginia’s turnout in presidential elections has been above-average.
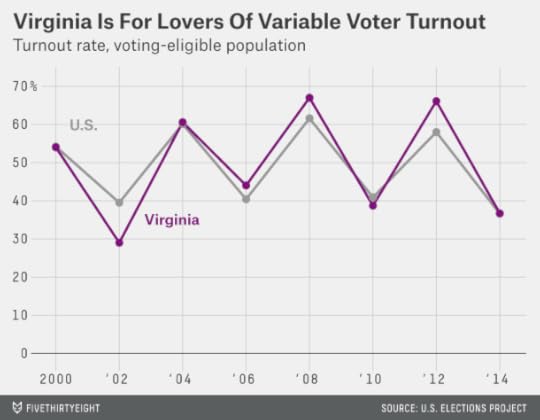
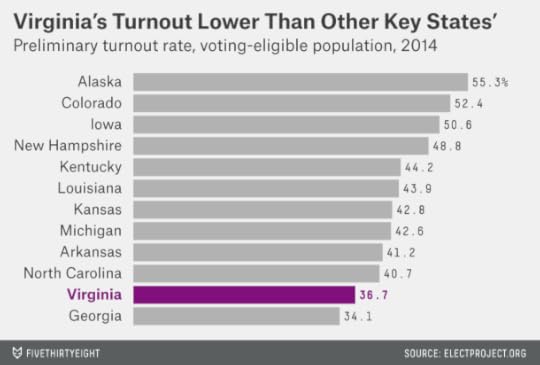
Turnout in Virginia this year is projected to be 37 percent of the voting-eligible population — in line with the figure nationally in a year where turnout is down across the board. But this is low in comparison to other states to have held competitive Senate races, where turnout averaged about 44 percent instead. Virginia’s 2014 turnout was also well below its figure in 2006 (44 percent), when the state hosted a competitive Senate race between James Webb and incumbent George Allen. It’s even lower than 2010 (39 percent) when it had neither a Senate nor gubernatorial race.
The Michigan and New York elections were also characterized by low turnout. In 1990, just 39 percent of eligible voters cast ballots in Michigan; the midterm-year average in the state since the voting age was lowered has been about 44 percent.
About 1.2 million New Yorkers cast ballots in the 2009 mayoral election, slightly more than would four years later in the noncompetitive race between Bill de Blasio and Joe Lhota, but below the average of 1.4 million from 1981 through 2005.
So … turnout explains it all? It’s a big part of the story. As The Washington Post reports, the turnout drop-off was higher in Democratic-leaning counties. And pollsters may have had trouble modeling the Senate race in Virginia: There was no precedent from 2010, and they would have overestimated it if turnout had been pegged to 2006.
But a few things are still hard to reconcile. If turnout were the whole story, you’d expect substantial differences between the demographics in exit polls and pre-election surveys. Instead, they closely match one another.
The Christopher Newport University poll projected black turnout at 16 percent, for example, and the Roanoke College poll had it at 19 percent — compared to 19 percent in the exit poll.1 Partisan and age demographics were also similar.
And as I mentioned, Warner’s favorability rating was 56 percent even among voters on the exit poll. Candidates with those sorts of numbers don’t lose — or come so close to doing so — very often.
So, what explains the result? I don’t know, but I have a theory — one that ties the race together with the ones in New York and Michigan. It’s that some voters who would otherwise be inclined to vote for Warner went for Gillespie because they didn’t think Warner needed their vote.
That Warner and Bloomberg were quite popular among voters in the exit polls contributes to the theory. Some voters may have been perfectly willing to vote for them if they thought they’d needed to. But because they didn’t see the races as competitive, they felt free to use their vote in other ways. They might have voted for Gillespie as an expression of their overall dissatisfaction of the direction of the country, for instance, or Thompson as a protest against Bloomberg’s change to term-limit laws.
There may be a danger zone when a candidate leads by about 10 percentage points in the polls, as Warner and Blanchard did. That’s a big enough lead that the news media may not portray the race as competitive — Blanchard’s re-election was thought to be quite inevitable, for example, as was Bloomberg’s. Another example is Barack Obama’s lead of about 8 percentage points over Hillary Clinton in polls of the New Hampshire Democratic presidential primary in 2008. The media seemed to regard another win for Obama as a sure thing after his victory in the Iowa caucuses.
But a 10-point lead isn’t completely safe. If the polls were a bit wrong to begin with, and turnout is a bit lower than expected, and a few voters change their mind in the ballot booth, the leading candidate can lose. (A 15- or 20-point lead, by contrast, would probably hold up even in the event of a catastrophic polling error; the candidate will still win, just by less than expected.)
Was the media wrong to imply these races were done deals? In the case of New Hampshire, absolutely — polls of primaries are much less accurate than polls of general elections, and an 8-point lead is not all that safe.
In general elections, it’s trickier. For every case like Warner’s, where the outcome turns out to be close, there are dozens of false alarms. (This year, for example, Democrats Tom Udall of New Mexico, Cory Booker of New Jersey, Al Franken of Minnesota, Dick Durbin of Illinois and Gary Peters of Michigan won their elections with ease despite polling in the same range that Warner did.) And the media’s overall bias — it makes for better headlines and more suspense this way — is toward characterizing general election races as less certain than they sometimes are.
Here’s the thing: Surprises, by definition, come only when we don’t expect them. There are some cases where a 10-point lead might (correctly or not) still be viewed as indicating considerable uncertainty, such as because the margin in the race was once narrower or the polls have a history of problems in a state or there was some late-breaking news event. In that case, though, voters would be alert to the danger. They’d be more likely to go to the polls and cast their ballot as pollsters expected them to.
But every now and then, there’s a true surprise, and a heavily favored candidate gets Englered. It’s important for keeping incumbents honest — and pollsters, too.

November 5, 2014
The Polls Were Skewed Toward Democrats
For much of this election cycle, Democrats complained the polls were biased against them. They said the polls were failing to represent enough minority voters and applying overly restrictive likely-voter screens. They claimed early-voting data was proving the polls wrong. They cited the fact that polls were biased against Democrats in 2012.
The Democrats’ complaints may have been more sophisticated-seeming than the ”skewed polls” arguments made by Republicans in 2012. But in the end, they were just as wrong. The polls did have a strong bias this year — but it was toward Democrats and not against them.
Based on results as reported through early Wednesday morning — I’ll detail our method for calculating this in a moment — the average Senate poll conducted in the final three weeks of this year’s campaign overestimated the Democrat’s performance by 4 percentage points. The average gubernatorial poll was nearly as bad, overestimating the Democrat’s performance by 3.4 points.
The problem with Democrats’ claims is that they were one-sided. I don’t mean that in the typical false equivalence way. I mean that they were ignoring some important empirical evidence.
This evidence suggests that polling bias has been largely unpredictable from election to election. Beyond the shadow of a doubt, the polling was biased against Democrats in 1998, 2006 and 2012. However, just as certainly, it was biased against Republicans in 1994, 2002 and now 2014. It can be dangerous to apply the “lessons” from one election cycle to the next one.
Our estimates of polling bias are evaluated in the same way we’ve assessed them in the past. They rely on a simple average of all polls1 released in the final three weeks of the campaign. Bias is calculated as the difference between the polled margin and the actual result. (For instance, a poll that projects the Democrat to win by 7 points when she actually wins by just 3 has a 4-point Democratic bias.) We exclude races in which one of the top two finishers was an independent candidate.
We’ll publish 2014 data in full soon2 but here are the preliminary results — first, for this year’s Senate polls:
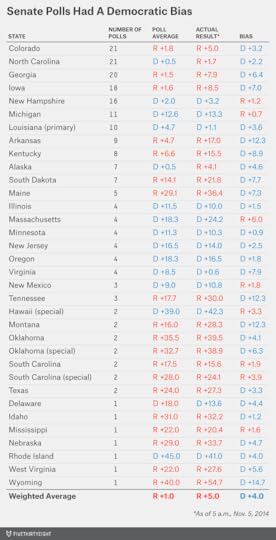
As you can see, the polls were biased toward the Democratic candidate in almost all key races. They were fortunate to have “called” the winner correctly in certain cases: Some of the worst misses came in states like Kentucky and Arkansas where the Republican won, but by a considerably larger margin than polls projected. There was also a near-disaster in Virginia. It looks like Democratic incumbent Mark Warner will pull out the race, but the polls had him up by 9 points rather than being headed for a photo finish.3
Meanwhile, the average bias in gubernatorial polls was 3.4 points in favor of Democrats.
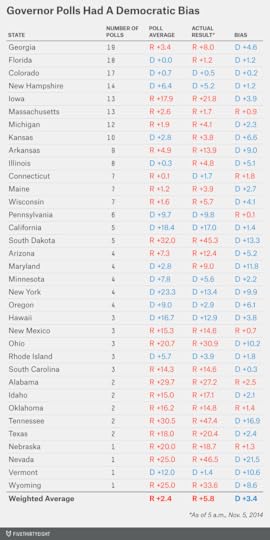 In the governor’s races there were a higher number of missed “calls” — including in Illinois and Kansas and especially in Maryland, where Republican Larry Hogan wound up winning by 9 percentage points despite trailing in every nonpartisan poll released all year.
This type of error is not unprecedented — instead it’s rather common. As I mentioned, a similar error occurred in 1994, 1998, 2002, 2006 and 2012. It’s been about as likely as not, historically. That the polls had relatively little bias in a number of recent election years — including 2004, 2008 and 2010 — may have lulled some analysts into a false sense of security about the polls.
Interestingly, this year’s polls were not especially inaccurate. Between gubernatorial and Senate races, the average poll missed the final result by an average of about 5 percentage points — well in line with the recent average. The problem is that almost all of the misses were in the same direction. That reduces the benefit of aggregating or averaging different polls together. It’s crucially important for psephologists to recognize that the error in polls is often correlated. It’s correlated both within states (literally every nonpartisan poll called the Maryland governor’s race wrong, for example) and amongst them (misses often do come in the same direction in most or all close races across the country).
This is something we’ve studied a lot in constructing the FiveThirtyEight model, and it’s something we’ll take another look at before 2016. It may be that pollster “herding” — the tendency of polls to mirror one another’s results rather than being independent — has become a more pronounced problem. Polling aggregators, including FiveThirtyEight, may be contributing to it. A fly-by-night pollster using a dubious methodology can look up the FiveThirtyEight or Upshot or HuffPost Pollster or Real Clear Politics polling consensus and tweak their assumptions so as to match it — but sometimes the polling consensus is wrong.
It’s equally important for polling analysts to recognize that this bias can just as easily run in either direction. It probably isn’t predictable ahead of time.
To the extent polling bias is predictable, it may call for assessing nonpolling factors — the so-called “fundamentals” — along with the polls in each race. One simple factor is the overall partisanship of a state as measured by its past voting history. In the past, Republicans have tended to outperform their polls in red states while Democrats have done so in blue states.
Many of the key races were held in red states this year. That won’t be true in 2016, and we’ll undoubtedly see some pollsters and polling aggregators draw the wrong lessons from 2014. The polls may be biased again in 2016; we just won’t know much about the direction of it until votes have been cast and counted.
CORRECTION (Nov. 5, 2:52 p.m.): An earlier version of this article misstated how much the average gubernatorial poll overestimated the Democrat’s performance. It was 3.4 points, not 4 points.

November 4, 2014
Five Scenarios For The Senate Election
It’s a cliché: Every seat matters. But that’s especially true in this year’s Senate election. A very close result — 50-50 for Democrats, or 51-49 for Republicans — could be reversed later on in the event a senator switches parties or relinquishes his seat and triggers a special election.
Furthermore, in contrast to 2014’s Senate map — dominated by red states and Democrats who won election in the extraordinary Democratic year of 2008 — the 2016 map will be just the opposite. Most of the battlegrounds will be in blue states, and will include Republican incumbents who won election in the party’s wave year of 2010. If Republicans can finish with 53 or more seats this year, they’ll be much more likely to hold the Senate in 2016. Keep in mind that senators are elected to longer terms than anyone else in federal office. The ones elected this year will be in place for the entire first term of the 45th president — whether it’s Hillary Clinton, Marco Rubio, Rand Paul or someone else.
So let’s spend some time considering the range of possible outcomes. The 90 percent confidence interval on our forecast covers a range of 49 to 55 Republican seats. Democrats could limit Republicans to 48 seats if they have a very, very good night — while Republicans would need an extraordinary night (winning a state like Virginia where the polls show them behind by about 10 points) to get more than 55.
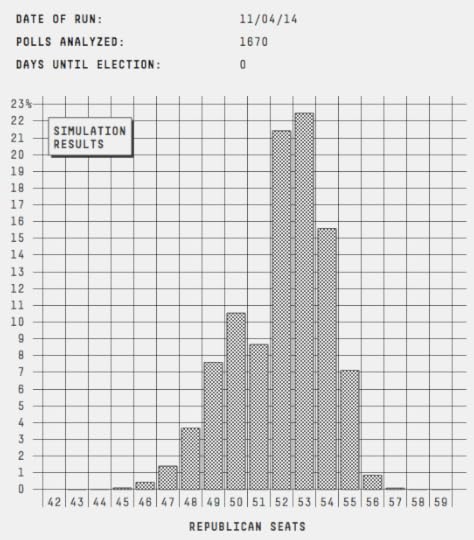
We’ll also be thinking about two other frameworks for evaluating the results. First, will the election be called Tuesday night or early Wednesday morning? The odds are that it won’t be, because of possible runoffs, slow vote counts and other circumstances. But if it is, that will represent very good news for the Republican party; Democrats would need a minor miracle to win the Senate without going to “overtime.”
And second, is there evidence of systematic bias toward either Democrats or Republicans in the polls? The outcomes at the tail ends of our probability distribution might suggest one.
Here are the five basic scenarios that account for these various measures of success:
Scenario 1: Republican landslide (30 percent chance)Republicans have a 33 percent chance of having the Senate election called for them by midday Wednesday, according to our model. This would probably mean they win the election with some room to spare — they won’t need the seats in Louisiana and Alaska, for example, even though they might win them anyway.
Similarly, Republicans have about a 25 percent chance of finishing with 54 or more Senate seats, which would require them to win at least one race (most likely either North Carolina or New Hampshire) where they slightly trail in the polls. A win in New Hampshire, in particular, would be a bellwether for a Republican landslide year. Democrats have a reasonably popular incumbent there in Jeanne Shaheen, who has been elected and re-elected in New Hampshire many times. When candidates like that lose, it’s a sign of a wave.
Scenario 2: Solid Republican win (35 percent chance)Our probability distribution peaks at 52 or 53 Republican seats. That’s what you’ll get if the leader in the polls in every state wins (allowing Kansas, which is a toss-up, to go either way). Of course, it’s quite unlikely that the polls (or the FiveThirtyEight forecasts) will get every state exactly right. You could also get in this range if, for instance, Republicans failed to pull off Alaska but won North Carolina.
An outcome like this probably wouldn’t be “called” for Republicans on Tuesday night, although there are cases where a Republican win would be extremely statistically likely even if it hadn’t been declared officially by news organizations. For instance, if Republicans win 50 seats and need just one more from among Georgia (going to a runoff), Louisiana (ditto), Iowa (going to a recount) and Alaska (waiting for more ballots), their probability of capturing the Senate will be well above 90 percent.
Scenario 3: Republican squeaker (10 percent chance)Somewhat oddly, our forecast says there’s relatively little chance — only about 10 percent — of Republicans winning a 51-49 majority exactly. This is mostly because of the behavior of the independent in Kansas, Greg Orman, who, if he wins, has said he’ll caucus with whichever party has a clear majority. So Orman will often act as an “add-on” senator, bolstering the winning party’s margin in the Senate.
To a lesser extent, the low probability attached to a 51-seat Republican Senate reflects the distribution of the polls in the various battleground states. Republicans are narrowly ahead in most of them — if the polls are about right, the GOP should finish with at least 52 seats. But if the polls get one state wrong — say, Colorado — they could get other ones wrong as well. Republicans might not stay on the precipice of winning the Senate with 51 seats and could lose it entirely instead.
Scenarios 4 and 5: Democratic squeaker (10 percent chance) and Democratic shocker (15 percent chance)We covered the difference between these two types of Democratic wins in Tuesday morning’s Senate overview. It doesn’t concern the number of seats Democrats win so much as whether there is evidence of systematic bias in the polls against them: There would be such evidence in the shocker scenario but not in the squeaker scenario — the latter instead would be the result of Democrats winning seats for idiosyncratic reasons.
To make this distinction, we’d probably want to consider which states Democrats win to keep the Senate. Wins in Alaska and Kansas — unusual and hard-to-poll races — might be more in line with the squeaker case. Wins in Iowa and Colorado — well-polled states that tend to follow the national mood — might imply the shocker scenario instead.
We’d also want to look beyond Senate races. There are number of extremely close gubernatorial races — for instance, it would make Democratic partisans extremely happy if they were to knock off Republican Gov. Scott Walker of Wisconsin, who is a 75 percent favorite to keep his seat according to the polls. Another benchmark is if Democrats win the aggregate popular vote for the U.S. House.
Even in the “shocker” scenario, Democrats’ majority in the Senate will probably not wind up at more than 51/49. But there’s an outside chance they could do better than that. Mark Pryor of Arkansas and Alison Lundergan Grimes of Kentucky now look unlikely to win based on the polls — they have a 4 percent chance and a 2 percent chance, respectively, in our forecast. But unlikely is not the same thing as impossible. Between politics and sports stuff, we’ve issued thousands of probabilistic forecasts at FiveThirtyEight over the years. We know that those 2-percent chances — and even lower — do come through every once in a while.

November 3, 2014
Final Update: Republicans Have A 3 In 4 Chance Of Winning The Senate
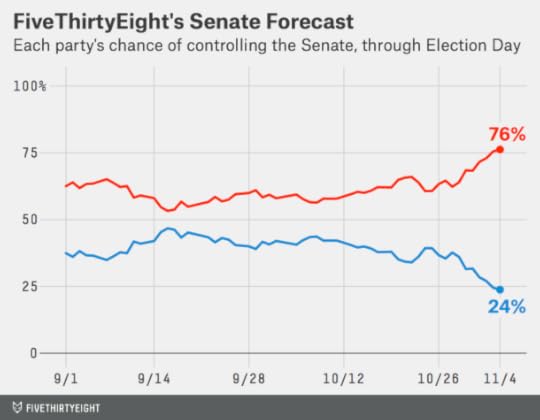
After two months of forecasting, it comes down to this: Republicans are favored to win the Senate. Their chances of doing so are 76 percent, according to FiveThirtyEight’s Senate forecast, which is principally based on an analysis of the polls in each state and the historical accuracy of Senate polling.
But they are not necessarily favored to have the race “called” for them on Tuesday night. Because of a variety of circumstances like possible runoffs in Georgia and Louisiana and the potential decision of Kansas independent Greg Orman about which party he chooses to caucus with, the outcome of the Senate may not be determined until days or weeks from now. The forecast refers only to the probability that Republicans will eventually claim control of the Senate by the time it convenes in January.
Still, for Republicans, it would be worth the wait after failed attempts to win the Senate in 2010 and 2012. They’ve been modest favorites in the FiveThirtyEight forecast all year, in part because the national environment is favorable for them: the group of states holding key Senate elections lean red; several Democratic incumbents have retired and the others were last elected in 2008, a high-water mark for the Democratic party; President Obama is unpopular and midterm elections have a long history of being challenging for the president’s party.
Unlike in 2010 or 2012, however, the polls have moved toward Republicans in the closing days of the campaign — making their position more robust. The movement has been clearest in states like Kentucky, Arkansas and Georgia that typically vote Republican, suggesting the election may be converging toward the “fundamentals” of each state.
The uncertainty in the forecast is fairly high. Compared to Republicans’ roughly 75 percent chance, President Obama had about a 90 percent chance of being reelected in 2012, while Democrats had a 95 percent chance of keeping the Senate that year, according to the FiveThirtyEight forecast. And Republicans had about an 85 percent chance of winning the House on Election Day in 2010.
For Democrats to make good on their 25 percent chance of keeping the Senate, they would need to win two or three races where they are underdogs according to the polls. Nevertheless, the GOP’s advantage is narrow in many states. Furthermore, polls in midterms and other elections have sometimes proved to have a systematic bias, overestimating the performance of one or the other party in most or all competitive races. If the polls underrate Democrats, they could win.
The uncertainty runs in both directions, however. Historically, the polls have been just as likely to be biased toward Democrats as they are to be biased toward Republicans. If Republicans beat their polls, they could win North Carolina and New Hampshire, which only narrowly favor Democrats, and finish with as many as 55 Senate seats — a potential 10-seat swing.
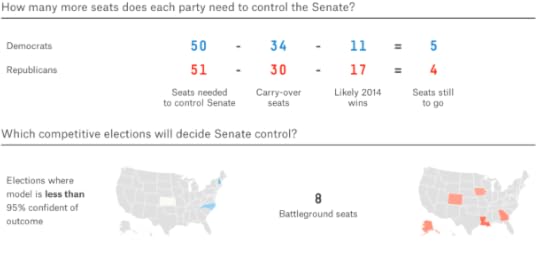
It has sometimes been hard this cycle to place the states into neat groupings. Republicans need to win a net of six seats from Democrats. But at least three of these — Montana, South Dakota and West Virginia — are all but guaranteed Republican pickups, while a fourth, Arkansas, has become increasingly certain. On the other hand, Republicans could easily lose Georgia and Kansas, meaning that they’d need to win a gross of seven or eight Democratic seats to finish with a net of six.
The battle will mostly be concentrated in the eight states which neither party has established more than a 95 percent probability of winning. These are Alaska, Colorado, Iowa, Georgia, Kansas, Louisiana, New Hampshire and North Carolina. Other states — particularly Arkansas, Kentucky and Michigan — were once competitive but would now require pronounced polling errors for the trailing candidate to win.
Still, eight is a large number of competitive states. The good news for Republicans is that they’ll win the Senate if they split them 4-4. The better news is that the forecast favors Republicans in five of them — Alaska, Colorado, Georgia, Iowa and Louisiana — while it gives even odds in a sixth, Kansas. Only New Hampshire and North Carolina favor Democrats. The math is not impossible for Democrats — but it’s difficult.
That may be why some Democrats have begun to hope the polls are “skewed” against them.
Indeed, the FiveThirtyEight model accounts for the possibility that the polls could have an overall bias toward one party. But suppose they do not. In the final set of simulations we ran, Democrats won just 14 percent of the time when the overall bias in the polls was less than one point in either direction. This represents what we’ve called the “squeaker” scenario — Democrats eke out victories in just enough of the competitive states to win, even though the polls do a reasonably good job overall.
The Democrats’ alternative is the “shocker” scenario — the case where the polls do prove to be skewed against them. In the simulations where the polls had at least a 1-point Republican bias, Democrats won the Senate 61 percent of the time. (As should be obvious, Democrats will have no chance at all if the polls prove to have a Democratic bias; instead, Republicans will finish with something like 54 seats.) At this point, most of the Democrats’ 24 percent overall win probability comes from the “shocker” scenario. Their situation is not as bad as Mitt Romney’s was in 2012, but their chances are slim if the polls are basically telling the right story.
Forecasting Models Largely AgreeAlthough the polls could be wrong, there isn’t much disagreement about what they’re saying. Of the seven forecasting models tracked by The New York Times, all point to a Republican win, and most with about the same probability (75 percent) as FiveThirtyEight’s forecast. Furthermore, they agree on the outcome of all states but Kansas. These include models that rely on polls alone and those like FiveThirtyEight’s that account for polls along with other factors.
Those other factors — the so-called “fundamentals” — have tended to converge with the polls over the course of the year. If used properly, they can make a forecast more stable and reduce the statistical noise associated with polling. But they make little difference now, since even those models that once used the fundamentals no longer weigh them heavily. The modest exceptions are in Kansas and Alaska, where the polling has been sparse and (especially in Alaska’s case) potentially unreliable; the FiveThirtyEight model sees the fundamentals as favoring Republicans in each state. But it would still have Republicans favored on the basis of the polls alone in Alaska. And in Kansas, the fundamentals are not enough to make Republican Pat Roberts the favorite.
Expect A Long Night — Unless Republicans Get A Big Win EarlyEven if Republicans win, the outcome may not be determined quickly. David Perdue, their candidate in Georgia, has gained in the polls — but the model still has the race going to a runoff about half the time. Louisiana will almost certainly require a runoff. Alaska’s vote may take days or weeks to count, as it has in the past. The FiveThirtyEight model — even with its optimistic forecast for Republicans overall — estimates there’s just a one in three chance that the election will be called for them on Tuesday night or early in the day on Wednesday. For Democrats, meanwhile, there’s almost no chance to win without going to “overtime;” the party will hope to extend the race for as long as possible.
There are two Republican wins, however, that could end the race quickly. Pay attention to races in North Carolina and New Hampshire. Both states have early poll-closing times (7:30 EST for North Carolina and 8:00 EST for New Hampshire) and a Republican win in either state would require Democrats to run the table in almost every other competitive race. But Republican wins would simultaneously indicate that the polls might be biased toward Democrats rather than against them, making a Democratic sweep the rest of the night very unlikely.
Although this represents FiveThirtyEight’s pre-election forecast, we’ll be tracking the elections for as long as it takes on Tuesday night and Wednesday morning. That will include live updates of our forecast as our partners at ABC News project the winners of various states. We’ve appreciated your readership this election cycle and we hope you’ll join us tonight for our liveblog coverage as the results come in. It should be a fun one.

Democrats Need Chaos
Democrats are down to about a 25 percent chance to retain the Senate, according to the latest FiveThirtyEight forecast. A 25 percent chance isn’t nothing. The average National League hitter hit about .250 last year.
But what would a Democratic Senate win look like? Harry Enten and I pondered that question earlier. There are two basic scenarios.
First, Democrats could win in a squeaker. If the races behave more or less independently from one another, Democrats could keep the Senate by narrowly winning a number of states where they are only modest underdogs in the polls.
Alternatively, the Democrats could win in a shocker, with the polls proving to have a systematic bias against them. These things happen, although — as we’ve emphasized repeatedly — the polls have just as often had a systematic bias against Republicans.
We’ll consider the “squeaker” vs. “shocker” distinction in more depth in our final Senate update early Tuesday morning. But there’s another thing that would characterize a Democratic win. It would, very probably, require some electoral chaos.
We’ve talked before about the strong possibility the Senate’s outcome will not be determined on Tuesday or even by later this week. Instead, resolution may require one or more forms of “overtime”: Greg Orman deciding who to caucus with if he wins in Kansas, runoffs in Georgia or Louisiana, a slow vote count in Alaska and possibly one or more recounts.
Even as Republicans have consolidated their overall position in the polls, overtime remains more likely than not. While our model gives Republicans a 75 percent chance of winning, it shows only a 30 to 35 percent chance that a Republican victory would be called by midday Wednesday.
But if Democrats win, it will almost certainly require overtime. We show just a 5 percent chance the election will be called for them on Tuesday or early Wednsday.
Let’s do some arithmetic. (You can follow along on the ‘math’ tab on our Senate interactive.) Democrats need 50 seats. They start with the 34 they’re holding over from the current Senate. In another 11 states, they’re at least 95 percent likely to win according to our model; that gets them to 45.
Let’s also give Democrats North Carolina and New Hampshire, where they’re narrowly ahead in the polls. Democrats aren’t certain to win these, but if they don’t, all of this math won’t matter. These are must-win states for Democrats; in our simulations, they lost the Senate 98 percent of the time they lost New Hampshire and 97 percent of the time they lost North Carolina.
That gets Democrats to 47 seats. They need three more.
Iowa and Colorado are their next best choices if they want to avoid chaos. Although there have been disputes about where the polls stand in those states, the circumstances in Iowa and Colorado are otherwise normal — no runoffs, no major third-party candidates. They’ll be called on Tuesday or early Wednesday morning unless they’re so close as to be in recount territory.
That gets Democrats to 49 seats. They need just one more, and here’s where they run out of good options.
Mark Begich could win in Alaska. But that’s one of our chaos states. In the past two Senate races there, the outcome took 15 days to call. Begich would not only have to win, he’d have to win by a definitive margin — and that’s unlikely.
Kansas? If Orman wins, it’s a chaos state.
Georgia? It’s a chaos state unless one candidate gets past 50 percent of the vote to avoid a runoff. The Republican David Perdue is close to 50 percent in some polls, and he could easily cross that threshold. But a winning majority in Georgia on Nov. 4 has become a real long shot for Democrat Michelle Nunn. At this point, she’s probably hoping to facilitate a runoff and take her chances later on.
Louisiana? Chaos state. Democratic chances of holding the Senate have become grim enough that they might have to count on Sen. Mary Landrieu to pull through. But Landrieu is even more likely than Nunn to require a runoff; our model now gives Landrieu less than a 2 percent chance of winning an outright majority on Tuesday.
Arkansas? Kentucky? They aren’t chaos states, but the polls have broken against Democrats in both states, and there’s no time left to make up ground. Our forecast gives Sen. Mark Pryor just a 6 percent chance of winning in Arkansas and Alison Lundergan Grimes just a 3 percent chance in Kentucky.
So Democrats are very unlikely to win a “clean” victory on Tuesday or Wednesday. The messier things get and the longer they take to resolve, the better their chances.
Of course, Democrats have benefited from a little chaos before. After the 2008 elections, they gained a 60-seat super majority in the Senate only after Al Franken won a lengthy recount in Minnesota and Sen. Arlen Specter of Pennsylvania switched parties. In 2001, Sen. Jim Jeffords of Vermont defected from the GOP and began caucusing with Democrats, giving them majority control.
If Democrats do hold the Senate, it is likely to be very narrowly — probably either 50-50 or 51-49, counting two to three independents and Vice President Biden’s tie breaking vote. But as the Jeffords example proves, a 50-50 or 51-49 majority in the Senate is not so safe: Any party switch or any special election can potentially flip it.
A chaotic Democratic win — or a chaotic Republican one — could beget more chaos later on.

Why Michelle Nunn Is Rooting For A Senate Runoff In Georgia
In reading the polling trends, it matters which baseline you compare them against. Compared with a month or so ago, the situation doesn’t look so bad for Democrats in Georgia: Michelle Nunn’s chances of winning there were 28 percent Sept. 30, according to our forecast, and they’re 26 percent now. She still has a chance. Her chances haven’t faded toward zero as those of some other red-state Democrats (like Alison Lundergan Grimes’s of Kentucky) have.
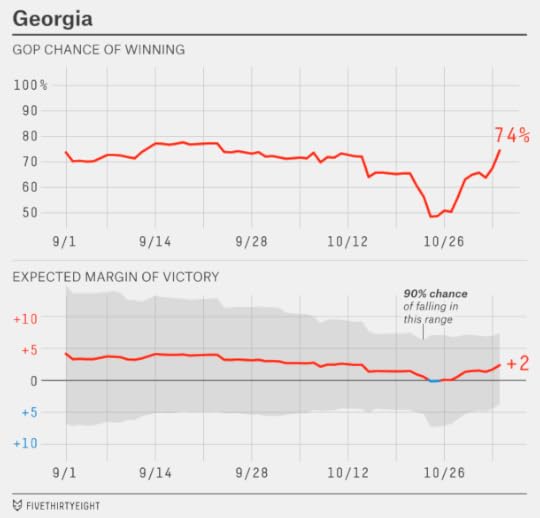
But Nunn’s chances have slipped in recent days. After a string of polls in mid-October put her slightly ahead in her race against Republican David Perdue, the past 12 polls we’ve added to our database — including four Monday morning — have had Nunn tied or (more commonly) behind.
The Georgia race is complicated by the possibility of a Jan. 6 runoff if neither candidate gets to 50 percent of the vote Tuesday. Previously, it looked as though Nunn was hoping to avoid a runoff, which might feature less favorable circumstances for her than Tuesday’s ballot. Now her best hope may be to keep Perdue below 50 percent of the vote and extend the race.
FiveThirtyEight projects Perdue to get 49.7 percent of the vote Tuesday, Nunn to get 47.7 percent and Libertarian Amanda Swafford to get 2.6 percent. Swafford’s standing has slipped slightly in recent polls, from about 4 to 3 percent. Furthermore, our research has found that third-party candidates polling in the low-to-mid-single digits often slightly underperform their polls on Election Day. (This property is accounted for in our projection of Swafford’s vote share.)
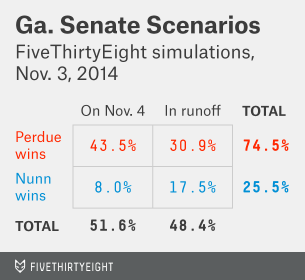
Of course, there’s uncertainty in that forecast. Perdue is close to enough to 50 percent of the vote that he could fairly easily surpass it and win outright Tuesday. Specifically, our forecast gives him a 44 percent chance of doing so. Nunn, however, would need to beat her polling projection by 2 to 3 percentage points. There’s only about an 8 percent chance of that. The other 48 percent of the time, the race will go to a runoff.
What would Nunn’s chances be in that event? There are two complications in figuring this out.
First, we’d have two more months of campaigning. That increases the degree of uncertainty. Perhaps Nunn could find a new line of attack against Perdue. Perhaps Perdue would trip himself up, as he nearly did in October after comments he made about outsourcing. Or maybe Nunn would lose by 12 points. But higher uncertainty is good news for the trailing candidate.
The other complication is even wonkier. Conditional upon the race going to a runoff, Nunn will probably have slightly beaten her polling forecast Tuesday. Nunn trails Perdue by 2 percentage points in the FiveThirtyEight forecast. If she does any worse than that, her margin of defeat could be larger than Swafford’s vote share, which means Perdue would win the race outright. But if she does a little better Tuesday, she’ll secure a runoff.
Put another way, the race in Georgia will only go to a runoff if it was very close to begin with. And that suggests a runoff would be close as well. (The model assumes there’s some correlation between the Nov. 4 and runoff outcomes.) Thus, the FiveThirtyEight forecast gives Nunn a 36 percent chance of winning a runoff conditional upon one occurring — better than her chances of winning Tuesday.
She’d be an underdog, but it would be comparatively good news. If one candidate wins outright Tuesday, there’s a better than 80 percent chance it will be Perdue.
CORRECTION (Nov. 4, 12:23 p.m.): A previous version of the first chart in this post showed the incorrect confidence interval.

Is 2014 A Republican Wave?
If the polls are right, Republicans will take control of the United States Senate when it reconvenes next year. They’ll retain the majority of the nation’s governorships, although perhaps with a net loss of one or two seats. FiveThirtyEight hasn’t issued a House projection this year, so here goes nothing: Republicans will keep it. (Want more detail? The Cook Political Report thinks Republicans will gain a few seats, probably a net of 6 to 12, from Democrats.)
Sounds like a pretty good night for Republicans? It would be. But there are a few apparent complications.
Complication No. 1. Some prominent Republican incumbents are likely to lose. Senator Pat Roberts of Kansas is no better than even money to keep his seat against independent Greg Orman. Incumbent Republican governors are underdogs — some by slim margins — in Alaska, Florida, Kansas, Maine and Pennsylvania, while Rick Snyder of Michigan and Scott Walker of Wisconsin are likely but not certain to survive.
Complication No. 2. Republicans are largely playing on home turf. The average Senate race this year is being held in a state where Barack Obama won just 46 percent of the vote in 2012. In the House, meanwhile, the median Congressional district is Republican-leaning. (Democrats tend to be packed into geographically compact, urban areas; this tendency is sometimes enhanced by gerrymandering.) A method of assessing the score probably needs to account for this.
Complication No. 3. The House, Senate and gubernatorial results seem to tell different stories. Polls project major Republican gains in the Senate but modest ones in the House and perhaps a net loss of Republican governorships. How to reconcile this evidence?
The third part is the easiest to resolve — and probably the most important to a macro-level understanding of Tuesday’s outcome. Most Senate seats on the ballot this year were last contested in 2008, an extraordinarily strong Democratic year. House seats were last contested in 2012, a pretty good Democratic year. Most governorships were last on the ballot in 2010, an awful Democratic year.
So if the election goes about as polls predict, it would suggest that 2014 was way worse for Democrats than 2008 and somewhat worse than 2012 but somewhat better for them than 2010.
Well, duh.
We can get to this conclusion in other ways too. In recent election years, as split-ticket voting has become less common, the aggregate popular vote for the U.S. House has become a more reliable measure of the overall mood of the country. Unlike the presidential vote, it gives us a data point every two years instead of every four. In the chart below, I’ve tracked the House popular vote in every election since 2000.
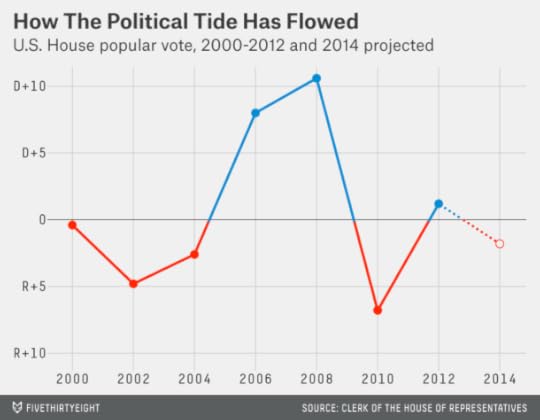
This measure tells us a lot of things we knew already: 2000 was even politically. Republicans had a good year in 2002 — unusually, they gained seats in the midterm elections — as George W. Bush was popular and national security weighed heavily on voters’ minds after the Sept. 11 attacks. The GOP advantage narrowed a bit in 2004 but Bush won reelection. The tide shifted to Democrats in 2006 and, even more so, 2008. There was a huge reversal back toward Republicans in 2010. But they had a disappointing year in 2012.
The data point for 2014 reflects this year’s generic congressional ballot, a poll-based projection of the national House vote. There’s been huge variation from survey to survey on the generic ballot, but the average currently favors Republicans by about 2 percentage points. If the average is about right, it would tell us the same thing we inferred a few paragraphs ago: 2014 is a better year for Republicans than 2012 and a much better year than 2008 but not as good as 2010.
So maybe this isn’t so complicated, after all. The polling data we have tells a pretty consistent story. The challenge is in the different interpretations it will enable, all of which will feature prominently in the post-election spin.
Harry Enten and I tend to be absolutists when it comes to interpreting the national mood. That is to say, we look at how the parties performed relative to a zero baseline of absolute partisan neutrality. So we might look at the generic ballot, which shows the GOP at +2, and see that as indicating a good but not great year for Republicans nationally. If you’ve heard us express skepticism that this year is a “wave” election for Republicans, this is why: we’re not seeing one party dominate to the extent it did in 2006 or 2010.
The reason I tend toward the absolutist view is because I see American political history as being highly stochastic (if not random, then at least hard to predict over the long term). If a party has a terrific year, as Democrats did in 2008 or Republicans did in 2010, I don’t interpret that as saying much about what the political landscape is likely to look like in future seasons. Instead, history is littered with proclamations of “permanent” or “emerging” majorities that proved to fail miserably.
There’s also the relativist’s viewpoint. It measures waves not as compared to zero but instead relative to previous elections. For instance, it would consider 1938 to be an enormous Republican wave year in the House of Representatives because President Roosevelt’s Democrats lost a net of 72 seats. The absolutist would point out, however, that Democrats still held the House majority 262-169 after those elections.
Both perspectives are valid. The relativist’s viewpoint is more common in political discourse — most histories of the 1938 election would call it a Republican wave year, for instance. But the absolutist may have a better way to reconcile those different-seeming Senate, House and gubernatorial results, since he recognizes that the shift in seats in each one is coming relative to a different baseline.
A lot of the debates you’ll hear after this election will really just be semantic. The relativists are looking at the magnitude of the wave while the absolutists are looking at the height of the tide.
There’s one other, important part of the story, which has to do with incumbency. Although the ebbs and flows of American political history are largely unpredictable — in my view, anyway — there has been some tendency at all levels of American government for incumbents to be reelected.
However, as my colleague Dan Hopkins pointed out last week, the incumbency advantage has been waning from its historic highs in the 1980s and 1990s. We can see some evidence of that this year too.
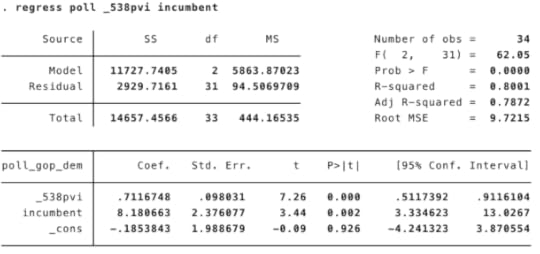
Let’s look at the gubernatorial data first. This is going to be a nerdy approach. We can run a regression model where the dependent variable is the current margin separating the Republican from the Democratic candidate in the FiveThirtyEight polling average1 and the independent variables are incumbency2 and state partisanship as measured from presidential results based on FiveThirtyEight’s version of partisan voting index (PVI).3
State partisanship (PVI) from presidential elections is, unsurprisingly, a predictor of the projected results of this year’s gubernatorial elections — although the relationship is less than one to one. Instead, every additional vote that Mitt Romney or John McCain earned translates into about four-tenths of vote for a Republican gubernatorial candidate this year. This means that gubernatorial elections are less strongly partisan than presidential ones. For instance, the polls say a Democrat is probably going to win the gubernatorial election in Kansas this year and a Republican will probably win it in Massachusetts, things that would almost never happen for the presidential vote in those states.
More important is the coefficient on the incumbency variable, which is roughly +7. This indicates that incumbents are performing a net of about seven points better than non-incumbents, controlling for state partisanship. So incumbency is still an advantage on average.
However, it’s much less of an advantage than it used to be — if we had run the same analysis on an election from the 1980s or 1990s, we’d have come up with something like a 15- or 20-point incumbency advantage instead. The current incumbency advantage is small enough that it can more easily be outweighed by other factors: If, for example, a Republican incumbent is trying to get re-elected in a blue state, or if he’s unpopular or has run a poor campaign, he might well lose. This helps to explain why a number of Republican incumbent governors are likely to lose despite it being a reasonably good environment for Republicans overall.
Finally, the constant term in the regression is interesting. It’s roughly +2, which means that in a purple state with an open seat race, we’d expect the Republican to win by two percentage points based on the overall political environment this year. That closely matches what we see on the generic ballot.
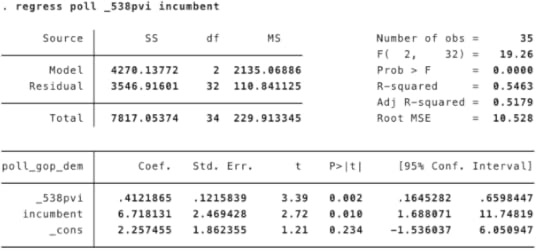
Let’s quickly run through the same calculation for Senate races based on the FiveThirtyEight adjusted polling average in each state.4
These results tell a similar story. The relationship between presidential results and Senate results is higher than for gubernatorial races. But the incumbency advantage is about the same: eight points. That’s a lot better than nothing but low compared with the norms of the late 20th century.5
So is 2014 an anti-incumbent wave? That also depends on whether you’re a relativist or an absolutist. In a relative sense, incumbents are much more vulnerable than we’ve been used to. But in an absolute sense, it still helps on average to be an incumbent. Imagine that, instead of incumbency being an 8-point advantage, it was an 8-point disadvantage6 Not only would every incumbent in a competitive Senate race be certain to lose; a number of them in states that haven’t been on the political radar would be in the fights of their lives. Democrats Dick Durbin of Illinois, Al Franken of Minnesota, Cory Booker of New Jersey, Tom Udall of New Mexico, Jeff Merkley of Oregon and Mark Warner of Virginia would be in very close races. Republican Thad Cochran of Mississippi would be an underdog to hold his seat, while Lindsey Graham of South Carolina, Lamar Alexander of Tennessee and John Cornyn of Texas would be threatened in theirs. As many as 18 incumbents could lose. That’s what an absolutist’s anti-incumbent election might look like.
Instead this year, we’ll have to settle for a climate that’s less pro-incumbent than usual — and also somewhat pro-Republican. At least, that’s what we’ll be getting if the polls are right.

November 2, 2014
Are The State Polls Skewed?
Democrats’ odds of holding the Senate are declining based on the latest polls. But the race is close. Republicans are counting on narrow leads of just a percentage point or two holding up in some of the most important races, like those in Iowa, Colorado, Georgia and Alaska.
Last month, I examined the possibility that Senate polls could prove to be biased or “skewed” against Democrats. If the polls have even a modest bias against Democrats, the party’s chances of keeping the Senate would be more like 50-50. And if the polls have a more severe anti-Democratic bias, it would be favored to keep its majority.
There is, indeed, some precedent for this, and we don’t have to go back far. In 2012, the average Senate poll underestimated the Democratic candidate’s actual performance by 3.4 percentage points.
However, there have been just as many years, like 1994 and 2002, when the polls proved to have a pro-Democratic bias instead. And over the long run, there’s been no long-term bias toward either Democrats or Republicans in Senate polls. Many efforts to predict the direction of bias in the polls, from the silly to the sophisticated-seeming, have failed in the past. The direction has often reversed itself from one cycle to the next.
Some Democrats, however, are not asserting the polls will have an overall bias: Instead they’re focused on particular states, especially Colorado, which might just be enough to let them keep the Senate. In 2010, Democratic candidate Michael Bennet won the Senate race there despite narrowly trailing Republican Ken Buck in most surveys. And President Obama won Colorado by a slightly wider margin than the polls predicted in 2008 and 2012. If Democrats win Colorado, their chances of keeping the Senate would rise to 40 percent from 27 percent, according to the FiveThirtyEight model’s simulations.
So, let’s ask a few questions:
What has been the historical bias of the polls in states other than Colorado?Has the direction of this bias been consistent from election to election?Are there other factors that predict state polling bias?The data I’ll be using is from FiveThirtyEight’s pollster ratings database, which covers polls conducted in the final three weeks of campaigns since 1998. (You can download the data here.) I’ll be using polls from all presidential, Senate and gubernatorial races in which a Democrat and a Republican were the top two finishers.7 I’ll also use polls of the U.S. House, but only in states like Alaska and Delaware that have just one at-large congressional district. Bias is calculated as the difference between the actual election result and the polled margin. For example, if the Democrat is projected to win by 5 percentage points in a poll and she wins by just 2 points, that poll would have a 3-point Democratic bias.
Here are the numbers:

There’s a lot going on in this chart, which my colleague Allison McCann put together. The states are sorted by the average bias since 1998, with states where polls have been biased toward Democrats on top and those where they were biased against Democrats on the bottom.
Democrats, indeed, have outperformed their polls in Colorado — by an average of 1.6 percentage points since 1998. That closely matches Republican Cory Gardner’s lead over Democrat Mark Udall in the polls this year. So, if they have the same bias again, the race will be a tossup. The polls have also been biased against Democrats in Iowa, another key Senate race, by an average of 1.5 percentage points.
But that’s where the good news ends for Democrats. In the other eight states with the most competitive Senate races, the polls have historically had a bias toward Democrats. This has been by a trivial amount (0.2 percentage points) in North Carolina and New Hampshire. But it’s been more significant elsewhere: by 1 or 2 percentage points in Arkansas, Georgia, Kansas, Kentucky and Louisiana — and by a whopping 7 points in Alaska. If I adjust our forecast according to the historical bias in each state — for instance, adding 2 points to Udall’s projection in Colorado but subtracting 7 from the Democrat Mark Begich’s in Alaska, Democrats’ odds of keeping in the Senate would decline slightly overall, to 24 percent from 27 percent.
This testifies to one of the problems with the arguments over “skewed” polls. Like other polling-related debates, they often rely on cherry-picked evidence. If Democrats want to go down the path of evaluating the historic bias in state polls, they’ll wind up in a slightly worse place at the end; the gains they make in Colorado and Iowa are offset by further deterioration in Alaska and to a lesser extent in Georgia and Louisiana — some of which they’ll have to win to keep the Senate.
But this is premature. Is there any consistency in state poll bias in the first place? For instance, does the historical bias in Colorado and Alaska tell us anything about what it might be this year?
There is some consistency from cycle to cycle. About half the polls in our pollster ratings database were conducted between 1998 and 2007; the other half have been in elections since 2008. So we can cleave the data into halves and see whether the bias ran in the same direction in each period. In 35 of the 50 states, it did.
However, there’s also quite a bit of noise — the correlation is a modest .32.8 Furthermore, some of it is caused by the way I’ve handled undecided voters in this calculation. If you treat them differently, the consistency in state poll bias drops to almost nothing — see the footnotes for more about that.
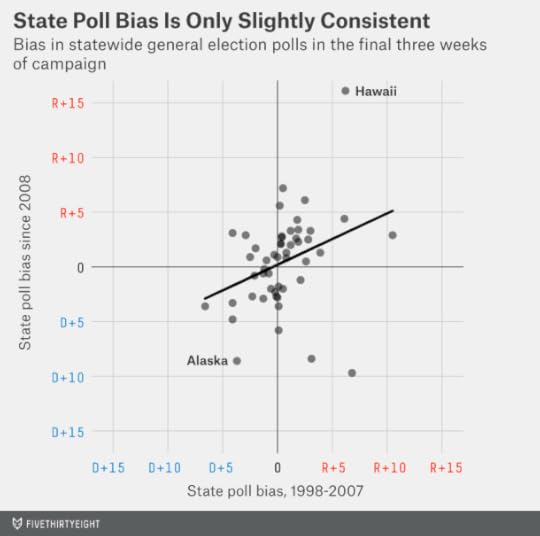
As some of you may have noticed, however, there’s a much stronger relationship between poll bias and state partisanship. The five states where Republicans have most outperformed their polls are Wyoming, Alaska, Idaho, Oklahoma and North Dakota. Democrats have done best relative to their polls in Hawaii, Delaware, New York, California and Nevada. Republicans have tended to beat their polls in red states while Democrats have beat theirs in blue states.
In the chart below, I’ve compared the direction of state poll bias in elections since 2008 against the results of the 2004 presidential election between George W. Bush and John Kerry. (The Bush-Kerry numbers are taken relative to the national popular vote margin. Kerry did not win Ohio in 2004 — however, he performed slightly better there than he did nationally.) The reason I use 2004’s results rather than some later year is to test whether partisanship had predictive power out of sample — in elections held from 2008 onward, at least four years after the Bush-Kerry results were known.
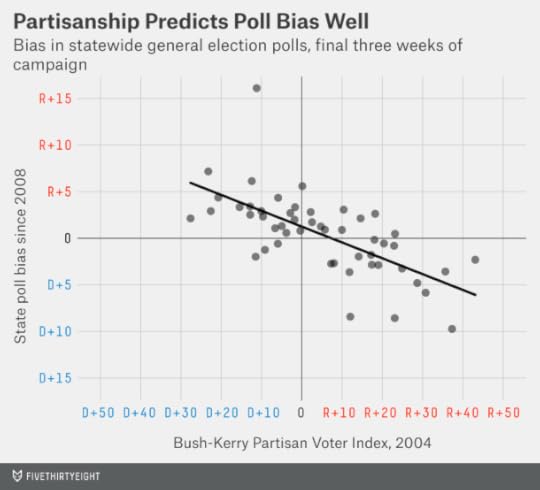
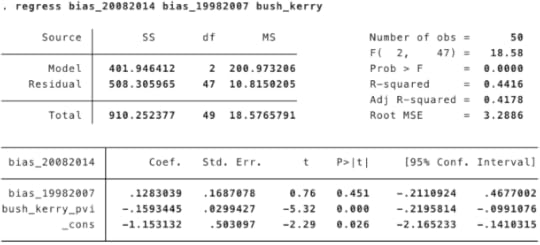
This correlation is quite strong: it’s .66.9 Furthermore, once you account for it, there’s no longer much meaningful information conveyed by the past direction of polling bias in the state; partisanship rules instead. If a red state had a Republican bias in the past — as Louisiana did from 1998 to 2007 — you’d nevertheless predict it to have a Democratic bias in future years.
This is potentially bad news for Democrats: Think about where the key Senate races are being held this year. They’re all in purple or red states. No Democrat from a solidly blue state is at risk of losing his seat, and Susan Collins, the Republican senator from blueish Maine, is not going to lose hers.
If past patterns hold, you’d expect polls to be unbiased in purple states like Iowa and Colorado — and biased against Republicans in those like Kansas and Alaska, two hard-to-poll races that are instrumental to Democratic hopes of keeping their majority.
Some of this may have to do, as Sean Trende describes, with the behavior of undecided voters. In Kentucky, for example, Democrat Alison Lundergan Grimes’s share of the vote has held fairly steady at 42 or 43 percent — however, Republican Mitch McConnell’s has increased from 42 or 43 percent to about 48 percent. A good candidate (like Grimes) in a tough environment (like Kentucky for a Democrat in a federal race) may capture her voters early on but then run out of voters to persuade. (As I’ve mentioned, the handling of undecided voters also matters somewhat in the bias calculation — see the footnotes for more about that.)10
More broadly, this may be an argument for looking at state “fundamentals” along with the polls — as the FiveThirtyEight model does (although the fundamentals receive very little weight in the model at this stage of the election). Among the most important fundamentals variables are simply past election results. For incumbent senators, what was their margin of victory in their previous race? And has the state voted Democratic or Republican in past presidential and congressional elections?
The Senate fundamentals do not favor Democrats this year. The elections are being held in a red-leaning group of states. Several of the Democratic incumbents won fairly narrowly in 2008, when they were last on the ballot, despite it being a terrific year for Democrats nationally. Republicans will win the Senate if they flip the Democratic seats in Montana, South Dakota, West Virginia, Alaska, Arkansas and Louisiana, while holding all of their own.
While there are some legitimate reasons to worry that the polls could be biased against Democrats this year, this is one reason to think they could be biased toward Democrats. Indeed, while the polls have moved toward the red-leaning fundamentals in several states like Kentucky, there’s an argument the GOP is still underperforming them nationally. The generic congressional ballot currently favors Republicans by about 2 percentage points (although it’s been wildly inconsistent from survey to survey), less than the 5-point advantage that the opposition party has had on average in midterm years. This is despite the dour mood of the country and Obama’s unpopularity.
Although you should trust the polls at this point, they suggest a range of outcomes are possible. It’s plausible the polls showing a larger Republican advantage on the generic ballot (like the ABC News/Washington Post poll, which puts the GOP up 6 points) will prove correct. If so — if we wind up with a strongly Republican-leaning national environment — we’ll know fairly early Tuesday night that Republicans are going to win the Senate. They’ll probably win some states (North Carolina and New Hampshire on the Senate side, along with a number of gubernatorial races) where they slightly trail in the polls. Gardner could win by high single digits in Colorado, as could Joni Ernst in Iowa.
The FiveThirtyEight model accounts for the possibility that the polls could be biased in either direction. That they could be biased against Democrats is part of what’s keeping Democrats’ hopes alive. But they could be biased against Republicans, too. Historically, that’s been the case more often than not in red states like the ones where some of the most crucial Senate races are being held.
CORRECTION (Nov.3, 10:57 a.m.): A previous version of this article said that since 1998, polls have been biased against Democrats in Colorado by an average of 2.2 percentage points and in Iowa by 1.8 points. They have been biased by 1.6 points in Colorado and 1.5 points in Iowa.

November 1, 2014
Senate Update: Polls Point Increasingly To Republican Senate Win
By this point in an election year, when polls are coming in by the bucketload late in the evening, you can get a sense for which pollsters are taking fresh samples of public opinion and which are herding toward the conventional wisdom.
 J. Ann Selzer, whose firm Selzer & Company conducts the Des Moines Register’s Iowa Poll, is in the former group: She’s always been one to trust what her data is telling her. On Dec. 31, 2007, Selzer’s poll was among the first to show a large lead for Barack Obama in the Iowa Democratic caucuses — most other polls had a small edge for Hillary Clinton. But Selzer’s poll proved to almost exactly match Obama’s margin in the caucuses four days later.
In September this year, Selzer’s poll showed a 6 percentage-point lead for the Republican Joni Enrst in the Iowa Senate race, defying others that had shown the race as a tossup. Although an early October Selzer poll showed the Democrat Bruce Braley narrowing his deficit to just 1 point, the final Des Moines Register poll, released Saturday night, has Ernst up 51-44 — a 7-point advantage. Other polls of Iowa show Ernst ahead, on average, by a percentage point or two.
Of course, the polling average is usually a more reliable indicator than even the best polls. No poll is clairvoyant — even one that consistently rates as among the most accurate in the country, as Selzer’s does. Polls face inherent limitations because of sampling error, and even the best pollsters face challenges in getting voters to talk to them. If Ernst’s 7-point lead in Selzer’s poll represented the equivalent of a point spread, the FiveThirtyEight model would take Braley’s side of it.
But the model is increasingly confident that Ernst will win. Her chances are improved to 71 percent, up from 62 percent before the Des Moines Register poll. That’s about as large a swing as you’re likely to see on the basis of a single survey, at least in a densely polled state such as Iowa.
This poll, in other words, is a big deal. Just as Ernst’s chances have surpassed 70 percent for the first time, so have the GOP’s chances of taking over the Senate, which are now 72 percent. This is not coincidental: Iowa is a pivot point in the Senate calculus, and the two numbers have closely tracked each other for much of the year.
As I wrote Friday, there were previously six Democratic-held seats where the polls came to a reasonably clear consensus that the Republican candidate was ahead. These included Montana, South Dakota, West Virginia, Arkansas, Louisiana and Colorado. (Colorado is the closest of the six, but Republican Cory Gardner has led in 15 of the past 17 nonpartisan polls.)
If you add Iowa to the list of likely Republican pickups, they’ll have more of a buffer if they lose some of their seats — such as Kansas (where recent polling has shown Republican incumbent Pat Roberts just slightly behind independent challenger Greg Orman) or Georgia (where Republican David Perdue’s standing has rebounded in recent polls but perhaps not by enough to avoid a runoff against Democrat Michelle Nunn). Nor will the GOP have to rely on Alaska, where the polling has been a little crazy.
On Friday, I posed the question of whether the polls would have to be systematically wrong for Democrats to hold the Senate.
Technically speaking, we’re not quite there yet. If Democrats win Georgia and Alaska and North Carolina, and Orman wins Kansas and caucuses with them, they’d hold the Senate even if Republicans flipped Iowa, Colorado and the five other Democratic-held seats where GOP candidates have an advantage in the polls. But that’s quite a parlay to pull off.
Here’s one way to think about it. The FiveThirtyEight model accounts for the possibility that the polls could be systematically biased — in either direction. If I instead tell the model to assume the polls have no overall bias — even though they might be off in particular states — the Democrats’ chances of keeping the Senate would be just 17 percent. Democrats are becoming increasingly dependent on the possibility that the polls will prove to be “skewed.”
Check out FiveThirtyEight’s latest Senate forecast.


Nate Silver's Blog

- Nate Silver's profile
- 729 followers

