
Danny Dorling's Blog, page 8
March 15, 2023
Falling down the global ranks: Life expectancy in the UK 1950-2021
New global ranking for life expectancy shows decades-long UK decline.
A new analysis of global rankings of life expectancy over seven decades shows the UK has done worse than all G7 countries except the USA. Researchers writing in the Journal of the Royal Society of Medicine say that while UK life expectancy has increased in absolute terms over recent decades, other, similar countries are experiencing larger increases.
In 1952, when Queen Elizabeth II came to the throne, the UK had one of the longest life expectancies in the world, ranking seventh globally behind countries such as Norway, Sweden and Denmark. In 2021 the UK was ranked 29th.
The researchers show the rankings of the G7 countries at each decade from 1950 to 2020. The G7 is a collection of countries with advanced economies (UK, Canada, France, Germany, Italy, Japan and the USA) that represent about half of global economic output.
One of the researchers, Dr Lucinda Hiam, of the University of Oxford, said: “The rankings show that the only G7 country to do worse than the UK is the USA.”
The relative decline of the UK portrayed in the figures is stark, say the researchers, adding that the causes of the UK falling down the life expectancy ranks appear to have been decades in the making. “While politicians invoke global factors, especially the effects of the pandemic and the invasion of Ukraine, the reality is that, as in the 1950s, the country suffers from major structural and institutional weaknesses,” said another researcher, Professor Martin McKee, of the London School of Hygiene & Tropical Medicine.
The researchers point to income inequalities which rose greatly in the UK during and after the 1980s. “That rise also saw an increase in the variation in life expectancy between different social groups,” said Professor McKee. “One reason why the overall increase in life expectancy has been so sluggish in the UK is that in recent years it has fallen for poorer groups.”
Danny Dorling added: “Team GB may do well at the Olympics, but we do not fare so well in the rankings of what actually matters most in life”
According to the OECD, state the researchers, the UK recently became the second most economically unequal country in Europe after Bulgaria. “Perhaps we should not be surprised to see that inequality reflected in such wide health inequalities and a declining overall position,” said Dr Hiam.
Dr Hiam and her co-authors describe the UK at a crossroads, with the cost-of-living crisis meaning that ‘business as usual’ is no longer an option. “In the short term, the government has an acute crisis to address. However, a relative worsening of population health is evidence that all is not well. It has historically been an early sign of severe political and economic problems.” said Dr Hiam. “This new analysis suggests that the problems the UK faces are deep seated and raises serious questions about the path that this country is following”.
For the full article and a link to where it was originally published, click here.

The falling rank of the UK out of 200 countries by life expectancy


March 10, 2023
The Oxford Bus Gates and Open Minds
You may have become aware of a little controversy surrounding a few small changes concerning how car traffic is routed through the city of Oxford. On Saturday February 18th a rally was held to demonstrate against the proposed introduction of six new bus gates in the city. Five people were arrested, but it largely passed off peacefully. The Oxford Mail reported that this was all under the watchful eyes of police horses Wilma and Odin.1 You cannot fault the Oxford Mail for the level of detail it provides, or at times wonder if so little usually happens in Oxford that its earnest reporters are driven to report even the names of the horses.
People best known for having famous relatives (Lawrence Fox and Piers Corbyn) and a Neo-druid from Stonehenge (King Arthur Pendragon) wearing his robes all spoke against the proposed bus gates. The Neo-druid explained his concerns: ‘If they say you cannot go out of Oxford, how are you going to turn up to places like Stonehenge for the Solstice.’2 Lawrence, Piers and Arthur were joined by other groups including many Covid-19 lockdown sceptics, anti-vax folk, fascists, and “balaclava-clad ‘anti-fascists’.”https://www.oxfordmail.co.uk/news/233... They came from all across Britain. Some may even have flown in for the event. As many as 2000 people were there. It would not be unkind to describe some of them as conspiracy theorists. But others had genuine worries given what they had heard and read on-line. Some had concerns that the new bus gates would be turning the city into a prison. This affair has, after all, been reported as a semi-serious news story around the world.4

An existing Oxford Bus Gate
There are plenty of reasonable people with worries that their method of driving and the routes they might have to take will change in the near future. However, local opposition was joined by outsiders bringing their own unrelated agendas. Many people at that march were not conspiracy theorists, but also have suspicions as to the motives of the traffic planners. At a time when central government is doing so much that harms so many people, why believe that something being proposed by a part of local government might be benign or even beneficial?
Worries about transport changes need to be addressed with sympathy for those with genuine concerns about how their own lives will be affected. By looking back at the history of traffic calming in Oxford it can be easier to see that what is about to happen won’t be as bad as they think, and that the changes are needed. This is because changes in the past were clearly needed, they were also often opposed, and hardly anyone now complains about past changes.
Why did the large rally happen? When traffic was rerouted in Oxford in the past there was always a little controversy, but nothing ever on such a scale. When cars were prevented from using Cornmarket, and later when buses were too, there were grumblings. When a bus filter was introduced to stop cars, other than taxis and a few other vehicles driving on the High Street, there were some moans. In the 1980s and 1990s when bollards were introduced into some streets so that bikes could pass, but not cars, an irate letter or two was sent to the Oxford Mail, but 2000 people never gathered before in Oxford to complain about traffic restrictions.

Another Oxford Bus
We now live in far more fractured times and this may be the reason why the protests have been so much more vitriolic this time. The city is more fractured by economic inequality than it was in the 1980s; but most of the opposition to the bus gates is from a few very well off business-people and other outsiders. If you wanted to entertain a conspiracy theory, it could be that by getting the conspiracy theorists of the world to focus on the bus gates, most opposition to them has now been made to look ridiculous. However, I can find no evidence of a safer-streets campaigner carefully seeding the idea to achieve this (possibly very useful) outcome. The bus gates are now practically an inevitability, as not to introduce them would be to bow down to the wisdom of Laurence Fox, Piers Corbyn, Arthur Pendragon, and their supporters.
If you want to know what has been proposed and consulted on, you can look it up easily. The introduction of the bus gates may be delayed, due to delays on the rebuilding of the Botley Road rail bridge, but they will now almost certainly soon arrive.5 Their official name is ‘experimental traffic filters’, but ‘bus gates’ is a far better description for reasons I’ll try to explain below. Two thirds of local residents support the plan.6 Short of a financial emergency occurring in 2023, preventing the county council from making any discretionary expenditure, which is not impossible, the bus gates are coming. And short of it turning out that they result in disaster – they are very likely to stay.
Rather than rehearsing yet again the arguments for and against bus gates, it might be more useful to look at how previous traffic re-routing schemes in Oxford have been introduced, why they happen, and how we so very quickly became used to them. No one now calls for Cornmarket to be opened up to cars again; or complains that shutting Broad Street to most traffic is a bad thing. In fact, it would have been very hard for 2000 people to have held a rally there against traffic calming measures, if traffic measures hadn’t been introduced to make that space so much more open.

And a Third Oxford Bus (buses always come in threes)
The most recent controversy in Oxford concerned the introduction of a few low traffic neighbourhoods. It was obvious to anyone who cared to look, but especially to someone who was not used to it, that Oxford had a problem with its traffic. I arrived back in the city in 2013, having been away for 27 years. The traffic jams shocked me. I was especially shocked by the rat-running in the streets of East Oxford where children from my secondary school used to play as children (children whose parents often spoke Urdu as their first language). The city had changed in many places almost beyond recognition in terms of gentrification; but for some reason action had been slower to address Oxford’s growing traffic problems than had been the case in much of the rest of England.
I was asked to give a few public talks on my surprise at coming back to Oxford and finding it was so behind-the-times as compared to cities like Sheffield, where I had been living for the last ten years. Shortly after arriving back in the city a Conservative county councillor told me, only half-jokingly, that anything which slowed down her driving her large car from her far flung village in North Oxfordshire to lunch at the Ashmolean roof-top restaurant could not be permitted to happen. It slowly dawned on me that perhaps it had been the Conservatives’ almost continuous control of the County Council, that explained the state of the city’s streets. The county has responsibility for traffic, not the city.
I published a proposal (Figure 1), based upon worrying about people, and especially children, cycling around the city.7 The map is shown below. I suggested that the major arterial roads could be made one way to motorised traffic, not least because almost all of the serious car/van/lorry/bus and cycle collisions (and deaths) in Oxford occur at intersections on those roads. But I also suggested that five barriers to cars could be introduced on roads in inner East Oxford, to stop rat-running and also make the Cowley Road a far safer place to walk and cycle (buses would be allowed through).

Figure 1: A Proposal made in 2016 to try to improve traffic flow and safety in Oxford
I am no traffic engineer. But it is now clear that the traffic engineers of the county had been planning for many years what to propose when their political leaders changed and an administration came in that was less interested in how quickly four-by-fours could drive into the city. Rather than just suggest five barriers, as I had in 2016, they later proposed 14, which were implemented in 2022. These are shown in the map below (Figure 2) taken from an anti-low traffic neighbourhood leaflet.8 They are now all in place, and were added to the three which had been in place on those streets already. I like to think that I may have helped a little by suggesting that this kind of thing was sensible, but rather like Spike Milligan in his series of books on the importance of the part he played in the war, I think the outcome would have been the same regardless.

Figure 2: Image from a leaflet opposed to a restriction to some motorized through traffic
Now the “road closures” in East Oxford have been completed, opposition to them has quickly ebbed away. Of course, the roads were not closed, instead there was simply a restriction to some motorized through-traffic. Adding a restriction to through traffic actually opens the road to users other than car drivers. Children are able to cycle to school and play outside with less fear, everyone can cycle or walk more safely.
“Closure” implies that roads are intended just for drivers. It also implies that driving is no longer possible, when it is. It was just that through-driving has been stopped.
People have very quickly become used to the roads being largely car traffic free; and to how much quieter the Cowley and Iffley Roads now are without so much traffic trying to turn onto them from side streets. Buses can now travel more freely as they are less stuck in traffic jams on those two roads. Although the London Road is still very busy, which is part of the reason why new bus gates are planned for the near future.
Why do I think that it was inevitable that the low traffic neighbourhoods (LTNs) would come in (and be accepted) and that the new bus gates will now be introduced in 2023, 2024 or 2025 and similarly be accepted after initial opposition? And why don’t I think that any one individual making a suggestion that this would be a good thing matters that much? The answer to all these questions is that this is what always happens. But we can become better at understanding this if we look back at what has happened in the past.
The next map below (Figure 3) shows brilliant work recently published by CycleStreets.9 Their highly skilled researchers used OpenStreetMap (all one word!) data and ingenious analysis to calculate where all the rat-runs are across the UK. It was obvious that there was a problem before in Oxford. But why was the problem so concentrated in that part of east Oxford in particular? I can’t help thinking that it might have been because those streets in the past were home to some of the poorest children in the late 1970s and 1980s. Oxford really has gentrified, some parts more than others. But it was some of the parts that were poorest in the past that had been most neglected when it came to making streets safer.

Figure 3: Rat runs in part of the city of Oxford prior to 2022
It is not poverty that causes a street to become a rat-run. It is lack of traffic planning and planning officers being less pressurised to make streets safer where children were poorer in the past. The next map below (Figure 4) shows the same area of Oxford, before the new LTN’s came in. However, now all the pre-existing LTNs are included. We did not call them LTN’s before, but just look at how many streets in this part if Oxford has been cut-off from motorised through-traffic prior to 2022. This was due to bollards, gates, or narrow gaps being introduced in the late 1970s, 1980s, or a little later. All that happened in 2022 was that a few more circles were added to the map below. All that will happen when the new bus gates come in, is that there will be six more such circles on the CycleStreets maps of Oxford, and pollution will fall, and buses, vans and taxis will travel more smoothly.

Figure 4: Roads closed to motorised through traffic in part of the city of Oxford prior to 2022
Today, almost all the streets of East Oxford are coloured blue-green on the most recent national map when zoomed into this city (Figure 5). Oxford district as a whole now has 68% of streets (by length) which are Low-Traffic Neighbourhoods, 12% are not, and the remaining 20% are the main roads.10 Following the changes made in 2022, the two areas of Oxford with the least low traffic neighbourhoods are now Summertown and Old Headington.11 Interestingly, these are two of the more affluent parts of the city today. The normal trend-over-time, where it is usually the most affluent areas that become 20mps zones first, or get zebra crossing first, may be ending.

Figure 5: Roads closed to motorised through traffic in part of the city of Oxford by 2023
Of course, more could be done. At present, a great deal of motorised traffic and cycles moving from east to west in Oxford are funnelled into the Plain, before crossing Magdelan bridge. The University, and a couple of colleges in particular, could help reduce the danger of cycling on the Plain by making other routes across the Cherwell possible by bike. In some cases new bridges already exist, but they are private bridges, closed to the general public, and not well connected to cycle paths. The ‘servant’s entrance to the city’ is the only cycle route in that is off-road. This is the one the travels past where Parson’s pleasure once operated. One day the idea that we close that particular cycle and walking route on two days each year, just so that it does not become a right of way, will appears as ridiculous as the original purpose of Parson’s Pleasure.
The debate over traffic calming in Oxford has often been tortuous to watch. At times, local councillors have had to remind their colleagues of why all this matters so much. It is not just about making the city greener and traffic moving more efficiently. It is also about safety, especially safety for older people and children. On February 14th 2023 in one county council debate, when the county was setting its budget for the year, one councillor had to remind her colleagues about why Oxford needs to be a safer city:
Cllr @RosalindRogers
(LD, Headington): “I had to watch a friend of mine hit by a car at 30mph when I was 9. If she had been hit at 20mph she might have survived.”
(Source: Tweet)
The next stage will be the introduction of six new bus gates (see Figure 6). They are officially called traffic filters because a large number of other vehicles will be allowed through them, including the private cars of local residents up to 100 times a year for free. However, their main purpose is to ensure that buses can travel smoothly, especially during rush hours.

Figure 6: The next six bus gates or ‘traffic filters’ – planned for experimental introduction
No doubt there will be much debate as these are introduced. In that debate it is worth remembering that this development is mainly about buses. It is also about what has to change before a great many new buses can be added to the low or zero carbon fleet in Oxford (see Figure 7 for where only zero emission vehicles travel freely). As the Central Oxfordshire Travel Plan (COTP) makes clear: “Working with local bus operators, we will roll out a fleet of zero emission buses across the area. Funding awarded through the Zero Emission Bus Regional Areas (ZEBRA) scheme together with council and bus operator funding, will see the first phase of this ambition realised through the delivery of 159 electric local buses. Covering a large proportion of the COTP area, these buses will be used on routes in Oxford by 2024.”12

Figure 7: The existing (pilot) zero emission zone in the centre of Oxford
There are other changes coming too. Oxford already has its first zero emission zone in operation. If you drive into the streets shaded red in Figure 7, without paying the levy, you will be fined. The levy is £10 a day unless you are driving a low emission vehicle (when it is then £8), ultra-low (a levy of £4) or zero (£0). All these levies are set to double by 2025. A £60 fine is possible if the levy is not paid; but it can be halved if you pay the fine promptly.13 Figure 8 shows where the scheme is set to be expanded to, but as yet no date set for the public consultation on this proposal.

Figure 8: The proposed extension of the zero emission zone in the centre of Oxford
You can try to imagine how these proposals will change life in the city but it can be hard to do so. Maybe students in most colleges in future will no longer so often be dropped off and picked up at the start and end of each term by parents driving cars – unless that is they pay the various levies to do so. Instead, their responsible adult(s) will be able to say goodbye to them at the park and ride car parks on the outskirts of the city when they drop them off with their luggage to take the last leg of their journey on the bus. It’s better if University folk mix a little more with others and if students get to use a bus early on in their time in the city.
You may live outside of the city and if you already travel by public transport think that all these changes will not have a great effect on you, but Oxfordshire is also changing, not just Oxford. In February 2023 20mph limits were approved for much of Kidlington, Chilton, Church Hanborough, Kingston Lisle, Milton-under-Wychwood, North Hinksey, South Leigh, and Binsey Lane (on the edge of Oxford)14. The era of Toad of Toad Hall is coming to an end.
In 2018 two thirds of the poorest tenth of households in the UK did not have a car, half of the next poorest tenth had no car. These proportions will be higher in Oxford as car ownership is much less common in the city than it is in the UK as a whole. In contrast, almost 95% of the best-off fifth of households have a car, with three quarters of these households having two or even three or more cars each!15 The graph below (Figure 9), drawn by Charlie Hicks, makes the inequality more obvious.16 Often the debate about traffic routing is presented as if it is a battle between affluent upper-middle-class eco-greens on their cargo bikes, verses honest working class folk in their cars. But what is actually happening in Oxford is a change to make it possible to run a bus service well. Of course, how Oxford attracts and houses enough bus drivers and mechanics, people to clean the buses and the streets and all the other hundreds of jobs required to make a city work well is another question. In October 2022 the cutting of bus services in Oxford due to problems of recruiting drivers was reported by the BBC. The excuse given for delaying recruitment was not terribly plausible: ‘The Oxford Bus Company said there was a nationwide shortage of bus drivers and added a planned recruitment event in September had to be cancelled when the Queen died.’17 However, if in future the job of being a bus driver in Oxford is made better, by not having to spend so much of your day sitting in traffic dealing with upset and delayed customers, perhaps retaining drivers will become easier?

Figure 9: The distribution of who owns cars in the UK by household income
It is often said that those most in favour of new traffic calming measures in Oxford are many of the well-off residents of the city. However, while some of this group might benefit from having less traffic outside of their own homes, or feeling that they were safer when they or their children cycled, this group are not those who suffer the most from the current situation. The group most badly affected by the current situation are people who rely on buses to commute into, out of, and across the city. That is the group who have the most to gain. In theory, in future, they could have a smoother and faster commute than car drivers. Were that to happen then the premium that people pay for the convenience of living in the city might fall, and the house prices of those who have seen their streets become quieter might not rise as much as they might anticipate.
The suggestion that one day Oxford could have a reliable, cheap, and very frequent bus service is usually greeted with great scepticism; but it is not even a possibility without bus gates. It has been over three years since it was first announced that the city aimed to become: ‘Britain’s first all-electric bus town’18 At the very end of January 2023 the £82.5 million deal was finally signed.19 The first of 159 new battery powered electric buses arrives in Oxfordshire in September 2023. Central government are paying £32.8 million of the cost of the buses and the infrastructure to charge them. The County Council have committed £6.0 million, and the bus companies £43.7 million. When I tell people this, the most common reply I receive is: “I’ll believe it when I see it”. The central government funding was contingent on the new bus gates being introduced.
Few people argue that they would rather have diesel buses idling in traffic jams. For some, it is the reduction in air pollution that matters most, for others it is the climate change impacts. For me, I will be thinking of that Somerville graduate who spent a couple of her teenage years up looking at who then sat on the buses in Oxford and was reported (by The Economist) many years later in 1986 to have said: ‘If a man finds himself a passenger on a bus having attained the age of 26, he can count himself a failure in life.’20 Perhaps one of the new buses should be named after her? Far more appropriate than naming a wing of a college or department after such a person.

Figure 10: Proctor’s Memorandum on cars and the behaviour of undergraduates, 1/10/1968
We each have our own perspective. Depending on how, where and when we travel, some of us have already noticed a reduction in traffic jams and often attribute this to the covid pandemic and the increase in home working. But an analysis by the Sunday Times found that so many people were using their cars after the pandemic, rather than public transport, that average speeds had reduced by 2.5mph.21 In Oxford it varies more by road and time of day than in many places. Oxford also has a remarkably large number of private schools and you can tell when their terms times are by how full the roads are in the morning and afternoon. Those who currently drive their children a long way from their home to a private school may not welcome the bus gates.
There is much more happening. A parking levy for businesses is due to come into force in Oxford in 2023 which should also reduce traffic (see Figure 10 for a much older one).22 There are issues about E-Scooters and cyclists, not least the huge number who arrive in Oxford from abroad each autumn and have to newly learn which side of the road, or cycle track to be on! There is the complexity of trying to explain that when the bus gates (‘travel filters’) are introduced they will not just allow buses to pass in the hours that they are at first operating, but also coaches, taxis, private hire vehicles, mopeds, motorbikes, vans, lorries, anyone with a blue badge in their car, anyone driving ing (by car) who cares for anyone else when they are driving to or from them, any cars used as goods vehicles, and any local residents who obtain a permit (with a maximum of three permits per household and 100 days free use a year). The scheme will not begin until 2024.23
Finally, I am left wondering one last thing. Why did the police name their horses after the Germanic Wilma (meaning ‘resolute protector’) and Nordic Odin (which translates as ‘raging and frenzied’)? There was once a time when there were far more horses on Oxford’s streets. People then said that it would always be so. Maybe we’ll see a few more horses in future? There was a time when the city of Oxford had trams. The country is currently too poor for that to be a possibility again, but maybe one day? The last figure include in this short article (Figure 10) is a note posted by the Proctors in October 1968. Times do change, albeit slowly.
For a PDF the original article this piece was published in click here
References – clickable links given in the text above – given here in full for posterity (as links always eventually break)
1. https://www.oxfordshirelive.co.uk/new...
2. https://www.oxfordmail.co.uk/news/233...
3. https://www.oxfordmail.co.uk/news/233...
4. https://www.news.com.au/technology/on...
5. https://www.oxfordmail.co.uk/news/231...
6. https://www.oxfordmail.co.uk/news/230...
7. Dorling, D. (2016) The Wind and the Willows, Oxford Civic Society Visions Newsletter, July, pp.5-6, https://www.oxcivicsoc.org.uk/wp-cont...
8. https://reconnectingoxford.weebly.com...
9. https://www.cyclestreets.net/localaut...
10. https://www.lowtrafficneighbourhoods....
11. https://www.lowtrafficneighbourhoods....
12. Page 33 of the Central Oxfordshire travel plan: https://letstalk.oxfordshire.gov.uk/c...
13. https://www.oxfordshire.gov.uk/reside...
14. https://twitter.com/OxfordClarion/sta...
15. https://www.ons.gov.uk/peoplepopulati...
16. https://twitter.com/Charlie_Hicks_/st...
17. https://www.bbc.co.uk/news/uk-england...
18. https://www.oxford.gov.uk/news/articl...
19. https://www.oxfordbus.co.uk/deal-sign...
20. https://www.theguardian.com/theguardi... quite when and exactly what words she used in this quip are hard to pin down, and she was certainly not to first to have made this ‘joke’. The Economist’s dating is given here: https://fullfact.org/news/margaret-th...
21. https://www.thetimes.co.uk/article/we...
22. https://www.bbc.co.uk/news/uk-england...
23. https://www.headingtonliveablestreets...
For a PDF the original article this piece was published in click here
February 27, 2023
A brief lull in the fighting?
On 1st of February 2023 half a million public sectors workers took part in strikes. These were the largest strikes in more than a decade. They included teachers, university workers, civil servants, train and bus drivers. Larger strikes by health workers were promised for the following week, including the first ever strike of mid-wives – who would still attend births – despite being on strike. Paramedics, ambulance staff and firefighters were all scheduled to strike in the following weeks. Many of the strikes had been on-going since 2022. At times it appeared that only the police and army had not been on strike. They were not permitted strike.
The number of strikes had grown so much that the BBC gave up trying to depict what was happening overall. The graph they produced in December 2022 became too complex to update later because there were so many more strikes by so many more workers in early 2023.

The first UK strikes of winter 2022/23
Source: BBC
One thing that few noticed at the time, was how quiet the right wing think tanks had become during this period. It was as if they knew that if they said anything, it would rebound on them. For a decade, these bodies had loudly rubbished suggestions that people should be concerned over whether they were paid enough to cover their basic costs, such as housing. They scoffed at the suggestion that the take of those paid the most was far too high, or that this was squeezing others’ wages. Below I’ll give a few examples of how they have changed their tune from what often preoccupied them during the last decade through to August 2022. I’ll begin with some of the comments they made on my work in the past.
In 2014 the ‘Head of Political Economy.’ at the Institute for Economic Affairs wrote that ‘A lot of nonsense is being written about the UK’s housing crisis. But Danny Dorling’s book “All that is solid. The great housing disaster” is easily the worst contribution so far.’[1] These kinds of comments came continuously, right through to a final flurry in August 2022, when this particular writer suggested that the ‘…left-wing writer, also frequently portrays “neoliberals” as a crossover between Ebenezer Scrooge and Hannibal Lecter.’[2] The comments then suddenly ceased. They ceased in the few turbulent weeks when the failed regime of Liz Truss and Kwasi Kwarteng came and went, when the strikes grew, and then the national tune changed abruptly.
Many other examples can be given of past vocal criticism of those who had mentioned low pay as a problem. In 2015, the ‘Head of Life Style Economics’ at the Institute for Economic Affairs complained about writing on the best-paid 1% and said: ‘It is not difficult to guess why left-wing writers in the UK have virtually abandoned the Gini coefficient in favour of focusing on the amount earned by the very richest.’[3] The Gini statistic is used to show that, other than Bulgaria, the UK is the most unequal country in Europe. But it was common then for these commentators to try to ridicule and cast doubt on any worry about inequality. The rise in this kind of criticism had begun in earnest in the years immediately after the book, “The Spirit Level” was published in 2009.
In 2017 the ‘Head of Life Style Economics’ (again) at the Institute for Economic Affairs (IEA) likened claims I and the charity Oxfam were making to what he called: “Karl Marx’s wretched immiseration theory”. He said: “I don’t think income inequality is very important, but those who do should acknowledge that it is now lower now (sic) than at any time since 1986.”[4] If you ignored the income of the top tenth of people and the least well-off tenth, then you could then make that claim that inequality has fallen, but you would only do that if you did not want people to know inequality overall had not declined. A year earlier, the IEA’s ‘Head of Life Style Economics’ had written: “It is no coincidence that the most vocal academics in the inequality debate – Richard Wilkinson, Thomas Piketty, Danny Dorling et al – are men of the left.”[5] He ignored the women writing on inequality, including Richard Wilkinson’s Spirit Level co-author, Kate Pickett.
In 2018 a Telegraph journalist, writing in the Institute for Economic Affairs blog pages, suggested that “…the old mercantilist fallacy that wealth is a zero-sum game abounds in contemporary politics, and in the work of economists…”[6] She did not mention the argument that many people could be so much wealthier if we only controlled the greedy; and that so many people are far more meaningfully wealthy – better housed, better educated, and healthier – in more equitable European countries.
It had become normal to expect to be accused of being fundamentally misguided if you suggested that Britain was not heading in the right direction. Of a book I wrote with Sally Tomlinson, titled ‘Rule Britannia: From Brexit to the end of Empire’ one reviewer in Spiked Magazine gave it the accolade of the ‘worst book ever’.[7] This was the third time in quick succession that a book I had written was labelled as the ‘worst book ever’ by a commentator associated with the Tax Payers’ Alliance, The Institute of Economic Affairs , Spiked Magazine, or the like.
So what are these think tanks saying today and how has their focus changed? On their blogs today there are now almost no mentions of inequality or of the strikes. At least none that I can find. Attacks on left-wing academics appear to have petered out, and these think tanks have less to say overall. Remarkably, the ‘Head of Life Style Economics’ at the Institute for Economic Affairs now critiques the current Conservative Prime Minster and Chancellor for not cutting taxes.[8] The ‘Head of Political Economy’ at that same body now writes blogs in which he wonders aloud if ‘…the main reason why nationalisation is so popular is that most people massively overestimate the profit margins in the industries in question.’[9] Incidentally, it is not the main reason. Most people would like the services to be run better and at a lower cost. Although the very high salaries of the privatized industries’ Chief Executives (and other senior staff) easily gives away just how much profit they do make, let alone any inspection of the dividends or rising wealth of shareholders, who now mostly live overseas.
Telegraph journalists in 2023 appear to spend less time talking up their impression of the merits of various Victorian era economic theories. They spend more time writing sketches about recently demoted Conservative Chancellors. However, often these show little foresight.[10] Now, instead of criticizing those who write about economic inequality, they more often speculate about cultural issues such Scottish policy on gender identity.[11] This Scottish policy was also the headline in Spiked Magazine a day after the Telegraph journalists’ piece.[12] In many ways this group acts like a herd while proclaiming the cult of the heroic isolated individual. Since August 2022 The Tax Payers’ alliance has turned its attention away from arguing that inequality was falling and towards trying to turn our focus to immigration, refugees, and those ‘small boats’.[13]
Why has the focus reverted to the obscure or to the old anti-immigration, anti-refuge, tropes? Part of the reason was the disastrous autumn statement of Kwasi Kwarteng who was doing exactly what Liz Truss wanted him to do. She in turn was doing exactly what the right wing think tanks had called for. All this ended in disaster. But another reason for the turn was the strikes, the general rise in unrest, anxiety, and anger. The lull in their commenting came at the very point that their ideas had been tried and failed, but caused great damage and further raised the basic costs of housing, fuel and food. They were, I think, hoping that few people who notice the part they had played in making the cost-of-living crises so much worse in the UK than it was elsewhere in Europe.
There is a phrase in football – you only sing when you’re winning. Hopefully this is more than just a lull.
For the original place of publication of this article and a PDF copy click here.
References
1. Niemietz, K. (2014) Danny Dorling’s ‘All that is solid’: The worst book on the housing crisis so far, Institute for Economic Affairs, 4 July.
2. Niemietz, K. (2022) Politically active left-wingers are the equivalent of the tribal football fan, 1828 blog, 31 August,
3. Snowdon (2015) The rich versus the super-rich, Institute for Economic Affairs, 16 February.
4. Snowdon, C (2017) How Danny Dorling (and Oxfam) recycle Karl Marx’s wretched ‘immiseration theory’, Institute for Economic Affairs, 20 January.
5. Snowdon, C. (2016) Is envy of the super-rich by the rest of the rich driving the inequality debate?, Institute for Economic Affairs, 25 May.
6. Grant, M. (2018) Ricardo’s ideas are as indispensable today as they were 200 years ago, Institute for Economic Affairs, 19 April.
7. Butcher, J. (2019) Is this the worst book written about Brexit? Spiked Magazine, 28 March.
8. Snowdon, C. (2022) Big Government, Big Borrowing and Big Inflation are probably here to stay, Institute for Economic Affairs, 8 December.
9. Niemietz, K. (2022) The economics and politics of nationalisation and privatisation, Institute for Economic Affairs, 2 December.
10. Grant, M. (2023) Crestfallen press pack fails to land scalp… or shiny forehead, The Telegraph, 25 January.
11. Grant M. (2023) Sturgeon’s gender ideology is imploding in real time, The Telegraph, 31 January.
12. Macwhirter (2023) Sturgeon’s trans crusade could be her undoing, Spiked Magazine, 1 February.
13. Protheroe, C. (2023) There is no quick fix to small boats, TaxPayers’ Alliance, 21 January.
February 22, 2023
What did the elections of 1922 and 2017 have in common?
You probably don’t know about the 1922 general election. It was the ‘breakthrough election’. The Conservatives under Andrew Bonar Law won; but Labour moved from fifth place in 1918 to third place, and increased the number of seats they held from 57 in 1918 to 142 1922.
Labour were led by John Robert Clynes. Self-educated, he was critical of how the government had treated voters in Ireland, and later opposed Ramsay MacDonald’s support for austerity during the depression years. Clynes was ousted by MacDonald as leader of the Party within a month of that election. MacDonald would go on to form a National government in 1931 with 473 Conservative MPs.

Image: J.R. Clynes. Source: Library of Congress.
There was enormous division and strife within the Labour Party in the 1920s. These were years in which inequalities were actually falling in society, but very few people knew that they were. Income inequalities had peaked in 1918. They fell more between 1918 and 1938 than in the next forty years.
Britain was changing rapidly in the 1920s. Hugh Dalton, who later became Chancellor of the Exchequer, studied the beginning of the income inequality fall while a student at the LSE. He was one of the few who measured what was happening.
Others wrote novels and plays where the backdrop was the fall in inequalities in the 1920s, but the two best remembered were not published until 1945. Brideshead Revisited and An Inspector Calls were both, in their very different ways, about unsustainable inequalities.
The 1922 election was not just notable for how well Labour did, but for it being the first election in many decades in which the geographical distribution of votes became more equal. In particular, the Conservatives lost more votes where they had been more popular in 1918. The graph accompanying this short article shows the trend (see note beneath the graph).

This figure was first drawn in 2006 and has be updated ever since by it’s author (although the data point for the 2019 election needs adding!)
From 1922 onwards, with just the smallest of blips in 1935, Conservative voters would become less and less geographically segregated in Britain. Irrespective of the ups and downs (in terms of which party won each election) at each subsequent election it became harder to predict how someone would vote simply by knowing which constituency they lived in. That trend continued onwards to 1959, and after then voter segregation hardly rose at all until the 1970s. However, after the election of Margaret Thatcher’s government in 1979 it rose at every successive election through to 2015.
None of this would be relevant today if it were not for one particularly uncanny contemporary parallel with the past. The first election after 1922, in which geographical segregation fell, was that held in 2017. The 2017 election was remarkable, not just for the damage done to Theresa May’s majority, but because the tide had been turned in the very long term trend. It may be too early to say – but something quite remarkable began in 2017 and it appears to be continuing. For the first time in almost one hundred years, geographical inequalities in voting between constituencies began to fall again.
In 2017, Labour picked up more votes in areas where it had had the least support in 2015, and fewer votes where it already piled them high. Although this might not be the best strategy to win elections, it was a sign of a shift. Voters in the South of England, in what had been solidly Conservative seats, began more often to vote Labour. Other voters, in seats where Labour had often taken support for granted, no longer voted Labour quite so enthusiastically.
In 2017 Labour increased its seat count to 262 (up 30), and its total vote to 12.9 million; but what was much less noticed was the shift in the geographical distribution of Labour and the Conservative voters. That shift accelerated in 2019. Again the shift was not much noticed. It was obscured by talk of a ‘red wall’ having been broken. Few people noticed that the Conservative share of the vote in all of South East England fell between 2017 and 2019. The Tory share in London also fell in 2019. However, commentators were much more interested in the loss of 60 Labour seats. They rarely pointed out that the number of Labour votes falling to 10.3 million meant Labour still polled more votes in 2019 than it had in 2005, 2010, or 2015. The fall in Labour voting was mainly due to lower turnout in 2019 as compared to 2017.
What parallels can we draw with the 1920s? Jeremy Corbyn was a very different MP to John Clynes, although both opposed the austerity of their times and both were attacked from within shortly after the two great shifts in voting. Inequalities, if measured by the take of the top 1%, were very high in both the 1920s and 2020s.
There are a few tentative signs that income and wealth are now falling, if only slightly. State pensions and many benefits have risen by inflation. This is not enough, as inflation for the poor is higher, but it is a larger relative increase than most people in employment are receiving. Many pay deals are being struck now that are progressive. Bosses offer higher increases for lower paid workers in an attempt to shame unions into agreeing a below inflation deal. As I write, house prices have fallen for many months. These falls are large when compared to inflation and may be the beginning of a redistribution of wealth.
I first drew the graph shown here in 2006. I have been waiting a long time for the shift. I may be too optimistic. But when it last shifted in 1922 that was not because Labour came to power that year, it was because inequalities had to fall. Steep social divides also began to fall, imperceptibly at first, under governments led by Conservatives who believed in the old ways, in hierarchy, and in people knowing their place. The divides fell while Labour were in disarray, at war internally. People fought for the divides to fall, but they did so successfully without the need for particularly inspirational Prime Ministers.
For a PDF of this article and where this was originally published click here.
January 9, 2023
About Our Schools: Foreword
We often don’t truly value something until we have lost it.
In the short term, children losing access to schools in the UK in 2020 suddenly brought home not just what schools do for most children physically but also what they do in the round. Schools are about far more than education. They are places where we become socialised into our society, where we learn to respect others and, in some cases, to look up to or down on others. They don’t just teach skills. Schools help us form our attitudes, beliefs and prejudices.
At some times and in some schools we are told that others are our betters, often other people not at our school. We learn to behave and to be disciplined, so that later in our lives our apparent superiors will find that we have been well trained; that we are respectful; compliant; that we know our place. This still occurs in England today. Not everywhere, of course, but the idea that different children are of different rank and worth is still endlessly stamped into young minds in ways that do not often occur so forcefully elsewhere in Europe.
When the classrooms emptied during the COVID-19 crisis of 2020/2021, it quickly became clear which schools were equipped and had the resources to teach online and which could not cope and handed out paper worksheets instead. The huge advantage of very low pupil–teacher ratios in private schools suddenly became glaringly obvious, not just normally but especially in a crisis. At the other end of the scale – for those for whom school was a sanctuary from harm and indifference at home – no longer being able to go to school was devastating. In a very small number of cases it will have been deadly. Schools do far more than teach. If we have learned anything from the pandemic, we now know that schools should be the last public institutions to close and the first to reopen.
The authors of this excellent book had school closures foremost in their minds because they began writing in earnest in early 2021, in the weeks when it became clear that, yet again, schools would be closed for many months. State schools were only kept open physically for the children of ‘key’ workers and those identified as being in special need. It turned out that everyone who worked in a school was a key worker – something that had barely been acknowledged before. It also turned out that the politics of education was not quite as clearly divided between good and bad as we might have thought. You are probably reading these words many months after it has been accepted that the new coronavirus is endemic and a zero-COVID strategy is impossible. However, it was a right-wing government that tried to keep the schools open and the left-wing unions (championing zero COVID) that demanded they close.
In hindsight, it is much easier to see what the right course of action would have been. This book has been written in contemplation of a much longer period when we could all take stock of what we were losing without our schools even being closed – the decades during which funding per head was cut for 13 out of 14 children, all those who attended a state school in England. Note: it is a much higher proportion than 93% in most parts of the UK and a much lower proportion among the people who get to determine education policy. Furthermore, division had been sown within the state system, with schools forced to compete against school for pupils, to attract and retain staff (not least teachers) and to be able to afford the upkeep of their buildings.
This book begins in 1976 which was the year that marked the end of optimism and trust in teaching and saw the dial adjusted to a new belief in the power of markets, centralisation and managerialism. The authors confess that their hope that the previous system would have thrived well was ‘probably misplaced’, which illustrates their freedom from conventional dogma. However, it is worth noting that in 1976 the UK was one of the most economically equitable large countries in Europe, second only to Sweden in terms of income inequality. By that measure, Germany, Italy, Spain and France all had more socially fractured societies in that year. In contrast, in the decades that followed – when markets, centralisation and managerialism were allowed to take over much of life in Britain, not just in education – the UK saw its levels of economic inequality grow to become by far the largest of any Western European country. It was not just education that fractured after 1976. Health, housing, employment and the distribution of material assets (including wealth) and other life chances also all saw developments that worsened lives and increased division.
Economic inequality matters in education. In the 1980s, a large number of places in private schools were sponsored by the government under the Assisted Places Scheme for (those deemed to be) the academically able children of parents who would not otherwise be able to afford the fees and the school would have had to close. Furthermore, incomes were more equal at the start of the 1980s and so not enough adults were paid so much more than others that they could afford to educate their children privately, so the commercial future of private schools was at stake. Private education only prosper in places where there is high income inequality. However, by the time Tony Blair abolished the Assisted Places Scheme in 1997, income inequalities in England had grown to such an extent that there were now enough pupils with very well-paid parents to fill the private school quotas without the need for a direct government subsidy. (The indirect subsidies that enabled tax avoidance were maintained.) But it is important to note that in no single year during the period since 1997 (which included all the New Labour years as well as the decade of austerity) did income inequality fall by any measurable amount.
It is perhaps unsurprising that during the same period there have been many changes in education but few progressive movements. In fact, there has been no progressive government in the UK since the early and mid-1970s. Most recently, under New Labour and then the coalition, we have witnessed the almost wholesale privatisation of universities.
One of the ways we hold on to hope is the belief, at times not entirely unfounded, that after many decades of banging your head against a wall and going in the wrong direction, a group of people – in this case, those interested in education in Britain – realise that a change of tack is required. At this point we need to know what to do next. The solutions offered in this excellent book are based on learning from what did not work in England between 1976 and today. Although the overriding ethos of markets and competition was not conducive to progress, many individuals and some organisations, most schools and millions of children and their parents struggled over those long years to improve many things. For example, we should not forget that these were years in which school became dramatically less violent places, a significant part of which was banning teachers from beating pupils – not everything was rosy before 1976.
There are so many wonderful suggestions in this book that you will have to read it to discover them; they cannot be summarised in a short foreword. One I particularly like is that ‘we should treat pupils not as they (sometimes infuriatingly) are but as they might become’. Recently, I met a teacher who is teaching in a school that I attended almost four decades ago. She told me she thought that none of her pupils would ever write a book. It was an ‘average school’: avoided by most of the wealthiest parents in the city and aspired to by many of the parents who live just outside its catchment area. I had some sympathy with her exasperation, but I had also been a child (at that school) who failed at English at age 16. I knew that did not mark me for life. I read my first word in 1976 – very late at age 8. I had good teachers, but I found reading hard. In the end, my mum taught me to read; my school barely improved on that although they tried and they taught be enough of maths and geography and science that I ended up writing many books. No one would have believed I could if they had seen how I wrote when I was at school.
We have all followed our own individual educational paths and each of these will have shaped us and, in turn, our views on education. Very probably, Margaret Thatcher, the education secretary from 1970 to 1974, would not have believed so strongly in her own personal superiority had she not been sent to a grammar school by her father or been awarded a place at an elitist university. Tony Blair, who came to power with the mantra ‘education, education, education’, and his one-time education advisor Andrew Adonis might well have had very different views on what a good education consisted of had they been differently educated too. In contrast, the authors of this book explain how every ‘young person can walk more than a few steps with genius’. They could have added that the geniuses among us tend not to seem quite so clever when you spend long enough hanging around them.
So many people who have steered the course of English education in recent decades, from prime ministers through to policy wonks, appear to have held the belief that they have truly realised their own personal potential and that it was because they held within themselves such great potential, which had somehow been allowed to burst forth and be realised, that their amazing ideas should be implemented. Such pomposity is pricked at many points in the pages that follow, including examples such as how, for all the hours of senior management teams brainstorming risk assessments, no one foresaw what might happen during a pandemic, through to how ridiculous it is that so many children are excluded from schools in England. Some 1,579 pupils are permanently excluded from English schools each year for each one of the five children excluded a year in Scotland – so almost 8000 a year in total in England. Try to imagine how that feels each year for each and every one of those children, for the rest of their lives.
Education, at its best, frees you from being told to believe that you are the natural inferior of others. At its worst, it leaves you with the impression that you are the natural superior of others. Education in England is in a terrible mess. If you don’t believe me, try describing what happens in your town, city or village to someone from elsewhere in Western Europe. Tell them how different children are selected to go to different schools. Tell them about the languages and arts that we no longer even try to teach. Tell them what ensues when our children are asked a maths or science question that is not directly connected to one of the answers they and their teachers have guessed would be on the exam paper. And then ask them what happens where they live in other Western European countries that did not travel the post-1976 road we took in England.
For a PDF of this book Foreword, and link to where it was originally published click here.
January 5, 2023
How austerity caused the NHS crisis
When the coalition government first introduced its landmark Health and Social Care Act in 2010, health secretary Andrew Lansley claimed the NHS would never again need to undergo such huge organisational change.
But even at the time, one widely respected commentator warned that – far from being the final fix that Lansley had advertised – the act “could become this government’s ‘poll tax’”.
In the event, it has been a slow-burn poll tax. Only now, ten years after it came into law, are we seeing its full effects, with publications from The Times to the Morning Star reporting that “A&E delays are ‘killing up to 500 people a week’”.
This figure – 5% above the normal number of people who die each week, though that baseline is also rising – can surely be traced back to the act, which ushered in a greater wave of privatisation than ever before. It compelled NHS management to behave as if they were in the private sector, competing to win business, and led to an increase in the proportion of contracts won and the use of contracts overall.
At the time, the damage caused was little noticed because government cuts in the first round of austerity targeted local authorities and adult social care. The first group of people to see their life expectancy fall were elderly women who most often lived on their own. It was in 2014 that this connection became apparent.
Back then, the government was still confident, with the Department for Health and Social Care rebutting any suggestion that austerity and privatisation might be linked to mortality. The privatisation figures were also opaque. In 2015, halfway through Jeremy Hunt’s tenure as health secretary, it was reported that ministers were misleading the public. By that point, private firms were winning 40% of new contracts – far higher than the 6% spend share claimed by the government and almost identical to the 41% won by NHS bodies.

A busy ward in an NHS hospital, Nick Moore / Alamy Stock Photo
The first great increase in mortality was recorded in that same year, a 5% rise that the government tried to attribute to influenza. The problem with that explanation was that the stalling and falls in life expectancy were not seen to the same extent anywhere else in Europe.
By 2019, life expectancy for women had fallen in almost a fifth of all neighbourhoods and in over a tenth for men. Poorer people, both old and young, in poorer areas suffered most, with infant mortality among babies born to the poorest parents rising. Later there was a rise in deaths of women who were pregnant.
As NHS waiting lists spiralled, a tenth of all adults, most of those who could, were resorting to accessing private health care in 2021. But, in doing so, they lengthened the lists further by jumping the queues and thus diverting resources.
By April 2022, the number of vacant beds in hospitals was at an all-time low. Estimates of the damage done kept rising. Less than six months later, it was claimed that austerity since 2010 had led to a third of a million excess deaths, twice as many as from the pandemic.
Now, A&E departments are stretched to capacity, unable to clear patients to other beds in our hospitals as they could in the past. Those other beds cannot be cleared as they were before because adult social care has been repeatedly decimated, with what is left being tendered out to private companies.
All of this was foretold. In the four years after 2015, the value of one group of private sector contracts in the NHS rose by 89%. These figures were released just before the 2019 general election, partly in response to Matt Hancock, then the health secretary, claiming that “there is no privatisation of the NHS on my watch.”
Again, the damage was not so much through the extent of covert privatisation, but through the wider ethos that had been promoted. Take the USA: most of the enormous amount of money spent on healthcare there has little impact on improving health, because the ethos is wrong.
It is sometimes said – wrongly, that is – that the NHS has not been further privatised because the share of its spending that went to the private sector remained roughly the same between 2012 and 2020. By 2020 that share was about 7%, or just under £10bn a year. It rose to over £12bn during the pandemic when the government paid private hospitals to treat patients, but because overall health spending rose, the proportion remained roughly the same, still around 7%.
But the number of private companies involved did increase greatly, particularly in areas where there was already more private healthcare. By last year, private firms were delivering a quarter of all planned NHS hospital treatment in the least deprived areas of England, and 11% in the most deprived areas. Those shares – which have risen since 2020 – are higher than the overall 7% because it is in planned hospital treatment where the private sector has most infiltrated the NHS.
Last year, the Health and Care Act of 2022 put paid to Lansley’s claim that he had fixed the NHS ‘once and for all’. The act reduces the compulsion of the NHS from having to tender so many services to private sector bidding in future, but it was not designed to stop the rot. It will not solve the service’s problems, though there is hope that it could be the beginning of an actual change in ethos.
The pandemic made the effects of privatisation clear: Britons now have the worst access to healthcare in Europe and some of the worst post-pandemic outcomes. But the successive health secretaries who inflicted this tragedy are unrepentant.
In 2018, Lansley criticised Hunt’s cuts in screening services, blaming them for delaying the detection of his bowel cancer. Hunt, meanwhile, went on to become foreign secretary and then chancellor of the exchequer. His legacy, as openDemocracy’s Caroline Molloy wrote last year, is “one of missed targets, lengthening waits, crumbling hospitals, missed opportunities, false solutions, funding boosts that vanished under scrutiny, and blaming everyone but himself.” Hancock is now most remembered for eating a camel penis and cow anus on live TV for money.
Belligerence, bravado and buffoonery. We got here because too many of us believed the words of fools.
For a PDF of this article and a link to the original source click here.
December 15, 2022
Who is being hurt the most?
Three different think tanks produced three contrasting analyses of the effects of the Chancellor’s autumn statement of November 17th 2022 and its accompanying Office of Budget Responsibility (OBR) report. Everyone agreed that we were almost all about to get poorer, but it was not clear who would suffer the most.
The first, analysis by the Institute for Fiscal Studies (IFS), said that ‘The most striking figures in the OBR report are those pertaining to living standards, as measured by Real Household Disposable Income per person. Down 7% over this year and next, much the biggest fall in living memory and off the back of very poor income growth for many years. This will hit everyone. But perhaps it will be those on middling sorts of incomes who feel the biggest hit. They won’t benefit from the targeted support to those on means-tested benefits. Their wages are falling and their taxes are rising. Middle England is set for a shock.’

The distribution effects of the November 2022 autumn statement – IFS
Source Institute for Fiscal Studies
The IFS produced the claret and amber graph shown here, showing the longer term implications of the autumn statement on households. The chart is of the ten conventional income groups. The implication being that the worse-off would benefit most. This was due to the state pension and many welfare benefits being up-rated by inflation. The IFS graph implied that the richest would lose the most due to tax rises. Their summary, that middle England was set to be hardest hit, suggested that the richest could quite easily absorb this dip. It was a dip their graph showed to be actually slightly smaller in terms of share of income of the best-off tenth, as compared to the loss for next best-off tenth. The IFS highlighted how a particular focus on targeting some more energy-cost-related benefit payments to the very poorest (to help with the rising costs of fuel) had caused the incomes of the poorest tenth to rise higher than pre-statement changes had promised.
Of course, the IFS graph was just showing changes in income, not in income after taking into account the rising cost of living – which is why the poorest appeared as if they were doing better than before, whereas in fact they were about to become much poorer. The second graph shown here, drawn by The Resolution Foundation (RF), illustrates this. The RF produced the most complicated and colourful chart, their “Figure 31” emphasised how the removal of the Health and Social Care Levy had given most money to those in the very top 5% of the income distribution. The levy had been announced in the run up to Christmas 2021, and was removed by the short-lived chancellor Kwasi Kwarteng with effect from 6 November 2022. It was one of the few things Kwarteng did, along with lifting the cap on bankers bonuses, that Jeremy Hunt, his successor, did not reverse. The very best-off benefited the most overall, although the title of “Figure 31” does not make that very clear, and as a percentage of their income, the gain for the top 5% is lowest, because their incomes are so very high.

The distribution effects of the November 2022 autumn statement – Resolution Foundation
Source: The Resolution Foundation
A third think tank, The New Economics Foundation (NEF), produced the third graph shown here (coloured green/blue), based on the same data as all the others, but now showing by how much worse-off households will be after the rising costs of having to pay for essentials had been taken into account, alongside any tax and benefit changes. It was titled: ‘The poorest households will fall a further £2,300 a year behind the cost of living’ and showed that it was the poorest who would lose out the most, despite their benefits having been protected. By this way of looking at things, only the best-off tenth of households would be any better off by 2024 because essentials make up such a small proportion of their costs, and because the OBR expect these household to increase their overall income a little, even after paying slightly higher taxes (for instance by increasing the rent they charge their tenants, for those of them that are landlords).

The distribution effects of the November 2022 autumn statement – NEF
Source: The New Economics Foundation
The NEF concluded that by April 2024, 37% of all UK households would be unable to afford the cost of essentials like putting food on the table or replacing clothes, while an additional similar proportion would be much worse-off than they had been a year ago, but still would be just about able to get by. The remaining quarter would be least affected, with a tiny few in their number becoming even better-off than before.
Finally, a fourth think tank, The Institute for Public Policy Research (IPPR), had waded in earlier, on September 23rd, after the mini-budget. The graph they produced back then had been far more simple, only coloured red. You can try to imagine what the overall situation of households living in the UK would have been if those tax cuts proposed in the disastrous September mini-budget had been enacted and the additional targeting of the poorest that the latter autumn statement had not taken place. Looking at this final red graph, and with the knowledge of the earlier three, you can see why even the international money markets reacted in horror at what Truss and Kwarteng were proposing earlier that autumn.

What the distributional effects of the September 2022 mini-budget would have been – source IPPR
All of the other think tanks (known collectively as Tufton Street) were largely silent on the November autumn statement, having heralded the September mini-budget as a resounding success. It had been their own former employees who had devised that catastrophe and who in many cases had been forced out of their special advisor and civil servant jobs shortly after it was announced, but a few still remain. Jeremy Hunt and Rishi Sunak are not that different from Kwasi Kwarteng and Liz Truss.
Most of the ensuing media debate was about Middle England. The other countries of the UK were not much mentioned (that contain fewer of the very best-off), nor that the poor would suffer most and some bankers least. Unlike the mini-budget, the autumn statement will have increased income equality a little, it is just that we will be mostly both a little more equal, and all much worse-off; except for those at the very top who have been most protected still – for now.
Who knows what winter will bring and what the actual spring budget of 2023 will be? A solidarity tax on the wealthiest 23,000 families, as Spain introduced in 2022, is unimaginable to many who live in Middle England and still mostly support the Conservatives today. But it might soon be hard to dismiss so easily.
For a PDF of this article and its original place of publication click here.
November 20, 2022
Don’t panic about the birth of Baby 8 Billion. Before he’s 65 our numbers will be in reverse
We should not be alarmed at the rise in global population; it’s inequality, greed and waste that are the real problems of our age.

Damian, the first newborn registered in the Dominican Republic on 15 November, was chosen to symbolise the 8 billion milestone, Photograph: Orlando Barría/EPA
The news of the 8 billionth person joining our species last week was a joyous affair, with the UN secretary general, António Guterres, declaring it “an occasion to celebrate”. In contrast, when the global population hit 4, 5, 6 and 7 billion, in 1975, 1987, 1999 and 2011 respectively, there was widespread dismay, although that did reduce with each billion. The doubling of our numbers in 47 years did not bring about the famines and other disasters widely predicted in the 1960s.
As Poonam Muttreja, the executive director of the Population Foundation of India, explained last week, we welcomed the new child whose birth marked this event and we are no longer afraid. We have learned that most of our population growth is not due to births but to most of us living much longer, as the Swedish physician and statistician Hans Rosling so brilliantly explained. When sadly he died in 2017, aged just 68, global average life expectancy was 72.
Collectively we are ageing, but life expectancy growth peaked in 1981. Then, people lived, on average, five years longer than in 1971 (61 years rather than 56). We will not become ever older and the rate of increase has been slowing globally for four decades.
Births peaked in 1990 with an echo of that peak 24 years later. The UN now predicts that there will never again be as many children born in a year as were born in 1990. Globally, births in 2022 were 8.5 million fewer than in 1990, despite there being far more potential parents alive today. Worries about populations growing in countries such as Tanzania are about people living longer, something we should not be concerned about. The average woman in Tanzania in 2020 was a mother to four children, 9% down on a decade earlier. UN projections are for that fall to accelerate to 15% a decade, to an average of 2.3 children in 2080.
The slowdown is due to billions of women demanding the right to choose how many children they have
One abiding myth is that extra people will inevitably add to carbon pollution. It is a myth sold like snake oil to the mathematically illiterate. “Everyone has a carbon footprint,” the tale begins. Thus, any increase in people must increase carbon pollution. The same could be said for shoes. The myth would be that if there are more people in the world, inevitably there will be more shoes. But most of us do not behave like Imelda Marcos when it comes to shoes. In 2021, 22bn pairs of shoes were produced worldwide, 9% fewer than in 2019. Similarly, our concerns over food, healthcare, education and housing should not be our numbers, but instead our inequality, greed and waste. These are the real problems of our time.
We are ill prepared for the population slowdown. We have been taught to fear an invasion of migrants. But it will be through migration that the slowdown to come is tempered. In Europe from 1946 to 1961, more than 12 million children were born each year. Fewer than 7 million are born a year now and falling. In many parts of Europe, one-child families are the new norm. That is only a problem if you fear migrants.
A few people still suggest that some countries are not doing enough to reduce their populations. But those Cassandras are falling in number even faster than global fertility rates. Like the Trojan priestess, they fear that no one will believe their warnings. Unlike her, they do not have the gift of prophecy – none of us does. However, to date, births are falling fastest where they are most common. They fall even when governments, concerned about supposed virility of their nation, try to encourage more births.

UN population projections of 2022
To hold up birthrates, as researchers writing in the BMJ last week explained, “countries with smaller, older populations need to realise the full social and economic potential of all citizens, including migrants and their families”. They cautioned that attempts to limit access to abortion, contraception and sexual education, in Poland in 2021 and the US in 2022, are not just misguided, dangerous and distressing, but futile.
Successive UN projections have repeatedly underestimated just how rapid the fall in births has been
Our worldwide human population explosion began in the 19th century, largely due to the actions of a few men forcing people off the land within their own countries and invading and destabilising more stable societies worldwide. When Europeans settled in colonies around the world, and imposed free trade in goods (including opium) on countries such as China, they caused such chaos that the very slow population growth of the past millennia was transformed into a worldwide population explosion. The global slowdown is due to the actions of billions of women demanding the right to choose how many children they have or if they have children at all.
We will have to wait longer for the next milestones to be passed. With good fortune, I will be 70 when the global population is projected to reach 9 billion in 2038. Perhaps, by then, we will have learned to mark the occasion by celebrating the birthday of an elderly person, rather than suggesting we reach the milestone due to an extra birth?
Most of us old folk will not be around to see the 10 billion number reached in 2059. That 10 billion year could be much later than 2059 or not at all. Successive UN projections have overestimated future population growth because they have repeatedly underestimated just how rapid the fall in births has been. However, almost all children today will live long enough to be alive in the key year, currently projected to be 2086, when for the first time in the recent history of our species the number of humans on Earth falls overall.
No longer rising in our numbers will be as momentous as we imagine colonising another planet or discovering a new continent to be. And is infinitely more likely.
Danny Dorling is Halford Mackinder professor of human geography at Oxford University. He is the author of Population 10 Billion, Injustice: Why Social Inequality Still Persists and A Better Politics
For the original on-line article and a PDF with all references listed click here.
November 18, 2022
A return to austerity is not inevitable, it is a political choice
With the autumn budget announced today (17/11/2022) and the Conservative government once again signalling a return to austerity, it is timely to be reminded of two key points. Firstly, austerity is a political choice. It is not an inevitable or necessary burden that a country must bear, nor are the finances of a nation equal to that of a household. There is no “maxed out” national credit card, despite the ease that these kinds of metaphors provide for politicians when advancing their ideology.1 The UK government could choose instead to tax the wealthy more and put a higher proportion of gross domestic product (GDP) into public sector services, as almost all other European countries already do.2 * Reducing the threshold at which people begin to pay the top 45% income tax rate from £150,000 to £125 ,40 was tokenistic and not effective redistribution.
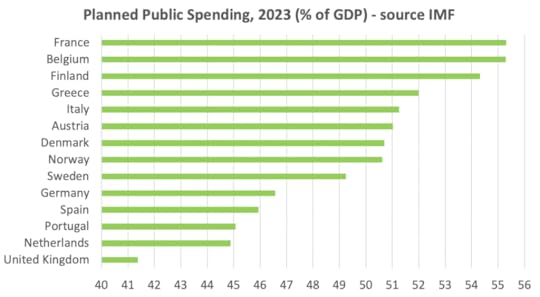
Public Spending planned for 2023 (% of GDP), source: IMF
Secondly, austerity is very bad for health. The nations of the UK have been left behind when compared with other similar countries in terms of population health, even before the covid-19 pandemic began. What was different about the UK between 2012 and 2019 was how deep austerity was and how high excess deaths were.3 Most areas of public spending, other than defence, will now see real term cuts in the coming years.
International organisations, including the United Nations (UN), the Bank of England, and the International Monetary Fund (IMF), have warned the UK of the negative impacts of a return to austerity.4,5 It is extraordinary that Olivier de Schutter, the UN’s poverty envoy, warned the UK’s new prime minister, Rishi Sunak, that re-imposing austerity could “violate the UK’s international human rights obligations and increase hunger and malnutrition.”4 This does not appear to have been acknowledged by the government, nor has it raised the alarm that it should have done. These warnings are entirely consistent with comments in 2018 from Philip Alston, the previous UN envoy, that the “callous” austerity policies caused poverty in the UK, and they were a political choice which inflicted “great misery.”6 The then prime minister, Theresa May, “completely disagreed.”
In the area of health, austerity has undeniably inflicted great misery. Health in the UK has been suffering since the previous round of cuts administered under the coalition government of 2010. Life expectancy improvements not only stalled, but ceased completely for some, and now life expectancy has decreased for poorer groups and in poorer areas. Historically, sustained decreases in life expectancy improvements had not occurred in the absence of wide scale events such as pandemics, war, or natural disasters. Another marker of population health, the infant mortality rate, has also been increasing at times, and—when it didn’t rise—hardly improved, with child mortality in the UK now among the worst in western Europe.
These changes are shocking and unprecedented. Yet, they are rarely reported or discussed in the media. Hardly any national newspapers in the UK reported the rise in maternal mortality in the UK in November 2022 that was primarily due to a rise in suicides among mothers to be and mothers shortly after giving birth.7,8 One local newspaper wrote: “This is horrifying, the government has committed to reducing maternal deaths, but laid bare these statistics show that not only are deaths rising but that the quality of care isn’t improving.”9 The UK now has the highest maternal mortality rate when compared with seven western European countries.10 We have become so used to reports of the situation worsening that there is a danger we become complacent and resigned to this avoidable fate. Those who can are increasingly turning to private healthcare and hospitals.
The covid-19 pandemic was such an unprecedented event that it would be expected, and did, cause falls in life expectancy in all but a couple of dozen countries worldwide.11 The full impact is not yet known, but it is already clear that the UK is an outlier in its recovery, or lack thereof. Recent analyses have found that Britons have the worst access to healthcare in Europe, “soaring” rates of chronic illness,12 and a diminishing work force.13 The cost of living crisis coupled with very high NHS staff shortages is worsening the situation further.
Many people from a range of backgrounds have been writing and warning about austerity since it was imposed after the 2008 financial crash. Fourteen years on, the evidence is indisputable of the harms caused. Yet, as a nation, once again we seem to accept it as a necessity. It is not. It is a choice, and a choice we should resist. Even if the state pension and other benefits are increased by inflation, they will remain among the most miserly in all of Europe. They need to increase by more than inflation, as does the pay of nurses in the NHS. Higher paid workers in both the state and private sector should pay more tax—workers on similar wages across the rest of Europe already do. A wealth tax is needed on the richest if we are going to turn the tide. Spain has recently introduced a second solidarity tax on its 23 000 wealthiest citizens.14 The UK is home to far more very rich people than Spain. There is a choice being made over who will suffer the most. But it seems that neither of Britain’s two main political parties are yet seriously considering the alternative that is needed.
Lucinda Hiam, DPhil candidate,
Danny Dorling, Halford Mackinder Professor of Geography
Footnote
*The IMF estimates that in 2023 France and Belgium will spend 55% of their GDP on public services, followed in descending order by Finland, Greece, Austria, Denmark, Norway, Sweden, Germany, Spain, and finally both Portugal and the Netherlands at 45%, with the UK at only 41%. The 17 November 2022 budget confirmed that the public spending position of the UK would probably worsen, and public debt interest payments rise.
References
1. Sodha S. Don’t be taken in by that £50bn ‘fiscal black hole’. It’s just a dodgy Tory metaphor. The Observer, Nov 13 2022.
2. Dorling D. Public spending in the UK, and elsewhere in Europe, 1980-2026. Public Sector Focus, pp.16-19, May/June 2021.
3. Walsh D, Dundas R, McCartney G, Gibson M, Seaman R. Bearing the burden of austerity: how do changing mortality rates in the UK compare between men and women? Epidemiol Community Health 2022; 76: 1027-33.
4. Booth R. UN poverty envoy tells Britain this is ‘worst time’ for more austerity. The Guardian, Nov 2 2022.
5. Conway E. Spending cuts made necessary by mini-budget ‘could finish NHS’, former Bank of England deputy governor Sir Charlie Bean says. Sky News, Sep 27 2022.
6. Booth R, Butler P. UK austerity has inflicted ‘great misery’ on citizens, UN says. The Guardian, Nov 16 2018.
7. Iacobucci G. UK and Ireland see sharp rise in maternal deaths. BMJ, 2022;379:o2732. doi:10.1136/bmj.o2732 pmid:36368712
8. Devlin H. Maternal mortality rises by nearly 20% in UK, report finds. The Guardian, Nov 10 2022.
9. George R. Evesham charity horrified over shocking rise in deaths. Evesham Observer, Nov 11 2022.
10. Gregory A. UK has second highest maternal death rate in eight-country European study. The Guardian, Nov 16 2022.
11. United Nations. Department of Economic and Social Affairs Population Division. World Population Prospects 2022.
12. Burn-Murdoch J. Britons now have the worst access to healthcare in Europe, and it shows. Financial Times, Nov 4 2022.
13. McKee M, Hiam L. Britain’s not working. BMJ 2022;378:o1883. doi:10.1136/bmj.o1883 pmid:35905984
14. Dean G. Spain is doubling down on taxing the rich with a so-called ‘solidarity tax’ on 23 000 super wealthy people. Business Insider, Sep 30 2022.
For a PDF of this article and it’s source of original publication in the BMJ click here
October 28, 2022
A Tale of Three Elections
On September 5th 2022 Liz Truss was elected as Prime Minster winning 81,326 votes, as compared to the 60,399 which Conservative party members awarded to the former Chancellor of the Exchequer, Rishi Sunak. On September 11th 2022 Sweden held a general election after which it appeared likely that Ulf Kristersson, the leader of the Moderate Party, would become prime minister, ousting the Social Democratic led coalition from power. On September 25th 2022 a general election was held in Italy with the outcome being that Giorgia Meloni, leader of the ‘Brothers of Italy’, would most likely become Prime Minister. These three events in the same month were suggested to be a sign of a significant shift to the right across Europe; but they were each very different and do not necessarily imply such a shift. If anything, events in the UK may have made the rest of Europe even more cautious about shifting to the right.
In the UK, the election of Truss was a continuation of a chaotic series of events. These included the British Conservative Party leaving the mainstream European Conservative block in 2014; holding a referendum on EU membership in 2016; the UK becoming the second most unequal country in Europe (by income) in 2019 (Bulgaria was worse, but moving in the opposite direction); and the ‘mini-budget’ of September 23rd 2022 that appeared designed to push the UK to the top of the European league table of inequality within months. The International Monetary Fund (IMF) warned the UK government that increasing inequality would undermine its economy further. The UK had lurched to the far-right of European politics; then out of the EU; then out of what the IMF considered rational behaviour.
In contrast that month, in Sweden, 84% of the adult population voted to choose the political parties that would govern them, and in effect who would be prime minster. The shifts in voting were small. The Social Democrats saw their share of the vote rise by 2.0%, that for the more right wing Swedish Democrats by 3.0%, and the Greens by 0.7%. All other parties experienced small falls. Despite both gaining votes, the Social Democrats and Greens, who had formed the government in 2018, lost out because of the slightly larger rise in the Swedish Democrats vote which was just enough to allow it to form a majority coalition with minor parties. This is not a lurch to the right, it is a tiny shift in comparison to what has occurred in the UK. Occasionally, the most extreme parts of some of the more right wing Swedish parties advocate policies that are now common in the UK, for example on immigration. However, Sweden continues to be one of the most equal European countries almost irrespective of which political parties are in power at any particular time.
In the Italian general election of 2022 the swings were far greater. Politics in Italy is far more volatile. After the UK, it is the next most unequal of the larger European countries. The only other European countries where income inequalities are higher than in Italy are Romania, Latvia, Lithuanian and Bulgaria. These four Eastern European countries alongside Italy and the UK are now outliers in Europe. The far-right ‘Brothers of Italy’ saw their vote share rise by 22%, the hard-to-define Five Star Movement vote fell by 17%, and the Democratic centre-left party’s vote rose by 0.3%. The shifts occurred mainly because turnout fell dramatically to 64%. Voters had become disillusioned with all the choices on offer. The net effect was to make a right wing coalition possible; but the Brothers of Italy only hold 119 of the 400 seats in the parliament, less than a third. They cannot govern without wider consensus. Whereas, in the UK, Truss became Prime Minster despite only a minority of her MPs supporting her in the leadership battle (most supported Sunak), let alone any voters other than a tiny number of Conservative party members choosing her.
The last UK Prime Minster to gain power by their party being elected into office and also to lose power by their party being elected out was Edward Heath (1970-1974). For twenty two years no British Prime Minster has enjoyed public support for more than a few short months, almost always only just after they have won an election. The long term trend is downwards. Truss is expected to continue that, possibly taking it to a new all-time low.

Prime minister popularity: Source: Ipsos MORI statistics
Source: Ipsos MORI statistics reproduced by: https://www.spectator.co.uk/article/i...-
In September 2022 Europe had three very different elections and three very different outcomes. The election in Sweden (in which five in every six adult Swedes participated) was reported by the BBC as ‘Sweden election: How an ex neo-Nazi movement became kingmakers’ but only one in every six of the electorate voted for that party, and their leader was not considered a possibility for prime minster.
In Italy less than four in every six people eligible to vote, voted. And again, just one in every six who could vote gave their vote to the party most talked about because of its links to a fascist past. However, because fewer people voted overall in Italy, that party is now the largest party. In the UK two adults in every six in the electorate voted Conservative in 2019, but only one in every six hundred people eligible to vote in general elections, voted for Truss in 2022. The turnout in the 2019 UK general election had fallen to just 67%, not that different to Italy in 2022. There was little comment in the British Press on how some of the policies that Johnson and then Truss supported, such as proposing to forcibly fly some migrants to Rwanda, could be seen as echoes of past far-right minority political parties in Britain. But the international money markets immediately saw her economic policies as far too extreme in other ways to be tolerable. Even the implied future cut in public spending to pay for the tax cuts for the very best-off was seen as a step too far by international bankers because it would weaken the economy and make the UK a more dangerous place in which to invest.
The tax cuts proposed in the UK mini-budget of September 2022 were targeted almost exclusively at the very best-off. Although it appeared superficially that there would also be small gains for other groups, the immediate effect of proposing these tax cuts was to see the value of the pound plummet, increasing the costs of goods for everyone and so leaving only the best-off tenth expecting any possible gain from the proposed tax-cutting. For everyone else in the UK their incomes would fall after taxes and rising prices were taken into account. The chart shown here does not include the effects of rising prices.

Changes in family income had the September 2022 budget been implemented
Source: https://twitter.com/KumarAshwin/statu...
These three different elections in September, resulted in three very different outcomes. In Sweden very little at first appeared to change. There was no rise in financial instability or inequality as far as we can see to date. In Italy, talks began to ensure that the new government worked with its predecessor to submit a draft budget to the European Commission in mid-October. The international markets did not react with horror to what had just occurred in Italy. This was despite fears over losses to human rights and much else that was precious as a result of the election.
In the UK inflation rose, the housing market looked to be in trouble with rapid price falls predicted. The Bank of England began the emergency buying of government bonds to ensure pension funds were solvent in the short term. Homes and pensions are the main two ways in which wealth is held in the UK. Share prices also fell. Fuel and food prices rose. I have no idea what else will have occurred between the last day of September, when I wrote these words, and the month in which you read them. Nobody knows. But there was only one entirely disastrous election that took place in Europe in September 2022 – the election of the new British Prime Minister. It gave the world a warning as to what occurs when a particularly extreme right wing path is taken – chaos.
For a PDF of this article and link to the original publication click here.
Danny Dorling's Blog

- Danny Dorling's profile
- 96 followers

