
Danny Dorling's Blog, page 9
October 6, 2022
Austerity led to twice as many excess UK deaths as previously thought – here’s what that means for future cuts
More people died from the austerity in the five years before the pandemic than have died from COVID since.
Austerity led to twice as many excess UK deaths as previously thought – here’s what that means for future cuts
Danny Dorling, University of Oxford
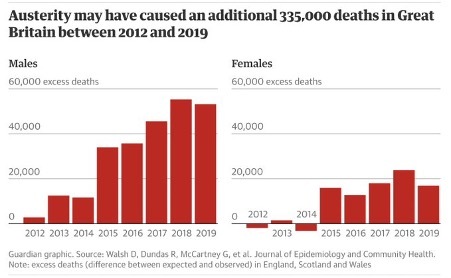
Cuts to public services and living standards across Britain from 2010 contributed to 335,000 excess deaths – twice as many as previously thought, according to new research. These austerity measures were introduced by the coalition government elected into office that year, partly in response to the banking crash of 2008.
Previous estimates had suggested that 152,000 people died prematurely between 2015 and 2019 due to austerity. The new study, conducted by researchers at the University of Glasgow and the Glasgow Centre for Population Health and published in the Journal of Epidemiology and Community Health, suggests this was an underestimate and also suggests that austerity had a growing effect over time.
These findings are troubling for several reasons. They suggest that men were much more affected than we first thought. Furthermore, the UK government now plans to embark on a new round of very large public spending cuts. Against this backdrop, these new numbers of excess deaths linked to a previous period of stringent public spending cuts can give us an idea of what might lie ahead this time round too.
https://twitter.com/tianran/status/15...
There were actual overall falls in UK life expectancy between 2014 and 2018, with large falls for particular groups such as the poorest tenth of the population, although the health of people living in the best-off areas continued to improve. Previous suggestions that flu or particularly cold winters might have been key reasons don’t stand up to scrutiny, given that, during this period, there was neither an unusual flu outbreak nor any notably cold winter.
Before this new study, some disputed the idea that austerity could be blamed for the increase in deaths by pointing out that most of those who had died prematurely were old and so had benefited from the “triple lock” of the UK state pension.
This safeguarding mechanism was introduced in 2010 to ensure that pensions would rise by the highest of inflation, earnings growth, or 2.5% a year. In theory this meant that pensioners – the over-66s – were sheltered from the effects of austerity. Sadly, that was not true.
Between 2010 and 2020 the average UK pensioner saw their real-terms weekly income (after housing costs) rise by only £12, to £331 a week. That represents a meagre 3.8% rise over the whole decade, which works out to £1.71 extra per day. This in no way compensates for rising fuel and other costs that especially hurt poorer pensioners.
The overall rise in weekly income was this small because other state benefits that pensioners received, and relied upon to ensure they could cope, were reduced in real terms. For example the proportion of pensioners receiving disability payments fell from 23% to 19% between 2010 and 2020.
Poorer pensioners and those in most need were also most harmed by cuts to state services. They lost their adult social worker and carer visits, local government help, and so much else that existed in 2010 – but was largely gone by 2019.
It is now becoming clear that far more people died prematurely due to the direct and indirect effects of austerity and government policy than we had at first believed to be the case. In international comparisons, only in the UK and US were the cuts as bad and their impacts on health and wellbeing so sustained.
Government policy in the US has changed since the election of Joe Biden and his taking office in January 2021. The UK, by contrast, has moved in the opposite direction.
Data reporter John Burn-Murdoch recently argued that, in adopting what might well be “the most extreme economic position of any major party in the developed world”, Liz Truss’s Conservative government has “become unmoored from the British people.”
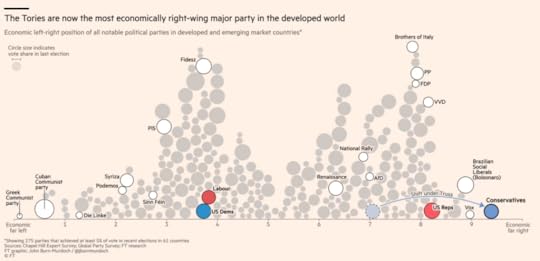
“The Tories have become unmoored from the British people” Financial Times
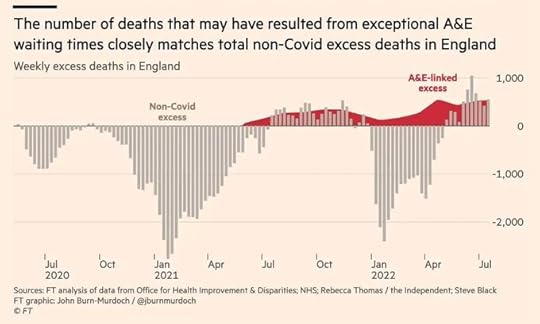
More people in Britain died due to austerity in the five years before the pandemic, than died from COVID-19 in the first three years of the pandemic. The effects of austerity continued after the pandemic hit, but initially became harder to discern.
However, in August 2022 the Financial Times published estimates suggesting a large proportion of recent non-COVID-related deaths could be ascribed to just one aspect of austerity: waiting over 12 hours to be seen in accident and emergency departments.
https://twitter.com/peterdonaghy/stat...
The pandemic has not gone away. Cases are rising again. So too are austerity-related deaths.
Most worrying is the coming winter. The last time the UK suffered a similar energy crisis was during Edward Heath’s term of office (1970-1974). That was also the last time a prime minster in Britain came into office upon winning a general election and left it on losing one.
Today, despite all the deaths from austerity and the pandemic, the UK has a far larger elderly and frail population than it did in the early 1970s. That decade was characterised by much greater social solidarity and income and wealth inequalities were at an all-time low. Life expectancy never fell or even slowed in its rise, despite rising heating costs and power cuts.
The situation we face now is more akin the 1930s. Then, we were as unequal as today. Mortality rates were very high in poorer areas. Most people were poor. There were few average areas. And the very wealthy were protected by their wealth.
Danny Dorling, Halford Mackinder Professor of Geography, University of Oxford
This article is republished from The Conversation under a Creative Commons license. Read the original article.
For a PDF of this article and the original source click here.


September 30, 2022
Let them eat growth?
Politics is about people, about our different views and our understandings about people – about what motivates them, why they behave in the way they do, and what will most help or hinder them. In the spring of 2016 I published a short book titled: ‘A Better Politics: How Government Can Make Us Happier’ which is also free to read on-line. (1)
I argued that in our current era we have policies for those that believe that poor people are lazy and that this harms us all. The reality is we’re all very much the same, driven by the same physiological and emotional needs. But that we start at different points, and a few people are more selfish and greedy than others. A larger group can become hardened and more indifferent to the suffering when we live in a society as divided as the UK has become.
The last six years have been a rollercoaster. David Cameron introduced his happiness index in 2016. The measures that contribute to that index were rising then. There was growing hope, despite the huge divisions cause by the Brexit referendum result. The proportion of people in the UK who said that life was worthwhile, that they were not too anxious, that their life satisfaction and happiness was good, all climbed, peaking with the outcome and in the aftermath of the 2017 general election. (2)
However all four of these measures worsened rapidly around the time of the 2019 general election. Two thirds of the fall in happiness occurred between the third and fourth quarter of 2019, as did three quarters of the rise in anxiety. The pandemic made this worse, but the current plunge to greater levels of despair began before it. (3)
Politics is also about power and winning that. For the conservative establishment, maintaining, not reducing, inequalities is seen as essential. In the past it was almost exclusively under Conservative governments that inequalities in income were increased. They may be about to do that again. There is a fight back taking place, but as yet it is mainly confined to ad-hoc protests, strikes, and suggestions of a few think tanks. (4)
We need a better politics than this, one which will require confronting head on the central deception about our current state and likely future.
On 7th July 2022, when Boris Johnson resigned, he said that if we stayed close to his chosen path then soon: “… we will be the most prosperous in Europe.” (5) We clearly would not. He ended his speech promising that “… even if things can sometimes seem dark now, our future together is golden.” (6) Talk of sun-lit uplands is wearing thin. The future now looks cold, not golden. There is no guarantee that the fuel bail-out will avert actual shortages of gas this winter, and we already know that overall higher bills will cause rising hunger.
Britain today competes with Bulgaria to be the most economically unequal country by income in Europe. Those surviving on the least in Britain now have living standards lower than their equivalents in some parts of Eastern Europe. (7) Most of the poorest are in work, but work pays so badly that almost half of all UK adults are not tax payers. The UK has low unemployment because people will take any job they can. Often several jobs.
In comparison to average wages, the UK had the lowest unemployment benefit for single people in all of Europe. (8) Other social security payments have continued to fall in generosity as a share of average wages. This fall continued even during the last 14 years when average wages also fell when compared to prices. The British state pension remains amongst the lowest in Western Europe, despite being protected from rising inflation. The average UK pensioner saw their real terms weekly income (after housing costs) rise by only £12 between 2010 and 2020, to £331 a week. (9) That is an extra £1.71 a day. Pensioners are the demographic group that did better than others in that decade. The reason why their income hardly rose at all, during the years when the state pension was protected by the triple lock, was that other social security payments that pensioners received and relied upon to ensure they could cope were reduced in real terms. Those with disabilities have suffered particularly badly.
https://www.reuters.com/breakingviews...
The current government’s response is to tell people to work harder. In the first quarter of 2022 there were almost 50,000 sanctions for not trying hard enough to find work, almost three times the number made in the last quarter before the pandemic began in early 2020. Sanctions are the removal of up to all benefit income. This is most often for ‘failure to attend or participate in a Work-Focused Interview’. However, many of the people being sanctioned have attended and participated in these interviews, but in the view of their ‘Work Coach’, have not done sufficient work search or other activities. This is how people are pushed into taking any work at all, no matter how bad it is. The researcher who released these figures explained: ‘The latest reported rate of sanctioning would produce 593,000 sanctions on all benefits in a full year. This would be the highest number since 2014, and higher than in any year under the previous Labour government, as far back as statistics are available in their present form.’ (10)
The average length that a sanction lasts is a month, but it can last much longer – deliberately causing severe immiseration. Conservatives have tried many different policies to preserve the high inequality they worked hard for and won. A large part of the reason they did not scrap Labour’s minimum wage, and later rebranded it as the National Living Wage – one which many find that they cannot afford to live on – was to not to have to address inequalities more widely. In 2022 the Trades Union Congress called for the minimum wage to be raised to £15 an hour from the current rate of £9.50 for workers over 23 years old and just £6.83 for those aged 18 to 20, and £4.81 for 16- and 17-year-olds. These are too low.
Labour needs to promise to raise social security support, at least to the more generous standards of most other European nations as compared to average incomes. It needs to agree to minimum wages rising and benefit sanctions being rapidly reduced. But it also needs policies that will curtail rising costs, otherwise no one will be better off. In September 2022 the Scottish government announced that ‘emergency legislation will be introduced to bring in a freeze on rent increases and ban evictions in the private and social rented sector in response to the cost of living’. (11)
How can Labour address the coming emergency and keep its promise to ‘not spend day-to-day more than we tax’? There is only one way, and that is to increase taxes on those who currently take the most. It is through higher taxes on incomes, but also sometimes on wealth, that other European countries ensure their societies are more fair, have higher long term social mobility, lower poverty and are not beginning to fall apart in the way that the UK is starting to fail. You can be coy about it, and pretend you will not do it – or you can choose to be honest – and also point out what is now falling apart more trenchantly. Labour need not increase the overall tax level by very much to bring public spending up to normal European levels; but it must alter the balance of who pays most tax. Between 1979 and 1990, the basic rate of income tax was reduced from 33% to 25%, and the top rate from 83% to 40%. At the same time there were increases in both VAT, from 8% to 15%, and National Insurance. The overall tax level was 30% in both 1978-79 and the same in 1990- 91. (12)
Taxation does not necessarily ‘raise money’. What it does is alter the distribution of which people can spend the most. If taxes are not increased when public spending is increased, then prices will rise faster, especially for services where the number of people providing that service is limited. Without raising taxes on the better-off, you do not redistribute consumption. Top rate tax increases are also more effective than any cap on banker’s pay at reducing inequality, unfairness, and dangerous gambling by the financial sector.
People cannot eat growth. They cannot believe promises that economic growth will be their salvation because they have heard those promises so many times. Johnson’s promise (as quoted above) was almost identical to one given by George Osborne seven years earlier. It does not matter who makes these promises, they are simply not believable, not least because sustainable growth that benefits the majority never occurs in societies as unequal as the UK has become.
You can argue that in a more equal society growth is more sustained, because that is what happens in those countries that are more equal. You can argue that this growth tends to be in areas which are more beneficial to society, less polluting and less wasteful, because that is also the case. You can argue that if you do not address the emergency we are in, then we should not expect much growth in the future, especially not much green growth, but you cannot tell people to wait for growth, or that you will somehow increase growth without first addressing the emergency.
You can have long term plans for a far better future. You can, if you wish, talk about how we could in time have a far less bureaucratic welfare state, even of how universal basic incomes are becoming a possibility. However, none of that is believable if you are not publicly willing and have the strength of will to be able to say that you will address the immediate crises that so many people face – head on. Our future together may well not be golden even with the best of policies. But it could soon be even worse than it is today. In the short term the pound is falling in value, stoking up even higher inflation; many people have exhausted the wellbeing and capacity of family and friends to help to keep them afloat; debt levels are terrible; our health is being damaged – not just mental health but we are also rapidly falling down the ranks in terms of measures of physical health. Evictions are rising. Precarity is becoming the norm.
Call out the myth of sun-lit uplands for what it is – a lie told by people who can afford to go on numerous holidays in the sun to those who they hope will swallow the lie, or who can be convinced that things are not getting better because other people are not working hard enough. Don’t try to promise the same lie, hoping that you can tell it a little more convincingly because you really would like things to quickly get better. Instead be honest, say that the current situation is terrible, worse than we have experienced in many decades. Tap into what so many people know to be true. Explain that the UK remains a very rich country, and that the very worse outcomes of current disastrous policy can be tackled immediately. Be clear that we have the resources to do that. Don’t exaggerate. Be clear that in the longer term recovery will take time because there is such a distance to go.
Currently Bulgaria is moving faster in that direction than Britain is. Inequality has been falling in Bulgaria; but is still rising in Britain. People on average wages will require pay rises this coming year which are higher than those of people earning twice average wages. All of these increases will actually be falls in real income. That is made more bearable if, at the very least, you know that the society you live in is becoming more fair.
During the 1920s, and 1930s, inequalities in income in the UK fell during a series of crises not dissimilar to today. There was little celebration at the time, but had this not happened then the great achievements of the late 1940s, 1950s and 1960s would have been far harder to secure. Today we have both the benefit of hindsight and know that other countries in Europe are currently achieving this. Offer hope, honesty and fairness in response to a government that is promising only growth and fairy tales.
Please don’t mimic. Instead tell it as it is. And please don’t rely too much on the promise of growth. People cannot eat growth.
References
1 https://www.dannydorling.org/books/be...
2 Quarter two 2017: See Figure six in David Finch and Adam Tinson (2022) The continuing impact of COVID-19 on health and inequalities, London: The Health Foundation, August 24th, https://www.health.org.uk/publication...
3 See figure 1 of ONS (2022), Personal well-being in the UK, quarterly: April 2011 to September 2021 https://www.ons.gov.uk/peoplepopulati....
4 https://neweconomics.org/campaigns/li...
5 Boris Johnson (2022) Resignation speech, July 7th, https://www.youtube.com/watch?v=3h8Eh...
6 Boris Johnson (2022) Full text: Boris Johnson’s resignation speech, The Spectator, July 7th, https://www.spectator.co.uk/article/f...
7 John Burn-Murdock (2022) Britain and the US are poor societies with some very rich people, The Financial Times, September 16th, https://www.ft.com/content/ef265420-4...
8 Olaf van Vliet and Koen Caminada (2012) Unemployment Replacement Rates Dataset Among 34 Welfare States, 1971-2009: An Update, Extension and Modification of the Scruggs’ Welfare State Entitlements Data Set Leiden Law School – Department of Economics, NEUJOBS Special Report No. 2, Table 2, page 7,
https://papers.ssrn.com/sol3/papers.c... and https://www.researchgate.net/publicat...
9 DWP (2021) Pensioners’ Incomes Series: financial year 2019 to 2020, Department for Work and pensions, March 25th, https://www.gov.uk/government/statist... 2020/pensioners-incomes-series-financial-year-2019-to-2020
10 David Webster (2022) Briefing: Benefit Sanctions Statistics, August 24th, https://cpag.org.uk/policy-and-campai...
11 SAL (2022) Immediate freeze on rent increases plus eviction ban, Scottish Landlords Association, September 6th, https://scottishlandlords.com/news-an...
12 Michael Jacobs (2022) Thatcherite mythology: eight Tory leadership candidates in search of an economic policy, LSE British Politics and Policy Blogs, July 13th, https://blogs.lse.ac.uk/politicsandpo...
For A PDF of this article and its original place of publication, click here
September 27, 2022
The “mini-budget” will make the UK the most unequal country in Europe
Growing inequality in the UK has implications for health.
The UK currently has the second highest income inequality of any OECD country in Europe. Only Bulgaria is more unequal.1 The government’s economic announcements made on Friday 23 September 2022 may be what is required to ensure that the UK now moves up to the unenviable top spot. This has implications for health because unequal countries tend to have worse health outcomes.https://www.dannydorling.org/books/ec... Although there is debate about the causal mechanisms, the observed relationship is well known. In international comparisons, it is strongest for the youngest age groups who tend to be most affected by the most recent changes.3
The changes announced on Friday included a tightening of the rules on universal credit “which will see benefit payments reduced if people do not fulfil job search commitments.” 4 This will make many already poorer families poorer still, increasing inequalities. Even before the announcements were made, benefit sanctions were being increased rapidly due to more punitive policies being introduced, with the number of people suffering from being sanctioned rising above 100 000 in May 2022; three times higher than the pre-pandemic peak in October 2019.5 Before the changes, it had been projected that 593 000 people would be sanctioned this financial year. Now even more will be sanctioned. Those on the lowest of incomes will suffer the most.6,7
Almost all the other measures announced on Friday were to benefit the richest. The cap on banker’s bonuses was lifted to encourage bankers to gamble more; a planned corporation tax rise was scrapped to allow those wealthy enough to hold shares to take larger dividends; outside of Scotland the top 45% tax rate (that had applied to people earning over £150 000 a year) was abolished; stamp duty thresholds were raised so that the minority of people wealthy enough to still be able to buy a home paid less in tax; and the obscure IR35 rules brought in by the Conservative party themselves in 2017 and 2021 to stop disguised remuneration will be repealed. This last change most favours already highly rewarded consultants. An employment tax partner commented: “today’s announcement could help open the door to those wishing to promote tax avoidance.”8
The changes were designed to increase incomes the most for those at the top of pay scales, to increase them less for those just beneath the top, and to reduce incomes for those at the bottom. The basic rate of tax was lowered to 19% which most increases the incomes of people earning £50 270 a year, at the top of the basic rate band. These changes will not benefit any of the 43% of UK adults who pay no income tax, or the 24% of UK households where no one in the household receives enough to pay income tax.9,10
The indirect effects of the announcements may well have a much greater impact on making the poor poorer. The pound fell to a 37 year low as the announcements were being made.11 Three days later it had fallen to its lowest ever value against the dollar and other currencies. This will increase the cost of imports of basic foodstuff, clothes, and other essentials that make up a much higher proportion of the spending of households on lower incomes. Furthermore, the tax cuts were unfunded, requiring the government to increase borrowing which makes interest rate rises more likely—increasing the costs of mortgages, and therefore also rents.
The changes will also widen policy differences within the UK. In Scotland the top tax rate will not be scrapped. The rate there was already higher than in England.12 Scotland is becoming more progressive, England more regressive. The Scottish government has recently announced that “emergency legislation will be introduced to bring in a freeze on rent increases and ban evictions in the private and social rented sector in response to the cost of living.”13 So rents in Scotland, unlike in England, may well not rise as a result of today’s announcements.
We can only know the direct effects of these policy changes. We cannot know their unintended consequences, up to and possibly even including the shattering of market sentiment further increasing government borrowing costs. Decreasing stamp duty might not actually strengthen the housing market, but instead cause people to question how safe the housing market is. There are many possibilities where the actions taken do not have the consequences planned. However, in the short term, a few people at the very top are about to become richer and even more politically powerful because they are richer. While the large majority of us will be worse-off due to the rise in unsupported borrowing, the cuts to come in public services to reduce that borrowing, or simply because our incomes stagnate while prices rise.
For the original publication in the BMJ, list of references and a PDF click here.
August 31, 2022
A Letter from Helsinki
I arrived in Helsinki in early summer 2022 to attend Europe’s largest conference on social housing. At the airport I overheard American tourists complaining that so many shops were shut. It was a Sunday evening. The tourists didn’t understand that Finland has the best work-life balance in Europe. I wondered why people who have just embarked from a plane want to immediately go shopping. Perhaps it was just what they had become used to?
I listened to hundreds of social housing planners, architects and housing managers, people from all around the continent of Europe, talking to each other in a language most of them rarely use on a daily basis – English. There were only a few people from the UK there, and I kept quiet on all the tours I attended. I was trying to avoid being asked about what was happening back at home by curious mainlanders.
Providing housing of high quality, at affordable rents, is a distant memory in the UK. Just before I travelled to Finland the British government had announced that it intended to introduce the right-to-buy for housing association tenants. It wasn’t that I was ashamed of being British. I was just tried of trying to explain what was happening to the place I called home.
I attend field-trips, one to see the new residential district built on a former industrial harbour very near Helsinki city centre where tens of thousands of people now live in mixed developments under a plethora of schemes including a social housing block planned for retired rock musicians, complete with sound proofed music rooms! A passing tenant whispered to me that it is not quite the Utopia my hosts were describing – a place where everyone gets on with everyone else. I nodded, I knew it is not Utopia, but I wondered if he knew what the conditions for him would be if he lived in the United States, or the UK?
All is not perfect in Finland. The queues to access the best social housing are many thousands of people long. However, almost no one sleeps on the streets, even in the twenty plus degree heat of a Helsinki summer. In the evenings I tried to spot people who are street homeless – and I failed.
A heat wave was building up strength further south. I counted myself lucky not to be sweltering in that while I traipsed around newly built block after block of carefully designed dwellings. An architect talked of how many of her colleagues competed to design one particular block. University students show me their state-built and state-managed studio flats, each complete with kitchen for one. Hardly any students rent in the private sector. In Finland almost three out of every five university students have their own public-sector provided apartment and choose not to share.
I learn that in Norway new housing for students is based on a dozen or even more having rooms in a large shared house or apartment with a big communal kitchen – to reduce loneliness. Young Finns appear to place a greater value on having their own space. Perhaps to shelter a little from some of the conformity? But will other Finns at some point begin to resent the mostly middle-class university students having such homes? Students coming from over-seas are allocated this housing first, as they are seen as being at most need. Can you imagine any of this in Britain? Extremely quality housing provided and managed well on the basis of need with foreigners at the front of some queues?
Back home, in England, another of the Prime Minister’s many ethics advisors had just resigned. I asked if any Finnish government minister had transgressed a single regulation during the pandemic. My hosts scratch their heads, debated among themselves and finally replied ‘no’. I asked them why it took them so long to agree and they say they were also debating whether ministers did things they were allowed to do, but should not have done, so as to set a better example. I laugh. I tell them about the government-chartered plane that had recently been prevented from leaving Britain to fly refugees in harnesses to Rwanda. They did not know about it. Why should they? Britain is an ever more alien place to them, a land of atrocities now so frequently committed that most are no longer news on the European mainland.
Attending more talks, I heard details of the huge differences across Europe in terms of what is currently possible when it comes to housing people adequately. One common theme was that the costs of construction materials has risen so high and so quickly that almost everywhere new social housing building is currently being placed on hold. Only the most affluent more egalitarian countries might secure the dwindling supply of girders, wiring and piping this year. The Norwegian government is now looking into spending far more than it usually does to ensure that building public housing there continues with little interruption.
I only spoke at the very end of the conference. I tried to be tactful, after all who I am – given where I come from – to offer useful insights? I told my audience of my country which, by the time I was born, had managed to house a narrow majority of its young adults during their childhood in social housing of ever-growing quality – a higher proportion than in Finland today. It was a country with lower wealth and income gaps than those seen in Finland today. This was a country then leading the world in increasing the social mix of children in its schools. It was a country whose health service ranked above all others. That Britain is just a distant memory now.
I asked what will happen if the cost of building construction continues to be so very high in Europe due to the aftermath of the pandemic and the new war in Europe? When they can no longer so readily build and provide for their poorest, will the most affluence and equitable countries in Europe learn to share what they already have more? Or will they say that everyone has to tighten their belts equally in straighten times, effecting those with least the most, and see justified resentment grow?
Less than fifty years ago planners, architects, educational researchers, and ministers of health from across Europe came to the UK to see how social housing, schooling and hospitals could be best provided. We in Britain had a social contract that appeared strong, but when the prices of construction material and oil rose with inflation in the 1970s. The contract then began to be broken, it started in the mid 1970s – and never ended.
I show my audience graphs of how the number of children growing up with a private landlord sky-rocked not in the 1980s, but in the 2000s. I say, it is not so much the conservative you have to fear – you understand them. It is when your own side becomes complacent and corrupted that you are in most trouble. Beware when social democrats believe they have achieved so much and done so well, that asking for even greater equality (of ‘outcome’) would be asking for ‘too much’.
I tell my audience that the most common way people die under age 65 in my home city of Oxford is to die homeless, and that it has been this way for over two decades now. I congratulate the delegates because children born in almost all their countries now have lower infant mortality than in the UK, and the Finns recently achieved the lowest rate ever recorded in history, which of course has as much to do with their housing, social and education policies as with their health care. I thanked my hosts for having invited me. And ended by telling them that at least they have the example of the UK to warn them of what happens when you stop caring enough; we didn’t have such a useful example in the 1970s. We didn’t know how bad it could become and how so much could be lost.

Source of data: https://data.oecd.org/inequality/inco...
Shown here is one graph that sums up where we are. It is the basic graph of income inequality that compares all OECD countries. The graph reveals that Finland is exceptional, but no longer unusual. Shaded in red it is now not quite as equitable as Denmark, Belgium, or Norway; and only a fraction more equal than Austria, Sweden and Poland. Increasingly, more and more of Europe is becoming like Finland. Germany and France are not far behind – shaded purple and black on the graph. Spain, and Italy, shaded Green and Yellow, are on the slightly less egalitarian side of the centre of the distribution. The UK is on the edge. In all of Europe only Bulgaria is more unequal. The UK has much more in common now with the USA, and is far less similar to most of its own continent when it comes to inequality. We have to look to the USA, or perhaps more plausibly to nearby Turkey, or at the very extreme towards South Africa, to see in which direction we are heading.
You might think that it would be impossible for our inequalities to grow higher,. But we broke away from what is normal and possible when we broke out of the EU. We are now even more economically unequal than Israel. We are now firmly in the group of OECD countries where populations live parallel lives and politicians talk freely and without much criticism about the poor needing to take ever more personal responsibility. Politicians in these most unequal of countries enact laws in the name of freedom to make it easier for a few to exploit others. We have become the place on our continent to travel to, if you want to see what a broken society looks like.
I try to imagine what Europe’s largest conference on social housing would look like if it were ever held in the UK. Where would the fieldtrips be to? Would university students happily stand at the doors of their incredibly expensive privately provided accommodation and say how lucky they were to be living there and getting into so much debt? Would some of the incredibly well paid chief executives of housing associations try to suggest what a brilliant model the UK had with so much housing being charitable? Would representatives of our huge plethora of homelessness charities stand up and extol the virtues of there being so much opportunity to work in the homelessness sector as homelessness here was so high? Would the delegates from the mainland walk out of the conference? Or would they quietly take note of what happens when the public sector is so shrunk and so deformed. Not just in housing, but in education, health and care too.
I’m glad I saw Helsinki again. In the past it was an unusual beacon of hope. Today what happens there is increasingly the norm elsewhere in Europe. The Nordic model is slowly becoming the normal model.
Source of data: https://data.oecd.org/inequality/inco...
For the original place of publication and a PDF of this article click here.
A Review of Branko Milanovic’s Capitalism and Global Income Inequality
Branko Milanovic’s Capitalism, Alone: The Future of the System That Rules the World begins, provocatively, with two quotes written roughly two centuries ago that describe our world-system today. The implication is that what began then was not only foreseeable but also largely unstoppable. At the very least, we have known enough about the system for long enough that if we were to have changed the course of events, we would have done so by now. Instead of any alternatives gaining significant ground, “We live in a world where everybody follows the same rules and understands the same language of profit-making.” The exceptions to this mantra are so trivial that none of them, Milanovic explains, “influence the shape of things and the movement of history.”
Burj Khalifa, at sunset. (Photo by GIUSEPPE CACACE / AFP)
This is a bold book. At its core is Milanovic’s long-term interest in collating data on income inequalities. He shows that, as capitalism became all-encompassing, worldwide income inequality rose to a peak in the 1950s and 1960s at the very same time that it was falling locally within most of the richest countries. The beginnings of that localized fall, around 1914, only slightly dented the relentless upward rise in inequality among all people on Earth. However, at some point in the 1990s, global income inequality began to fall abruptly for the first time in centuries. Thus, we begin with a conundrum: capitalism is utterly dominant, but global income inequality is now declining. Milanovic does not see this particular drop in income inequality as a sign that something fundamental may be changing. He views the plunge as mainly a short-term effect of the recent success of what he calls political capitalism in China.
The measure of inequality used here matters. It is the Gini coefficient, which takes the differences among all people into roughly equal account. Had the author instead concentrated on the very poorest, or on the top 1 percent or 0.1 percent, or on both extremes, then the book would have begun with a different story and probably ended with a very different message — one suggesting that we cannot allow current inequities to continue to grow at both extremes. However, because most people worldwide do not fall into either of these extreme groups, by concentrating only on the Gini coefficient, this book presents more of an every-person account of what capitalism produces, for whom, and why. As a result, Milanovic is less damning than he might be. He is not looking for reasons why capitalism should be challenged or opposed, but instead suggesting that the system will be so resilient that we just need to adapt to it.
Milanovic divides the world into two sets of places: one group of countries where various forms of political capitalism flourish, and another group most dominated by what he terms “liberal meritocratic capitalism.” The extreme examples of both are China and the United States. He adds some nuance to this division when examining how both types evolved into what he sees as their current forms, but the overall aim of his project is to simplify — to help readers see the large forest we live in now rather than spending too much time considering rare and unusual trees, how the forest grew to be, or whether it really can keep growing as fast as it is, using up all the resources it does.
Inequality has increased in almost all liberal meritocratic countries since the 1970s. In Capitalism, Alone, Milanovic suggests that this is due to four factors: trade unions can no longer organize dispersed workers; increases in years of education now bring little extra material benefit; the reduction of high incomes by tax is easier to avoid and has been systematically disparaged; and redistribution by government has been similarly discredited. He might have added that government spending on health, pensions, and social care has risen as populations have aged, leaving less to redistribute to those who are poor, especially as the very elderly tend to be drawn disproportionately from the well-off. He might also have added that redistribution and taxing the rich are still popular in opinion polls and have only been rolled back rather than entirely discredited; but he is correct that top tax rates are hardly ever raised nowadays and are much lower than they were, almost everywhere, fifty years ago.
Two policies are advocated for reducing economic inequality in the future when the four classic mechanisms have failed. The first is unsurprising: decreasing the inheritance of money. The second is more astonishing: diminishing the rights of migrants to gain citizenship so that they are not a drain on the welfare state. The author claims that this would make it easier for welfare states to survive. However, the idea that immigrants are a burden on welfare states is an odd one. Liberal meritocratic capitalist countries with some of the most advanced welfare states, such as Finland, have relatively few immigrants, whereas those with the worst welfare states, such as the United States, have many. More important, it is hard to find evidence of immigrants being anything other than beneficial for the country they arrive in. Migrants are an economic boon. They arrive having already had their schooling and early health care paid for by their home country. Migrants also tend to have more get-up-and-go, not just literally, but when the trajectories of their children and grandchildren are considered. Milanovic paints some groups of migrants as a burden on the places they arrive, but he doesn’t present evidence that this is the case — just that this is how they are often portrayed.
It is in regard to migration that Capitalism, Alone appears to be most historically blinkered. Little is said about how only migration has allowed ancient cities like Rome and modern ones like London and New York to exist and persist. Nothing is mentioned about the relatively recent choices of economically diverse countries across the European Union to reduce barriers of movement within the EU. No theory is presented as to why passports are such a recent invention, scarcely more than a century old in most places. Instead, to various degrees, implicitly and explicitly, residence permits are promoted as a solution to growing inequality: treating residents differently in terms of civil rights by dint of their immigration status. This would, of course, create even greater racial inequalities within affluent countries than those that currently persist.
Milanovic is an economist, and he puts his views quite bluntly at times, which may be useful in terms of understanding what he actually believes. For example, at one point he writes of liberal meritocratic capitalist countries:
Because the upper class is not defined according to hereditary or occupational criteria but is based on wealth and education, it is an “open” upper class. It co-opts the best members of the lower classes who are able to become wealthy and highly educated.
The question here, of course, is what he means by “best” (which, unlike the word “open,” he does not enclose in quotation marks). The implication is that these co-opted individuals are the most able, allowing the upper class to constantly refresh itself and maintain its superiority. Dissent from below is also reduced, both by suggesting that anyone can make it if they try and by these co-opted individuals often becoming effective advocates of the argument that there is no alternative.
Capitalism, Alone is at times reminiscent of 1970s and 1980s world-systems theory, especially when its author defines communism as “a social system that enabled backward and colonized societies to abolish feudalism, regain economic and political independence, and build indigenous capitalism.” The sections on China might be of most interest to readers — but what could shock them is the conclusion that we cannot change our current conditions because:
we lack any viable alternative to hypercommercialized capitalism. The alternatives the world has tried have proved worse — some of them much worse. On top of that, discarding the competitive and acquisitive spirit that is hardwired into capitalism would lead to a decline in our incomes, increased poverty, deceleration or reversion of technological progress, and the loss of other advantages (such as goods and services that have become an integral part of our lives) that hypercommercialized capitalism provides.
The problem with suggesting that there is no alternative to hypercommercialized capitalism is that it implies that, because the author cannot imagine an alternative, an alternative cannot exist. A different conclusion might have looked at the potential limits of exponential economic growth, at where in the world (outside of the United States and UK) things are beginning to be done differently, and asked whether factors such as the abrupt decline in income inequality the author began the book by highlighting may be portents that suggest something fundamental is already changing.
Milanovic suggests that for capitalism to end, someone would have to come up with an alternative that would both work and be agreed upon. However, that is not how capitalism began, and so it need not be how it ends. When capitalism began in Europe, commenters were at first shocked by what was occurring. In the early seventeenth century, René Descartes (on the dockside in Amsterdam) wrote, “In this great city where I am living, with no man apart from myself not being involved in trade, everyone is so intent on his profits that I could spend my whole life without being seen by anyone.” Three generations later, long after capitalism had become established, arguments such as Bernard Mandeville’s Fable of the Bees began to be proposed and popularized to explain the unplanned transformation — a self-serving justification made by those who had profited most. Milanovic suggests that:
One cannot hope to maintain [material advantages] while destroying the acquisitive spirit or dislodging wealth as the sole marker of success. They go together. This may be, perhaps, one of the key features of the human condition: that we cannot improve our material way of life without giving full play to some of the most unpleasant traits of our nature. This is, in essence, the truth that Bernard Mandeville gleaned more than three hundred years ago.
But did Mandeville glean a truth, or did he instead create a selfish fable, an untruth about the human condition that has now fallen in popularity?
The current two-decade-long fall in global income inequality — the first since capitalism began — suggests that something significant is happening. Today, I could write the following true statement: “In this great world where I am living, with hardly any people profiting more than marginally through trade, everyone is so concerned about the state of the world and the future of their children that I can now spend my whole life meeting no one who thinks this is how we should live.” I could point out that a majority of people in the United States and UK expect their children to be worse off than them and that this is new; or that in the most equitable countries in the world, such as Finland, people are also the happiest. I could explain that in some of the most inequitable nations, such as Chile, children and university students have overthrown what appeared to be an unbreakable orthodoxy. I could describe the waves of environmental protest that have exploded in almost every country on Earth in the last twenty years; the rapidly widening understanding of colonial exploitation and racism; the increasing skepticism about the sustainability of economic growth; and the heartfelt desire of so many for their children to live better lives with less work, less destructive consumption, and more leisure. I am old enough to remember that these were all no more than fringe issues two decades ago. But I cannot tell you what will happen next. I can only point out that so much is now happening that ignoring all these changes is foolhardy.
The conclusion to this book is hidden a few dozen pages before its end. Milanovic dismisses the idea that people might wish to pursue more leisure time in the future, partly because “Their children would be angry at them for preferring to lead lives of leisure and idleness rather than making sure that the children had all the gadgets that their peers enjoyed and attended the best and most expensive schools.” Is that a verifiable claim or a mere impression? Milanovic’s thinking here is warped by capitalism and his position in it. Is there really a trade-off between leisure and well-being? Is a school good because it is expensive? Are children made truly happy by always having the latest gadgets?
Milanovic goes on to suggest that, in any country where leisure time increased, foreigners would (and should) come in to buy the most expensive property, citing the case of central Venice. However, for anyone who has experienced the smell of sewage in Venice in the summer, or its hordes of tourists, the question they might ask is, “What are the global rich actually buying when they buy up central Venice other than temporary prestige and a few new temporary friends?” The parts of those towns that the very rich buy up, they spoil — any sense of community dies, fences are heightened, and people with more sense look to live elsewhere.
Ironically, Capitalism, Alone ends with a partial realization of this contradiction of capitalism: that making a place or a school or a commodity desirable for its exclusivity and thus expensive actually spoils it. The author recounts that he lives in a very affluent part of New York, a neighborhood with such a high turnover of residents that, after being away for a couple months, he returned and found that the people in the restaurants he frequented and the neighbors in his apartment building had all changed: “New people had appeared who treated me (understandably) as a complete stranger. When this happens, you do not have much incentive to behave ‘nicely,’ to send signals of cooperative behavior, because you know that these new people too will soon change.”
The alternative, if you are rich enough to have a choice, is to choose not to live in such an expensive part of New York (or central Venice), where your neighbors are always changing; is not to frequently go away for a few months at a time (most people cannot); and not to assume that everyone else calculates and thinks like you do. It is perhaps because they do not that, when told there is no alternative, an ever-growing number of people may refuse to believe the preachers of such messages. The winners, the cheerleaders for capitalism, are not happy. They were far more sure of themselves in the recent past. The inequality that propels the system has been falling worldwide for two decades, and it is also falling within those countries where the cheerleaders are least believed. The system is changing, but that change has only just begun. Because we cannot see the future, there will always be a few who argue that what we have is the best we can expect. However, never before have so many people been so dissatisfied with what we have, what we have become, and where we are heading. You must have an incredibly dismal view of both human agency and human nature to believe that we will continue to live in the future much as we live today, or to believe that the accumulation of personal wealth will forever be the key marker of individual success.
ABOUT THE AUTHOR :Danny Dorling is professor of human geography at University of Oxford. His work concerns issues of housing, health, employment, education, and poverty.
For a link to where this review was originally published and a PDF of it click here.
July 18, 2022
When the old suffer too: the cycle of intergenerational inequality
There is a time honoured, effective, but ultimately illogical argument made about generations. The argument goes along these lines: An ageing society doesn’t particularly need a vision of the future. It doesn’t need something better to look forward to because it contains so many very old people and they tend to live for today. They know they haven’t got long to go.
In an ageing society one political party emerges as the dominant old people’s party. That party will always present itself as holding what it thinks will be the most popular positions amongst the most elderly in society: pensioners and better-off older workers. These are its core support groups, groups that it thinks will always being growing in size.
The Gerontocracy
So often in countries with an ageing population we are told we are destined to be governed by politicians who will aim to ensure that house prices forever keep rising. We are told that the political party of the old will always try to redistribute monies to pensioners rather than to those who are poorer but are not pensioners; that the long-term consequences of such behaviours are not a concern to the party’s supporters because, demographically, few of this group will be around to suffer those long- term implications. This political party only pays lip -service to climate change.
The party of the old does not really care if there are a lack of new homes to allow people to start new families, if the already low birth-rate continues to fall, or if the introduction of the market into British universities causes some to fail. For them it doesn’t matter if opportunities for younger Britons to work or study abroad shrink.
What does matter to them is that they ensure that the property -rights of its more affluent older voters are preserved abroad over their second and holiday homes. The party of the old is less interested in emigrants, as they are potentially gone for ever politically; but does care about those it calls ex-pats.
Superficially convincing
The argument can be convincing at times and there are often signs that it is credible. The party of the old finds ways to encourage guest -workers to come and carry out work on a temporary basis, hardly ever securing citizenship. Simultaneously, it encourages its older supporters to complain about immigration to distinguish itself from the alternatives.
The old people’s party encourages the young to split their political allegiances between progressive nationalist parties, greens, liberals, social democrats and as many other causes and battles as it can. It often takes part in debate simply to cause rancour and spread division. At the very same time the old people’s party works hardest of all to hide any internal dissent and to ensure that its support-base, if ever split, quickly coalesces politically.
Why is the argument illogical? Here are just a half-dozen reasons: 1) because ageing cannot continue for ever, especially during a pandemic and its aftermath; 2) because the old are not a single block with a single set of interests who do not care about others ; 3) because a depleted society is immediately unable to supply enough of the health and care needs most often required by the old; 4) because the overall harm caused is much greater than any short-term gains made; 5) because all humans need a vision of the future and hope, regardless of their age; 6) because in those counties where a party of the old has emerged, society is actually far more split by income and wealth than it is between young and old.
The USA and UK are now famous for their old-age political parties. However, as the Resolution Foundation demonstrated in July 2022, and illustrated with one single simple devastating graphic (shown below), the UK went from being a relatively equitable state in the 1960s – with low intergenerational inequality and high overall equality – to the most unequal large country in Europe, where over the last twenty years all non-pensioner groups have now seen any income rises end.
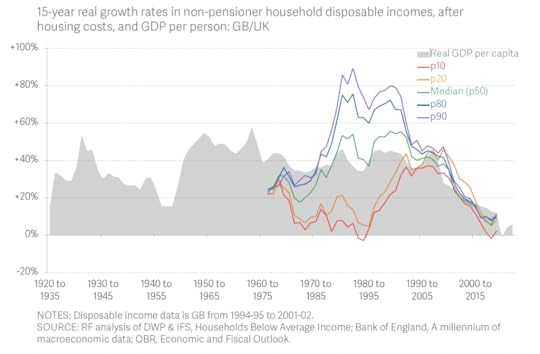
Source: Adam Corlett, Felicia Odamtten & Lalitha Try, The Living Standards Audit 2022, July, The Resolution Foundation, page 18.:
Practically doomed
The five coloured lines in the Resolution Foundation figure above all now running in parallel and all point downwards apart from an upward blip the very latest year, the year before high inflation struck. These lines are the portents for the end of the great lie: that an ageing society will always reward the old.
The richest income group in this figure, labelled ‘p90’ because it is made up of people who are better-off than 90% of others under 65, of non-pensionable age, is the group represented by the line coloured purple in the Resolution Foundation illustration. It is disproportionally made up of people in their 40s, even more in their 50s, and even more in their early 60s. This best-off group is no longer seeing its income diverge from the rest. With inflation they will soon fall.
You cannot skew towards the old for very long and get away with it. Eventually the pile of lies you have built up by promising so much to so many who need do nothing for it other than vote for you, comes crashing down.
Written by Danny Dorling for teh Intergeneration Foundation, published on July 18th 2022
For a PDF file of this article or the original posting click here.
June 28, 2022
The share of people working in public service
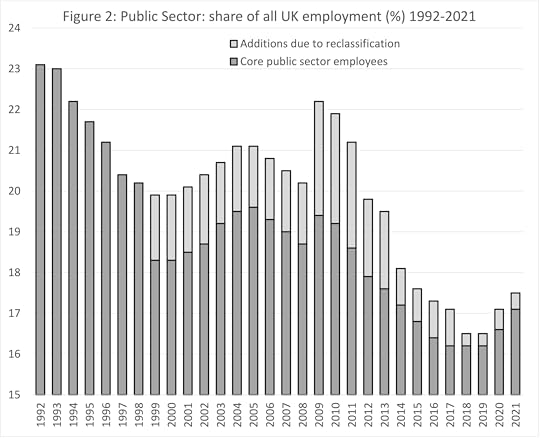
The government could, if it wished, claim that in 2021 it was employing more people in public sector jobs than John Major did. The government could claim that the increase in public service employment under its rule in recent years has been large. They could point out that Mrs Thatcher’s governments only ever cut public service jobs. They could say that an extra 324,000 jobs in public service have been added since the 2017 General Election, an increase by 2021 of 6% on the total employed in the public sector as compared to that 2017 year. They could say all of this, and each fact they presented would be true – but it would miss the point. The point being that they would not be comparing like with like. There are today far fewer public sector workers per person, or per worker, or per pensioner than there have been for many decades.

Source: ONS “Public sector employment time series”.
Figure 1 shows one measure of the number of public sector workers in the UK. This measure fell to a low of 5.05 million in 1998, rose to a maximum of 5.75 million in 2010, fell again to just 5.15 million in 2016 and then rose again so that when most recently counted for a whole year (2021), it stood at 5.48 million. In the final quarter of 2021 it was even higher: 5.52 million. These are the statistics government would use if it wanted to make claims of expansion. The numbers that Figure 1 is based on come from the ONS “Public sector employment time series”. It is updated quarterly and begins in 1992.
So why is it so misleading to quote the absolute counts of public sector employees? The reason is not because it is so hard to count this sector, although when universities are privatized, or banks and rail companies are nationalised, some reclassification of jobs has to happen (the extent of which is indicated in Figure 1). The reason that it is misleading just to compare counts is that the size of the population changed over this period. There were more members of the public to be servants to. Because of this Figure 2 shows the same data as Figure 1, but now with the height of each bar proportional to the percentage of all employees in the UK who work in the public sector. This percentage has fallen from just over 23% in 1992, to be just over 17% in 2021. Looked at in this way, as a share, a very different picture emerges.
Source: ONS “Public sector employment time series”.
There are now far fewer people at the Town Hall to deal with your enquiry about car parking permits (for every one of you with a car). There are fewer police officers, fewer teachers working as a share of everyone working. More and more often there are fewer teachers per child in each state school in the UK.
What Figure 2 shows most clearly is that the private sector has grown, rapidly, from providing just under 77% of all jobs in 1992, to providing over 82% in 2021. In most cases the new private sector jobs are not replacing the public sector share that no longer exist. The new private sector jobs are almost all in services and in sales: in retail, in telemarketing, but they are also in private care homes and private nurseries, in private hospitals or staffing and building private cark parks; providing private security, private finance, private university halls of residence, private cleaning contractors, more private doctors, nurses and teachers (but only for those who can afford to pay).
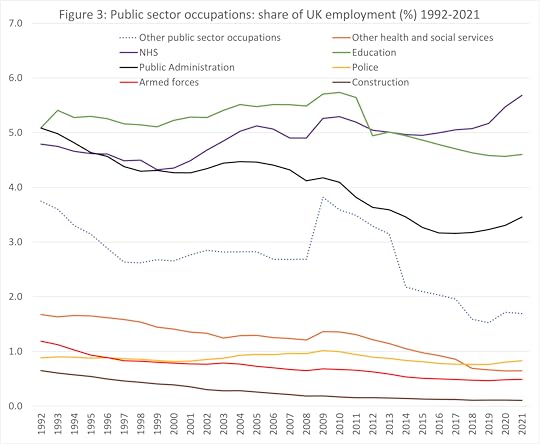
We can add a little more detail to what has been lost from the same sources as is used to draw Figures 1 and 2 and by applying the overall percentage total to the occupations which that source tallies. Figure 3 shows the result. The lowest line in the figure is for people working on construction jobs in the public sector – building for the public sector and employed by the public sector to do so. In 1992 0.6% of all employees in Britain worked in such jobs, but by 2021 that had fallen to 0.1%. The next smallest group is the armed forces, down from 1.2% of all people in work in 1992 to 0.5% in 2021. The police are also down as a share, from 0.9% to 0.8% (this is everyone who works as a public servant with the police, not all of whom will be police officers). Figure 3 also shows that in 1992 there were almost two public servants working in other health and social service roles for every one working in the police. Now there is less than one – a fall from 1 in 60 employees in the UK working in such public sector jobs in 1992, to fewer than 1 in 150 by 2021!
Source: ONS “Public sector employment time series”.
“Other public services occupations” are a great amalgam, which have more than halved in their share of employment. This group rose briefly when some banks were nationalised during the banking crisis. In contrast those occupations labelled as “public administration” have seen slightly smaller falls. Many of these jobs are in local government and there was a slight rise very recently there as more employees were needed to deal with the pandemic. However, a closer look at Figure 3 suggests that the fall in public administration from 2010 onwards was almost as steep the fall in public sector jobs in education, almost all of people working in state schools (including academies); but this was a fall after a shallow rise. In 1992 some 1 in 20 employees in the UK had a public sector job that had something to do with education. That had risen to 1 in 17 by 2010, but had fallen to 1 in 22 employees by 2021. In contrast, the NHS saw a small employment share rise under the New Labour government of the early 2000s and then another rise during the pandemic. However, the rise in employment in the NHS has been far smaller than the rise in the needs of an ageing and increasingly ill population, a population with so much less state social care to fall back on.
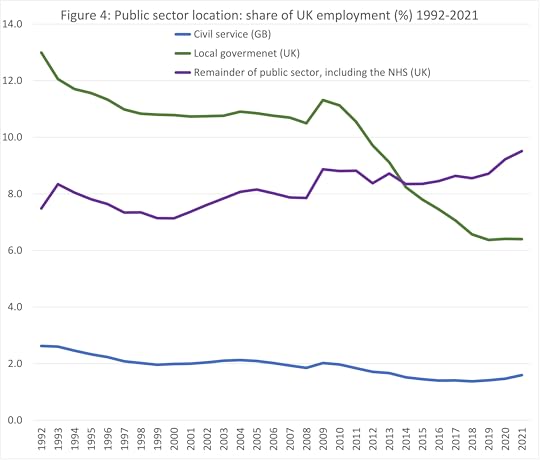
The final graph in this series, Figure 4, shows where the relative cuts have been greatest. Local government bore the brunt of the repeated decimation. Between 1992 and 2021, more than six times over, local government’s share of UK employment was reduced by a tenth. It was decimated at least six times in those thirty years. Similarly, the traditional civil service also fell greatly, from 2.6% to 1.6% of all GB employees in these thirty years – which was also six decimations before the very recent rise (to deal with the onset of the pandemic and Brexit). As a share of the total, the remainder of public jobs grew slightly – but only because of the inclusion of the NHS in that remainder.
Source: ONS “Public sector employment time series”.
As I write, in late Spring 2022, the government are again talking of more public sector job cuts – especially in the civil service. They say that we can only afford the public sector because of the private sector and that the public sector is too large. A cursory glance at the size of the public sector in many other European countries reveals this to be untrue. More importantly, as the private sector has grown in the UK, rather than any increase in tax receipts from it being used to underwrite an even better public sector, the public sector has been repeatedly decimated.
Some public sector jobs have been replaced with private sector ones, but many others have simply disappeared and what used to be done is no longer done. Even more importantly, perhaps, what could be done in future is not even imagined. We spend so much time and effort trying to defend what we have, that we have no time or imagination left to think of what could be done better. We were unprepared for a pandemic. We were unable to care properly for those most in need before it, and even more so after it. We are no longer planning for a better future.
At some point these continual cuts will end – not least because we will reach the point where we cannot afford to carry on along this path. A society where the overwhelming motive for the large and still growing majority of work is the employers’ profit becomes an increasingly dysfunctional and impoverished society.
For a link to the published article and PDF click here.
May 6, 2022
The end of great expectations?
The pandemic inquiry must account for stalling life expectancy before the pandemic, Editorial, British Medical Journal
Life expectancy at birth is a key summary measure of the health of any given population. Ideally, it should increase steadily over time in the absence of data artefact, mass migration in or out, or a large scale event such as war or natural disaster, disease outbreak, or societal collapse. Any break in the trend beyond isolated annual fluctuations should raise the alarm among health workers, policy makers, and the public.
The covid-19 pandemic has caused life expectancy to fall below predicted levels worldwide, including in the UK.1 Part of this may have been inevitable given what we now know about this new coronavirus, but part could have been avoided. The inquiry into the UK government’s handling of the pandemic is essential,2 not least to provide answers to the tens of thousands of bereaved families who are rightly asking whether more could have been done to save their loved ones.
When the UK inquiry takes place—public hearings are likely to begin in 2023 (the Scottish government’s inquiry may start in 2022)3—it must also consider what was happening in the UK before the pandemic began. This is essential to ensure that the population harms caused by covid-19 are measured accurately, taking full account of prevailing trends before the pandemic. By March 2020, decades of progress in improving life expectancy had already stalled, and for some groups, reversed. Women over 65 years old were the first to experience falls in their life expectancy.4 In 2018, the UK’s Office for National Statistics (ONS) reported a fall from 82.72 to 82.67 years for women of all ages between 2011 and 2012.5 Subsequently, more groups and communities have experienced widening inequalities and declines in life expectancy,6 including women at and below the second most deprived decile in the Index of Multiple Deprivation.7 Most recently, life expectancy declined for people at and below the fourth most deprived decile between 2015-17 and 2018-20.8
In January this year, the ONS published an update of its regular life expectancy projections using the latest population estimates and data on life expectancy, up to and including 2020.9 Figure 1 shows these and previous projections for both males and females in the UK.
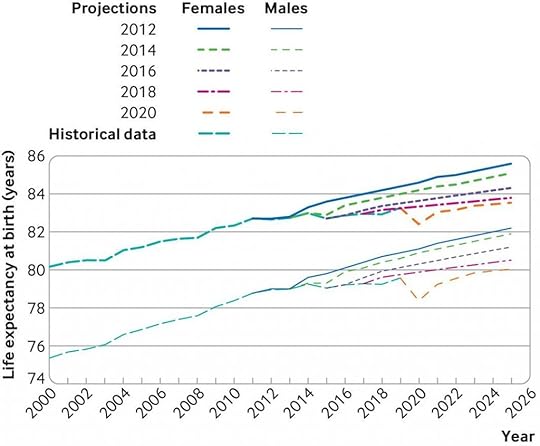
Fig 1
Projections of life expectancy at birth for males and females in the UK, 2012 onwards. The dotted lines show the actual recorded historical data from 2000 to 2019, and the solid lines show ONS projections made every year from 2011 to 2025
The recorded historical data, represented by the dotted lines, show that life expectancy fell for women briefly after 2011 and for both men and women more substantially after 2014, before rising above the 2014 levels in the year before the pandemic. Between 2012 and 2014, projected life expectancy for people in 2025 fell by 0.5 years for women and 0.3 years for men. Between 2018 and 2020 the same projections fell by 0.3 years for women and 0.5 years for men. In other words, the fall in projected life expectancy caused by the first year of the pandemic was comparable with a similar fall in the early 2010s.
Importantly, estimates of excess mortality linked to the pandemic compare mortality in 2020 and 2021 with a five year average—including the period between 2015 and 2019 when life expectancy was stalling. This distorted baseline (with higher mortality than might be expected historically) may lead to underestimation of the true excess mortality caused by covid-19. We should aspire to a higher level of population health than we had in 2015-19. Notably, the Institute and Faculty of Actuaries covid-19 action taskforce used 2019 alone as its baseline,10 but even that number is lower than all of the four most recent previous ONS projections made for 2019.
Other high income countries also experienced falls or stalls in life expectancy between 2014 and 2015.511 However, when trends for 18 Organisation for Economic Cooperation and Development countries were examined, researchers found that all countries except the US and UK recovered with “robust gains” in 2015-16.11 The US is poor company to be in with regard to population health: life expectancy at birth there has declined annually since 2015, except for a small increase in 2019, with increasing inequalities in age at death.12 13
These latest ONS data suggest the UK was an outlier among comparable countries, with worsening population health in some years before covid-19.5 ONS projections of life expectancy are likely to be revised down further when the 2022 based projections are published next year or in early 2024, as these will include far more complete data on covid-19 deaths in 2021 and 2022.
To be fully comprehensive, any inquiry into pandemic deaths must also investigate the underlying causes of the concerning trends in life expectancy over the decade before the pandemic began. Those same causes, which are presumably ongoing, probably exacerbated harms done by the pandemic and may continue to cause serious harm if they are not acknowledged and urgently tackled.
Footnotes
Competing interests: We have read and understood BMJ policy on declaration of interests and declare that we have no competing interests.
Provenance and peer review: Not commissioned; externally peer reviewed.
For a PDF of this article and link to original source click here.
April 27, 2022
The Trickle Up of Fear
Slowly and strangely the world changes. We adapt, but it changes us too. We are not the people we were. It is not just that we have aged, but also that the context has changed. When we think back to a past where some of us worried less – it was because we had less to worry about. But it is hard to quite remember that old world clearly enough not to think that you might be deceiving yourself, and that it has always been like this.
Before 2008 we were living with great income inequality, among the highest in Europe, but average incomes had been steadily rising for decades. Since austerity was introduced in the UK in 2010 (to a degree unlike any other European country) average incomes have fallen and now the forecast rise in inflation means that we are not expecting the average British person in work to be any better off than they were in 2008 until at least 2027 (see Figure 1). Even that forecast may be over-optimistic.
Figure 1: The average person in work is £11,000 a year worse-off due to slump
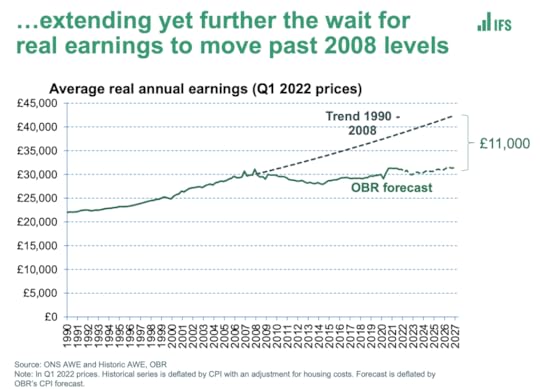
The average person in work is £11,000 a year worse-off due to slump
Click here for: Source
When the March 2022 Spring Financial Statement was released the Financial Times’ headline read: ‘Britain’s poorest left to bear brunt of squeeze on cost of living’. Their subtitle was ‘Chancellor focuses support towards working families and middle- and high-income earners’. And they went on to report the conclusion of the government’s own Office of Budget Responsibility (OBR) which claimed that what we would now see ‘…would be ‘the biggest single financial-year fall in living standards since records began 66 years ago.’
The savagery of austerity, bolstered by a government that channels money towards those at the top, is unremitting. We have to travel back much further in time to find a precedent. The economist Geoff Tily, posted an updated graph of how the current pay squeeze compares to all others, showing that the slump in living standards we have now lived through, and are now forecast to continue to be living through, most closely compares to that seen between 1798 and 1822 (Figure 2)
Figure 2: This is already the worse squeeze on pay for over 200 years

This is already the worse squeeze on pay for over 200 years
Source: Geoff Tily, Senior Economist at the TUC, March 23rd 2022.
A footnote in Geoff’s graph explains that we were too optimistic before. An error in the estimation of Average Weekly Earnings (AWE) in 2021 meant that the pay squeeze did not even come to a temporary halt then. It has been unremitting now for the entire lifetime of children sitting their first formal exams this summer. It is expected to continue to be unremitting from here onwards. All previous forecasts of its ending soon have been wrong.
Fear trickles up slowly. At first it was the very poorest in the early 1980s who were hit hardest when mass unemployment came and benefits began to be slashed. Then, in the 1990s, those just above them saw their wages stagnate. Next, in the 2000s, what had been the relentless growth in wages for those in the middle, ended. But then, in the 2010s, real wages for most people fell as well. Now those who are better-off than average are beginning to see their living standards suffer as gas and food prices rise. Even after the Chancellor had made those changes in spring 2022, reducing fuel duty and raising national insurance thresholds in ways that most favoured the already better-off, the average person will be struggling more by 2025 and even the better-off are now seeing sustained overall falls in their living standards, for the first time in any of their lives.
The Resolution Foundation produces the most comprehensive graphs of all, which in stunning technicolour reveal just how bad the current situation is (see Figure 3). Most families, between 2019 and 2025 will suffer a fall in incomes last only experienced by the very poorest in the early 1980s and an even smaller number in the early 1990s recession. Back then it was those thrown out of work that suffered in this way. Now it will be almost everyone. And most of that 2019-2025 fall in incomes has already happened.
Figure 3: The ‘Worst Parliament Ever’ graph of household incomes 1966-2025
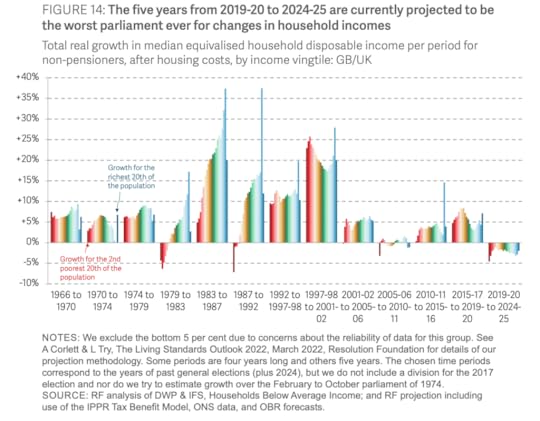
The ‘Worst Parliament Ever’ graph of household incomes 1966-2025
Source: Torsten Bell et al. (2022) Inflation Nation: Putting Spring Statement 2022 in context, March 24th.
Why is the Chancellor of the Exchequer continuing to make changes that will most badly effect the poorest in a society, those already suffering the greatest pay squeeze for over two hundred years and why is he doing this when the UK already has the highest income inequalities in all of Europe? More and more people will come to conclude that he is trying to pander to fear, trying to seek favour from those who have more than average by showing them that even when everyone is suffering, and the poor are suffering the most, he will try to reduce some of the taxes and costs of the better-off so that at least their drop in living standards will not be quite as sharp as the plummeting experienced by the minority who already have the least.
In the 1980s we were told that income and wealth would trickle down from the top to the bottom. We were told not to worry about the huge rise in income inequality then because – apparently – it would eventually ‘work its way through’ lower down. It did not, but something else started then. A new fear began, at first among the very poorest, that their children would have worse lives than they had. That fear slowly spread upwards over the decades and has now come to be true for almost everyone. That fear is greatest of all amongst the people who have the most to lose – like the Chancellor of the Exchequer, Rishi Sunak, himself.
Rishi Sunak is playing on our fears. He is hoping that the increase in our fear of each other that comes with rising inequality and falling living standards will pit family against family and worker against worker. Sunak is hoping and expecting that most people will never look at the kinds of graphs shown in this brief article, let alone understand them. He tells people that he feels and understands their pain – and in a way he does, as he is using that pain. He wants the general public, or at least a majority of the better-off half of the general public, to believe him when he says that there is no sensible alternative. He will say that what has happened was inevitable; but that he and his colleagues are doing, and will in future do, whatever they can to soften the blow.
The alternative, to actually soften the blow, would require people like him to give up their North Yorkshire Georgian mansions, the ones that they only use some weekends, and to share most of the rest of their wealth and property with others; the properties they hardly ever visit. The alternative would be for the dividends on the income from the shares they own to be reduced, and for the people who work in the firms they own (by dint of those shares) to be paid more. The alternative would be for the richest to be taxed as the rich in other European countries are taxed, and for welfare benefits to be made more decent (as they are in most of the rest of Europe). The alternative would be for more people like the Chancellor to use the schools and hospitals that everyone else uses. That alternative, for these extremely wealthy people, is – to them – terrifying. And so they work hard to try to ensure that you and I do not even imagine it, do not speak of it, and do not win it.
For a link to the original article and a PDF of this article click here.

Who ate all the pies?
April 12, 2022
The never-ending pandemic
The pandemic is not ending—and it may not end in our lifetimes.
There are already improved treatments for Covid-19 and associated mortality will probably be lower in future. As our immunity wanes, however, most of us are likely to carry on catching this illness, again and again. Others may well feel obliged to shelter—especially those who are most vulnerable and even among those repeatedly receiving booster vaccinations.
This is the reality we are now having to face, worldwide and across Europe. We know this because of random surveys of the prevalence (current burden) and incidence (new cases) of infection.

Alonafoto/shutterstock.com
One of the first surveys to test a random sample was in Spain between April and May 2020. It discovered that by then just over 10 per cent of the population of Madrid had caught the coronavirus and 5 per cent across Spain as a whole. A longitudinal survey in Portugal found that as of March 2021 17 per cent in that country tested positive for viral antibodies.
Between those two studies, at least another 23 were organised across Europe. They reported hugely varying rates of infection. These ranged from less than 1 per cent of blood donors in one part of Germany to 23 per cent of people in the Lombardy region of Italy, especially hard hit early on.
Small-area data
A weekly survey began to report in England, with data being made available for small areas from November 2020. Figure 1 shows the proportion of a random sample who tested positive for the disease each week in England during the second wave.
Figure 1: people in 116 areas of England with Covid-19, November 2020 to March 2021 (%)
Source: Organisation for National Statistics Coronavirus (Covid-19) Infection Survey
The figure helps explain why the one-off surveys carried out across the rest of Europe varied so much. The four labelled places with some of the highest rates were all parts of greater London where, at its height, as many as 6 per cent of the local population were estimated to be infected in one week during the second wave. Cornwall and Plymouth are remote parts of the south-west of England, with very low rates at this time.
Figure 2 extends the time series. (When rates of infection became low, in the summer of 2021, they were not released for these small areas and so there are gaps, as also over Christmas 2020 and 2021.) One can see why some thought the disease might be eliminated when it became less prevalent and that vaccines would greatly reduce transmission (not just symptoms). The right-hand end of Figure 2 shows this was however not to be the case.
Figure 2: people in 116 areas of England with Covid19, November 2020 to March 2022 (%)
Source: ONS Coronavirus (Covid-19) Infection Survey
New waves
The story of this pandemic is usually told in terms of different variants arriving in different parts of Europe at different times, each starting off a new wave. We are beginning to realise that, even without new variants and even with vaccines, the disease will continue to circulate and new waves will form, rise and fall as immunity within local populations rises and falls, depending on how recently that population has been infected. Europe is, and will continue to be, a changing patchwork of waves varying over time and across space.
As many do not know they are infected, random testing is the only accurate way to measure the spread of the virus. Reported case numbers are an extremely poor substitute, as these depend on individuals coming forward and on a test being available. Lockdowns and other measures to reduce infection can slow the ascent of a new wave. But the longer rates in a locality have been low, the more immunity will diminish.
‘Living with’ Covid-19 will mean living with a large burden of illness for a long time. This does not take account of the long-term effects for some or the impact on health and other services disrupted by the continued contagion. ‘Endemic’ means the virus is here to stay—not trivial or minor.
Figure 3 illustrates graphically what this implies. The proportion of people in England who were infected grew rapidly in December 2021. Shortly after the Christmas holiday far more than a tenth of the population of poorer parts of London—such as Tower Hamlets, Hackney and Islington—were infected, as was also true of poorer towns in the north-west of England: Burnley, Bury and Accrington (in Hyndburn) are identified here.
Figure 3: people in 116 areas of England with Covid-19: October 2021 to March 2022 (%)
Source: ONS Coronavirus (Covid-19) Infection Survey
Rates fell in January 2022 but the fall slowed in February and they rose again in March. Now rates became highest in those areas which had had the least infection before—coastal retirement areas such as Bournemouth, Plymouth and along the Suffolk coast. It is hardly surprising, given this geography, that deaths from Covid-19 have risen again in England in April 2022.
Endless debate
There will be endless debate for years to come about the best ways to mitigate the pandemic. When cases and deaths appear to fall in particular parts of Europe, politicians may well claim credit, suggesting that the virus is ‘under control’; when these rise again, they may find some external factor to blame or prefer not to talk about it. When pressing events—such as war—intervene, public concern will, for a time, itself wane.
Mortality records will make it appear the virus is abating, because we are becoming better at treating the symptoms and preventing death and because most people will have at least some degree of immunity, making death much less likely. Yet we might come to expect a prevalence of about one in 25 in most places at most times and more than one in ten in particular places at particular times.
The virus has died down in both of the last summers. But with more contagious strains, far fewer controls and an exhausted tolerance for social distancing, that might not happen this year. It could be many years before a more-or-less-regular seasonal pattern emerges and it could be several decades before it is seen as a less serious disease because our immunity, especially among the now young, has grown.
We have no useful historical analogue. There is speculation that some previous pandemics thought to have been of influenza actually introduced a novel coronavirus (one of the current common-cold viruses). This remains however speculative and none is more recent than 120 years ago, when there were far fewer elderly and other causes of death were very much more common. Back then a Covid-19 equivalent would thus have killed or rendered seriously ill many times fewer people.
Not over
Far too many think the pandemic is over—or at least coming to an end. The prevalence rates revealed by the various surveillance surveys negate that. Close population monitoring is thus imperative.
In England infection is now highest in those areas touched least in the last two years. In more dense urban populations and among poorer areas incidence has gone up and down many times. Within my tiny home city of Oxford, at the height of wave two in January and February 2021 people living in the poorer parts of the city were eight or more times as likely to catch the virus (and die if elderly) as those in the more affluent neighbourhoods.
Yet it will get to the more affluent eventually—just less often. And we do not know what that might mean. It all depends on how quickly immunity wanes.
The affluent tend to live much longer than the poor, so there are proportionately far more better-off people today living to very old age. The virus may harm the poor more but in terms of absolute numbers more better-off homeowners have died than key workers. Men have been (and will continue to be) much more harmed than women.
Political effects
What effects all this will have politically in the medium term are hard to gauge. But life has suddenly become more dangerous for those more disposed to vote in elections who also more often vote for conservative parties. How might the elderly react to gung-ho, ‘libertarian’ political leaders of this stripe in future?
We should plan for the disruption caused by the pandemic to continue. We should not talk of when it will be over—not yet. It may end so slowly that this is only declared (and evident) many years from now.
Around the world calls for a ‘people’s vaccine’ might reduce as it becomes evident that (outside of China and North Korea) most people have now been infected at least once. Instead there might be growing recognition of the need to target vaccination on the elderly and those otherwise most at risk, especially the elderly in poorer countries.
Growing threat
Figure 4 shows who has mostly died in England and Wales, based on mention of Covid-19 on their death certificate. Although this in some ways overestimates deaths, as not all were primarily due to the virus, that is offset by lack of such mention before recognition, especially early on in 2020. The rates are also crude because they ignore the effects of ageing and migration—but again this would not alter the figure much if corrected. Most importantly, the first 12 weeks of 2022 (for which we have data) are extrapolated to give an annual estimate for this year.
Figure 4: crude annual mortality rates from the pandemic in England & Wales, 2020-2022, by age and sex

Source: ONS Coronavirus reports of deaths shown as a proportion of the mid-2019 population totals
On those assumptions, by the end of 2022 one in six (15 per cent) of all men aged 90+ in 2019 in England and Wales will have died because of the disease and one in ten (10 per cent) of all women aged 90+. Those death rates are more than 100 times as high as for those aged 40-45 and much more than 1,000 times the rates for the 25-29 age group.
Even as mortality rates for the elderly reduce in future, many of us should expect that in our old age this will be a growing threat we shall face.
…
This article was written as part of the ‘Reconstruction beyond the Pandemic’ project at the European Trade Union Institute, with an edited volume due in early 2023.
For a PDF of this article and a link to the original posting click here.
Danny Dorling's Blog

- Danny Dorling's profile
- 96 followers


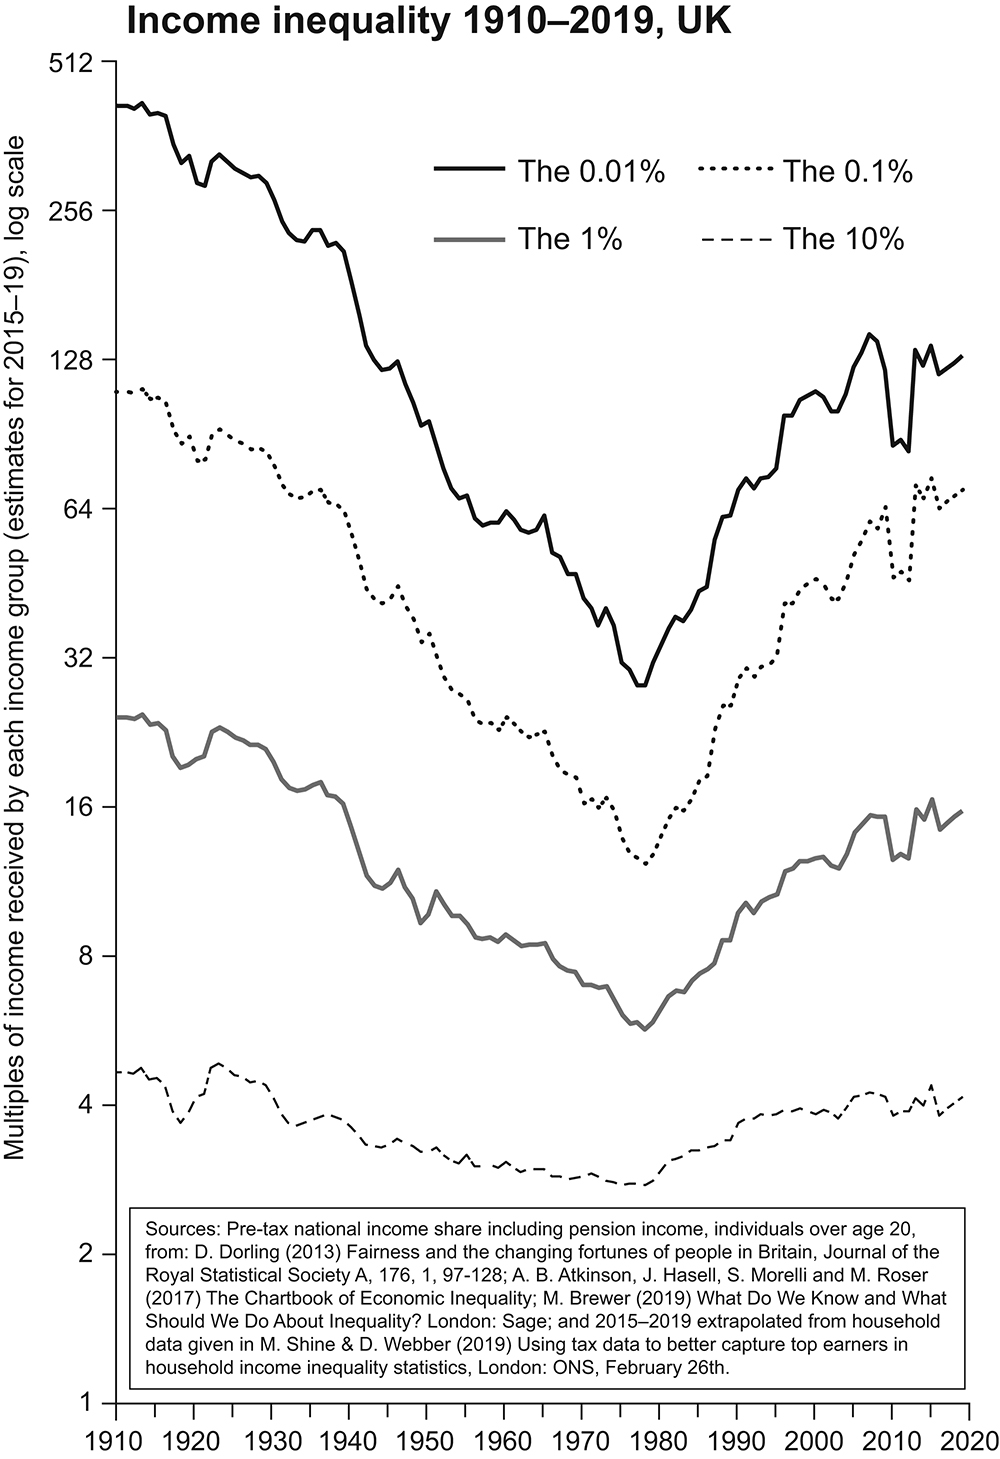