
Danny Dorling's Blog, page 11
July 19, 2021
Levelling up taxation, funding and education
The human geography of the UK is a very unlevel playing field – more akin to a mountain range than a field. Inequalities vary greatly. Parts that you might not think of as especially unequal are in fact sometimes the most jagged of the socioeconomic mountains.
In 2019, Professor Alasdair Rae and Dr Elvis Nyanzu, of Sheffield University’s Department of Urban Studies and Planning, produced “An English Atlas of Inequality” for a wide range of different types of area across England. They found that local income inequalities were greatest, not in the poorest parts of that country, but in some of its most affluent cities and regions. Inequality within mostly poor communities tends to be low as there are usually few very well-off areas near areas which are mostly poor. Everywhere in the UK has some very poor areas. Prof. Rae and Dr Nyanzu gave Skegness, Sunderland and Bridlington as examples of low inequality areas.
In contrast to poorer parts of England, they found that the five TTWAs (Travel-to-Work-Areas) with greatest inequality were, in rank order by Gini coefficient of income inequality: London; Tunbridge Wells; High Wycombe and Aylesbury; Slough and Heathrow; Guildford and Aldershot. (ONS’s 228 TTWAs approximate to self-contained labour market areas.)
Other areas of England with some of the highest inequality rates within them included Leamington Spa; Cambridge; Bath; Cheltenham and Oxford. Among the top twenty most economically unequal areas in England, the only one to be found in the north was Harrogate. A map of the 20 most and 20 least unequal areas on page 6 of their atlas reveals how London-centric gross inequality is.

The 20 least and most unequal TTWAs in England
Source: page 6 of this.
Within England, the greatest inequalities are thus found within some of the most affluent areas. These places always have relatively poor areas within them where people live who do many of the service jobs for those living in the more salubrious enclaves. The distribution of inequality found within Scotland, Wales and Northern Ireland will be similar, but not quite as extreme. Levelling up the UK locally would require addressing the greatest inequalities first, which are geographically most concentrated in some of the most affluent parts of England.
The UK is not a poor group of countries but has a great deal of poverty within it because of factors such as excessive pay and relatively low taxation (when compared to other European countries). To truly level up, the need for extremely high incomes needs to be reviewed and reformed; gross inequality within institutions discouraged; and both earned and unearned income needs to be taxed more progressively. If this is not done, everyone living anywhere in Britain suffers. Economic inequality is socially corrosive.
People living in the shadow of some of the worst inequalities tend to suffer more than others. As one economist recently explained: ‘…median incomes in London, after housing costs, are no higher than elsewhere, and child poverty is considerably higher… [we now have] an increasingly dualised labour market, which has performed extremely well in creating jobs, but with many of those jobs being precarious or insecure, with the abuse of zero-hours contracts and self-employment in some sectors, growth of freelancing rather than employee jobs in others, and in a decline in training and development across the spectrum.’
Perhaps the level of income inequality in Britain is natural?
The UK may be a very unequal place; but should we not accept that a high degree of inequality is now inevitable in a globalized world? Below are the 2018 estimates of household income inequality for 25 OECD countries (the 13 others have yet to report their figures for that year). Like some of the more equitable parts of Britain, some of the most equitable OECD states are poorer places, such as the Slovak and Czech Republics. However, this is not the case in general. Belgium, Norway, Finland, Sweden, Austria and France are also in the top ten of that table.
In contrast, the most unequal ten states in the table are mostly to be found outside Europe. The UK now sits within (and near the top of) a cluster of very inequitable eastern European countries: Romania, Latvia, Lithuania and Bulgaria. Income inequality in the UK is even higher than in Israel, and higher even than South Korea. Fifty years ago the UK was one of the most equitable of OECD states. After the cold war had ended, it was not just a few Eastern European countries that became much more unequal. It was also Britain.
Table: OECD countries ranked by the Gini coefficient of income inequality in 2018
1 0.236 Slovak Republic
2 0.249 Czech Republic
3 0.249 Slovenia
4 0.258 Belgium
5 0.262 Norway
6 0.269 Finland
7 0.275 Sweden
8 0.28 Austria
9 0.281 Poland
10 0.301 France
11 0.303 Canada
12 0.305 Estonia
13 0.306 Greece
14 0.317 Portugal
15 0.318 Luxembourg
16 0.325 Australia
17 0.33 Spain
18 0.345 Korea
19 0.348 Israel
20 0.35 Romania
21 0.351 Latvia
22 0.361 Lithuania
23 0.366 UK
24 0.408 Bulgaria
25 0.479 Costa Rica
Note: all OECD countries for which 2018 data has been released, the most recent year available at the time of writing.
Click here for Source
What should and should not be done?
All British governments since the late 1970s have failed to reduce inequality in Britain. The response of the most recent British government has been to establish a ‘Levelling Up Fund’ to target relatively small sums of money to areas that they have identified. The formulae for England includes ‘Average journey times to employment centres’. In the model, this is the average journey time to the nearest place where at least 5000 people are employed.
There are places that are very affluent and others that are poorer a long way away from the nearest centre that employs 5000 people. Furthermore, there are many places in which over 5000 people are employed in which there is great deprivation and a need to level up. For many decades British governments have commissioned the creation of indices of deprivation to identify which places in the UK are most deprived. Looking at the maps of deprivation, anyone can see that, in general, deprivation tends to be higher nearer to employment centres and is quite low in places a long travel distance from them.

The Geographical Distribution of Deprivation across most of England
Source: click here.
Perhaps we should not be surprised that one of the most economically unequal of OECD states is also a place where even the interventions suggested to try to ‘level up’ are unlikely to level up but may well instead contribute to even greater unfairness in future when government funds are transferred using dubious criteria and an opaque bidding process.
It is impossible to ‘Level Up’ geographical areas while also maintaining other educational, housing and health inequalities. There remains, for instance, a huge concentration of private education spending that is concentrated mostly in the South East of England. This exacerbates educational inequality locally and is detrimental to educational achievement nationally. Without educational reform to even out that spending, the opportunities for children across Britain will not become more even. That is just one aspect from numerous possible examples of one part of the domains that have been allowed to become more and more inequitable. The situation has become so bad that everything – from economic inequality, to employment, housing, education, health, family support, and so on – must be considered if we really want to level up, level out and create a more equal playing field across the UK.
There are numerous policy recommendations that could be implemented to enable true levelling up. I have touched upon just three major ones in this short piece. Research evidence from comparisons of affluent countries shows us that it will not be possible to level up without implementing, amongst other measures, each of these:
A more progressive system of taxation. More progressive taxation has been advocated with many researchers producing compelling evidence, including Thomas Piketty.Basing the allocation of funding on the right data. Evidence is increasing in the UK of pork-barrel politics, where funding is not based on need.Reforming education spending so that the UK is no longer the outlier state where private education funding is higher than anywhere else in Europe. In recent years state education spending across the UK has been cut, while private spending for a few children rises.
Read more commentary pieces on the Levelling Up hub
Professor Danny Dorling is the Halford Mackinder Professor of Geography at the University of Oxford. His areas of expertise include housing, health, employment, education, wealth and poverty.
For a PDF of this article and its original publication link click here.


July 13, 2021
You may say “jam tomorrow”. But we say, “share today”
Rather than promising growth tomorrow, policy-makers should give more to younger generations today
Slowing GDP growth
We tend to assume that there will always be an economic recovery after a slump. However, in Western Europe the rate of economic growth has been slowing down gradually each year since at least 1954. The graph here shows that trend and includes estimates and projections made by the International Monetary Fund (IMF) for the years 2019 to 2026 in red.
These projections may be a little optimistic, suggesting for 2021 the strongest economic recovery in a year as measured since the 1970s. However, by 2026 the IMF projections are back on the slowing track they have been on since 1954. Draw a line between the 1954 and 2026 points in the graph to see the direction of travel.

Trend in Western Europe GDP estimated, and projected by the IMF up to the year 2026
Sources of data used to draw the graph, with assistance from Qiujie Shi: Maddison Project Database, version 2018. Jutta Bolt, Robert Inklaar, Herman de Jong and Jan Luiten van Zanden (2018); ; 17 July 2019 2017-2026 data are added using change from 2016 according to IMF estimate of GDP per capita, PPP (constant 2017 international dollars). Data after 2019 are the projections of the IMF.
This graph of Western’s Europe’s GDP begins with a slump in the years immediately after World War Two, and the recovery from that in the early 1950s. Some people imagine that a similar recovery might be possible now, but that is unlikely because we are in a very different context. Europe is not now a shattered continent in which the buildings, homes, and infrastructure urgently needs to be rebuilt, as it was in the early 1950s.
In particular, Western Europe has recently suffered two enormous economic shocks, that of 2008 and that of 2019; but these were shocks that do not result in rebuilding needs, but instead resulted in banks becoming financially unstable and millions of people being furloughed and paid to do nothing. Incidentally, there were large global influenza pandemics in 1957 and from 1968-1970 which may possibly be associated with very slight drops in GDP in the past. All across Europe we behaved very differently when a pandemic struck again in early 2020.
We have hammered the young
All young people in Western Europe born from 1990 onwards have grown up to experience economic turmoil and crashes far in excess of the oil shocks of the 1970s or the recessions of the 1980s and 1990s.
It was partly in reaction to the crash of 2008 that from 2012 onwards (outside of Scotland) older adults decided that the half of young people who go to university should be made to pay enormous fees and 90% of them get into huge debt (parents paid the fees of around 10%). It was because older adults did not trust the young that they “sanctioned” so many of them in 2014 with the most enormous fines ever handed out in British history. Two years on and in 2016 the old (it was mostly the old) voted against the wishes of the young for the UK to leave the EU. I could go on; but hopefully do not need to, as the point has been made – we have hammered the young.
“Just wait,” they say
What older people may now tell younger adults and children is that they need not worry. They say that an economic recovery is coming. They say that there will be good jobs for all in the future; that your student loan debts will not worry you as your future income rises; that somehow homes will become affordable; that being sanctioned so much and having to take so many poorly paid jobs will just become a memory. “Just wait”, they say.
However, waiting would be foolhardy, especially in Britain. A recent House of Commons report of June 2021 has shown that when looking across all of Western Europe it was the UK that has been especially badly hit in the most recent crisis. That does not mean we will have some great “recovery” next.

Comparisons of GDP change in C7 countries
Source: House of Commons Library, Research Briefing: GDP – International Comparisons: Key Economic Indicators, published Friday, 04 June, 2021,
Note: GDP figures are not exactly compatible and so there would be a slight difference is exactly comparable measures were available; but these are the most comparable estimates the House of Commons Library has.
Do not trust future growth
So, what should policies be for the young in Britain? What can be done for those who have seen their interests so badly damaged over the course of the last ten years and whose schooling and employment was deemed to not be a great priority during the pandemic? My answer is that no policy that relies on a promise of future growth should be trusted.
The rate of growth has been slowing for almost 70 years, worldwide but especially in Europe and even more slowly in the UK. Environmentally this may well be a good thing; but it is part of the reason why the young have been penalised.
Unequal society
Within the last forty years the UK has become the most economically unequal state in all of Western Europe by a long margin. The affluent (who were mostly old) wanted to maintain and improve their own living standards, and when there was not enough to go round they did this at the expense of the poor and the young. Future polices should ensure better sharing of what we have, rather than promises to increase the size of the cake.
Even if that were environmentally desirable, which it is not, increasing the size of the cake greatly now is impossible. On 15 January 2015 George Osborne (then the Chancellor of the Exchequer) promised to make the UK the highest GDP/capita large country in the world by 2030. He said this would happen if only people would go along with his economic plan. In hindsight that was an even more ridiculous statement than it appeared to be at the time.
Share today
“Jam tomorrow” has always been the promise made to the young by those who are old and devious. “Share today” should be the reply from here on. Share out the educational debts; share out the costs of supporting yourself when out of work and when in low paid work; share (rather than hoard) the housing; share properly; and share now. Plan to share at the rate that the average Western European state shares its resources. Treat the young at least as well as is normal now in the rest of Western Europe. The alternative is a miserable future for most young people in Britain.
for the original version of this article as first published and a PDF copy click here.
July 1, 2021
Public spending in the UK, and elsewhere in Europe, 1980-2026
For many years the UK, and almost all other states in the world, have been reporting both the amount they spend on public services, and what they expect to spend in future, to the International Monetary Fund (IMF). The three graphs in this article report those figures, first for the UK alone, then for the UK and the four other most populous European countries, and finally for another ten affluent Western European countries. This is to provide a much wider comparison. But first consider the UK alone:

Data Source: International Monetary Fund, World Economic Outlook Database, April 2021, variable GGX_NGDP: General government total expenditure as a proportion of GDP.
Over time public spending in the UK appears to have been rising, and this is true; but it is only true more recently because of two great economic shocks: the banking crisis of 2008 and the pandemic of 2020. Bailing out the banks, increasing and servicing public borrowing, and paying for a huge “moon-shot” track-and-trace system all count as public spending, as well as furlough payments and so much more. Public spending includes the NHS, state education, state pensions, and local government, but also the armed forces and many other outgoings often not thought of as public spending. For example, the rise in the early 2000s in the graph shown here was partly military spending in the UK to pay for the Iraq war.
Public spending in the early 1980s rose as unemployment rose in the great recession of those years when three million people were out of work. Most had to rely almost entirely on state benefits. Spending then fell for the rest of the 1980s as the Conservative government of that decade made cut after cut to health and education spending and tried to privatize as much as it could. Public spending rose in the early 1990s when there was another, smaller, recession, and again a rise in unemployment. It then rose during the “New Labour” years partly as spending on health was improved, but also because of war. However, it was cut extremely deeply after 2010 by a series of Coalition and Conservative governments, who claimed that there was no alternative to deep austerity – until the pandemic hit. Finally, UK public spending is now forecast to be cut at its sharpest level yet in the years to come; and to only remain above 40% by 2026 because of public spending on servicing the increase in public debt. Once that part is taken into account, austerity in the UK is planned to be as great as before the pandemic – according to the figures the government submitted to the IMF – but is now to be enacted in a much shorter time frame: with a cut of more than six percentage points of UK GDP planned for the three years between 2021 and 2024. In contrast, the cut that took place over ten years from 2009 to 2019 was less than six percentage points in total.
What of the rest of Europe? First, consider the other four largest European economies. Apart from when Spain was still emerging from dictatorship and just becoming a democracy, all four have always chosen to spend a higher proportion of their GDP for the public good, on education, housing, health, pensions, welfare and so on (if not quite so much on their militaries). The second graph below shows how the UK’s track record looks in compassion – it is the most miserly and is set to remain so.

Data Source: International Monetary Fund, World Economic Outlook Database, April 2021, variable GGX_NGDP: General government total expenditure as a proportion of GDP.
There was a period in the mid to late 2000s, and especially when Gordon Brown was Chancellor (and then became Prime Minister) when public spending in the UK was almost as high as Spain’s. In 2019 the Labour Party manifesto made spending promises that would have increased public spending to just below German levels, had all those promises been honoured by the end of five years in government. In the event, the Conservative government elected in 2019 was forced to increase public spending levels in the UK to far above the amount Germany had been spending in 2019; but not on things such as improving funding for British state schools to German state school funding levels, or funding the normal activity of the NHS at the level of German public health spending (which is roughly a billion more euros being spent on health each week). Note how all the large European countries increased their public spending as a share of GDP by a remarkably similar amount in 2020; but how they all project slightly different falling trajectories in the projection up to 2026, with the UK sloping steepest downwards.
Finally, is the UK still an outlier when smaller European countries are also included? The last graph of the three shown here adds another ten European countries, also drawn from more affluent Western Europe but not including some of the smallest countries in this region. It is again clear from this graph that the UK has been an outlier, an exception in Europe for many decades. Public spending in the UK has been so low for so long that it is only comparable to Spain’s when it was emerging from dictatorship and just becoming democratic; and to public spending in Greece, but again only as it was becoming a democratic country following the military dictatorship there of 1967-1974. In some of its features the UK has behaved economically like a state that has been largely ruled for the past fifty years by a kind of non-democratic junta that sees public spending on services as something to be suppressed.

Data Source: International Monetary Fund, World Economic Outlook Database, April 2021, variable GGX_NGDP: General government total expenditure as a proportion of GDP.
The final graph above shows that France is not an outlier: Belgium and Finland spend just as much. Similarly Italy is not profligate – it now spends in the same ball-park as Norway, Denmark, Austria, Sweden and Greece. What the graph above also shows is that Germany is, nowadays, a little miserly. However, it is similar to the Netherlands. And Spain, which in most years spends a little less on its public services than Germany, is not dissimilar to its neighbour Portugal. All larger affluent countries in Western Europe have been, and will be spending relatively more on the common good than the United Kingdom.
Public spending levels tend to track taxation. Internationally, those states that tax less, spend less. The majority of the population have poorer quality healthcare, schools and housing. Their universities, railways and water supplies are more often privatized. And their citizens suffer by being less well educated, living with poorer health, and being more often looked down on by those in control. Until the UK is a more democratic state with, for instance, a voting system with proportional representation that truly reflects the will of the people, it is likely that it will remain at the foot of these graphs. However, as that transition to a fuller and more just democracy has eventually happened for every other state shown in the final graph above; it might well be too pessimistic to think that it will never happen in the UK, and in all its regions.
Data Source: International Monetary Fund, World Economic Outlook Database, April 2021, variable GGX_NGDP: General government total expenditure as a proportion of GDP. Note that Switzerland was not included in the comparison because it has an unusually high GDP to public spending ratio due to some global companies being nominally based there / profit repatriated there. It’s public spending on health is amongst the very highest in Europe and yet its overall public spending as a proportion of GDP looks low. There are similar issues in the case sin Ireland, Luxembourg and San Marino.
For a PDF of this article and its original publication on-line click here.
Grim fall in life expectancy exposes UK government’s ‘levelling up’ lies
For a few hours on Wednesday 30 June 2021, a report released by University College London’s Institute of Health Equity hit the headlines. “‘Jaw-dropping’ fall in life expectancy in poor areas of England,” reported The Guardian.
The key statistic in the UCL report was that deaths involving COVID-19 had resulted in life expectancy in the north-west region of England falling by 1.6 years for men and 1.2 years for women. This is around 25% worse than for England as a whole, where life expectancy had fallen by 1.3 years and 0.9 years, for men and women respectively.
Paraphrasing the report’s author, leading public health expert Professor Marmot, the Greater Manchester Health and Social Care Partnership, which commissioned the report, said: “If the government is serious about levelling up health inequities, equity of health and wellbeing must be at the heart of government and business strategy rather than narrow economic goals.”
But that “if” is doing a lot of heavy lifting here. Marmot’s report is especially sceptical of the government’s “levelling up agenda”, highlighting the need for social investment in prevention, health, and care, particularly in poorer areas, and not just a few infrastructure projects.
If you want to see how serious the government is about “levelling up”, just look at how little money it has committed to investing in the ‘Levelling Up Fund’ – and the geographical areas it has picked to benefit. The fund is only £4.6bn, or on average £37m for each local authority targeted to receive it.
It seems obvious that such a scheme should be targeted at the poorest parts of the UK, which also happen to be those worse affected by the pandemic. But instead, one of the criteria that determines if an area is to be awarded money through the Levelling Up Fund is how geographically remote it is. Geographically remote areas can be more affluent areas, and are very often precisely those areas least affected by the pandemic.

A man wears a face mask as he makes his way through Oldham, when the town faced a local lockdown in July 2020 [Phil Noble/Reuters/Alamy]
The Westminster government is talking the talk, but not walking the walk, on levelling up. The figures in Marmot’s latest report – and the personal tragedies behind each one – are terrible. But as Marmot has said before, it’s the longer-term, deeply worrying trends in life expectancy – especially for the poorest – that should demand our attention. These already required drastically different strategies from the government even before COVID hit.
COVID’s impact on life expectancy will not be permanent. Pandemics of this kind always end within a few years, and this one is likely to end a little faster, thanks to the rapid development of vaccines. And it will end first in affluent places such as the UK, where at least nine out of ten adults have some degree of immunity to the disease due to having been vaccinated or having caught the disease, or both.
But before the pandemic hit, as a February 2020 report by Marmot explained, the UK was already experiencing the first falls in life expectancy for 100 years – and these falls were not temporary. In fact, by 2058, one million people will have died earlier than they otherwise would have done, according to research my colleague Stuart Gietel-Basten and I published in 2017 using Office of National Statistics projections. We argued then that these falls were due to the austerity policies pursued after 2010, and the lowering of living standards that accompanied them.
To prevent this far more permanent impact on British life expectancy, we need action to turn the current social, economic and health direction of travel – action that starts now and continues over many years to come.
And as the short-term effects of COVID-19 on mortality rates – hopefully – recede, it’s also worth thinking about how any supposed ‘bouncing back’ in life expectancy might be reported.
In the 16 weeks to 18 June 2021, 5,979 people who died in England and Wales had COVID-19 mentioned on their death certificate. But despite that, overall mortality figures are in fact currently remarkably low: in those 16 weeks in England and Wales, some 9,790 fewer people died of any cause than the average for the same period in 2015-2019.
Writing in The Guardian, Professor David Spiegelhalter and his colleague Anthony Masters explained: “Of the deaths that we are not seeing, many are the shadows of those who were taken early.”
If the current trend within the UK of having both a low COVID death rate and a very low death rate from other causes continues, we may well soon see reports that life expectancy has suddenly ‘shot up’.
But comparing the worst months of a pandemic with the period immediately afterwards is clearly misleading. When life expectancy across the UK is reported to have risen in 2022, or possibly even in the latter half of 2021, the government will try to claim credit. At that point it will be crucial to compare life-expectancy statistics in the UK with that of other European countries and ask – why is ours still so low? And, why has life expectancy in the UK risen so very slowly since its 2014 peak in comparison to everywhere else in Europe?
The inequities and health effects that Professor Marmot has described are largely the product of a ‘devil take the hindmost’ political attitude, which has pervaded the Conservative Party since the 1980s. Many current government ministers, and the prime minister himself, have been – at best – relaxed about inequality since their teenage years in that decade. But it was, of course, the steep rise in inequality in the 1980s, and its persistently high levels ever since, that got us to where we are today – with poorer people and poorer regions so brutally exposed to both this virus and most other causes of preventable death.
Turning the trends around will require real, not fake, commitment, as well as huge effort and probably a great deal of time. I hope I see it happen in my lifetime. I do not expect to see it happen under the current administration.
For the original online version of this article, or a PDF of it, click here.
May 10, 2021
Happiness is a place between too little and too much
School meals are never termed “free” in Finland; they are simply called “lunch”. Alongside Sweden; Finland is one of the very few countries in the world to provide free school meals to all school students from the very beginning of their childhood education until they leave school. Provision to do this was written into Finnish law in 1943 and fully implemented by 1948.
Finland in the 1940s was one of the poorest countries in Europe and had been poor for centuries; but it was by then on a path towards growing social solidarity and the feeding of its children was a part of that. The school meals provision has remained universal ever since. It is hardly remarked upon now – because it is simply sensible. But this is just one of many ways in which this small European country is now considered to excel.
In Finland, just as pupils expect to be provided with a chair and a table to work at, so they and their parents expect there to be food at school as well. It is, of course, almost always more efficient to provide food communally; and not just in term-time.
During the summer holidays, play-schemes in Helsinki provide free noon-time meals for all children under the age of 16. This ensures that none go hungry and also that children can eat together and be treated similarly. Why would you want to stigmatize some children, singling them out to receive food for free? This particular Finnish tradition stretches back to what were originally called playground meals. And they date back to 1942 when wartime food shortages affected the majority of inhabitants of the nation’s capital.

A photograph of Helsinki from above
What began out of necessity slowly became embedded as the norm. Now that three or four generations of Finns have always been fed well at school, it would be unimaginable to take this provision away. In other countries in Europe the argument against providing free school meals for all is the apparent cost to the ‘tax-payer’. The argument against providing meals paid for by the state is often part of a wider argument that the better-off in society need to or deserve to pay less tax.
It is true that some other countries in Europe began to provide free meals for some children earlier than 1942; but almost all these countries still fail to do so universally today. In the UK it is only universal for children in ‘reception’ and school years 1 and 2. Only about half of the children living in relative poverty are so poor that they are also eligible for free school meals in the UK. They are provided to 17% of pupils in England and Scotland, 20% in Wales and 28% in Northern Ireland; those from the lowest-income of all families. In the UK children whose parents receive what is called ‘universal credit’ (welfare benefits) are not eligible for free school meals unless their annual post-tax non-benefit income is also less than £7,500, except in Northern Ireland where the cap is £14,000. This included not being eligible for food vouchers provided by the state when schools were shut during the pandemic of 2020, or in school holidays.
Children in Finland in 2020 will neither go hungry nor feel stigmatized because of the low pay of their parents. The same cannot be said in many others parts of Europe, which is still the world’s richest continent. However, attitudes across Europe are slowly changing towards better appreciating what Finland has achieved, and this is not just when it comes to school meals but in many areas of life.

School breakfast in an elementary school, under the former Finnish educational system. Photograph taken by Hugo Sundström in 1949 or 1950. Used with permission of Helsinki City Museum
The experience of the pandemic might well lead to more change across Europe in some of the directions which Finland embarked on decades ago, but there is opposition to this. There are still a few on the right-wing of politics who at times appear to verge towards the old adage – that hunger is more effective than the overseer’s whip – with the unspoken threat to the less well-off of their or their children’s hunger or homelessness to try to ensure that they take any inadequately paid job on offer; or do work they hate because the consequences for their children are too hard to bare.
An examination of the labour market in Finland reveals that it has the most family friendly arrangements in Europe for flexible working hours. This applies not simply to those who have the most qualification, but also to Finns who leave school with the least qualifications. Comparing the least-skilled, lowest-paid in every country in Europe, the Finns have the most flexibility in when they are required to work. Everyone has greater freedom in Finland.
Finland provides lessons not just for other countries in Europe but also for elsewhere in the world, especially in the affluent world where resources are often greater than in Finland. In the USA, means-tested free school lunches are available to a third of 5–17 year-olds, those who come from families living at or below 130% of the American poverty line. The poverty line is set so low in the USA, many children above it would still be malnourished if they were not fed at school, hence the considerably higher cap. A child whose family have an income a quarter above the official poverty line still qualifies. In addition, a fifth of children in the US also receive a free breakfast at school.
Within the USA policies between different states vary, and New York City public schools have provided free lunch since 2017 for all children, 75% of whom would in any case have qualified because of the very high rates of child poverty in New York. Thus New York in 2017 has achieved what Finland achieved 74 years earlier; what Finland achieved in wartime was similarly achieved at a time of desperation in New York due to the extent of child poverty there. When New York closed it schools in the autumn of 2020 during the pandemic children were at an increased risk of going hungry.
In countries that have not achieved universal provision of goods such as school meals, health care or education, it is often suggested that a combination of private provision and the means-testing of benefits achieves the most efficient allocation of resources. The strongest counter argument to this is that the overall outcome of providing universal services is so good, and has so many wider benefits, that it is foolish not to follow the route taken by Finland given the long term results.
In health Finland now has one of the lowest infant and child mortality rates in the world. This is not because of feeding children for free at school today, but is the aggregate effect of all Finish social policies over many decades, of which school meals are just one tiny element.
In education Finland ranks very highly for how well its children learn at school, for how happy they are, for how skilled they are, for how unlikely they are to later engage in crime and end up in prison and how likely they are to make positive contributions to their society and the world compared to the average European child.
In housing Finland is well known for having the lowest rates of homelessness in Europe. All is not a utopia in Finland and there are increasing complaints over some of the costs of housing, especially in Helsinki. Nevertheless, many Finns also have access to a second home (free-time residence) in the countryside which they can go to during the summer (most are not suitable to live in during the Finnish winter). In much of Europe this would be viewed as a luxury only the wealthy could afford.
Given the overall success of Finland we should not be surprised when Finland repeatedly ranks the highest in the world for happiness. There is an old Finnish proverb – Onnelllisuus on se paikka puuttuvaisuuden ja yltäkylläisyyden välillä – ‘Happiness is a place between too little and too much’. This goes some way to explaining both why people are more content with what they have in Finland than elsewhere and how the Finns went about achieving what they have achieved.
People are happier in Finland as compared to those living in other countries due to a myriad of small differences. Each difference on its own may not appear hugely significant, or only significant at a time when a particular policy is making the headlines, but taken overall these differences, and the effect they have on people, has now resulted in that country ranking first in the world happiness estimates three years in a row.

Table: People who said they were happy most of the time in Europe, 2018
Finland has achieved one of the highest levels of income equality ever measured in the world and Finns are constantly wary of threats to that practically unparalleled gain in equality and the human rights that it enhances. That high level of equality means that schools with tuition fees are exceptionally rare. The few that do exist are often partly state-subsidized, and not educationally superior. The highest performing schools are all free. Regional differences in the quality of schools are very small.
The success of Finland’s education system followed the Basic Education Act passed in 1968. This overhauled a system in which grammar schools, most of which were privately owned and charged fees, were the only route to higher academic education. Arguments in favour of competition and selectivity in education were vociferous, but the reform was passed in parliament with 123 votes for and 68 votes against.
Many European countries became more equal in the 1950s and 1960s. Where Finland differs most is that its people managed to not only hold on to the gains they made then, but have also strengthened many of them since. Its small population and the need for economic growth facilitated reforms and made it harder to accept systems that perpetuated inequality and inefficiency in employment, consumption, and productivity.
It has only been within the last decade that Finns have come to appreciate just what they have achieved, mainly through the increased release of comparative social statistics. For instance, in 2013 a report issued by the OECD’s Programme for International Student Assessment (PISA) indicated that differences among schools in Finland accounted for only 7.7 per cent of variation in student performance, against an OECD average of 42 per cent.
Given how Finland now scores so highly, and that this is becoming more widely known, what is life in Finland like for an immigrant you might ask? Surely more and more people will want to travel to live in such a country as the message is spread? However, few immigrants to Finland will, for instance, speak, read, or write the language before arriving, which can be an impediment in educational and career opportunities as well is in social situations – despite so many Finns being multilingual. While it is true that some Finns are not especially welcoming to immigrants, when the UN measured the happiness of immigrants for the first time in a 2018 report, Finland scored the highest of any country being compared. However, immigrants in Finland were not as happy as the Finns themselves.
In affluent countries, immigrants usually tend to be more optimistic than the locals of their new country. But in Nordic countries, where people’s well-being is generally so high, immigrants are relatively less happy. Whether in Finland this is because immigrants find it harder to fit into in a society that is so socially cohesive, or just in comparison to the happiness particularly of poorer Finns, is not yet known. Finland accepted 40% of asylum seekers applying to live there over the past 10 years. The current government pursues a pro-immigration policy with many practical measures because of the positive impact of immigration on Finland’s economy. And, of course, any EU citizen has the right to live, work and study in Finland.
Finland is not Utopia and its people are well aware that there is much that could still be better. There is increasing activism and research on racism in Finland and on discrimination that is perpetuated through institutions and policies. A recent Non-Discrimination Ombudsman’s report concerning people of African descent in Finland documented racialized guidance disproportionately encouraging girls to pursue careers in care services and an unnecessary concentration of particular ethnicities in classes for Finnish as a second language.
Overall, people in Finland also know that they live under a flexible system in a pragmatic country that will permit better ways to be found and further improvements to be made. Knowing that things are likely to get better, especially for the less well-off, is often more important than how the situation is today.
People will always worry, but we also need to be able to hope. Finland’s recent history can give us all hope. On 20 March 2020 it was announced – for the third year in succession – that Finland was once again the happiest country in the world. The world happiness report in which this was declared included a chapter dedicated to the Nordic countries which concluded: “…there seems to be no secret sauce specific to Nordic happiness that is unavailable to others. There is rather a more general recipe for creating highly satisfied citizens: Ensure that state institutions are of high quality, non-corrupt, able to deliver what they promise, and generous in taking care of citizens in various adversities”.
As we have tried to hint at in this article, Finland excels at much more than just happiness;, the Nordic and in particular the Finnish model works well in practice across the board. It urgently needs to be made more widely available; but it is a recipe that requires slow cooking. Finland introduced school meals for all and food in holiday times a human lifetime ago; it was only much later that it reaped the multiple rewards of its approach.
This article is based on the book ‘Finntopia – what we can learn from the world’s happiest country.
For a link to the original posting of this article (by Danny Dorling and Annika Koljonen) and a PDF click here.
© EBR Media Ltd, 2021. The definitive, and edited version of this article is published in The World Financial Review March/April 2021 www.worldfinancialreview.com
April 28, 2021
The Income Shock of 2020
The pandemic had an almost immediate and massive detrimental economic effect on the lives of the already worst-off in the UK, especially for younger adults in precarious employment and, also disproportionately people of black and minority ethnicity had to more often borrow money to get by. However what was of overwhelming importance in determining who was most badly hit economically was whether a person already lived in a household that was rich, average, or poor.
A study published in January 2021 spelt out what had occurred in detail using figures of income carefully adjusted for the size of each household and the number of children in it, after taxes and including benefits. It showed that the average income of people living in the poorest fifth of households (lowest quintile) in the UK fell from £287 a week in February 2020 to £228 a week by May 2020. This fall, of over twenty percent, was larger than for any other quintile group and resulted in a huge and sudden widening of the gap between the best-off and worse-off quintile (fifth), which has probably not narrowed since then.
In contrast to what people in the poorest fifth of households, the best-off fifth received on average £765 a week in May 2020. However, the best-off had still seen an average fall of 11% in their income since February. Although only half the percentage fall of the poorest households – it will still have often felt like a great fall in income to them.
Each income quintile became less well off, but the gap between the haves and have-nots widened and this widening occurred despite a slight increase in welfare benefits for the poorest. The same study which revealed this huge and sudden increase in the already wide gulf between the best- and worst-off also revealed particularly acutely affected groups.
Within the poorest quintile of the population, roughly 13 million people, the quarter who had fared worst had lost 60% or more of their income in these two months, that was 3.3 million people in UK households which lost at least £172 a week. In contrast, the very best-off quarter of the already best-off quintile had seen their income actually rise by 8% or more over the same period; at least £69 more a week for the economically most fortunate 3.3 million people in the UK. The few economic winners from the pandemic were almost all people who were already very well-off.
At the most extreme, a tiny number became dramatically richer in 2020 by wining government contracts that were not properly put out to tender. As the BBC reported, among many other scandals: ‘The government has also been accused of favouring firms with political connections to the Conservative Party with a “high-priority lane”.’ However, most winners will have just been already well-off people who were able to take advantage of some aspect of the crisis. What matters is that it was mostly only a few people, from among the best-off fifth, who were best-placed to do this.
Other inequalities may have narrowed as the class gap widened. Men earned 9% more than women in February 2020, that gap fell to only 5% by May as more men saw bigger pay cuts, partly due to being furloughed more often. People who were of black and minority ethnicity were, on average, 27% less well off than those that were white in February – but that gap had also fallen, to 25%, by May 2020.
By May 2020 there was a 5% gap between the incomes of men and women and 25% between white and BAME groups. However, the income gap between the lowest income fifth and the highest income fifth by households was much higher: 235%, up from 200% in February. This is the social class gap.
Your fortunes depend most on your social class, what kind of job you have or whether you do not have a job. Whether you are male of female has an impact, but it is small compared to class and it shrank as the crisis unfolded, despite the fact that women are more likely to be in jobs that are lowly paid, or not in work if a single parent of a young child. In May 2020 men in the UK were receiving on average £490 a week and women £467; but two months earlier those numbers had been £573 and £526 respectively.
The fact that the gender pay gap narrowed while the social class gap widened is because more men could be sacked or furloughed on 80% of their normal pay. This was slightly less likely for women because more women were doing work that had to continue. One very obvious example was working in health and care services, where women dominate.
The same pattern seen for women was also seen for individuals of black and minority ethnicity: their incomes were lower before the crisis began, fell during the crisis, but did not fall as much as for others. By May 2020 social class was 9.4 times more important than ethnicity in influencing income (235/25); before the crisis that difference had been nearer 7.4 times (200/37). Part of the reason was that people from ethnicity minorities, as with women, are more likely to be key workers.

Source: Table 4 and supplementary material from: Thomas Crossley, Paul Fisher, and Hamish Low (2021)
None of this should be that surprising. Within any ethnic minority group, just as among women, there is huge variation in incomes – whereas within occupation groups or social classes there is much less variation in income. However, what was perhaps unexpected was that the crisis should see the income gaps between men and women and ethnic groups narrow despite the income gaps widening overall.
Despite the overall narrowing of gender inequalities, lone parents – the large majority of whom are women – were especially badly hit. Their average household income was similar to the poorest quintile group. Most lone parents are in this income group, but they are often poorer than the group as a whole. Four out of ten lone-parents had to rely on gifts or loans from relatives at this time; and one in eight on a foodbank (compared to one in twelve for the poorest quintile).
Some 82% of the adults who went to food banks in April or May 2020 were women. Among couples it was almost always the woman who went to the food bank. Some 85% of people who went to food banks were white, a fraction less than the 90% of adults in the UK who are. Two thirds of foodbank users were in the very poorest quintile of income. Virtually none, were from the best-off 40% of households.
Sources
BBC (2021) Timeline: Covid contracts and accusations of ‘chumocracy, March 15th.
Table 4 and supplementary material from: Thomas Crossley, Paul Fisher, and Hamish Low (2021) The heterogeneous and regressive consequences of COVID-19: Evidence from high quality panel data, Journal of Public Economics, Volume 193, January 2021, 104334,
For a PDF of this article and a link to the original publication click here.
April 22, 2021
The City of Oxford and the Pandemic of 2020/21
Within the boundaries of the city of Oxford, for all of 2020, only 95 deaths were registered with COVID-19 being mentioned on the death certificate. It is possible that very early on in the pandemic a few Oxford residents will have died because of the disease, but that was not recognised at the time. However, a possibly similar and also small number of people probably did not die mainly due to the disease despite having it, and it being mentioned on their death certificate. These two sources of error in the official statistics tend to cancel each other out nationally.
Of the 95 residents of the city of Oxford who died directly because of the pandemic in 2020, 46 died in hospital, 30 in care homes, 10 at home and 3 in another communal establishment. In that same year 1,005 people died in total in the city; so 90.5% of the people who died in Oxford city in 2020 did not die because of the pandemic; but from another cause of death. That proportion, of just over nine out of ten deaths in Oxford, compares to 86.8% for England and Wales as a whole, so Oxford experienced a below average pandemic mortality rate in 2020, despite being so close to the epicentre of the pandemic in the UK, and the place which saw the worse rates of all: London. However, the second wave was worse for Oxford than the first.
For residents of the city of Oxford, more died directly due to the pandemic in the first 10 weeks of 2021 than in all of 2020. The number dying then was 102 people (in total) in those first ten weeks of 2021: 65 in hospital, 28 in care homes and 9 at home. As I write (on the last day of March 2021) that number has dropped to zero in week 11. In those first ten weeks of 2021 38.8% of all deaths of Oxford city residents involved COVID-19; this was now above the national proportion at that time which was 34.6%. Oxford suffered similarly to England and Wales overall; but only because wave 2 was worse than wave 1for the city. Wave 2 ended far more abruptly than wave 1, due to vaccination.
If you had been working in a hospital in the city you may think these numbers look low; that was because more died within the city of Oxford, in its hospitals, who were resident elsewhere in the county of Oxfordshire or even further away – so their deaths are not recorded within the statistics for the city. And it may also be because so many people have been ill for each person who has died, some extremely ill. It is data on where most people within Oxford were ill at the height of wave 2 in January 2021 that tells us who was most affected in the city. At that point in time the cases, and hence the deaths, were hugely concentrated among people normally resident in the poorer parts of the city.
The UK Government dashboard produced a map of cases of the disease per 100,000 people living in each area. An inset of that map is shown here, a snapshot taken in January 2021 at the height of wave 2. At that time, three areas of Oxford reported known minimal rates of over 800 per 100,000. The real rates of infection will have been at least three or four times greater than that. The actual rates of disease will have been higher than those reported because only a minority of people ever come forward to be tested – those with bad symptoms or additional worries.

The proportion of people tested positive for COVID19 in each neighbourhood of Oxford in January 2021
As the map shows the areas with the highest number of cases were centred on Barton, Donnington, and a large area stretching from Rose Hill to Greater Leys – all containing parts of the city which have been the poorest in recent decades, parts where overcrowding is highest and where most people have no choice but to work, and work at jobs which cannot be done at home (there is very little unemployment in Oxford). In contrast, in the wealthier enclaves of the city between Jericho and Summertown between 4 and 10+ times fewer people had the disease at this time; and here it was generally far easier to work from home, if not mandated to work at home by many of these peoples’ employers.

Oxford City: people testing positive for COVID19 by age and week 2020/21
One question people may ask is whether there is any evidence that having a large group of students in residence at the two universities in Oxford had an influence. The heat diagrams shown below are probably the best evidence we have to suggest they did not. So although there was a rise in cases among the student-aged population in October and November 2020 it did not spread into older groups then. Similarly in Cambridge; but the pattern for Milton Keynes, an urban centre of similar size and distance from London but without a large student population, is very different.

Cambridge City: people testing positive for COVID19 by age and week 2020/21
In Milton Keynes rates rose slowly in late September and October among young adults and that increase slowly spread to older and older groups in the population. When the new “Kent” variant arrived in December 2020, there was a sudden and accelerated increase. Much the same happened in Oxford and Cambridge at the very same time, but earlier – in late November and early December there were very low cases in the two ancient university cities. Whatever risk students returning to the city in October may have brought with them had largely dissipated.

Milton Keynes: people testing positive for COVID19 by age and week 2020/21
It looks as if there was very little connection between infections among students, which rose in the autumn and then fell in early winter, and cases among locals – which rose later. For once, the invisible but very real wall between town and gown may have been beneficial. It is a form of quarantine. If we were in any way a normal university town where more students lived at home with their parents, and far more lived out in the community, then the city of Oxford may have suffered a higher mortality rate. This is not a general argument for the benefits of cloistered, anachronistic and bizarre traditions and social divisions – merely an observation that very occasionally, as in autumn 2020, it is actually possible to point out a positive aspect to the caste/class system of this city.
For a PDF of this article and a link to where it was first published click here.
March 19, 2021
Census 2021 will reveal how a year of lockdowns and furlough has transformed the UK
 The 2021 census will help show the changes wrought by a year of COVID-19.
K303/Shutterstock
Danny Dorling, University of Oxford
Many people may feel unsure as to whether the English, Welsh and Northern Irish census of 2021 should be going ahead, given that it’s occurring during a pandemic when many aspects of our lives are far from normal. The census has actually been postponed by a year in Scotland due to these concerns.
Census timing has appeared unfortunate before. The 2001 census took place during the peak of the foot and mouth disease outbreak, amid concerns that census officials might spread the disease between farms.
Because most people will fill in their 2021 census form online, disease transmission is less of a concern this year. But there’s another criticism levelled at censuses: that they only ever deliver a snapshot of a population at a specific time, no matter how unusual or temporary the circumstances within a household may be.
There are worries that the 2021 census will capture a particularly distorted snapshot of a country transformed by the pandemic. It’ll capture young adults temporarily ensconced in parents’ homes, thousands of mainland Europeans who had planned to leave but are temporarily trapped in the UK by lockdown rules, and millions of furloughed workers counted as employed despite the real possibility that they’re soon to lose their jobs.
However, there’s a strong argument in favour of holding the census now – precisely because so much has changed. The 2021 census won’t just capture a unique time in our history; it’s also the best way to show which areas and demographics have been newly disadvantaged by the pandemic, helping direct public funds and services to where they’re needed the most.
Why hold a census?
Without the census, held every ten years in the UK, local government would know very little about the composition of the population it currently serves. Officials wouldn’t know which areas were falling behind others, which homes were lying empty, or which families were living in cramped and unsafe conditions.
Census data like these underpin the fair allocation of public finances, revealing the areas and even the postcodes most in need of support. Plus, the census saves the taxpayer money: even the crudest estimate of the value of the census shows that running one every ten years saves £500 million annually in administrative costs.
Previous censuses have been instrumental in improving lives across the country. As Britain built back from 1950s austerity, an extra 1966 census was squeezed between those taken in 1961 and 1971 to help guide the urgent investments of the government of the day.
Censuses also expose hidden inequalities. The 2001 census was the last to ask which floor of a block of flats families lived on, revealing that most children living above the fifth floor in England weren’t white. That fact meant a great deal more after the 2017 Grenfell tragedy.
[image error]Census 2021 comes at a unique time for the UK – which is what makes it so important.
Ink Drop/ShutterstockCensus 2021
The 2021 census is not an ambitious census. The number of rooms (other than bedrooms) in a home is no longer asked, as it has been since 1911 (when questions about being deaf and dumb, blind, a lunatic, or an imbecile were dropped). That means we’ll no longer know how overcrowded the worst-housed tenth of the population of England and Wales are when compared to the best-off tenth – who had five times as many rooms per person in 2011.
The 2021 census will only ask one new question: whether someone has ever served in the UK armed forces. This could be useful in understanding the links between ex-service people and homelessness. The only other change is that sexual orientation and gender identity have been assigned more categories.
But this census will nonetheless bestow much-needed clarity on a society buffeted by the pandemic. Uncertainty about how many people are actually living in the UK right now – let alone where exactly they live – is higher this year than it has been for many decades. It’s thought that over a million people left the country in 2020 who would not normally have left, but we don’t know how many really did and if they left for good. This has serious implications for the allocation of funding across regions.
More importantly still, the 2021 census will provide a clearer picture of the inequalities that have come to light since the beginning of the pandemic. The isolation of the elderly, the suffering in old industrial wards, and the disproportionate impact of COVID-19 on BAME communities will all be better illustrated and contextualised by this census.
In February 2020, just weeks before the start of the pandemic, the BBC ran a story suggesting that the 2021 census could be the last census. In hindsight, that seems ludicrous: now more than ever, we need the census to tell us even the most basic of facts about our society. Perhaps the pandemic will bring us to our senses when it comes to the value of a census.
I’d argue we go even further, adding an extra census in 2026 which will adequately reflect the damage done by the pandemic, and how equitable the UK’s recovery will look a half-decade hence. The pandemic has forced people online, making a largely online census, held every five years, far more feasible and less expensive. Perhaps we should even start to ask household income in our censuses, as they do in the US, to further enrich our data on inequality across the country.
Official statistics like the census are not just for governments but for all of us. Crucially, census data helps us to assess the performance of government. As the UK looks to “build back better” after the pandemic, we’ll be able to look to the 2021 census to judge whether new policies tackle inequalities in the regions that need the most help.
Danny Dorling, Halford Mackinder Professor of Geography, University of Oxford
This article is republished from The Conversation under a Creative Commons license. Read the original article.
For a PDF of this article and link to the original posting click here.
March 14, 2021
If Boris Johnson is serious about levelling up, he would plan for a 2026 census now
An extra population survey, on top of next week’s, would provide information the country really needs.

The 2021 census logo
without information about people’s lives, how can we know their needs?
First posted Sun 14 Mar 2021 09.30 GMT
The 2021 census is being held on Sunday 21 March – online. You may have already received your code through the post. You may have completed your census return, as you can do that early. You may have requested a paper form. Or you may have put it all aside.
Don’t worry about people not filling in the census form: 30,000 field officers will start knocking on the doors of those who have missed the count in April. On top of that, a census coverage survey of 350,000 households is planned. The methodology for this is a refined version of the “capture-recapture” technique for estimating the number of whales in the ocean.
A more serious concern is that the outsourcing of part of the census operation to a private company will cause problems. Sadly, we are stuck with a government that mandates the involvement of the private sector where it is not beneficial. However, knocking on doors (and stepping back 2 metres) in the weeks after 21 March is not going to be the hardest thing in the world to get right. It is not hard to enumerate a population still mostly locked down.
The most serious concern will be that it will be a snapshot of a strange, unrepresentative time, an image of pandemic Britain where young adults have temporarily moved in with their parents. It will record a place with low street homelessness, at the tail end of the “Everyone In” campaign. It will miss Scotland, as the census is being taken in a year’s time there. It will include hundreds of thousands of people just waiting to travel back to mainland Europe (for good), prevented by travel restrictions but ready to join the million who (we think) left in 2020. And it will count as employed those currently furloughed, but who will not be returning to work.
It will be a snapshot of a strange, unrepresentative time, an image of pandemic Britain.
What can be done to fix this? In the early 1960s, it was decided that an extra 1966 census was needed for the planning required to “build back better” from 1950s austerity. It was the precursor to the most comprehensive census of all time, held in 1971. This census told us who had hot running water in their kitchen sink and where housing need was most acute. Since those times, censuses have been cut back in scope. The 2001 census was the last one to ask what floor level a family lived on in a block of flats, allowing us to know that the majority of children in England above the fifth floor were not white, a fact that meant a great deal more after the Grenfell tragedy than before it.
A 2026 census could be used to ascertain if any local levelling up has occurred overall. To date, we have seen levelling down, because of the way the government has dealt with the pandemic. A 2026 census could assess how much we have recovered – or not – in the five years from March 2021. It would fill the gaps in the record. A government that was serious about levelling up, as the 1960s governments were, would plan for a 2026 census now.
For a PDF of this article and a link to where it was first published click here.
March 4, 2021
Why has the UK’s COVID death toll been so high? Inequality may have played a role
The first death to be publicly attributed to coronavirus in the UK was of a woman in her seventies on March 5 2020. The same day, a spokesperson for the prime minister, Boris Johnson, warned the virus could spread in “a significant way” in the UK.

March 4th, 2021, published in ‘The Conversation’
On March 16 2020, a group of 30 scientists concluded: “In an unmitigated epidemic, we would predict approximately 510,000 deaths.” At the time, this prediction was greeted with some incredulity. In hindsight, more than 120,000 deaths later, it appears less outlandish, although we will never know what would have happened in an unmitigated scenario because the UK did act to control the epidemic.
Internationally, mitigation measures have ranged from social distancing and isolating, to the most extreme of lockdowns. The debate about which measures of protection have been most effective, and which may cause more harm than good, has often been acrimonious.
Acrimony has often occurred when a relatively new disease arrives in the UK. As one of the founders of epidemiology, John Snow, said in 1853 during the middle of the 19th-century cholera epidemics:
The question of contagion in various diseases has often been discussed with a degree of acrimony that is unusual in medical or other scientific inquiries. The cause of the warmth of feeling that has been displayed has, in most cases, probably been unknown to the disputants. It is the great pecuniary interests involved in the question, on account of its connection with quarantine.
Looking back, we can now see that the pecuniary interests in 2020 were the interests of businesses that were shut down during lockdown, the interests of the government in maintaining an economy of the type they favoured, and the interests of the many individuals who personally suffered financially.
These individuals included 4 million people who lost income, but for various reasons were excluded from any of the government income support schemes. Since the beginning of the pandemic, some 1.8 million UK adults lost at least a third of their income with no resort to benefits or help of any kind. Many in this group now struggle to pay for food and everyday essentials – some will be starving.
We need to now start admitting and correcting some of the worst mistakes made. Too many people were unprotected not just from the disease, but also from the policies implemented to contain it.
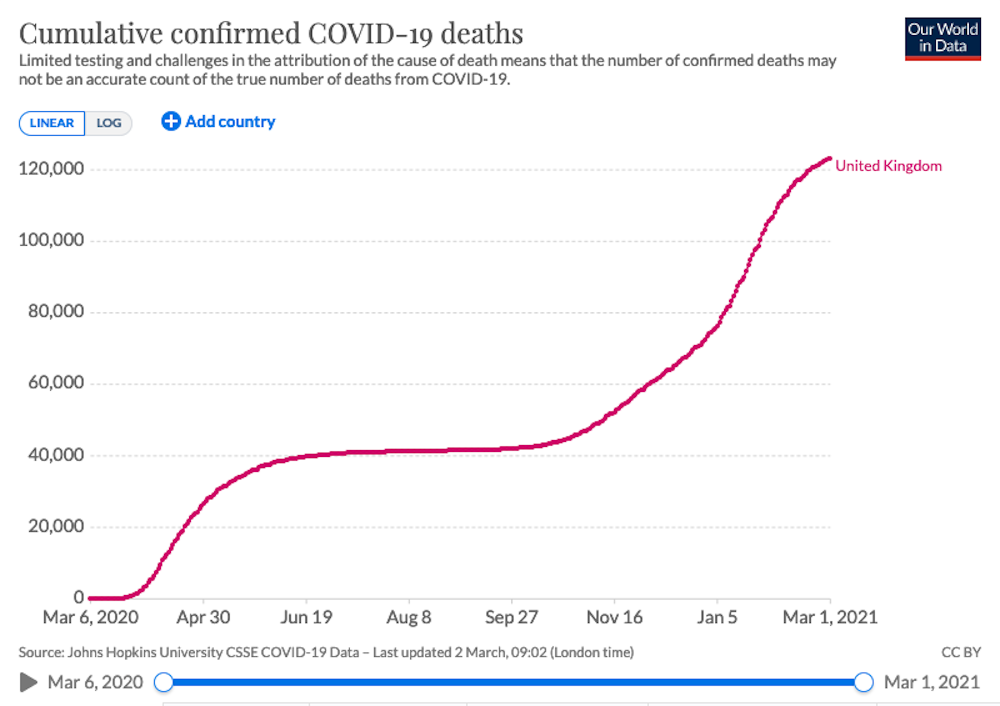 Our World in Data, CC BY
Long-term consequences
A year on from the first officially recorded death with COVID-19, we know the current death toll, but we have little idea what the long-term health consequences will be.
However, some things are becoming more clear. One summary of the past year published in the BMJ is particularly damning. It explains that many of the policies that had been adopted in the UK – not least the closure of schools for the majority of children for so many months – has meant that, “This pandemic has seen an unprecedented intergenerational transfer of harm and costs from elderly socioeconomically privileged people to disadvantaged children.”
The protection of elderly people (in the way that we chose to do it) was also more effective in protecting those who are more affluent and was often done at the expense of poorer families, and their children, who were both far less protected from the disease and far more hurt financially.
Others may say that the countries of the UK had little option but to close schools for so long to try to control the disease. But the UK still reported the worst pandemic outcome of any large country in the world over a year on. Of all the countries with more than 12 million people, the UK had the highest crude pandemic mortality rate by the start of March 2021: 18 people had died of the disease for every 10,000 alive at the start of the year.
Why was the UK death toll so high? Ironically, it might have been much higher had austerity not stalled improvements to public health, which researchers have estimated led to 131,000 preventable deaths, again largely of the elderly, but between 2012 and 2019.
One reason the 2020 toll was still so high is that the disease was able to spread across the whole of the UK before it was widely realised it had. We now know that there had been many deaths within the UK attributable to the disease before March 2020 and that it had been spreading across the four countries of the UK for many weeks before that first recorded death. On January 30 2020, a man in his eighties in Kent died of COVID-19 exactly five weeks earlier than the woman in her seventies mentioned at the very start of this article.
A second possible reason as to why the death toll was so high is that the UK has become one of the most economically unequal countries in Europe by income.
Another early epidemiologist, William Budd, who was working alongside John Snow in the middle of the 19th century understood the role epidemics played in exacerbating inequality.
In 1849, Budd explained:
How important it is – even in regard to their own interests – for the Rich to attend to the physical wants of the Poor. To do this is one of our first and plainest duties. The duty itself we may evade, but we cannot evade the sure penalties of its neglect. By reason of our common humanity, we are all more nearly related here than we are apt to think. The members of the great human family are, in fact, bound together by a thousand secret ties, of whose existence the world in general little dreams. And he that was never yet connected with his poorer neighbour by deeds of Charity or Love, may one day find, when it is too late, that he is connected with him by a bond which may bring them both, at once, to a common grave.
Vaccines are being rolled out, deaths are falling, but enormous damage has been done. A year on we still do not have a good test, trace and isolate programme – at a time when many cannot afford to isolate.
The UK’s approach was not, in hindsight, the right response. Ranking so badly internationally tells us that. But it does not tell us the extent to which our prior circumstances were so bad in the UK that we were doomed to have a poor outcome – or to what degree we made an already bad situation worse.
Danny Dorling, Halford Mackinder Professor of Geography, University of Oxford
This article is republished from The Conversation under a Creative Commons license. Read the original article.
for a PDF of this article click here.
Danny Dorling's Blog

- Danny Dorling's profile
- 96 followers

