
Danny Dorling's Blog, page 4
June 4, 2024
Review of The Road to Freedom: Economics and the Good Society by Joseph E. Stiglitz and published by Allen Lane
In The Road to Freedom, Joseph Stiglitz considers the relationship between capitalism and freedom, evaluating democracy, economics and what constitutes a good society. According to Danny Dorling, the book’s lack of a coherent structure and an outline of what measures could enable a more free and equal society will leave many readers wanting.
Joseph Stiglitz has a message, and it’s worth listening to. It is that humans are not selfish. Or to be a little more precise, they’re “ …not as selfish as the Right claim” (82). That is the central point of his valedictory volume The Road to Freedom, titled with a pun on Hayek’s 1944 The Road to Serfdom. Published almost exactly 80 years later, this new book is intended as the long-awaited counterargument to emerge from within the centre of the discipline of economics. But in this endeavour, it disappoints.
Stiglitz’s argument in The Road to Freedom is that right-wing economists are “almost poisonous”, by which he means that often that his opponents make malicious arguments such as to suggest that poor children have chosen the wrong parents (83). He reiterates his long-held claim (and obvious truism) that, both in the past and today, “markets were, in fact, not efficient; that … in general the economy is inefficient.” (78-79, emphasis in the original). It is admirable that Stiglitz battles on trying to explain this to those of his readers who have unevidenced faith in “market efficiency”. However, what alternative is he offering them?
It is admirable that Stiglitz battles on trying to explain this to those of his readers who have unevidenced faith in ‘market efficiency’. However, what alternative is he offering them?
The book is mostly about one man’s “lifetime of scholarship” at places including Columbia, Harvard, Yale and Oxford (295-297). It is more that, than a set of new ideas. According to the author, this scholarship extends the work of John Stuart Mill, Friedrich Hayek, Milton Friedman, Antonio Gramsci, Thomas Hobbs, Adam Smith, Karl Marx, Charles Darwin, John Keynes, and John Galbraith (the most mentioned ten, xv-xviii, 22, 23, 25, 87, 131). We do learn that his next book, being written now with colleagues, is to be titled The Other Invisible Hand (154). Presumably this will be an elaboration on his previous comments arguing that most people are not as selfish as most economists are.
So why was this book published? The key reason is because of who its author is. Joseph Stiglitz is currently professor of economics and finance at Columbia University. He was the winner of the 2001 Nobel Prize in economics, and is the author of many other books, notably Globalization and its Discontents (2002). He was formerly chairman of the council of economic advisers to President Clinton and the chief economist at the World Bank from 1997 to1999; (He left the World Bank after having been outspoken in his criticism of the US’s approach to the Asian financial crisis).
In 2011 Time Magazine ranked Stiglitz among the 100 most influential people in the world, and the (then recently departed from office) British Prime Minster Gordon Brown suggested that he “…got the Asian crisis right, foresaw the bubble that caused such havoc in 2008 and is advocating global answers to a host of problems that can no longer be solved at the local or national level […] his work goes on challenging us all to rethink our ideas, he will always be a controversialist wherever he goes.”
In 2024 ScholarGPS ranked Stiglitz as the world’s most productive social scientist in terms of the “profound impact” (his citations) and the quality (his h-index) of his publications. However, the Scholar GPS ranking does seem a little biased towards the works of white men in the whiter parts of the west, Stiglitz included.
But what are Stiglitz’s priorities as an intellectual today? He explains: “The most important example of a global public good is protecting the world from climate change” (83). Much in the book takes this tone: pronouncements from on high that erase the more pressing concerns of those who live without basic needs being met today, such as safety, shelter and food.
The book lacks a global outlook and substantive depth to its enquiry.
The book lacks a global outlook and substantive depth to its enquiry. There are only a very few references to places other than the US (or to Oxford in England). Stiglitz claims that Finns like paying tax (82), but he does not suggest why. He chastises the French for “…continu[ing] to contribute to global warming unabated” (68) after a tax on diesel use was not implemented; but does not set it in context, for instance, by comparing France’s decarbonisation policy record to that of the US. He suggests that economic growth in China has nothing to do with communism (209) without explaining why. It is hard to imagine China having had such a highly coordinated economy and such determined long-term economic planning without communism.
The book concludes by suggesting that “we can do much better than the current form of capitalism” (277) and that we need a new global economic architecture. As a reader, it is somewhat frustrating to wade through hundreds of pages only to discover that: “This is not the place to delve into what that architecture would fully look like.” (260). Clearly, he is not suggesting that other countries copy China. So, what is Stiglitz advocating, other than a little more kindness and humanity? There are many economies in Europe and elsewhere (such as Austria, Belgium, Canada, Denmark, Estonia, Finland, Germany, Hungary, Ireland, and Japan) that have, by historic standards, achieved high levels of economic equality which he could have suggested as models for the future of the US; however, perhaps to do so would appear unpatriotic.
The primary purpose of the book, then, remains vague. Stiglitz writes that “we don’t have to answer the question of what every possible good society might look like. We begin where we are. We respect honesty, kindness, other-regardingness, cooperativeness, and empathy. We dislike suffering and deprivations, injustices, and so forth” (213). But the book suffers from not being grounded in a proper examination of at least one different society and its current trajectory or alternative future, and how that currently differs from the US.
There is little new to be learned from this book by economists or students of economics […] a more general audience may gain insight from its analysis of right-wing economists.
There is little new to be learned from this book by economists or students of economics. Compelling insights – such as the fact that in the US, unlike in most countries, resources below land are not owned by the state (109) – are few and far between. That said, a more general audience may gain insight from its analysis of right-wing economists. If intended for general readers, however, its broad-stroke approach is undercut by the book’s lack of a clear and logical structure. Instead, it takes a stream-of-consciousness approach that is difficult to follow and belies the structured approach (of three parts and distinct chapters) indicated in the table of contents. Beyond that, the book’s referencing is severely wanting. it is in several places unconvincing (such as where it just suggests that all that is needed is a little more humanity), vague (see note 17 on page 319) and often self-indulgent (see notes 18, 19 and 20 on 322).
Admittedly, economics appears today to be only just able to begin to take tiny steps out of the mess the discipline is in; at least the kind of economics that still dominates university departments in the US and UK. Students of economics worldwide have rebelled against the orthodox teachings of the old men at the top of the discipline in declining western countries. They have called for more heterodox views to be included in their syllabi. As yet, at least in the most elite of academic institutions, these calls have been largely ignored.
This is not Stigltiz at his finest, and it reflects a hollowness to the so-called international debate, which is currently presented as mainly being held within US Universities.
This is a book that might look good on your shelf. Friends and visitors may be impressed by the literary company you keep. But this is not Stiglitz at his finest, and it reflects a hollowness to the so-called international debate, which is currently presented as mainly being held within US Universities. An observer viewing the debate that Stiglitz is part of, where he has to spend so much of his time and so many words in this book countering free-market maniacs, might conclude that by the year 2024, there is still no road to freedom in sight.
Note: This review gives the views of the author, and not the position of the LSE Review of Books blog, or of the London School of Economics and Political Science. [ Danny Dorling is a professor in the School of Geography and the Environment at the University of Oxford, and a Fellow of St Peter’s College. He is a patron of RoadPeace, Comprehensive Future, and Heeley City Farm. In his spare time, he makes sandcastles.]
Posted In: Book Reviews | Economics | LSE Event | Politics
For a PDF of this article and link to where it was first published click here.

Image credit: Daniel Avram on Shutterstock.


May 6, 2024
Visualising the 2020s UK cost-of-living crisis
This article is unusual in that it provides a graphical summary of various aspects of the longer-term crisis that appeared to cumulate in 2022 through to at least early 2024 in terms of especially poor economic and social outcomes for the UK. The article was submitted for consideration in a special issue in the Journal of Social Policy and Administration on diverse perspectives and innovative approaches to addressing the cost of living crisis. This special issues focuses on areas such as financial insecurity, inequalities, food insecurity, food access, policy analysis and the variety of responses there have been. This articles highlights the significant challenges posed by the cost of living crisis in the United Kingdom—the widespread impact on poverty rates, health and well-being, food insecurity, inequality, and social justice. It does so by presenting a series of images that were mostly produced but not used in print to illustrate the book ‘Shattered Nation’ (Dorling, 2023). These 23 images were not included in the book, but most were posted on the book website. A few are more recent.
1 INTRODUCTION
The UK was a remarkably equitable group of countries in the 1960s and early 1970s (Figure 1). Of all large European countries, only Sweden had lower income inequalities at that time, although you would need to look at data for Sweden to confirm that, as well as for many other countries (Dorling, 2017). England, Scotland, Wales and Northern Ireland were all, essential ‘Nordic’ in terms of the gaps between what different groups had to rely on day by day. Wealth inequalities may have been larger, there was still a relic class system with odd British features such as private schools. However, most of those schools only survived though the 1970s and into the 1980s because the state funded what were called ‘assisted places’. That funding came to an end in 1997, but state assistance for private education was not needed after income inequalities rose in the 1980s.
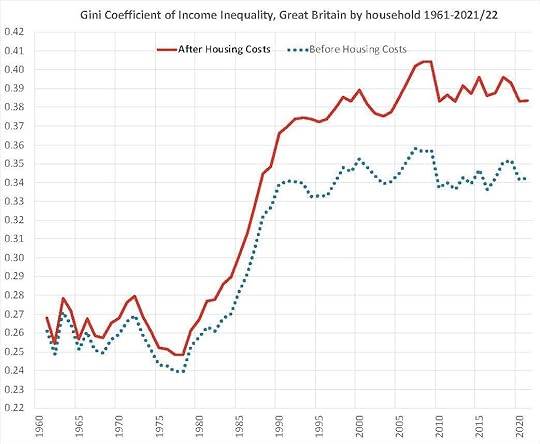
Figure 1: The antecedents of the cost of living crisis. Source: IFS (2024).
The rich could pay their way again. The UK is an international outlier when it comes to just how much money is spent on its private schools. Even the USA spends much less. Only Chile, among all OECD countries, spends nearly as much on such a small proportion of children as regards their secondary education. We will return to Chile and what is currently happening there to deal with the global cost-of-living crisis at the end of this short article.
The huge inequality that the UK lives with in terms from how its children are schooled through to what old age is like for different social groups is only made possible because the UK maintains such high levels of income inequality (Dorling, 2023). This all helps to perpetuate the UK as a state in which children live parallel lives and income inequalities are often justified as apparently giving the most to those who ‘deserve’ the most.
Those seen as most deserving of the most money in the UK usually did not even go to school with the rest of their contemporaries when they were children. One result of this is very high levels of child poverty being suffered in the UK, levels that are now rising faster than in any other country in Europe and possibly faster than in any that is measured in these ways worldwide. Figure 2, shown next, should have shocked people in the UK when it was released; but we had become used to such bad news.

Figure 2: The rise of child poverty in the UK. Source: UNICEF (2023).
Nevertheless, to stand out so distinctly in the most authoritative of international comparisons of trends in child poverty is truly shocking. There is nowhere else in the rich world which is quite as extreme as the UK in terms of how we are willing to allow children here to suffer. I could have included a series of images in these pages that would shock you even more, of the living conditions of many children today in the UK—pictures of their homes. But, because we are social scientists, we instead draw graphs and produce tables of figures. Please note that unlike any of the other states shown to have tolerated increases in child poverty in Figure 2, the UK already tolerated a very high rate of child poverty before the huge increase occured most recently.
In December 2023, the United Nations released data showing that the UK had presided over the greatest rise in child poverty of any nation that it monitored in detail. That most recent rise began under the coalition government of 2010–2015 which was an alliance of the Conservative party and the Liberal Democrats. The moniker ‘Tories who dislike conflict’ is occasionally used to mock British Liberals. One newspaper columnist in 2022 describe British Liberals thus: ‘Because their creed puts such stress on reason, it attracts those who are hopeless at conflict: at the recognition of its frequent necessity, and at the actual waging of it’ (Ganesh, 2022). Figure 2 shows that it is possible to have a great rise in child poverty while income inequality rates remain broadly stable but is also very high. This is partly because of the current nature of the is a cost-of-living-crisis; but mostly due to the legacy of a New Labour government that did not bring down inequality, a Conservative party that sees inequalities as good, and a Liberal party that is very similar to both of the other two main English political parties.
Long before 2010 the UK had become established as by far the most unequal large country in Europe. Only Turkey, on the very edge of the continent, and nearby Bulgaria had higher income inequality in later years (Figure 3). After 2015, income inequalities were falling, slightly, in more countries in Europe than they were rising; but in 2018 and 2019 income inequalities in the UK were even higher than they had been in the whole period since 2010. Austerity had been accompanied by rising inequality. This was the context in which the early 2020s cost of living crisis struck.

Figure 3:The most and least unequal countries in Europe. Source: OECD income inequality figures as provided in 2023.
2 FALLING INCOMES AND LOW PUBLIC SPENDING
The public sector workforce within the UK was decimated three times over between 1992 and 2021 (Figure 4). The state lost a tenth of its workforce thrice over as a result of public sector job cuts when these were measured in proportion to the number of all employees in the UK. When the cost-of-living crisis struck with rising prices in 2021 and 2022 there were far fewer public sector workers left to help. A decimation is cut of a tenth which can be seen in the figure to have occurred after 1993, after 2005, and most of all after 2009/2014—in fact the cuts are deeper than that, but the overall fall from 23% to 17% amounts to three decimations.
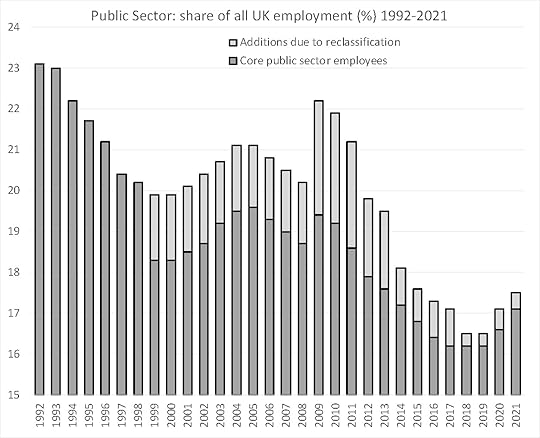
Figure 4: The repeated decimation of the UK public sector. Source: Dorling (2022).
State spending on public services, which includes defence and war spending, did not fall in the same way, or as fast, as public sector jobs were cut. The state increasingly spent its money on the private sector and on out-sourced services and so public sector spending as a whole rose during the period shown in Figure 4, despite public sector jobs falling. Public spending also includes spending on state pensions and there were more pensioners, and it also includes spending on health, which rose at some points, but only because there were more old and frail folk – not due to any actual real improvements in service.
Figure 5 includes the estimates that governments report to the IMF on how much spending they intent to make in future, alongside their past actual record on spending. It does not include Ireland or Switzerland as their reported Gross National Products (GDP) are artificially inflated by US firms in the case of Ireland, and the pharmaceutical industries of Switzerland make it look, superficially, as if the Swiss have a smaller public sector than is the case.

Figure 5: Public sector spending in Europe 1980–2026. Source: Dorling (2021).
Note that in all European countries’ public spending increased greatly when the banks had to be bailed out by each state in 2008; but by more in the UK than in most other countries because the UK banking sector was, at that time, so large. Note also that the onset of the pandemic in 2020 had an even bigger effect on increasing public spending. It is because the red (UK) line in Figure 5 was so high in 2023 that people in the UK were said to be being taxed so much in that year as compared to the past few decades, but they were being taxed far less than were people living in almost all other European countries. Give or take borrowing, public spending as a proportion of GDP roughly equates to taxation as a proportion of GDP…… (paper continues… through to figure number 23)
For the full paper and a link to where it was originally published click here.
April 26, 2024
Contrasting Child Poverty in Finland and England in 2024
On 21 March 2024 the latest official poverty statistics for the UK were released. They mostly reflect the situation in England. These numbers are released at this time every year, but this time was shocking. The headline in the Financial Times that day was ‘Fastest rise in UK child poverty for 30 years’. As comparable statistics only began to be recorded thirty years ago, the rise may have been the fastest ever rise in child poverty in one year in UK economic and social history.
Amy Borret in the Financial Times reported the words of Alison Garnham, chief executive of the Child Poverty Action Group, who said the data was “shocking” and ‘that anything short of scrapping the two-child limit and increasing child benefits would be “a betrayal of Britain’s children”.’ Amy continued: ‘Campaigners and economists have been calling for the ruling Conservative government to scrap its two-child limit policy, which means that families who claim universal credit or child tax credit cannot do so for a third or subsequent child. The data also showed that income fell last year for all but the top 20 per cent of earners, with the largest reductions in the poorest households.’
Looking inside the new UK statistics reveals a portrait of Britain that is pitiful, especially for the 14.5 million children alive in 2022-23. One in eight children were by then growing up in homes where no adult had any work (two thirds with only a lone parent). One in three children were in homes with two or more siblings, so were hit by the two-child limit on child benefit that even the Labour party in England now supported in 2024 – note the Labour parties in Scotland and Wales have different views. In Scotland this cruelty to children in larger families is not permitted, and there is also an extra Scottish child payment set at a level to ensure that no child goes cold or hungry in Scotland.
Not so in the rest of the UK.
Across the UK as a whole, 5.4 million children by 2022-23 were living in a household where someone had a disability, but only 1.4 million of them lived in a family receiving any disability benefits. Some 3.2 million UK children have to live in the private rented sector and so could be evicted with two months’ notice, this equates to almost one in four of all children (and that proportion has been rising).
Children in the UK (other than in Scotland) are increasingly living parallel lives. Some 8.3 million UK children live in households with no savings or less than £1,500 saved for a rainy day. On the other side of the tracks 3.1 million UK children live in households with £10,000 or more saved away. Together, these are 78% of all children, only 22% of all UK children are not in the two extremes of wealth-poor, or wealth-rich, British households.
The latest UK government report revealed that 28% of all UK children lived in the poorest fifth of households. That is two in every seven children. By 2022-23, of these poorest of all, of the 2 in 7, the proportion that lived in the hardest hit families of all were:
23% that could no longer afford to keep their home warm.32% did not have enough bedrooms for every child aged 10 years or over and of a different gender not to have to sleep in a bedroom with an adult or with a child of the opposite sex – they are thus suffering severe housing deprivation and may be at risk.34% of these 2 out of 7 children live in homes that their parents can no longer afford to decorate at all, but where their parents wish they could decorate – they can no longer afford even the most meagre of decoration.36% of their parents would like to be able to replace broken electrical goods like a kettle or a phone, but can no longer afford to do so anymore.39% of their parents can no longer afford home contents insurance, so if there is a fire or flood or a theft – they will become destitute (if not already so).46% cannot replace worn out furniture, a further 16% say that they don’t think about doing this anymore. So material standards of living fall all the time.52% of these 2 in 7 children would like to have, but cannot afford anymore to have, at least one week’s holiday away from home with family in any year.A slightly different 52% live in families where the parents would like to be able to save £10 a month, but cannot. A much greater number have to choose between saving £10 a month, and home insurance, or a holiday, or fresh food, or heating, or numerous other very basic provisions.
The next 2 in 7 children were doing almost as badly. By most well-off folk’s reckoning, a majority of children in the UK are now poor in terms of how their lives are being lived (4 out of every 7 children in the UK).
These are the worst modern child poverty statistics I have ever seen and I only have space here to cover child poverty in Britain, and just to merely scratch the surface of the data that was released in March 2024 in the UK. Only the Financial Times and the Guardian reported the story in any detail and neither paper had space to include the above statistics or similar ones. The Guardian suggested that ‘Labour called the figures “horrifying” and promised to tackle the problem if it won power at the next election.’ However, Patrick Butler writing in that newspaper pointed out that the Labour Party had no plans to actually do so.
The UK has seen the greatest rise in child poverty reported anywhere in Europe. The rise has been lowest in Scotland although the BBC ran a disingenuous story on this under the headline ‘Child poverty in Scotland shows little change’. The BBC does not report how well Scotland does in comparison to England nowadays.
The situation in England is terrible. We already know that our children are increasingly stunted in height and that death rates for them are rising. What we may not realise is that even the best-off children are not doing well in the UK anymore. In contrast to our European neighbours they cannot expect to be as well educated, to have as good health, or to be housed as well.
Compare what is occurring now in most of the UK, where the situation continues to deteriorate as prices continue to rise faster than income and as inequality is not decreased, with other parts of Europe and Scotland. Everywhere reports the news as bad news. But in comparison to most of the UK and all of England, it often is not at all as bad.
In Finland, for example, a right wing government is now in control. But the contrast with England could not be more stark. However, if you read the reports on Finland the two countries can initially appear similar in terms of proposed economic and social policy. That new right wing Finnish government plans to make:
‘it easier to dismiss employees, relaxing regulations on fixed-term contracts, making the first sick day a day without pay, reducing unemployment benefits, restricting political strikes, capping wage increases based on export sector wages and easing local bargaining. The unprecedented scale of change is reminiscent of the reforms pursued by Margaret Thatcher in the UK or by Portugal under pressure from the Troika in 2011. However, unlike those situations, Finland’s economic situation doesn’t necessitate such reforms.’
The report the quote above came from included a table of data showing that the economic situation in Finland was not that bad, as compared to the UK. Finns are not just much more equal than people in the UK, their overall GDP per capita is now much higher, they have less national debt, are more productive and have a similar proportion of people in work.
Table: Key indicators for the Finnish economy compared to selected OECD countries
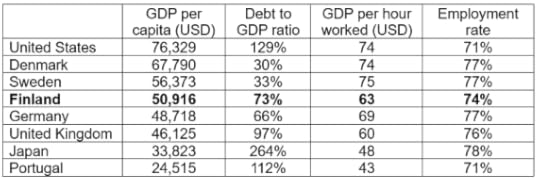
Source: https://blogs.lse.ac.uk/europpblog/20...
Despite the Economic Situation in Finland being much better than in the UK, headlines in Finnish newspapers have still been disturbing in recent months. On 6 December 2023 one such headline read ‘Orpo’s government will increase child poverty, says a Finnish Unicef expert’ That report continued: ‘Finland has not succeeded in reducing poverty in families with children. This is what Unicef says, which compared the fight against child poverty in 39 countries between 2012 and 2021. Finland only ranked 14th. In previous years, Finland was in the top five.’
So Finland’s position has worsened, but this is not because child poverty there has risen. It is because other countries have improved faster. In fact, Finland only ranked 14th by change. Finland is still the country with the third lowest child poverty rate (10.1%). That is the third lowest of the 39 that UNICEF compare in detail (see detailed table below). Some thirteen countries saw faster improvements than Finland in recent years, but only one of those has a lower child poverty rate than in Finland. And the second best placed country of the 39, Denmark, did slightly worse than Finland in terms of change between 2012-14 and 2019-21.

Source: https://www.unicef.org/innocenti/medi...
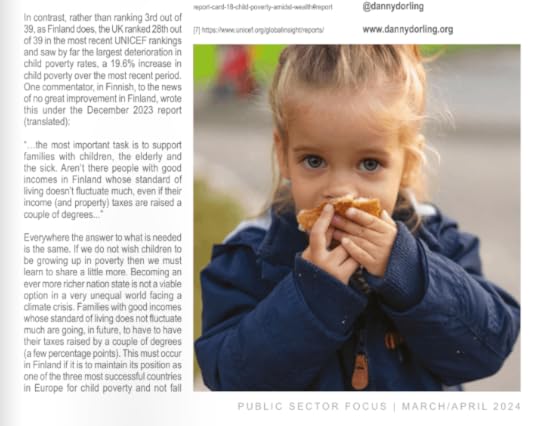
In contrast, rather than ranking 3rd out of 39, as Finland does, the UK ranked 28th out of 39 in the most recent UNICEF rankings and saw by far the largest deterioration in child poverty rates, a 19.6% increase in child poverty over the most recent period. One commentor, in Finnish, to the news of no great improvement in Finland ,wrote this under the December 2023 report (translated):
“…the most important task is to support families with children, the elderly and the sick. Aren’t there people with good incomes in Finland whose standard of living doesn’t fluctuate much, even if their income (and property) taxes are raised a couple of degrees…”
Everywhere the answer to what is needed is the same. If we do not wish children to be growing up in poverty then we must learn to share a little more. Becoming an ever more richer nation states is not a viable option in a very unequal world facing a climate crisis. Families with good incomes whose standard of living does not fluctuate much are going, in future, to have to have their taxes raised by a couple of degrees (a few percentage points). This must occur in Finland if it is to maintain its position as one of the three most successful countries in Europe for child poverty and not fall down the ranks. And it is desperately needed in England – where the change that is required is far greater and so much more urgent.
Danny Dorling – written for Public Sector Focus, 27 March 2024.
For a PDF of this article and a link to where it was first published click here.
Contrasting Child Poverty
March 18, 2024
The Nordic Model of Capitalism
Five countries are normally included in the Nordic grouping. At first (statistical) glance they can appear very similar. The OECD produces a long run data series of income inequality for all of its members, and for some other countries too.1 Click on https://data.oecd.org/ inequality/income-inequality.htm and you will see, at first, that the Nordic countries appear very clustered. Select the five and, in a graph that includes South Africa (the very highest line below), the Nordic countries all appear closely clustered and quite different from the greyed out mass of others. The Nordics are places where income inequalities are at a minimum, where people live lives more similar to each other as compared to people living in other affluent countries. It is almost always only affluent countries that collect data such as this consistently. It is mostly the affluent world which we talk about, when considering different models of capitalism. But there are many models of capitalism now. They are usually changing slowly (and occasionally quickly). But everywhere in the world, capitalism is changing.

Figure 1: Income inequality in all OECD monitored countries, 2008–2021
We all see things very differently, especially the same things. One reason for this is that each of us views an object from a different standpoint. Look at just a few years and it can appear as if nothing is changing. Look at the period from 2008 to 2021 and include South Africa and it looks as if the Nordic countries have always been the most economically equitable in terms of income (as the graph in Figure 1 implies). But those 14 years are just a blink in historical time, and the few dozen countries shown in these graphs are just home to a small minority of humanity. Step back, move around, and look at the same data another way, and you see something else (Figure 2).
Figure 2 depicts the same data as included in part of Figure 1, but now just showing those countries included in the series between 2018 and 2021 and with the most recent numbers ranked. Figure 2 reveals a far less united cluster. Iceland is missing, as it has been late with reporting its data. It might be fair to say that Icelanders can be a little more laid back, although that would be to begin mix data with stereotypes. Iceland, of course, has a very small population. It is, at times and for particular data series, amazing to consider how people there manage to produce these social statistics as if they had an office containing as many statisticians as other countries do.
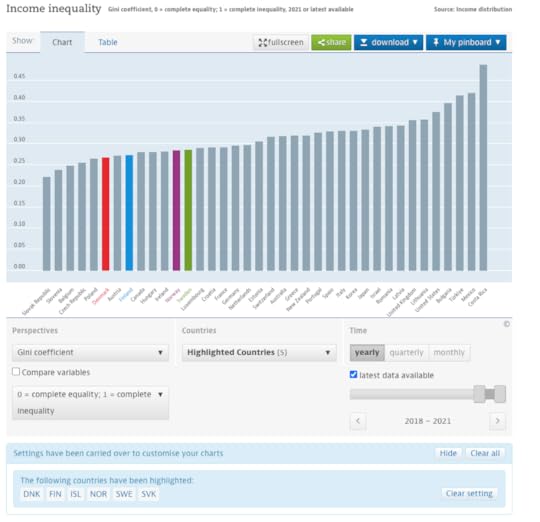
Figure 2: Income inequality in all OECD monitored countries, 2021 or latest data
Look again at Figure 2. Suddenly there is a far more obvious grouping of countries to consider. That group consists of four Eastern European ones, and Belgium, all to the far left of the graph. These five all now have a lower income inequality than the most equitable of all Nordic countries. Why are we not talking about them as a model? Is it because of a less closely shared history, or just their lack of geographical contiguity? However, that cannot be the answer as they are just as contiguous as the Nordic countries. Within the new group of five, Belgium is an offset island (like Iceland among the five Nordics) and Slovenia is a little separated, but not that far away (just as Denmark or Finland are slightly geographically separated from the other Nordics).
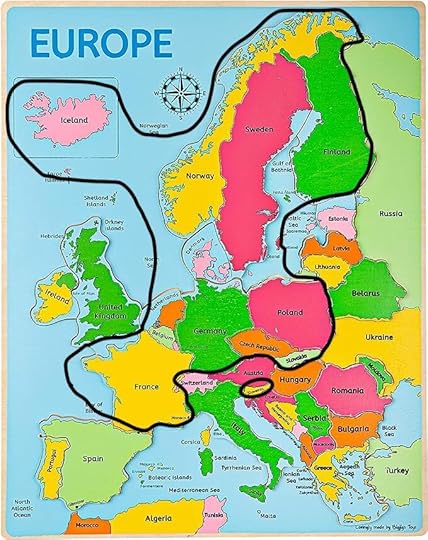
Figure 3: The 15 most equitable countries monitored by the OECD (2021 or latest data)
When discussing the Nordic model of capitalism today, it matters greatly how very similar countries like Croatia, France, Germany, Luxembourg, and The Netherlands are now to the Nordic countries in terms of income inequality. Perhaps we should not be talking about the Nordic model anymore, but today simply call this the ‘Northern European’ model? The Nordic five are increasingly just a typical part of a Northern European fifteen, including the five slightly more and five slightly less equitable countries. In terms of population this is a far larger grouping. Think of it as a geographical ‘X’. This is ‘advanced’ Northern Europe, or ‘Nordic +’ if you are sentimental about that name – see the map in Figure 3.
Nordic+ is bordered by some extremely unequal states. To the west is the UK, and Russia neighbours this block to the east: two states which are remarkably similar in terms of inequality and in how badly the poor now fair in both. Both also have outsized capital cities. To the southeast is Bulgaria, the most unequal country in Europe, and next to it is Turkey, which is even more unequal, though only partly in Europe. Turkey also has an outsized largest city. Surrounding the Nordic+ grouping are Istanbul, London and Moscow, all relic capitals of past empires: the Ottoman, British, and Soviet empires that all existed under capitalism. The fact that all are now dead empires shows just how much changes under capitalism and within the era we think of as capitalist. Other neighbouring countries with less recent historical hang-ups of imperial domination are much closer to securing entry to Nordic+: Estonia, Italy, Portugal, Spain and Switzerland being among the most notable. These five are not far off from joining Nordic+ within a few years if they can only become slightly more equitable places to live and work and play. Adding them would make the grouping a club of twenty at that point, one that might then just best be termed: ‘almost all of Europe’.
But why stop at Europe? Let’s look a little further out, again with the same data. This data set is still very geographically limited, but Canada is now as equitable as Sweden in terms of income, so maybe the Nordic+ should have at least 21 members? But then we would have to start to consider countries like Japan, which by some measures of income inequality, but not all, are even more equitable than Canada and Sweden (Ballas et al., 2016). The problem with defining a Nordic model is that it can only be a model that applies for a short time. It is today a model that suggests that the Nordic countries are more similar than they are, and more different to other countries than they actually are.
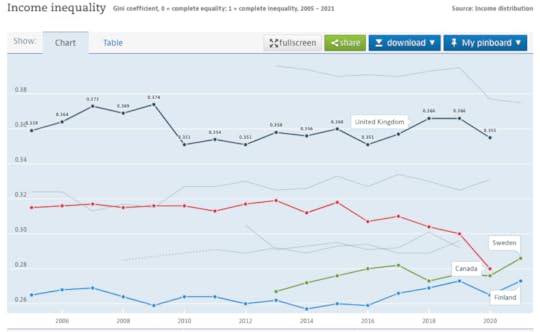
Figure 4: Income inequality in four OECD monitored countries, 2005-2021
In Figure 4 the UK is also highlighted to show how very different it is – but in 2012 it was more similar to Canada than Canada was, back then, to Sweden. Remarkable things have been happening in Canada recently (Statistics Canada, 2022). Above the UK is the United States, just below it is Italy (the second most unequal large country in Europe). Germany and France are the two interlocking lines in Figure 4, the two between Canada and Sweden.
Capitalism changes. Capitalism is always changing. Capitalism, at its most basic, is simply a change. It is the change from some fairly stable set of social systems, ones that dominated human life across the planet for much longer than this change has been in play, to what some of us hope will be another set of fairly stable social systems, or perhaps just one system. There is nothing stable about capitalism. We only think of it as such because we live such short lives. If we lived for 800 years we would see capitalism as a short mid-life crisis in the world systems during our lives. But that is very difficult to imagine, so next, to try to illustrate just how quickly things change, Figure 5 presents one final graph from exactly the same source, created just by clicking on a couple of different options on the OECD web tool.

Figure 5: The proportion of people who believe children suffer when mothers work, 2023
Each circle in Figure 5 is a country, with the circle drawn in proportion to the share of all adults who agree, when surveyed, with the statement ‘when a mother works for pay, the children suffer’. In the Americas that proportion is lowest in the United States and Canada (about 20%). In Europe it is lowest in Denmark, at 8.9% (the label is not exactly aligned due to the workings of the OECD software, but Denmark is the smallest dot in Figure 5).
When looking at Figure 5 we could consider the extent to which whether a child suffers depends on what else is available for the child, what men do, and how society in general is organised – and how that also is changing. A child simply at home with their mother can be a very bored child (perhaps with a very lonely and bored mother). The proportion is also low in Indonesia, Japan, New Zealand, Tapia and Zimbabwe (17.8%). It is higher in Iceland and Norway than Zimbabwe. Perhaps we should add these five countries to now form Nordic++?
Not many years ago (in 2008) one prominent educational researcher suggested that the OECD was a ‘… crude, lumbering think-tank of the most wealthy nations, bulldozing over human dignity without pause for thought. Its tracks, crushed into the barren dereliction left behind, spell ‘global free market’’ (Stephen Ball quoted in Dorling, 2015). Interestingly, though, those countries doing best in the free market included the Nordic ones (Figure 6).
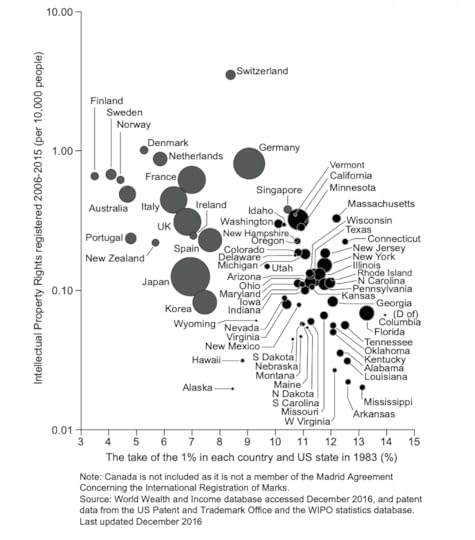
Figure 6: Patents claimed per head 2006–2015, verses inequality in 1983, population by area
Another writer, writing more recently, explained: ‘People talk about capitalism as if it were just one thing, but the truth is that we live in a global system of capitalisms plural, with a chunk of ideology in common but considerable differences in local emphasis.’ (John Lanchester, quoted in Dorling, 2023). We are currently in a period where we are better than we used to be at noticing the differences. This may be because those differences between the United States and most of Europe have grown in recent decades, and because most of us who are writing about this are European; and everyone I quote here is male and English. We notice what happens within Europe more, we tend to be myopic. But there are also growing differences between what is happening in the separate states of the United States (see Figure 6 for just one example from many). Everywhere, capitalism is on a different trajectory. It is a change that moves at different speeds at different times in different places – like a series of rocks falling, tumbling or just slowly sliding, down a mountainside, before they all settle at the bottom.
This volume of the journal that short paper appears in mostly concerns the differences between the five Nordic countries. They are very interesting differences, and they matter. Each country varies so much from the rest that it sometimes feels wrong to group them. However, generalisations are possible. As a rule of thumb, those nearest to the UK tend to be home to folk who are a little more selfish, those further away are more collective and generous in their outlook, but all are so very different to the United States that when types of capitalism came to be defined, they were all lumped together. Just as interesting is how many other countries in the world are now becoming more Nordic in so many ways, or are even more Nordic than some of the Nordic countries!
The Nordic countries are often thought to be institutionally distinct. It is hard to find a series of measures of the nature of institutions to test this theory. Certainly, trust in institutions is higher in Nordic countries, but that might well have simply been a function of those countries being more equitable and happier places earlier than others. It is not necessarily that the ‘Nordic way’ is becoming less distinct, it is that more places in the world are becoming more Nordic. The Nordic way was also often misunderstood. Figure 6 shows how levels of innovation were always very high in those Nordic countries for which there was data. The same is true of other measures, such as numbers of academic papers written per capita, and technological innovations and inventions. The Nordic countries were and are some of the most entrepreneurial. In contrast, it has been the case for a very long time that much of the United States is not just a place of very poor health, low educational achievements, lack of decent housing and high imprisonment and crime rates, but also a place of very low imagination and poor entrepreneurial economic achievement. Figure 6 uses a log scale so that the worse performing states of the United States can fit on the graph.
Capitalism, the explosion of production and human population made possible by disrupting every stable social system on the planet – and allowing a few people to gather wealth in a way that had almost never been permitted before – is ending as a change. Putative attempts to begin capitalism in China in much earlier centuries were halted because of concerns about what might be unleashed. Today we live in a world where it is not just a few rulers seeing capitalism as being a dangerous change, but billions of people trying to end its worse effects. The Nordic model is a part of that – high innovation but with some of the lowest rates of exploitation and immiseration ever recorded in human history. It is something which began a few decades ago in a remote part of Europe. At the same time as the Nordic model began, other developments around the world of even greater importance were taking place. These ranged from revolution in China through to repeated failed attempts at greater emancipation in South America. The Nordic model is a blip in the history of a great change.
That change is capitalism, which itself is a blip in the history of a species. It is just that from where we are looking, it feels as if time is passing very slowly, and as if the world is a very big place.
References
Ballas, D., Dorling, D., Nakaya, T., Tunstall, H., Hanaoka, K., & Hanibuchi, T. (2016). Happiness, social cohesion and income inequalities in Britain and Japan. In T. Tachibanaki (Ed.), Advances in happiness research: A comparative perspective (pp. 119–138). Springer. https://link.springer.com/ book/10.1007/978-4-431-55753-1
Dorling, D. (2015). Injustice. Why social inequality still persists. Policy Press.
Dorling, D. (2023). Shattered nation. Inequality and the geography of a failing state. Verso Books.
Statistics Canada. (2022). Eh sayers podcast: Why haven’t we ended poverty yet?. Statistics Canada YouTube Channel, https://www.youtube.com/watch?v=HPfqyYncfzQ
For a PDF of this article and place or original publication click here
March 14, 2024
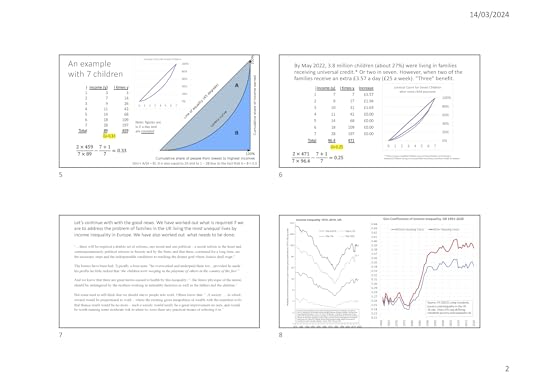
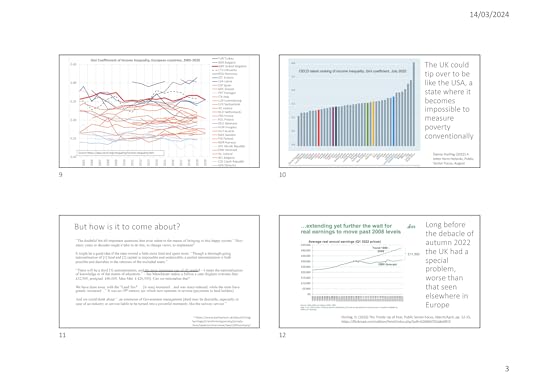
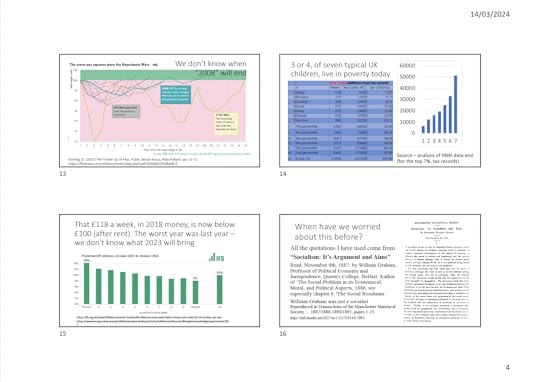
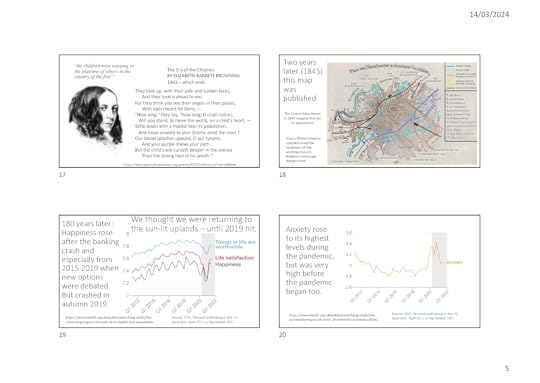
Inequality in the UK in terms of family incomes – implications for the cost of living crisis
Thank you so much for the invitation to speak. You might have thought that what I am here to speak about is going to be quite depressing, but I am going to try and make it less so.
The reason I can make it not so depressing is some really good news that I suspect none of you have heard: since November 2022, the government have started to make payments of £25 a week to families for each child they have under the age of 16, if they are claiming any kind of benefit or Universal Credit. Most of those people are in work, of course, and for them it is an enormous amount of money. If you have three kids aged under 16, that is almost £4,000 more a year, so this is quite an incredible thing that has just happened. I am going to try and show you why it is so incredible.
‘[I]t aims at a certain measure of social equality and chiefly equality of material well-being’ – a levelling up of people, especially children. The policy has other ‘ultimate aims – as greater equality of culture, leisure, liberty, and happiness” – not just to pay for heating and food. It could also be seen to ‘aim at greater equality, but by no means at perfect of absolute equality’. However, no child grows up extremely poor. It recognises that ‘a juster distribution, and, in general, a better and happier state of things, can only be brought about by the action and authority of the State.’ – That it is the state that has to step in now. Part of wider ‘progressive reforms and the slow introduction of greater equality of opportunities, and of greater equity in social conditions’.
I will tell you later where these quotations come from, but they give you an idea of what this policy is really about. You may well know this about our current situation, but if you do not, you should do. These statistics are from The Sun and the Daily Mail: almost half of all adults in the UK receive so little income that they do not pay any income tax. That is the country we live in. Most children are living below, or only a few pennies a day above, various poverty lines. You could argue whether it is 30 per cent or 40 per cent, but I would say it is nearer 50 per cent of children living in poverty.
The above words are the introduction to an edited transcript of a talk given on Tuesday 14 March, 2023
For a PDF of the full article and where it was originally read out click here.

slides 1-4: Dorling, D. (2024) Inequality in the UK in terms of family incomes – implications for the cost of living crisis, Transactions of the Manchester Statistical Society 2022-2023, vol.190, pp.67-85, https://manstatsoc.org/2022/09/16/190...
Slides 5-8
Slides 9-12
Slides 13-16
Slides 17-20

Slides 21-24
Slides 25-28
Slides 29-32

Slides 33-36.
March 7, 2024
From the cradle to the grave: The abandonment of our social contract
The Sun newspaper broke the story of two-year-old Bronson Battersby in January. He was found starved to death curled up next to his father Kenneth. Kenneth had died of a heart attack. He was 60. The two were last seen together by a neighbour 14 days earlier. Five days later, the BBC reported that the local Police and Crime Commissioner had suggested any speculation about their demise was “unhelpful”.
A week on, other news reports suggested that, in places like the town in which Bronson and his father died – Skegness in Lincolnshire – with so much poverty and so many chaotic lives, it is often only local social services that “pick up the pieces”.
These reports pointed out that there was only one social worker for every dozen children known to be very vulnerable nationally, and that those social workers had a great deal more to do than just keep an eye on that dozen. They explained that social work is becoming harder as other services such as GPs withdraw; as deprivation rises; and because the starting salary for social work is only £24,000.
No one asked why the pieces were falling apart.
An inquiry was initiated to ascertain whether any failings could be ascribed to individual professionals and ‘missed opportunities’. These kinds of inquiries are always limited in their scope.
The reality is that the death of someone like Kenneth in Britain in 2024 is now treated as not uncommon. But there was a time when our health was improving. When poverty was falling. When lives were less chaotic. When fewer children and adults died each week than die now in England.
Two months before Bronson Battersby’s slow death, the President of the Royal College of Paediatrics and Child Health raised the alarm. No one listened.
Dr Camilla Kingdon was reacting to the latest release of the National Child Mortality Database which showed a dramatic increase in deaths among children aged one to four. “Behind this awful data,” she said, “is a whole raft of deteriorating child health outcomes and the clear driver is rising child poverty in the UK.”
She was speaking, in effect, to an empty room. This was not an issue deemed of importance anymore. Her other statements on other issues were reported in the press, but not her warning on the deaths of children in the UK.
Death rates have risen among children of all ages, and all social classes, but most of all for those who are living in poor areas – and especially for younger aged children like Bronson.
The greatest rise has happened in the most recent 12 months, between 2022 and 2023.
But so what? We are used to these stories now. Many of us can’t remember a time when there was good news. ‘Tragic but inevitable’ appears to be the default response. As well as the sense that ‘at least it is mostly only happening in the poorest of areas’. Except that child mortality is now rising everywhere, in all social groups. Rare events make headlines. Mundane bad news does not.
…
If the reaction is to keep your children close and hope this is never the fate of anyone you know, let alone care about, then you also don’t want to think about the last year of your own life. Or about what it might be like for your parents or grandparents if they are still alive in their last year of life. Not now things have become so bad.
We know the NHS has been falling apart for as long as most of us can remember. We know there is very little left of adult social care or of those ‘meals on wheels’ that used to be delivered. We’ve heard there is a triple-lock on state pensions, but we know – or should know – that other benefits were removed during the past decade to mean that even average pensioners became no better-off. That was all before the price of heating your home and feeding yourself rose so fast. Even with inflation falling, prices are still rising much faster than before, even now.
The National Life Tables for the UK were released five days before Bronson and his father were found dead.
These were the latest such statistics since 2021, but we don’t look at them anymore. It is no longer news.
The tables showed that life expectancy in the three years to 2022 was 78.6 for men and 82.6 for women. It had been 78.7 and 82.7 previously. It was falling partly because the period before included a pandemic-free year. A decade earlier, in 2012 to 2014, men lived more than 79 years and women 82.8.
By 2020 to 2022, the national UK mortality rates of two-year-old boys like Bronson, according to the new National Life Tables, had risen to 15 per 100,000 (its highest level since 2015 to 2017). In all of British recorded mortality history, it has never risen by as much as it was reported to have risen most recently.
The National Child Mortality Database figures are even more up to date. And they are worse. So we already know that it will be higher again when the Life Tables are next updated, probably two years from now.
Despite this, we don’t ask the most important question of all: why?
We ask about individual infectious diseases. About the pandemic. The competence of professionals. The supposed fecklessness of individuals. But we do not ask why, after a century of progress, more children are now dying young in Britain today.
We don’t ask why the heights of our children have been falling, beginning for those born in 2005, who were hardly any taller than those born five years before them. British children’s height had been rising for more than a century. So why are children in Britain now shorter – when child heights are still rising in France and only stalled for a short time in Germany (and only then in the brief years when hundreds of thousands of children from war-torn Syria were allowed in as refugees)?
We don’t ask why we are behaving like the only other country in the rich world to see the same thing occurring: why are we copying the United States?
We don’t ask why child poverty rates are now higher in every region of England than in Northern Ireland or Scotland. Or why the two largest political parties in England now support the two-child policy on benefits – condemning a majority of English children (56%) with two or more siblings to go hungry several times a month last year. In England, we don’t seem to know that in Scotland this is not the case – or that the special extra Scottish Child Payment was increased in November 2022 so that no children north of the border need go cold or hungry – or be so stunted in height in the future.
We don’t ask why we allowed our welfare state, which once protected us from the cradle to the grave, to no longer function at either end of our lives, let alone in between. Why?
I can see why. There comes a time when you might as well just give up. Accept that our last years of life are likely to come earlier now and be more painful than they were in the past. That our children will be fed poorer diets, be shorter, and live lives a little more desperate than before. It is understandable to accept that hope is dead and all we can do is to try to look after ourselves and our families.
Or we can pick ourselves up and say: this far and no further. That we still do have a society. That there were people who did knock on Bronson Battersby’s door. That millions of people have now seen the photo taken of him before he died.
But we also know the situation could get much worse. And so we must ask the one question we are most afraid to. Why?
For A PDF of this article and It’s original place of publication click here.
March 4, 2024
Fertility rates are falling in the rich world; but there are still plenty of people to go round
“It’s funny, but it’s dark, because we know we could be causing our own extinction.” That was the sardonic response of one single 30-year-old South Korean, to a BBC reporter, to the data released last week that showed her country has the lowest fertility rate ever recorded. On average, women in South Korea are now having only 0.72 children. For a country to have a stable population, that number needs to be a little over 2. A little over because not all children reach mid-adulthood, anywhere in the world.
In South Korea, the fall in babies has occurred despite successive governments spending £226bn over the past 20 years trying to incentivise women to have more children. The BBC story focused on the trade-offs of having a career or a family, the excessive costs of private education and the competitive misery of growing up in South Korean society. However, not once, in the 2,500-word story, did the words “inequality”, “poverty” or “destitution” appear. It might be that such words are now no longer welcomed in copy for a public broadcaster that represents Europe’s most unequal large country (by income). Or it might just be that we tend to think of these issues as being the aggregate of millions of individual choices not to have children, rather than part of a wider story.
The Organization for Economic Co-operation and Development (OECD) produces and updates income inequality statistics continuously, the latest of which reports that South Korea is the 11th most unequal country of all those that it surveys. But there is no simple correlation between economic inequality in a country and the number of children people have. Israel (10th) is fractionally more unequal than Korea, yet has a fertility rate of 2.9.
The UK is even more unequal, ranking eighth in inequality, with a fertility rate of 1.6. The USA is the fifth most unequal state in the affluent world, and yet the number of children people have there is higher, at 1.7.
Why, then, is the fertility rate in South Korea so low? French media suggest that the burden of “carrying out the brunt of household chores” is a key factor. Al Jazeera points to South Korea having “one of the worst gender pay gaps” in the OECD. Reuters chose to highlight that “Japan’s fertility rate hit a record low of 1.26 in 2022, while China recorded 1.09, also a record low.” And the Guardian, a couple of weeks before the latest story broke, reminded its readers that “Britain’s birth rate is the lowest it has been in two decades”, pointing out that everything from “cultural Marxism” to “millennial narcissism” was being blamed.
What no one said, and what should be said, is that we are not alone on this planet. There are eight billion of us now and yet all these stories repeatedly focus only on events going on within the richest of nations – as if the rest of us, or the rest of nature, did not exist.
The world as a whole passed the dramatic “peak baby” moment a very long time ago, in 1990. The children that those babies produced created a further peak, but it was barely any higher than that earlier one. Today, the United Nations projections show that we will not see such large peaks again. Our total numbers will, from here on, rise ever more slowly, and almost entirely because we are now living longer.
Current projections also suggest that in the year 2086, our number will fall for the first time not due to calamity. This peak human date will be a momentous point in the history of a very young species.
It is beyond my ability to explain quite how the young women and men of the affluent world know that there are now enough of us on this planet. But clearly most know that there are enough youngsters living elsewhere that if we only stopped trying to “stop the boats”, or dog-whistling about “poisoning the blood”, there would be enough of us to go around, everywhere, for all our futures.
Young adults appear to know we should slow down, at least subconsciously, almost everywhere outside war zones. It is not concerns about climate disaster, artificial intelligence or any other relatively recent existential fears that are causing this. We know this because the slowdown in the number of babies being born in places such as Korea, Japan and Europe began many decades ago. We have always expressed shock when births fall. But they have to, for humans, eventually. South Korea is mostly just the extreme edge of that trend. And it is there, at that edge, because it is almost entirely urban.
We do not operate purely in the statistical silos of the borders of nation states. Our behaviour is affected by everything else happening in the world. The number of babies being born per woman has been falling almost everywhere worldwide, for many decades now; but the number of children we collectively have is enough. There are no new worlds to be populated, and we are more aware today of the implications of trying to settle others’ lands than we have ever been.
In short – we are not alone. We live in crowded cities spread over a planet that hosts enough people and does not need a great deal more. We have developed social security systems that, if we are careful, should care for us in old age so we do not need the insurance of an additional child. And, above all else, women, especially in the more affluent countries, are more and more able to say no to what the government, with all their billions of pounds of incentives, might suggest.
For the original article, where that was first published, and the first draft of it, click: here.
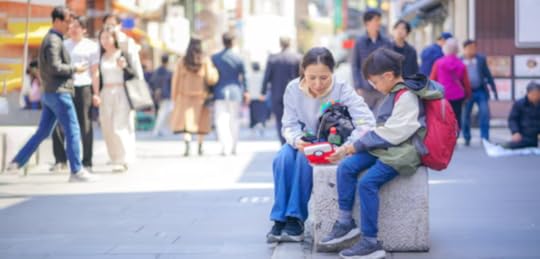
A mother and child in Seoul. South Korea has the lowest fertility rate in the world. Photograph: Pratan Ounpitipong/Getty Images
February 29, 2024
The rise and fall of Britain’s Golden Cohort: how the remarkable generation of 1925–1934 had their lives cut short by austerity
A research article written by Lucinda Hiam and Danny Dorling, and published in the Review of Social Economy, online, on 29 Feb 2024.
Abstract
The British born between 1925 and 1934 experienced exceptional improvements in their annual mortality; earning them the title ‘the Golden Cohort’. They were the goldilocks generation; almost all too young to fight in WWII, but the right age to benefit from food rationing; too old to be hit by 1980s youth unemployment, and the right age to benefit from increased health and social care spending of the late 1990s and early 2000s. This group has befuddled demographers for many years, and as recently as 2014 it was predicted that their golden luck would continue. However, using the latest data from the Human Mortality Database, we show how the Golden Cohort’s luck changed in 2012 when their outstanding health record was reversed, cutting short most of their remarkable lives. This change coincides with the introduction of austerity in 2010, consistent with the evidence on the harms of austerity in Britain.
1. Introduction
There is something unusual about people born in Britain between 1925 and 1934. The men and women born in that decade were children during the time of the Great Depression and in the wake of World War I (WWI). Yet, for almost all their lives, they consistently benefited from better mortality improvements than those born before and, curiously, after them. This earned them the collective name ‘the Golden Cohort’ (Easton, 2011; Goldring et al., 2011; Murphy, 2009).
For most people, Britain in the years 1925–1934 was not a place of health and prosperity. In adulthood, the Golden Cohort did not start out at an easy time in British history. As adults, they lived in a country that was losing its empire and becoming poorer in relation to other Europeans. As children, most of them lived in poverty which had deepened in some key ways in the previous three decades (Seebohm Rowntree, 1941). They were not especially healthy as young adults, and often smoked, but something about this group resulted in their health continuing to improve from early on at rates unrivalled by those born both before them, and after them.
The Golden Cohort may partly just have been lucky. They lived, in their adulthood, through what was the most prolonged period of peace to have occurred across most of Europe for many centuries. They avoided pandemics that came far less frequently for them than such diseases had for earlier generations. They lived through some of the most equitable and progressive eras in British history. When, in the 1980s, there was mass unemployment, it mainly affected people younger than them. When health and social care spending rose greatly after 1997, it mainly benefitted them. Their good fortune had been ‘golden’. However, in this paper we argue that the Golden Cohort, who had been so lucky for so long, encountered extremely bad luck in old age. As a group, they had their lives cut short by a government-imposed policy—austerity. This so badly affected enough of this cohort to alter their collective outcomes in a way we can now see as having been startling, and which perhaps we should have better monitored at the time. Austerity measures, which were introduced in the UK in late 2010, have now been widely linked to rapidly worsening health in the British population, a trend which began long before the COVID-19 pandemic had emerged. Some of those who suffered most were the group who had been called golden.
The Golden Cohort were well into their Golden years of life—in their 70s and 80s—when the impacts of 2010 austerity began to take effect, around 2012 onwards. Here we compare the trends in mortality improvements for them with other people born a little earlier and later than those ages. We show that austerity was most damaging for those who were oldest and had by then the least power to fight it.
We begin by exploring the story of the Golden Cohort throughout the twentieth century, their more recent history from 2000 onwards, and then turn to consider the years of austerity from 2010 until the present day in depth (these austerity years are not yet over). We end with their experience of the COVID-19 pandemic and, now in the mid 2020s, how the very few that remain, but also and in summary, how their children, grandchildren and great grandchildren are today being affected by the cost-of-living crisis coupled with continued austerity in Britain. ….
For the PDF of the full article and where it was originally published online click here.
Two key figures form the paper suggesting that something changed abruptly after 2010 in the UK, the especially harmed the elderly.:
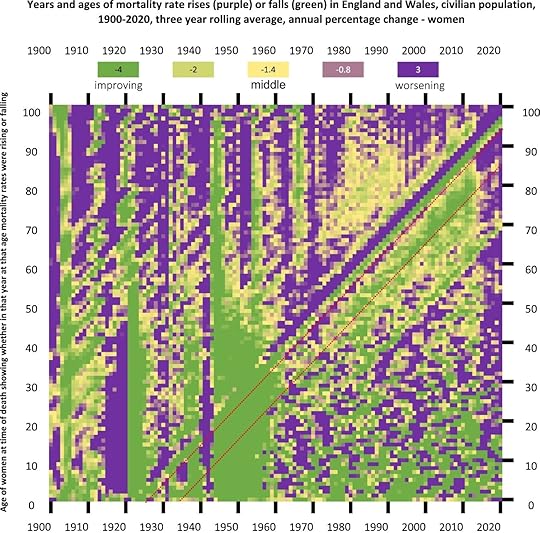
Figure 17 from the full paper (for women) – note how the colours change after 2010. Figure 18 (for men) is below

Figure 18 from the full paper (for men) – note how the colours change after 2010.
The sun on the meadow
‘…by changing our country…and building a better future for our children and grandchildren. … A future where they feel optimism, hope, and pride. … A better future is one where our economy is growing faster so that everybody, everywhere across our Union, has new opportunities for better paying, good jobs. … If we’re going to deliver this better future, people will have to work hard. … So, we will create a better future by changing our economy and strengthening our communities. … That’s why family runs right through our vision of a better future. … And I’ve made five promises today to deliver peace of mind. We will: Halve inflation. Grow the economy. Reduce debt. Cut waiting times. And stop the boats. But I know this is just the start of what we need to do to build a better Britain together. As well as peace of mind today, this afternoon I’ve also set out a vision for a better future for our children and grandchildren. We’re not going to get there overnight. Or even in this Parliament. But this is the journey we are on.’ Rishi Sunak, 4 January 2023. [1]
‘We should look forward full of pride and optimism for what we can do together to build a brighter future for everyone. That’s what I’m determined to do, and I wish you all a very happy 2024.’
Rishi Sunak’s 2024 New Year message.[2]
The sunlit uplands, a view near one of Rishi Sunak’s many homes

Source: Photo: Jamie Davies, CC0, Unsplash, Hikes & Walks in the Yorkshire Dales, https://www.outdooractive.com/en/hike...
The British Prime Minister’s 2024 New Year message to the people of the nations of the UK was much shorter than the address he gave at the beginning of 2023. This was hardly surprising. Polling in January 2024 revealed that 75% of the UK population had become greatly concerned about the extent of wealth and income inequalities; 70% thought that health inequalities were a significant issue; and 68% thought the same of inequalities in educational attainment. [3]
That poll did not ask about housing. However, international research published three years earlier had uncovered just how poorly the UK was performing compared to other countries in terms of families’ ability to afford a mortgage and have a safe home. The latest statistics from the ONS revealed that by July 2023 some 66% of households in private renting in England were experiencing rapid rent increases, an average of 10% in the year, the highest proportion to experience such increases ever recorded. [4]
The research report (that the Figure showing changes in home ownerships rates was drawn from) concluded: ‘Those losing out under this type of approach – because of the higher prices consequently faced – include all aspirant first-time buyers failing to qualify for such assistance. The main beneficiaries, on the other hand, are existing home owners, whose properties consequently appreciate in value without any effort by property holders themselves.’ So growing inequality and unfairness in how we are housed should be added to the public’s concern about inequality overall, as well as in our access to health care and in educational outcomes across the UK.
Figure 2: Change home-ownership rates, owner occupiers % (2003=100)
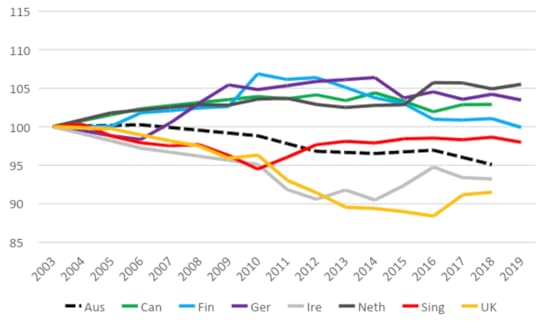
Source: Hall Pawson (2022) The elephant in the room: to broaden home ownership access,
governments must tackle housing affordability head-on, Red Brick Blog
Link To Source: Hall Pawson (2022) [5]
Evidence from Australia, where recent governments spent $20bn on first-home buyer support over a decade, shows that all that was achieved was to push up house prices and rents. How can this have happened? Didn’t people notice? One answer to that conundrum is that governments in countries like Australia and the UK have succeeded in encouraging many people not to see other people as people. [6]
Those who rent are not quite the same people as you (if you have a mortgage); those who fail to pay their mortgage and lose their home are lesser people than you – they imply. Those who do not have family that are rich enough to give them the deposit to start to buy a home are somehow feckless. The most feckless, it is suggested, are people who end up living on the streets.
In the USA increasing numbers of adults have begun to not think of the homeless as human. The research which revealed this also explained how the researcher felt upon returning home from being in a homeless shelter and seeing a tweet designed to increase empathy for those without a home [7]:
‘Call me sentimental or materialistic, but when I would come home, I would cry. Having your own fridge, with your own favourite drink in it that you could just get and drink by yourself without anyone watching you suddenly felt like a privilege. Why should we give money to homeless people? For me it is because of what the Lithuanian-French philosopher Levinas call the ethical appeal that the face of the other makes to you. Seeing someone being in misery should evoke feelings of empathy. For that I don’t need to see homeless people being hurt through nasty tweets before I recognise them as human.’
We will ‘Halve inflation’ – for renters? And how much of that fall had nothing to do with Sunak’s government and everything to do with global factors? Prices are still rising rapidly even when inflation is halved. There is no UK government promise to make housing, or food, or heating affordable.
We will ‘Grow the economy’ – but for whom? For a few who profit at the expense of the rest? We will hold up the value of our voters homes for just one more year? Which economy is this that will grow? How will this growth improve peoples’ lives, housing security, education, health – are we just supposed to trust you?
We will ‘Reduce debt’. Who’s debt? The growing debt of university students? That of young people in general who cannot get by without it? The debt of the poor, including the old who are poor – or do you mean the debt of the richer folk who borrow to purchase properties at inflated prices?
We will ‘Cut waiting times’. By how much, when, where, in what hospital for what service? Or will it be mostly for that minority of a tenth of the population who can afford to go private or who are forced to do so because they can wait no longer?
We will ‘Stop the boats’. Why? How? When? With what effect? By force? By attempting to frighten people that they might be flown to the centre of Africa if they manage to survive the crossing over the channel?
In 1966 when the musical Cabaret first played on Broadway a waiter with a swastika on his arms sang a song: ‘Tomorrow belongs To Me’. In the film released a few years later the song was sung by a young German boy in uniform. The lyrics are eery, and it is, perhaps, time we learnt what they meant again:
The sun on the meadow is summery warm.
The stag in the forest runs free.
But gather together to greet the storm.
Tomorrow belongs to me.
The branch of the linden is leafy and green,
The Rhine gives its gold to the sea.
But somewhere a glory awaits unseen.
Tomorrow belongs to me.
You are told that the sunlit uplands are there to be reached if only ‘people will … work hard. You are told that freedom matters so much in this green land, with its stags and forests. You are told that by ‘strengthening our communities’ we can weather any coming storm. You are told (today) that tomorrow is your’s. You are told that the trees are still as green as ever and that this remains a pleasant land. You are told that the rivers run gold (don’t ask why they are that colour after the storms). You are told that future glories await, although ‘We’re not going to get there overnight. Or even in this Parliament. But this is the journey we are on.’ But what you should understand is who they think that tomorrow really belongs to. It is not you.
References
[1] https://www.gov.uk/government/speeche...
[2] https://www.youtube.com/watch?v=vi8c4...
[3] https://fairnessfoundation.com/unequa...
[4] https://www.ons.gov.uk/peoplepopulati...
[5] https://redbrickblog.co.uk/2022/09/th...
[6] https://www.theguardian.com/commentis...
[7] https://blog.practicalethics.ox.ac.uk...
For a PDF of this publication and the original source click here.
Shape of the future, the next supercontinent: Solving the puzzle of a future Pangea by Ross Mitchell
The possibility of the realigning of Asian and America.
Why write a book about the next supercontinent – Amasia?
It is a land mass not expected to fully form until 200 million years from now. Mitchell, credits the naming to Hoffman (p. 229).
Currently based in Beijing, at the Institute of Geology and Geophysics of the Chinese Academy of Sciences. What Mitchell’s work has most concerns is the past, constructing the record of what happened before. To get you interested in that, and why it matters, he has written instead about the future – but what this book is actually about is neither the future nor the past – The Next Supercontinent concerns our present. What is it that we believe?
Artwork by Eve Hammer (www.evehammer.com)
Much of contemporary importance is mentioned early on: renewable energy, melting polar ice caps, sea level rise, volcanic activity generating greenhouse gases, and how we now compete with the volcanoes – and what we might do to mitigate our own very volcanic effects on the atmosphere. Although this is still ostensibly a book about plate tectonics. It is really about so much more. Mitchell knows it is unbelievably unlikely that Amasia will stick as the name of the next supercontinent to come. For a start almost no mammal species survives more than a few million years, at most. Most last less than a million, a tiny number for just over three score million; none for any longer than that.
The first third of this book tells a now old story far better than it is usually told, more readable, more gripping. I learnt of what has been discovered since I was taught about plate tectonics in the 1980s at university when my physical geography lecturer drew meticulous mutli-coloured diagrams on a chalk blackboard in Newcastle upon Tyne – I must have been among the last geography students ever to be taught plate tectonics through chalk diagrams. Clearly things have moved on.
At times ‘The Next Continent; is too sweeping. For someone who is currently studying for a doctoral degree it is a a little too humbling to read that: ‘Our story starts with the humblest beginnings of any scientist: the PhD thesis’ (p. 132). A PhD thesis is not necessarily that humble or an easy a thing to complete. For many academics it will be the most complex piece of work they have ever conducted.
And, so what will be the shape of Amasia? Of course, we cannot be at all sure. We are only just learning to crawl when it comes to plate tectonics. For those of us that are old, our grandparents knew nothing of this. Mitchell is not even sure the Pacific Ocean will be the first to close (pp.202-203). This lovely book is a story of how quickly we are changing what it is we know, how we think, how we think about how we think. And what it is we most value.
None of our descendants will survive long enough to see any practical effects of technic change. The reshaping of the continents will not matter to our species. We will not be there. We are not an especially careful mammal. If we are lucky, maybe we have a million years to go, maybe even two. But this book is not about that. It is ultimately about science, as the new religion of our times, and how we think of eternity. It is about us, and what we are becoming.
Mitchell ends the worker thanking others. The idea of the book was that of his editor, the Joe Calamia (p. 249), and the rest of the acknowledgements are to Mitchell’s many teachers, collaborators and family. The book ends ‘Above all, thanks to the University of Chicago Press for taking a chance on a first-time author. Let’s do it is again sometime’ (p.252). For a first book – The Next Supercontinent is quite something – please read it!
for a PDF of this article and where it was originally published click here.

Shape of the future, the next supercontinent: Solving the puzzle of a future Pangea by Ross Mitchell
Danny Dorling's Blog

- Danny Dorling's profile
- 96 followers

