
Menzie David Chinn's Blog, page 10
April 14, 2016
Heckuva a Lot of Uncertainty There
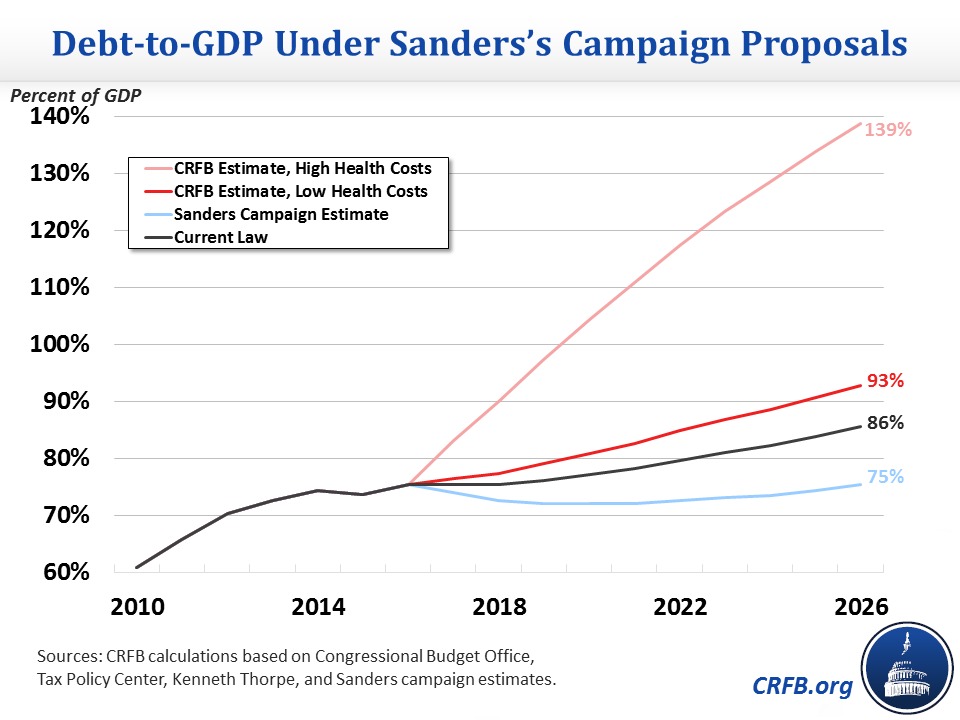
The sheer audacity (and vagueness) of Senator Sanders’ economic program means that there is a lot of uncertainty surrounding impacts: wholesale replacement of ACA, rapid increases in marginal tax rates, rapidly escalating infrastructure spending, among others. Here’s CRFB’s estimate of the impact on debt-to-GDP.
Frankly speaking, it’s pretty brave of of CRFB to try to score the Sanders plan, given the many imponderables.
Based on our estimates, Senator Sanders’s proposals would raise both spending and revenue to far beyond any previous levels in the United States over the last half century. Assuming lower health costs, spending (including net interest) will average 30 percent of Gross Domestic Product (GDP) over the decade, and assuming higher health costs, spending will average 35 percent. By comparison, the United States has spent an average of about 20 percent of GDP over the last half century and never more than 24.4 percent.
Senator Sanders would also increase revenue substantially, to about 25 percent of GDP over the decade, which is significantly higher than the historical average of 17.4 percent and well above the previous record of 20 percent of GDP set in the year 2000.
In dollar terms, we find that Senator Sanders’s major initiatives would cost over $17 trillion and up to $28 trillion (depending on health assumptions), while his tax increases – based largely on estimates from [Tax Policy Center] – would raise less than $16 trillion. Incorporating interest, the result would be $2 trillion to $15 trillion of additional debt, causing debt to rise from about 74 percent of GDP in 2015 (and 86 percent by 2026 under current law) to between 93 and 139 percent of GDP by 2026.
No dynamic scoring here — and it’s not clear which way the sum effect would go: Very high marginal tax rates vs. universal health care and other potentially labor supply enhancing policies.


April 13, 2016
Rich States, Poor States, 2016 Is Out
Arthur Laffer, Stephen Moore and Jonathan Williams strike again in this year’s installment of RSPS. According to their report, Utah’s prospects are the best, and Wisconsin’s outlook has risen to #9. Should the residents of these states rejoice?
Well, if the more highly ranked a state was according to ALEC, the faster the state’s growth, then there might be cause. Let’s look at 2015 growth (relative to national) and the ALEC ranking in 2014.
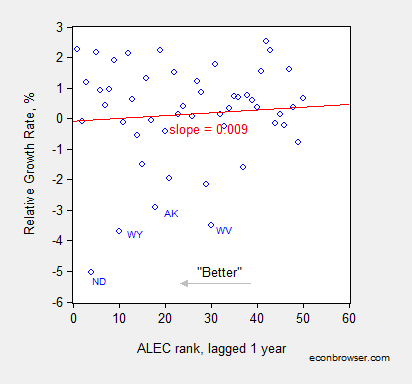
Figure 1: Growth rate of state relative to US coincident index, % versus ALEC rank, lower number is better. Red line is OLS regression line. Source: Philadelphia Fed, RSPS, author’s calculations.
Instead of the expected (at least by Arthur Laffer et al.) negative slope, OLS yields a postive (but statistically insignificant) slope coefficent. Omitting the outliers of WY, AK, ND, WV doesn’t change this basic result. The adjusted R2 is negative either way — there is essentially no explanatory power associated with the ALEC rankings.
The basic finding is unchanged if one considers GDP and/or different time horizons, as discussed in this post.
All this makes me wonder — exactly how much is ALEC paying Messrs. Laffer, Moore and Williams for this “analysis”?
April 12, 2016
“Global Growth: Too Slow for Too Long”
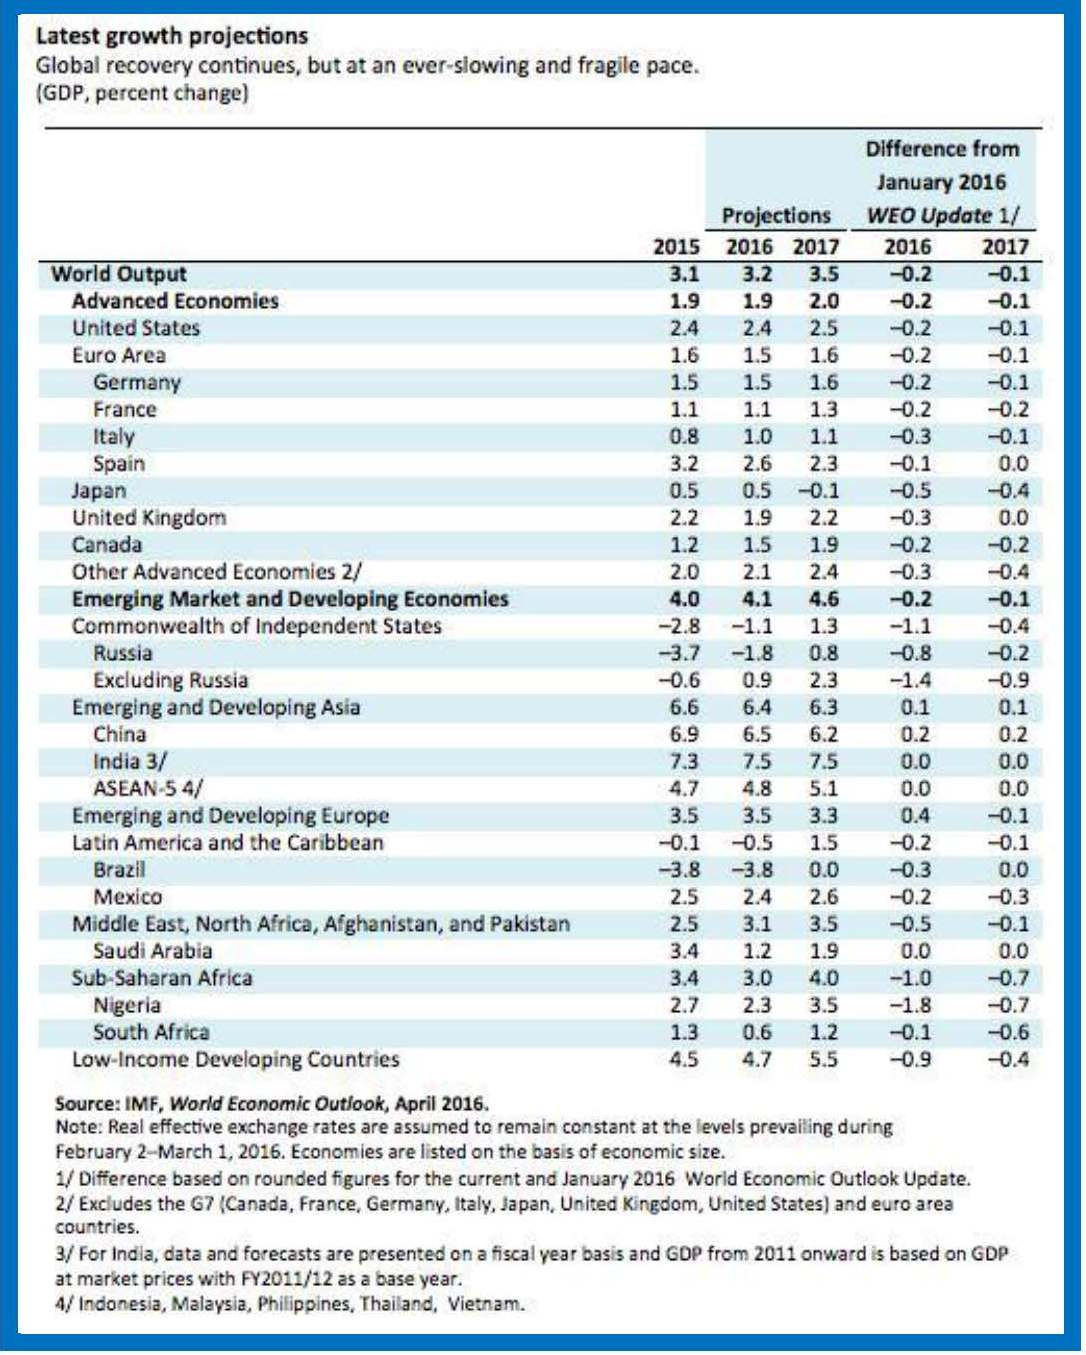
That is the title of a post by Maury Obstfeld, Chief Economist at the IMF, on the occasion of the release of the April 2016 World Economic Outlook forecasts.
Global growth continues, but at an increasingly disappointing pace that leaves the world economy more exposed to negative risks. Growth has been too slow for too long.
The new World Economic Outlook released today anticipates a slight acceleration in growth this year, from 3.1 to 3.2 percent, followed by 3.5 percent growth in 2017. Our projections, however, continue to be progressively less optimistic over time.
The downgraded forecasts reflect a broad-based slowdown across all countries. …
The central scenario that the World Economic Outlook projects, however, now looks less likely compared with possible less favorable outcomes. …
What risks concern us the most? Prominent among them are financial and non economic risks?
For the answer, see the post; forecasts are shown below:
US Financial Openness under a President Trump
Mr. Trump has proposed blocking remittances of illegally earned wages to Mexico as a means of inducing Mexico to pay for a border wall. What does this imply for financial openness?
As argued by O’Grady in the Wall Street Journal:
If Mexico refused to pay, under the Trump plan the U.S. government would invoke the revised Patriot Act to begin prohibiting aliens in the U.S. from wiring money unless they could prove that they are in the country legally.
A rewrite of the Patriot Act is the prerogative of Congress and an attempt by the executive to do it would be challenged in court and probably ruled illegal. But even if it were not, it is absurd to think that it will stop the flow of dollars to Mexico.
The most obvious way around the new provision would be for those who can prove legal residency to send the money for those who cannot. But wire transfers are only one way of moving money. It could also be deposited in a U.S. bank and withdrawn from automatic teller machines in Mexico by intended recipients.
The only way Mr. Trump might inhibit the flow of dollars to Mexico via the formal banking system would be to impose targeted capital controls. But that’s likely to violate U.S. obligations under a variety of international agreements.
I thought it interesting to compare the degree of financial openness as of 2013 (latest available data) to that implied under a closure of current account and capital account, as tabulated in the Chinn-Ito financial openness measure. This is shown in Figure 1.
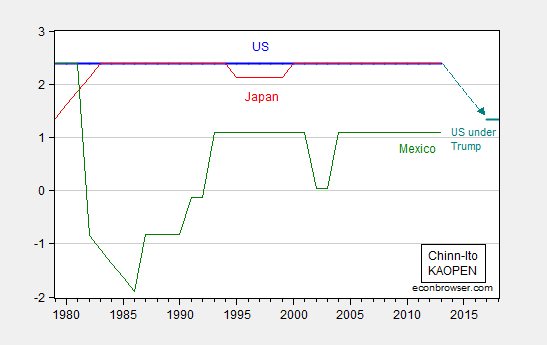
Figure 1: KAOPEN index for US (blue), Japan (red), and Mexico (green), and under Trump proposal assuming remittance controls and capital account measures (teal). Higher values denote more openness. Source: Chinn-Ito and author’s calculations.
In this sense, Mr. Trump’s proposals could bring the US and Mexico together, at least insofar as measured financial openness goes. US openness would decline from maximal values to those currently ascribed to Mexico.
The Chinn-Ito index is a fairly coarse measure of financial openness. The Fernandes et al. (2015) index (described in this post, data here), based upon the finer categorizations in the IMF’s AREAER would probably provide a different measure of openness depending on the extent and nature of the controls imposed.
For more discussion of the likely effects of Mr. Trump’s proposal, see here.
April 11, 2016
Guest Contribution: “The Bank of Japan Does Not Intervene in FX These Days”
Today we are pleased to present a guest contribution written by Jeffrey Frankel, Harpel Professor of Capital Formation and Growth at Harvard University, and former Member of the Council of Economic Advisers, 1997-99.
There has been recent speculation that the Japanese authorities might intervene to push down the yen. One can see the reasoning. The yen has appreciated against the dollar by about 9 per cent this year, even though the fundamentals have gone the other way: weak growth and renewed easing of monetary policy.
Saturday’s Financial Times even cites BNY Mellon as saying of the Bank of Japan, “Since mid-1993, they have on average intervened once every 20 trading days in dollar-yen.” But this is misleading. The period of frequent intervention was in the 1980s and 1990s. The Japanese have rarely intervened in the foreign exchange market since 2004. The last time was in 2011, in cooperation with the US and others, to dampen a strong appreciation of the yen that came in the aftermath of the Tohoku earthquake and tsunami.
The G-7 partners in February 2013 agreed to refrain from foreign exchange intervention in a US-led effort to short-circuit fears of competitive depreciation (“currency wars”). It strikes me as unlikely that Japan would intervene now without the cooperation of the US and other G-7 partners; and unlikely that the latter would agree at the current juncture.
This post written Jeffrey Frankel.
April 10, 2016
Why no economic boost from lower oil prices?
Many analysts had anticipated that a dramatic drop in oil prices such as we’ve seen since the summer of 2014 could provide a big stimulus to the economy of a net oil importer like the United States. That doesn’t seem to be what we’ve observed in the data.
There is no question that lower oil prices have been a big windfall for consumers. Americans today are spending $180 B less each year on energy goods and services than we were in July of 2014, which corresponds to about 1% of GDP. A year and a half ago, energy expenses constituted 5.4% of total consumer spending. Today that share is down to 3.7%.

Consumer purchases of energy goods and services as a percentage of total consumption spending, monthly 1959:M1 to 2016:M2. Blue horizontal line corresponds to an energy expenditure share of 6%.
But we’re not seeing much evidence that consumers are spending those gains on other goods or services. I’ve often used a summary of the historical response of overall consumption spending to energy prices that was developed by Paul Edelstein and Lutz Kilian. I re-estimated their equations using data from 1970:M7 through 2014:M7 and used the model to describe consumption spending since then. The black line in the graph below shows the actual level of real consumption spending for the period September 2013 through February of 2016, plotted as a percent of 2014:M7 values. The blue line shows the forecast of their model if we assumed no change in energy prices since then, while the green line indicates the prediction of the model conditional on the big drop in energy prices that we now know began in July of 2014.
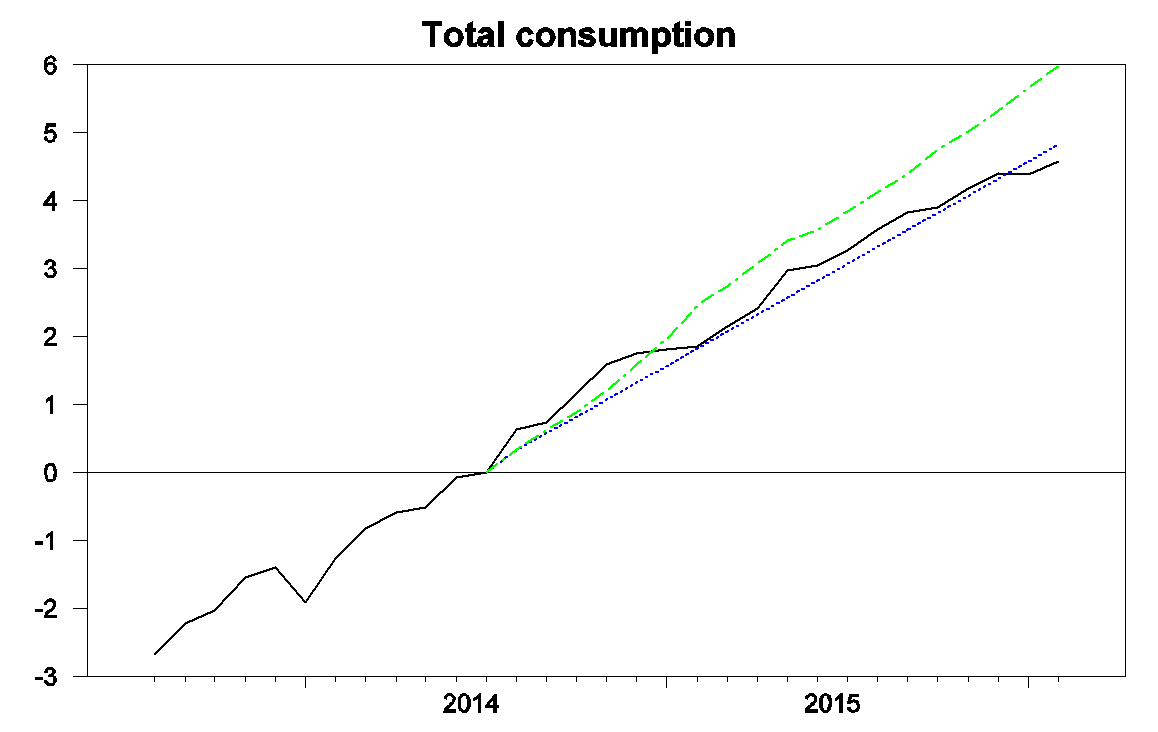
Black: 100 times the natural log of real consumption spending, 2013:M9 to 2016:M2, normalized at 0 for 2014:M7. Blue: forecast from an updated Edelstein and Kilian vector autoregression using only data as of 2014:M7. Green: forecast from the vector autoregression conditioning on observed energy prices over 2014:M8 to 2016:M2.
These calculations suggest that while there was a modest boost in spending in the second half of 2014 and first half of 2015, it was significantly less than would have been predicted from the historical relation between spending and energy prices. Moreover, any boost seems to have completely vanished by this point, with actual consumption even a little below what would have been predicted had there been no drop in energy prices at all.
A study of individual credit and debit card transactions by JP Morgan Chase Institute found that at the individual level, consumers did seem to be spending most of the windfall on other items. Their evidence for this was that if you compared the spending of an individual who had formerly had a big share of their budget going to gasoline with someone who did not, you saw the spending by the first person rise relative to the second by almost the full amount of the first person’s gain. The reconciliation between this micro evidence, which suggests that consumers did spend much of the windfall, and the macro evidence, which shows no evidence of a significant increase overall, is that there were other factors besides oil prices that were holding everybody’s consumption back, such as slower income growth and more precautionary saving. Spending by households with big gasoline expenses may have risen relative to other households at the same time that the average spending by all households came in close to trend. These aggregate factors show up as part of the “error term” in regression models like Edelstein and Kilian’s. If that’s the right way to interpret this, it means that aggregate consumption spending did get a boost from lower oil prices in the sense that we would have seen much more anemic growth of spending had oil prices not come down so dramatically.
On the other hand, there can be little debate that lower oil prices have meant a major hit to the incomes of U.S. oil producers. One place that this is starting to show up in the GDP numbers is in capital expenditures. Spending on mining exploration, shafts, and wells was contributing $146 B at an annual rate to U.S. GDP in the second and third quarters of 2014. By the end of 2015 that number was down to $65 B, a drop of about half a percent of GDP.
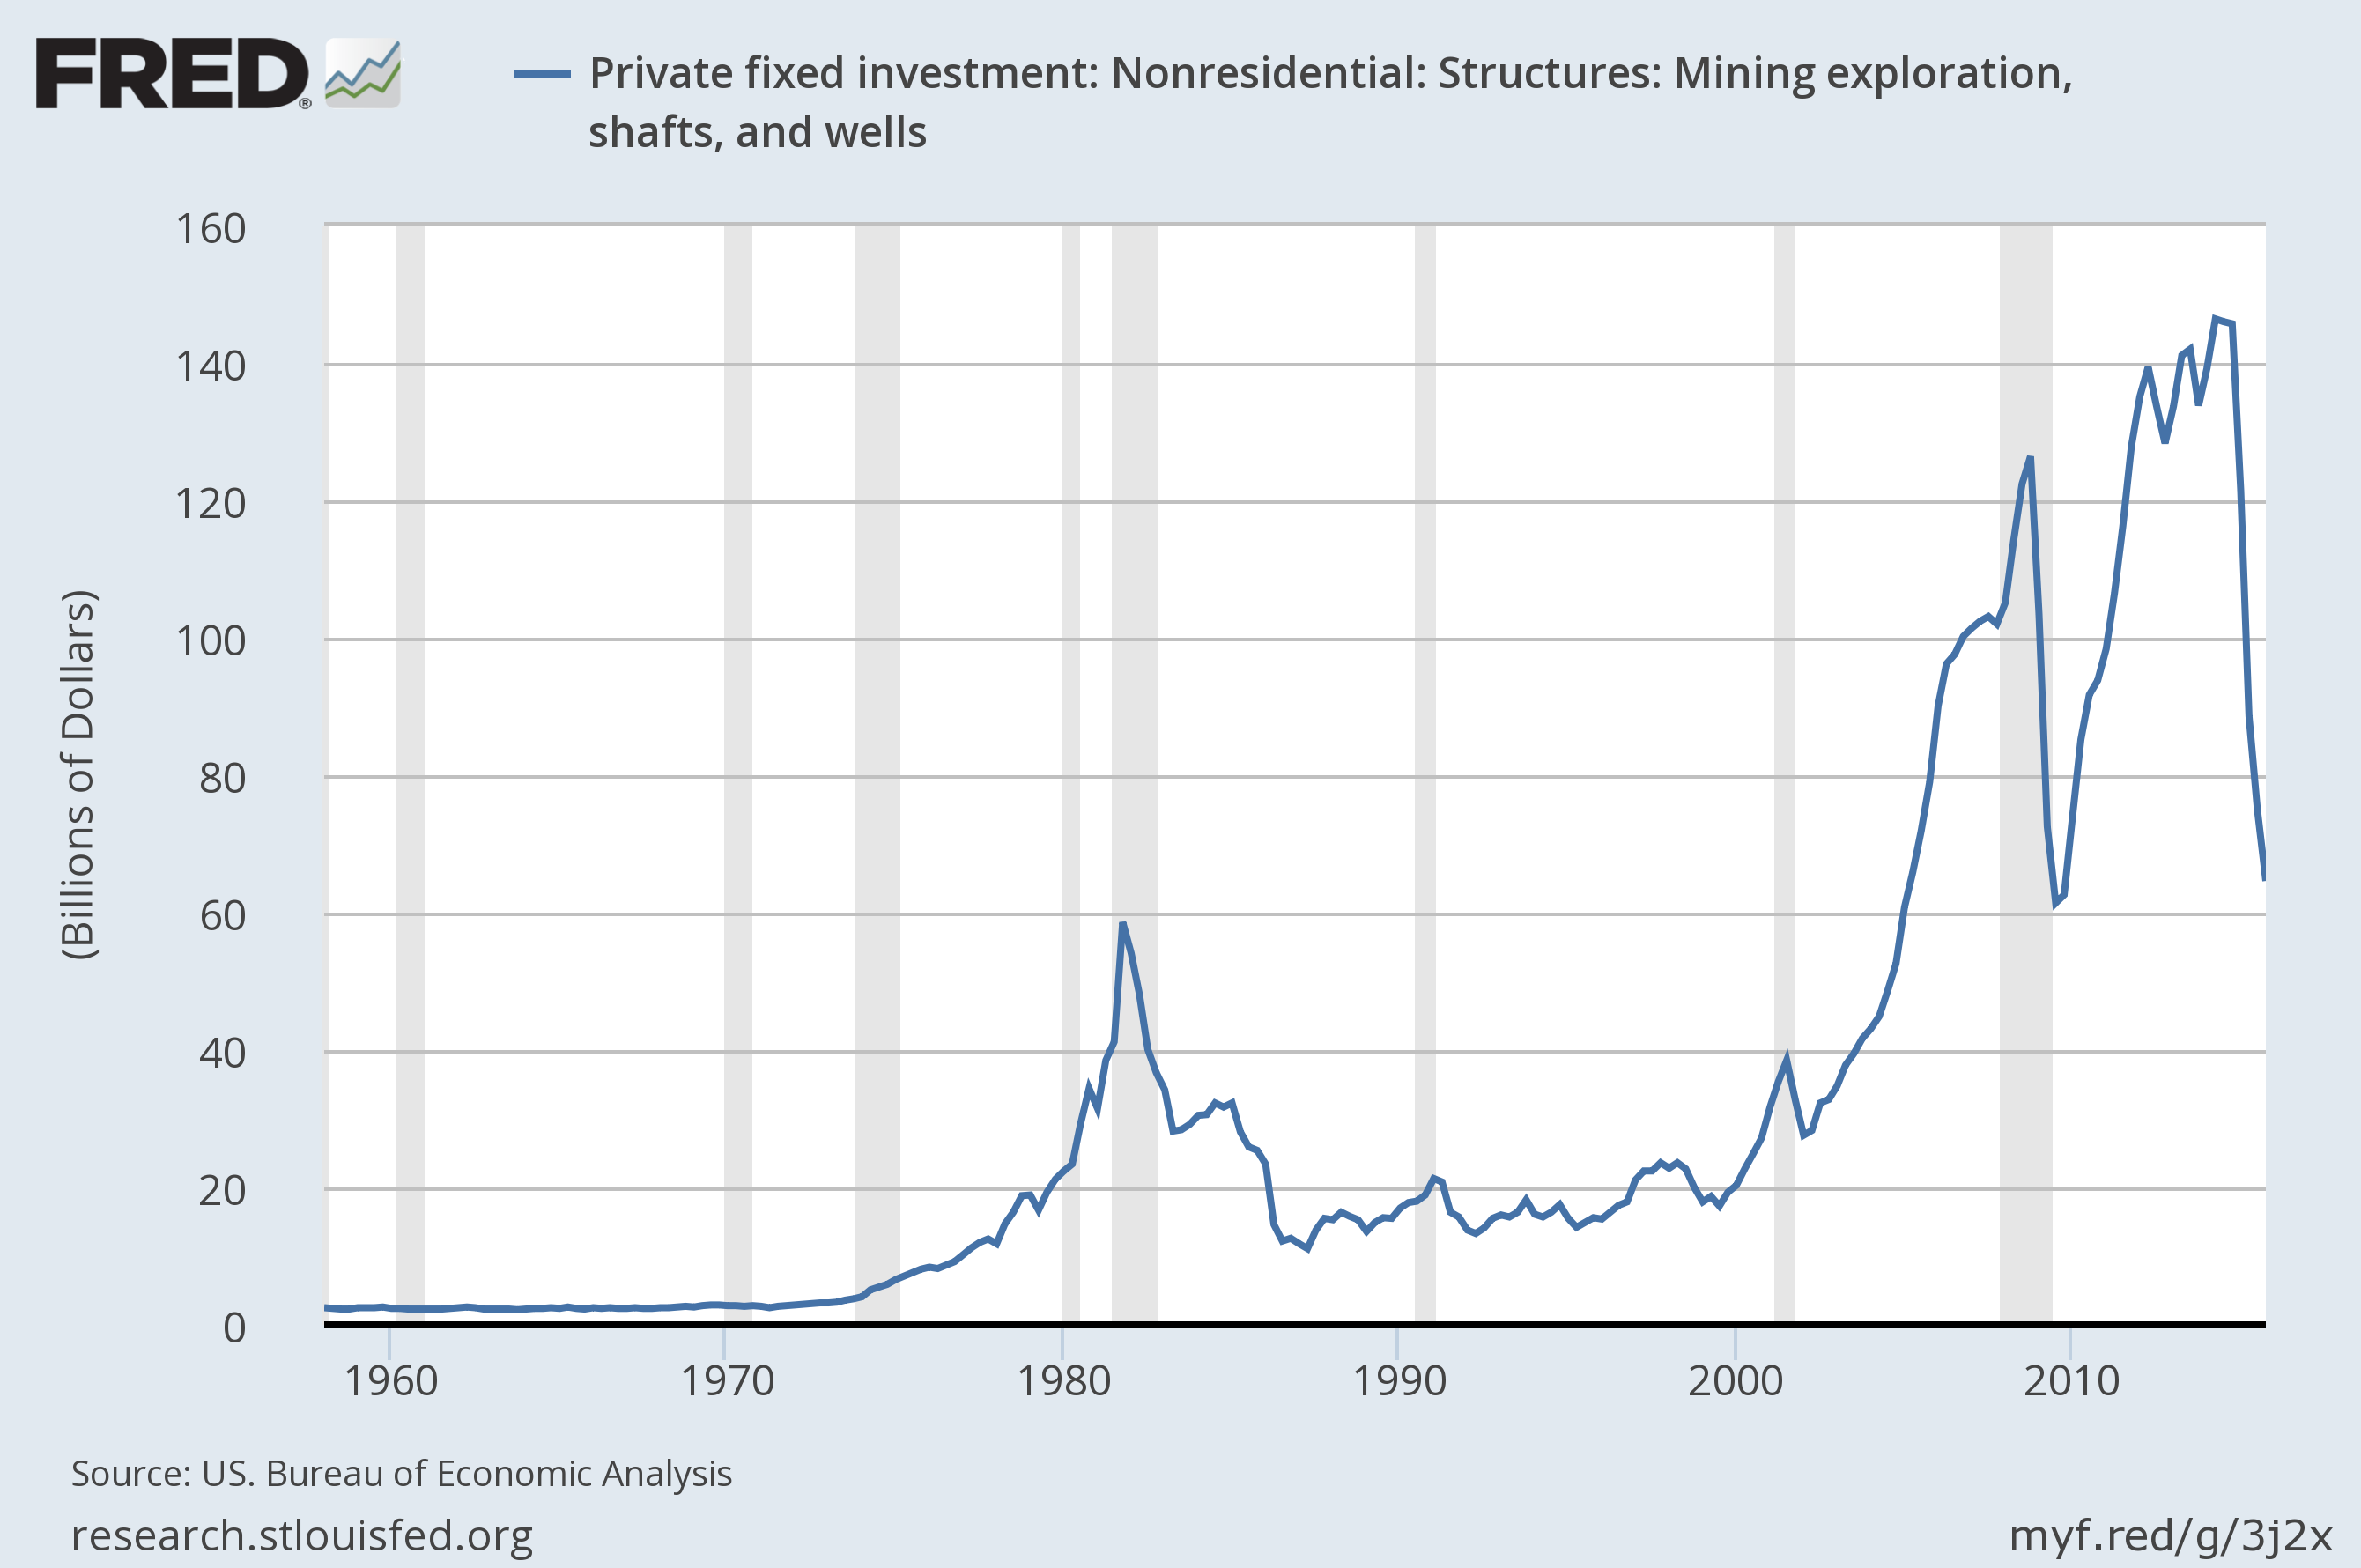
Expenditures on private fixed nonresidential structures investment in mining exploration, shafts, and wells. Source: FRED.
So far the resulting drops in U.S. oil production have been relatively modest. But I am expecting a significant decline for 2016, and that will be an additional direct drag on U.S. real GDP when it happens. Feyrer, Mansur, and Sacerdote estimated that the fracking boom caused the number of Americans working to be 3/4 of a million higher and the unemployment rate to be 0.5% lower during the Great Recession than it otherwise would have been. We’re about to watch that process operate in reverse.
If the U.S. were not a net importer, then even if the added spending by consumers was exactly equal to the reduced spending by producers, the result could still end up being a net drop in GDP. The reason is that if I buy another restaurant meal in New York, that’s not much help to someone who was counting on selling sand (or for that matter even restaurant meals) to frackers in Texas. As enterprises that were selling items to those working in oil production see a drop in their demand, they may end up laying off some of their own workers. As a result of those layoffs, the net loss in Texas could exceed the gains in New York. In a 1988 paper I showed that in an economy that produced all its own oil, an oil price decline could lead to higher total unemployment, in part because it takes time for people in the oil-producing regions to move to the areas where the jobs are now available.
For a net oil importer like the United States, the direct dollar gains to consumers exceed the dollar losses to domestic producers. Even so, multiplier effects from displaced workers and capital in the oil sector could end up eating away at some of those net gains. When oil prices collapsed in 1986 we saw no boom in the national U.S. economy, and in fact Texas and other oil-producing states experienced their own recession.
On the other hand, when oil prices spike up rapidly the result is unemployed labor and capital in sectors like autos and their suppliers. Furthermore, in the days before fracking there was a much longer lead time between an increase in oil prices and an increase in spending by oil producers. The result was an unambiguous net negative shock to GDP from a big upward spike in oil prices. The oil price shocks of 1973, 1979, 1980, 1990, and 2007 were all followed by economic recessions. In a recent paper I surveyed a number of academic studies that concluded that while a sharp increase in oil prices can reduce U.S. GDP growth, it’s harder to see evidence of significant net gains for U.S. GDP from a sharp decline in oil prices
It looks like we’ve just added some more data to support that conclusion.
April 8, 2016
Data Baking?
Ironman of Political Calculations asserts that my use of Philadelphia Fed coincident indices is misleading, particularly in reference to Kansas’s performance is my attempt to overstate the poor performance of that state’s economy. He argues that one should use a comprehensive measure, like gross domestic product — so without further ado, let’s compare Kansas relative performance using both measures.
Figure 1 depicts the Kansas/US ratios, where an increase denotes an improvement in Kansas’s performance relative to the US.
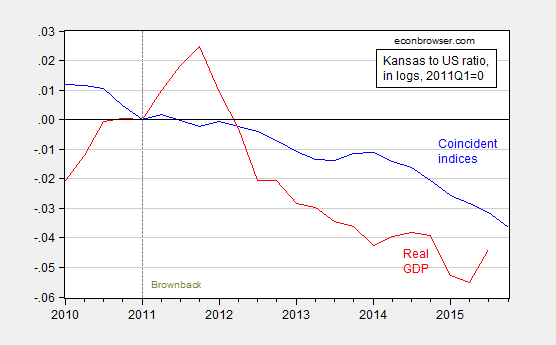
Figure 1: Log coincident index for Kansas divided by US (blue), and log GDP for Kansas divided by US (red), both normalized to 2011Q1. Dashed line at 2011Q1, accession of Governor Brownback. Source: BEA, author’s calculations.
Note that performance measured using Ironman’s preferred measure, state GDP, is 1.3% percentage points worse (in log terms) than using coincident indices, as of 2015Q3 (latest available data).
Ironman has also criticized me for attributing to Governor Brownback’s policies effects on Kansas economic activity that should properly be attributed to the drought. Figure 2 depicts Kansas relative performance (4 quarter change in log ratio Kansas to US GDP), and the Palmer Drought Severity Index (PDSI), where lower values denote worse drought. A priori, one expects a positive correlation.
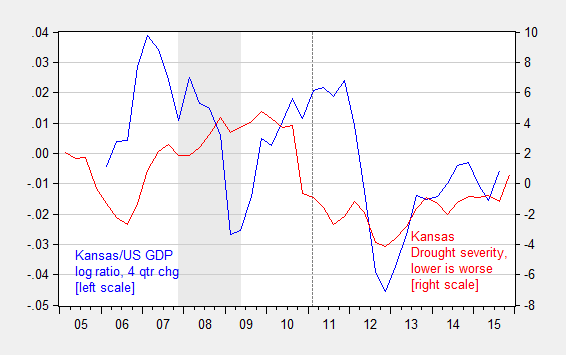
Figure 2: Four quarter difference in log ratio of Kansas GDP to US GDP (blue, left scale), and Palmer Drough Severity Index, quarterly average of monthly data (PDSI) (red, right scale). Source: BEA, NOAA, NBER, and author’s calculations.
The astute observer will note that there is a pretty poor correlation between relative growth of Kansas and the drought index. More formally, run a regression over the 2005Q3-2015Q3 period:
ΔyKSt = -0.001 + 0.106 ΔyKSt-1 + 1.300ΔyUSt + 0.0006PDSIt + ut
Adj-R2 = 0.45, NObs = 41, SER = 0.009, DW=1.65. bold denotes significance at the 10% msl, using HAC robust standard errors.
Note that the drought index coefficient is not statistically significant. I’m sure with enough work, I could get it to be statistically signficant in some specification. In any case, it doesn’t pop out easily.
Actually, this is the second time that Ironman has raised the drought excuse. I responded in an addendum to this post. In that case, Kansas was underperforming, even after taking into account the drought. Ironman never responded to that result.
This is not a defense of using the Philadelphia Fed coincident indices in all cases; this 2013 FRB Philadelphia document details the fact that the indices do not track certain states’ GDPs (particularly commodity dependent ones). Kansas actually has a fairly high correlation, at 0.55-0.70.
So much for today’s specious statistical critique debunking. See also this post for a previous installment.
April 7, 2016
Revised Coincident Indices for the Midwest: Wisconsin at the Back of the Pack!
Again.
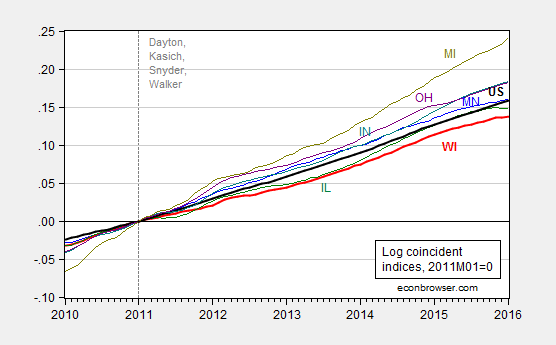
Figure 1: Log coincident indices for Minnesota (blue), Wisconsin (red), Illinois (green), Indiana (teal), Ohio (purple), Michigan (chartreuse), US (black), all normalized 2011M01=0. Source: Philadelphia Fed, January 2016 release.
(The set of states is defined as SBA Region V, used in this critique in Political Calculations. See also this post.)
The cumulative gap between Minnesota and Wisconsin as of December 2015 has widened from 2% to 2.2%, going from the December 2015 to January 2016 vintage.
Note that Wisconsin continues to lag in performance relative to what correlations with the Nation would indicate. I estimate the long run relationship between Wisconsin and US economic activity from 1990M03 to 2009M06, and use that estimated model to dynamically simulate Wisconsin’s predicted level of activity (shown as the purple line in Figure 2 below).
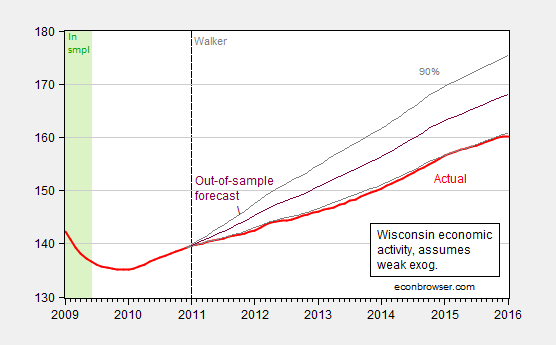
Figure 2: Wisconsin coincident index (red), forecast from ECM (black), and 90% confidence band (gray). Green shaded area denotes in-sample period. See this post for description of forecasting model; assumes weak exogeneity of US index. Source: Philadelphia Fed January 2016 release, and author’s calculations.
April 6, 2016
The Financial Regulatory Policies of Senator Sanders…Again
The ironies abound
As I’ve noted before, Senator Sanders has unique views on financial regulation. I’ve never quite understood the specifics of the “break up the banks” proposal, and after his interview with the New York Daily News and subsequent “clarification”, understood even less.
The Interview
Daily News: Okay. Well, let’s assume that you’re correct on that point. How do you go about doing it?
Sanders: How you go about doing it is having legislation passed, or giving the authority to the secretary of treasury to determine, under Dodd-Frank, that these banks are a danger to the economy over the problem of too-big-to-fail.
Daily News: But do you think that the Fed, now, has that authority?
Sanders: Well, I don’t know if the Fed has it. But I think the administration can have it.
Daily News: How? How does a President turn to JPMorgan Chase, or have the Treasury turn to any of those banks and say, “Now you must do X, Y and Z?”
Sanders: Well, you do have authority under the Dodd-Frank legislation to do that, make that determination.
Daily News: You do, just by Federal Reserve fiat, you do?
Sanders: Yeah. Well, I believe you do.
Daily News: So if you look forward, a year, maybe two years, right now you have…JPMorgan has 241,000 employees. About 20,000 of them in New York. $192 billion in net assets. What happens? What do you foresee? What is JPMorgan in year two of…
Sanders: What I foresee is a stronger national economy. And, in fact, a stronger economy in New York State, as well. What I foresee is a financial system which actually makes affordable loans to small and medium-size businesses. Does not live as an island onto themselves concerned about their own profits. And, in fact, creating incredibly complicated financial tools, which have led us into the worst economic recession in the modern history of the United States.
Daily News: I get that point. I’m just looking at the method because, actions have reactions, right? There are pluses and minuses. So, if you push here, you may get an unintended consequence that you don’t understand. So, what I’m asking is, how can we understand? If you look at JPMorgan just as an example, or you can do Citibank, or Bank of America. What would it be? What would that institution be? Would there be a consumer bank? Where would the investing go?
Sanders: I’m not running JPMorgan Chase or Citibank.
Daily News: No. But you’d be breaking it up.
Sanders: That’s right. And that is their decision as to what they want to do and how they want to reconfigure themselves. That’s not my decision. All I am saying is that I do not want to see this country be in a position where it was in 2008, where we have to bail them out. And, in addition, I oppose that kind of concentration of ownership entirely.
You’re asking a question, which is a fair question. But let me just take your question and take it to another issue. Alright? It would be fair for you to say, “Well, Bernie, you got on there that you are strongly concerned about climate change and that we have to transform our energy system away from fossil fuel. What happens to the people in the fossil fuel industry?”
That’s a fair question. But the other part of that is if we do not address that issue the planet we’re gonna leave your kids and your grandchildren may not be a particularly healthy or habitable one. So I can’t say, if you’re saying that we’re going to break up the banks, will it have a negative consequence on some people? I suspect that it will. Will it have a positive impact on the economy in general? Yes, I think it will.
Daily News: Well, it does depend on how you do it, I believe. And, I’m a little bit confused because just a few minutes ago you said the U.S. President would have authority to order…
Sanders: No, I did not say we would order. I did not say that we would order. The President is not a dictator.
Daily News: Okay. You would then leave it to JPMorgan Chase or the others to figure out how to break it, themselves up. I’m not quite…
Sanders: You would determine is that, if a bank is too big to fail, it is too big to exist. And then you have the secretary of treasury and some people who know a lot about this, making that determination. If the determination is that Goldman Sachs or JPMorgan Chase is too big to fail, yes, they will be broken up.
Daily News: Okay. You saw, I guess, what happened with Metropolitan Life. There was an attempt to bring them under the financial regulatory scheme, and the court said no. And what does that presage for your program?
Sanders: It’s something I have not studied, honestly, the legal implications of that.
…
Daily News: Okay. But do you have a sense that there is a particular statute or statutes that a prosecutor could have or should have invoked to bring indictments [against the banks for fraudulent activities]?
Sanders: I suspect that there are. Yes.
Daily News: You believe that? But do you know?
Sanders: I believe that that is the case. Do I have them in front of me, now, legal statutes? No, I don’t. But if I would…yeah, that’s what I believe, yes. When a company pays a $5 billion fine for doing something that’s illegal, yeah, I think we can bring charges against the executives.
Daily News: I’m only pressing because you’ve made it such a central part of your campaign. And I wanted to know what the mechanism would be to accomplish it.
….
Critique and Response
There has been substantial reportage on whether Senator Sanders knows the specifics of what he has in mind for breaking up the banks. Strangely, he seems to indicate that it’s not up to the regulators to determine the nature of the break-ups, rather it’s up the the entities themselves into what parts they’ll be cut up into. That’s only one of the oddities. The other is the dispute over whether new legislation is — or is not — required to effect the break up of the banks. Perhaps in response to the furor over Sanders’s apparent confusion (“pretty close to a disaster”, “How much does Bernie Sanders know…”, charitable view here), the Sanders campaign released this statement today:
“Within the first 100 days of his administration, Sen. Sanders will require the secretary of the Treasury Department to establish a “Too-Big-to Fail” list of commercial banks, shadow banks and insurance companies whose failure would pose a catastrophic risk to the United States economy without a taxpayer bailout.
“Within a year, the Sanders administration will work with the Federal Reserve and financial regulators to break these institutions up using the authority of Section 121 of the Dodd-Frank Act.
“Sen. Sanders will also fight to enact a 21st Century Glass-Steagall Act to clearly separate commercial banking, investment banking and insurance services. Secretary Clinton opposes this extremely important measure.
When I read this press release, then I became really confused.
Why Do We Need a President Sanders to Break Up the Banks?
It is interesting that Senator Sanders does not go into the details of Section 121. Section 121 is all about the Board of Governors of the Federal Reserve, exactly the entity that Bernie Sanders wants to audit. Here is the relevant text of Section 121 of the Dodd-Frank Act:
Dodd Frank Act Section 121
SEC. 121. MITIGATION OF RISKS TO FINANCIAL STABILITY.
(a) MITIGATORY ACTIONS.—If the Board of Governors determines that a bank holding company with total consolidated assets of $50,000,000,000 or more, or a nonbank financial company supervised by the Board of Governors, poses a grave threat to the financial stability of the United States, the Board of Governors, upon an affirmative vote of not fewer than 2/3 of the voting members of the Council then serving, shall—
(1) limit the ability of the company to merge with, acquire, consolidate with, or otherwise become affiliated with another company;
(2) restrict the ability of the company to offer a financial product or products;
(3) require the company to terminate one or more activities;
(4) impose conditions on the manner in which the company conducts 1 or more activities; or
(5) if the Board of Governors determines that the actions described in paragraphs (1) through (4) are inadequate to mitigate a threat to the financial stability of the United States in its recommendation, require the company to sell or otherwise transfer assets or off-balance-sheet items to unaffiliated entities.
So, Senator Sanders plans to delegate to the Federal Reserve breaking up the banks? In that case, how does electing a President Sanders move foreward breaking up the banks if existing authority already allows the Fed to break up the banks. Or, does President Sanders intend to re-write the Federal Reserve Act so that he can direct the Fed to take specific actions at the President’s behest? That seems to be the logical implication.
The irony is that the Fed is exactly the entity that has been the focus of so much of the Senator’s ire, so much so that he joined Rand Paul in voting to Audit the Fed!!!!
Does Breaking Up the Banks Even Make Sense?
As various observers have noted, it is unclear that breaking up the big banks would make the US financial system more stable. Jeffrey Frankel has drawn up a diagram that shows what policies would actually help.
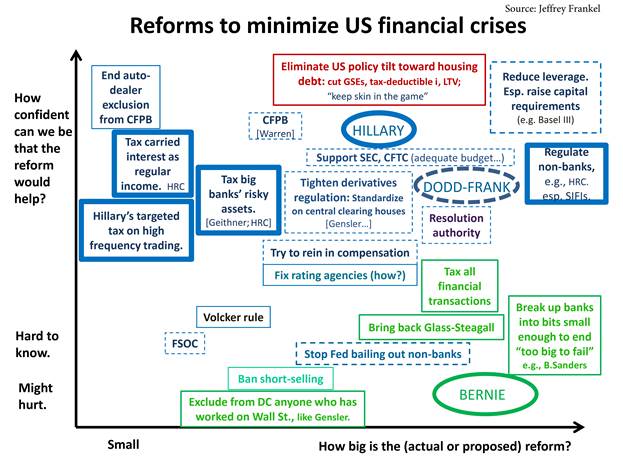
Source: Jeffrey Frankel.
In other words, most of the policies proposed by Senator Sanders would be largely diversions, rather than dealing with the problem of financial instability.
April 5, 2016
Guest Contribution: “Stagnant incomes of white workers do not explain Trump”
Today we are pleased to present a guest contribution written by Jeffrey Frankel, Harpel Professor of Capital Formation and Growth at Harvard University, and former Member of the Council of Economic Advisers, 1997-99.
The mainstream media are busily reproaching themselves for having been so out of touch with the economic troubles of angry white working men that they were late in taking Donald Trump’s presidential campaign seriously. Most of us can join in to admit that we were very slow to take Trump seriously. For one thing, we all thought that any candidate would be permanently derailed by even a small number of the many things that Trump has said. We used to call these gaffes — either the ones that seemed designed to alienate particular groups (Hispanics, women, etc.) or the ones that revealed his lack of familiarity with real-world issues.
But can the under-estimation of Trump’s candidacy really be attributed to inadequate appreciation of the economic troubles of American workers?
The increase in inequality is very real, particularly the stagnation over the last 40 years of wage income among low-skilled men (defined as those without college education). For many years, Democrats have made proposals to ameliorate the problem, while Republican presidential candidates have consistently pursued tax cuts for the rich as their number one policy response.
The puzzle is why anyone thinks that Donald Trump’s candidacy offers a break with this particular pattern. The problem is not that he himself inherited great wealth. The problem is rather that his policy proposals, such as they are, would not address the issue. He, like virtually all Republican candidates, proposes big tax cuts for the rich, with no way of paying for the lost revenue. But he has also said something that no candidate has ever said: “wages are too high.” He said it several times, including November 10, 2015, in the Republican presidential debate on Fox and November 11, on MSNBC’s Morning Joe. (He has also denied having said it. But the tapes are very clear. This is a pattern we have seen many times, of course. Sometimes he brazenly accuses the media of having made up the quote.)
The elite media have beaten themselves up over their eliteness many times before. Remember how, during the GWB years, journalists swallowed Karl Rove’s line that Republican votes were rising on a tide of middle-America family values? This was before people noticed that the red zip codes had higher rates of divorce, teenage pregnancy, and other apparent indicators of lack of personal responsibility than the blue zip codes.
I don’t claim to understand the remarkable Trump phenomenon. But whatever is the explanation, it is not a response by working white men that could have been logically predicted based on their stagnant incomes.
This post written by Jeffrey Frankel.
Menzie David Chinn's Blog


