
Menzie David Chinn's Blog, page 13
March 6, 2016
Senator Sanders and Financial Regulation
Today I was reminded that Senator Sanders voted against TARP. That made me conclude that Senator Sanders’ position on financial regulation is truly unique.
Here are the votes on TARP, “Audit the Fed” (discussed here), and Dodd-Frank, presented as a Venn diagram.

It’s obvious that Senator Sanders occupies a unique position in the financial regulatory policy terrain. (Unique is not necessarily the same as good, by the way).
Here’s my take at the time on the advisability of opposition to TARP


Spreads and Recession Watch, March 2016
Five Thirty Eight warns us to prepare for a recession; Wall Street Journal‘s Real Time Economics cautions “All Clear on Recession Risk? Not Yet”, even if the latest employment indicate continued growth. Time to review market indicators of the outlook.
Here’s the 10 year – 3 month spread, and the 10 year – 2 year spread.
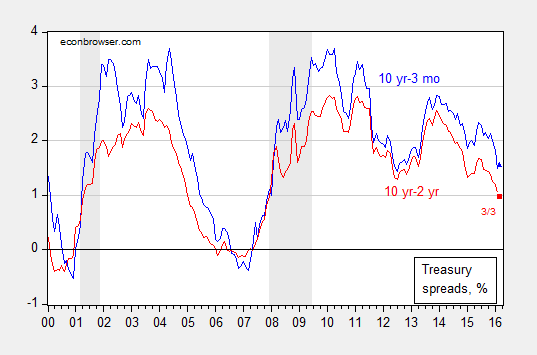
Figure 1: Ten year minus three month Treasury (secondary market) spread (blue), and ten year minus two year Treasury spread (red). NBER defined recession dates shaded gray. Source: Federal Reserve Board via FRED, NBER, author’s calculations.
Notice that while both spreads have shrunk considerably, they remain positive. As of 3/3, the ten year – three month spread was 1.53%. Plugging this value into the equation for predicting recessions, estimated over the period of the Great Moderation (see this post) yields an implied probability of recession of 6.7% (down from 9.3% based on the 2/11 spread).
Across the globe, most spreads are positive.
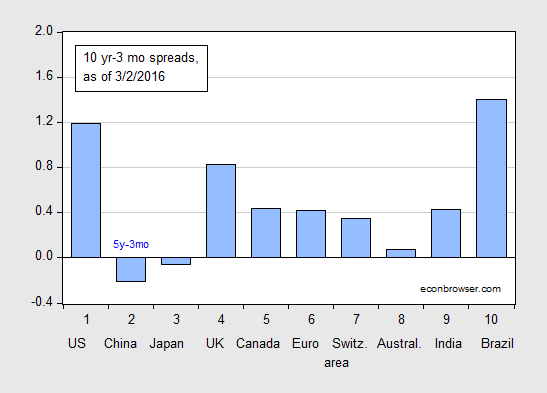
Figure 2: Ten year-three month term spreads, as of 3/2/2016 (blue bar). China observation is Five year-three month term spread. Euro ten year rate is for Germany. Source: Economist March 4th edition, and author’s calculations.
Contrast this with mid-April 2015, when many of the spreads were negative or near zero.
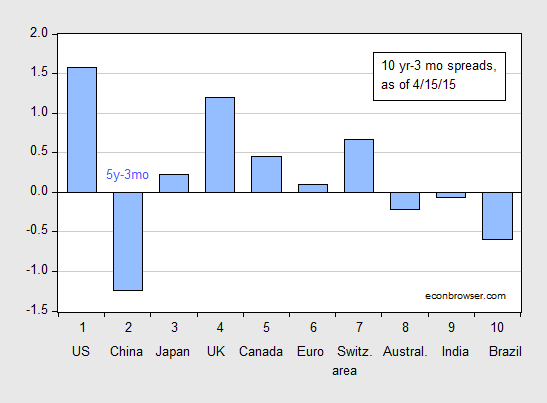
Figure 3: Ten year-three month term spreads, as of 4/15/2015 (blue bar). China observation is Five year-three month term spread. Euro ten year rate is for Germany. Source: Economist April 18th edition, and author’s calculations.
As noted in this post, there’s little evidence that inversions reliably predict recessions in these other countries. Note that one could argue that Brazil is in recession, while India did not experience one. Further, China’s inversion was steeper nearly a year ago than it is now.
Just because the yield curve does not signal an imminent recession in the US, and current employment growth continues, doesn’t mean we should stay the course on raising the Fed funds rate [1]. In particular, monetary conditions are already tightening as foreign investors (private and official sector) are decumulating their stocks of US Treasurys. Figure 1 shows that by December 2015, foreign holdings were essentially unchanged relative to December 2014.
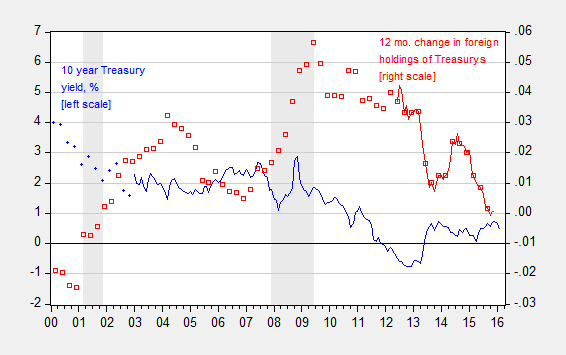
Figure 4: Real ten year yields, % (blue, left scale), change in foreign holdings of US Treasurys as a ratio to potential GDP (red, right scale). NBER defined recession dates shaded gray. Real yields are ten year constant maturity TIPS from 2002 onward, ten year minus ten year expected inflation from Survey of Professional Forecasters before; US Treasury holdings from Treasury, Fiscal Service via FRED, and TIC from 2011M06 onward, potential GDP from CBO Budget and Economic Outlook (Jan. 2016), interpolated to monthly via quadratic match.
In other words, the decumulation of emerging market foreign exchange holdings is showing up in a reduced pace of Treasurys acquisition. That’s not yet a decumulation of Treasury’s (that scenario’s impact is outlined in this post), at least as measured, but it might very well in the near future (and these TIC data are estimates; more reliable numbers on holdings will come out with the benchmark numbers).
March 4, 2016
Visualizing Textbook and Alternative Interpretations of the Friedman Analysis of the Sanders Economic Plan
Now that the dust has (kind of) settled on exactly what is and is not in Gerald Friedman’s interpretation of the Sanders economic plan, I thought it useful to contrast the textbook (at least the one I use, Olivier Blanchard/David Johnson‘s) view of how a fiscal stimulus works, versus that in which a one-time spending increase yields a permanent increase in output, in a graphical format.
Textbook
In Figure 1, I depict steady state with output at the natural level/potential GDP, and price level at P16 (to denote price level in FY2016). I assume for simplicity that the output gap is zero; I myself believe it’s somewhat smaller, maybe around -2 to -3 percentage points of potential GDP.
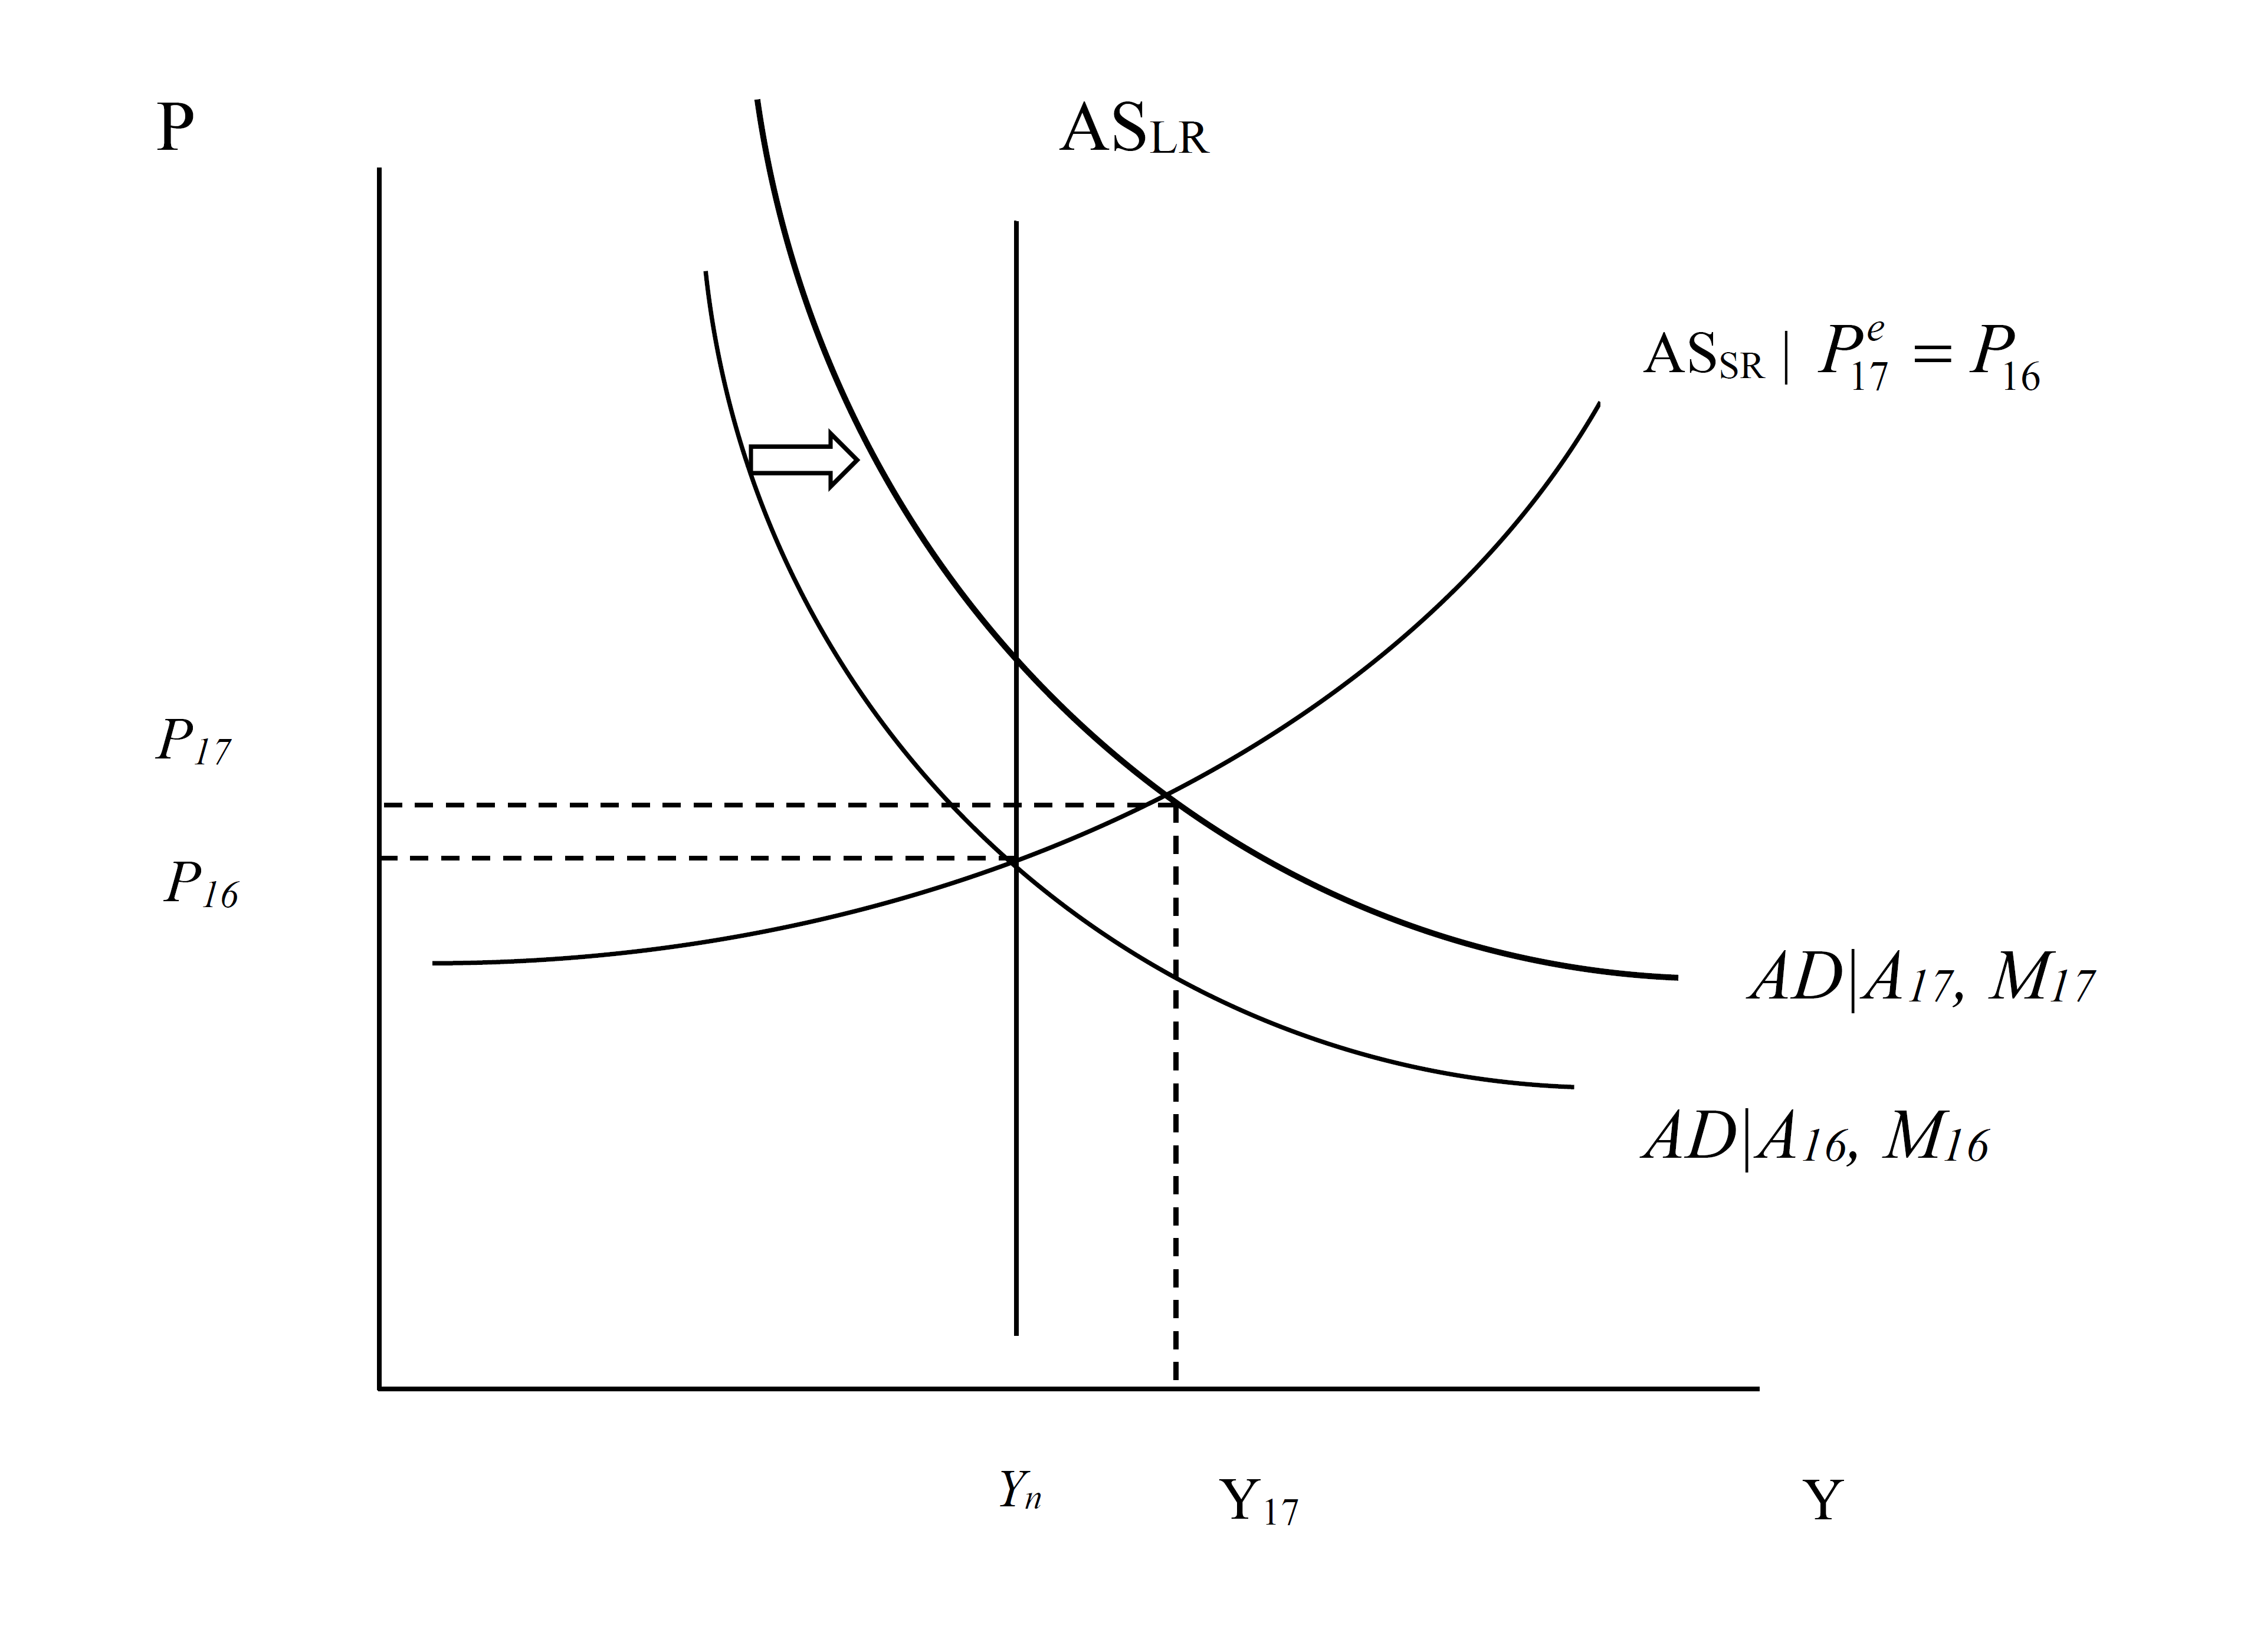
In FY2017, the AD curve is assumed to shift out due to an increase of government consumption and investment equal to about 0.8 percentage points of GDP; I assume this is a constant shift over the subsequent years, relative to where government spending was. The Fed accommodates somewhat, so part of the shift is due to increased money supply. The white arrow denotes the shift.
Notice that in the short output rises to FY18. Ignoring lags due to the spending multiplier taking time (the outside lag, in macro parlance), the AD curve stays where it is for the subsequent periods through FY2022.
Over time, note that the aggregate supply curve adjusts upward. That’s because price expectations are adaptive (either because the underlying expectations process is adaptive, or because of nominal rigidities and nominal contracts that prevent instantaneous price adjustment), so the expected price level ratchets upward. As this happens, the real money supply shrinks, pushing up interest rates, so that investment falls. There’s a movement along the AD curve, and finally the AS curve stops shifting when the natural level of output is restored. In this sense, the model is one where the economy is self correcting.
In this textbook model, a fiscal stimulus delivers a temporary — and not necessarily persistent — increase in output above potential. This pattern matches the outcome discussed in this post.
Now, Jamie Galbraith has a plea to take seriously alternative models, and I am glad to do so. Doing so allows one to highlight what has to be assumed in order to “make it work”.
An Alternative View
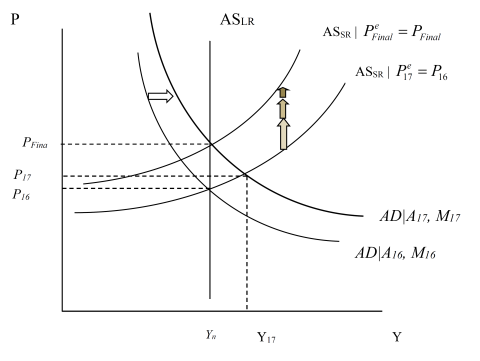
It has been hard to glean exactly what assumptions were built into Gerald Friedman’s assessment, although I believe Romer and Romer have identified some of the key issues. It has been yet harder to understand what is involved in the various defenses of the Friedman assumption that multipliers apply to the growth of government spending, and not the level. As I interpret it, Friedman’s defense invokes (strong) hysteresis effects. How can permanent output effects, with minor impacts on inflation, be derived from such a view? Once again a graph can be helpful (it strikes me odd that nobody’s done this in the blogosphere — this is what I do for my macro class…).
First, assume we have a large negative output gap. Assume the aggregate supply curve is fairly flat (perfectly flat would do even better, but it’s not absolutely necessary). Or at least to begin with the AS curve is flat a position of a large negative output gap (Friedman cites -11%).
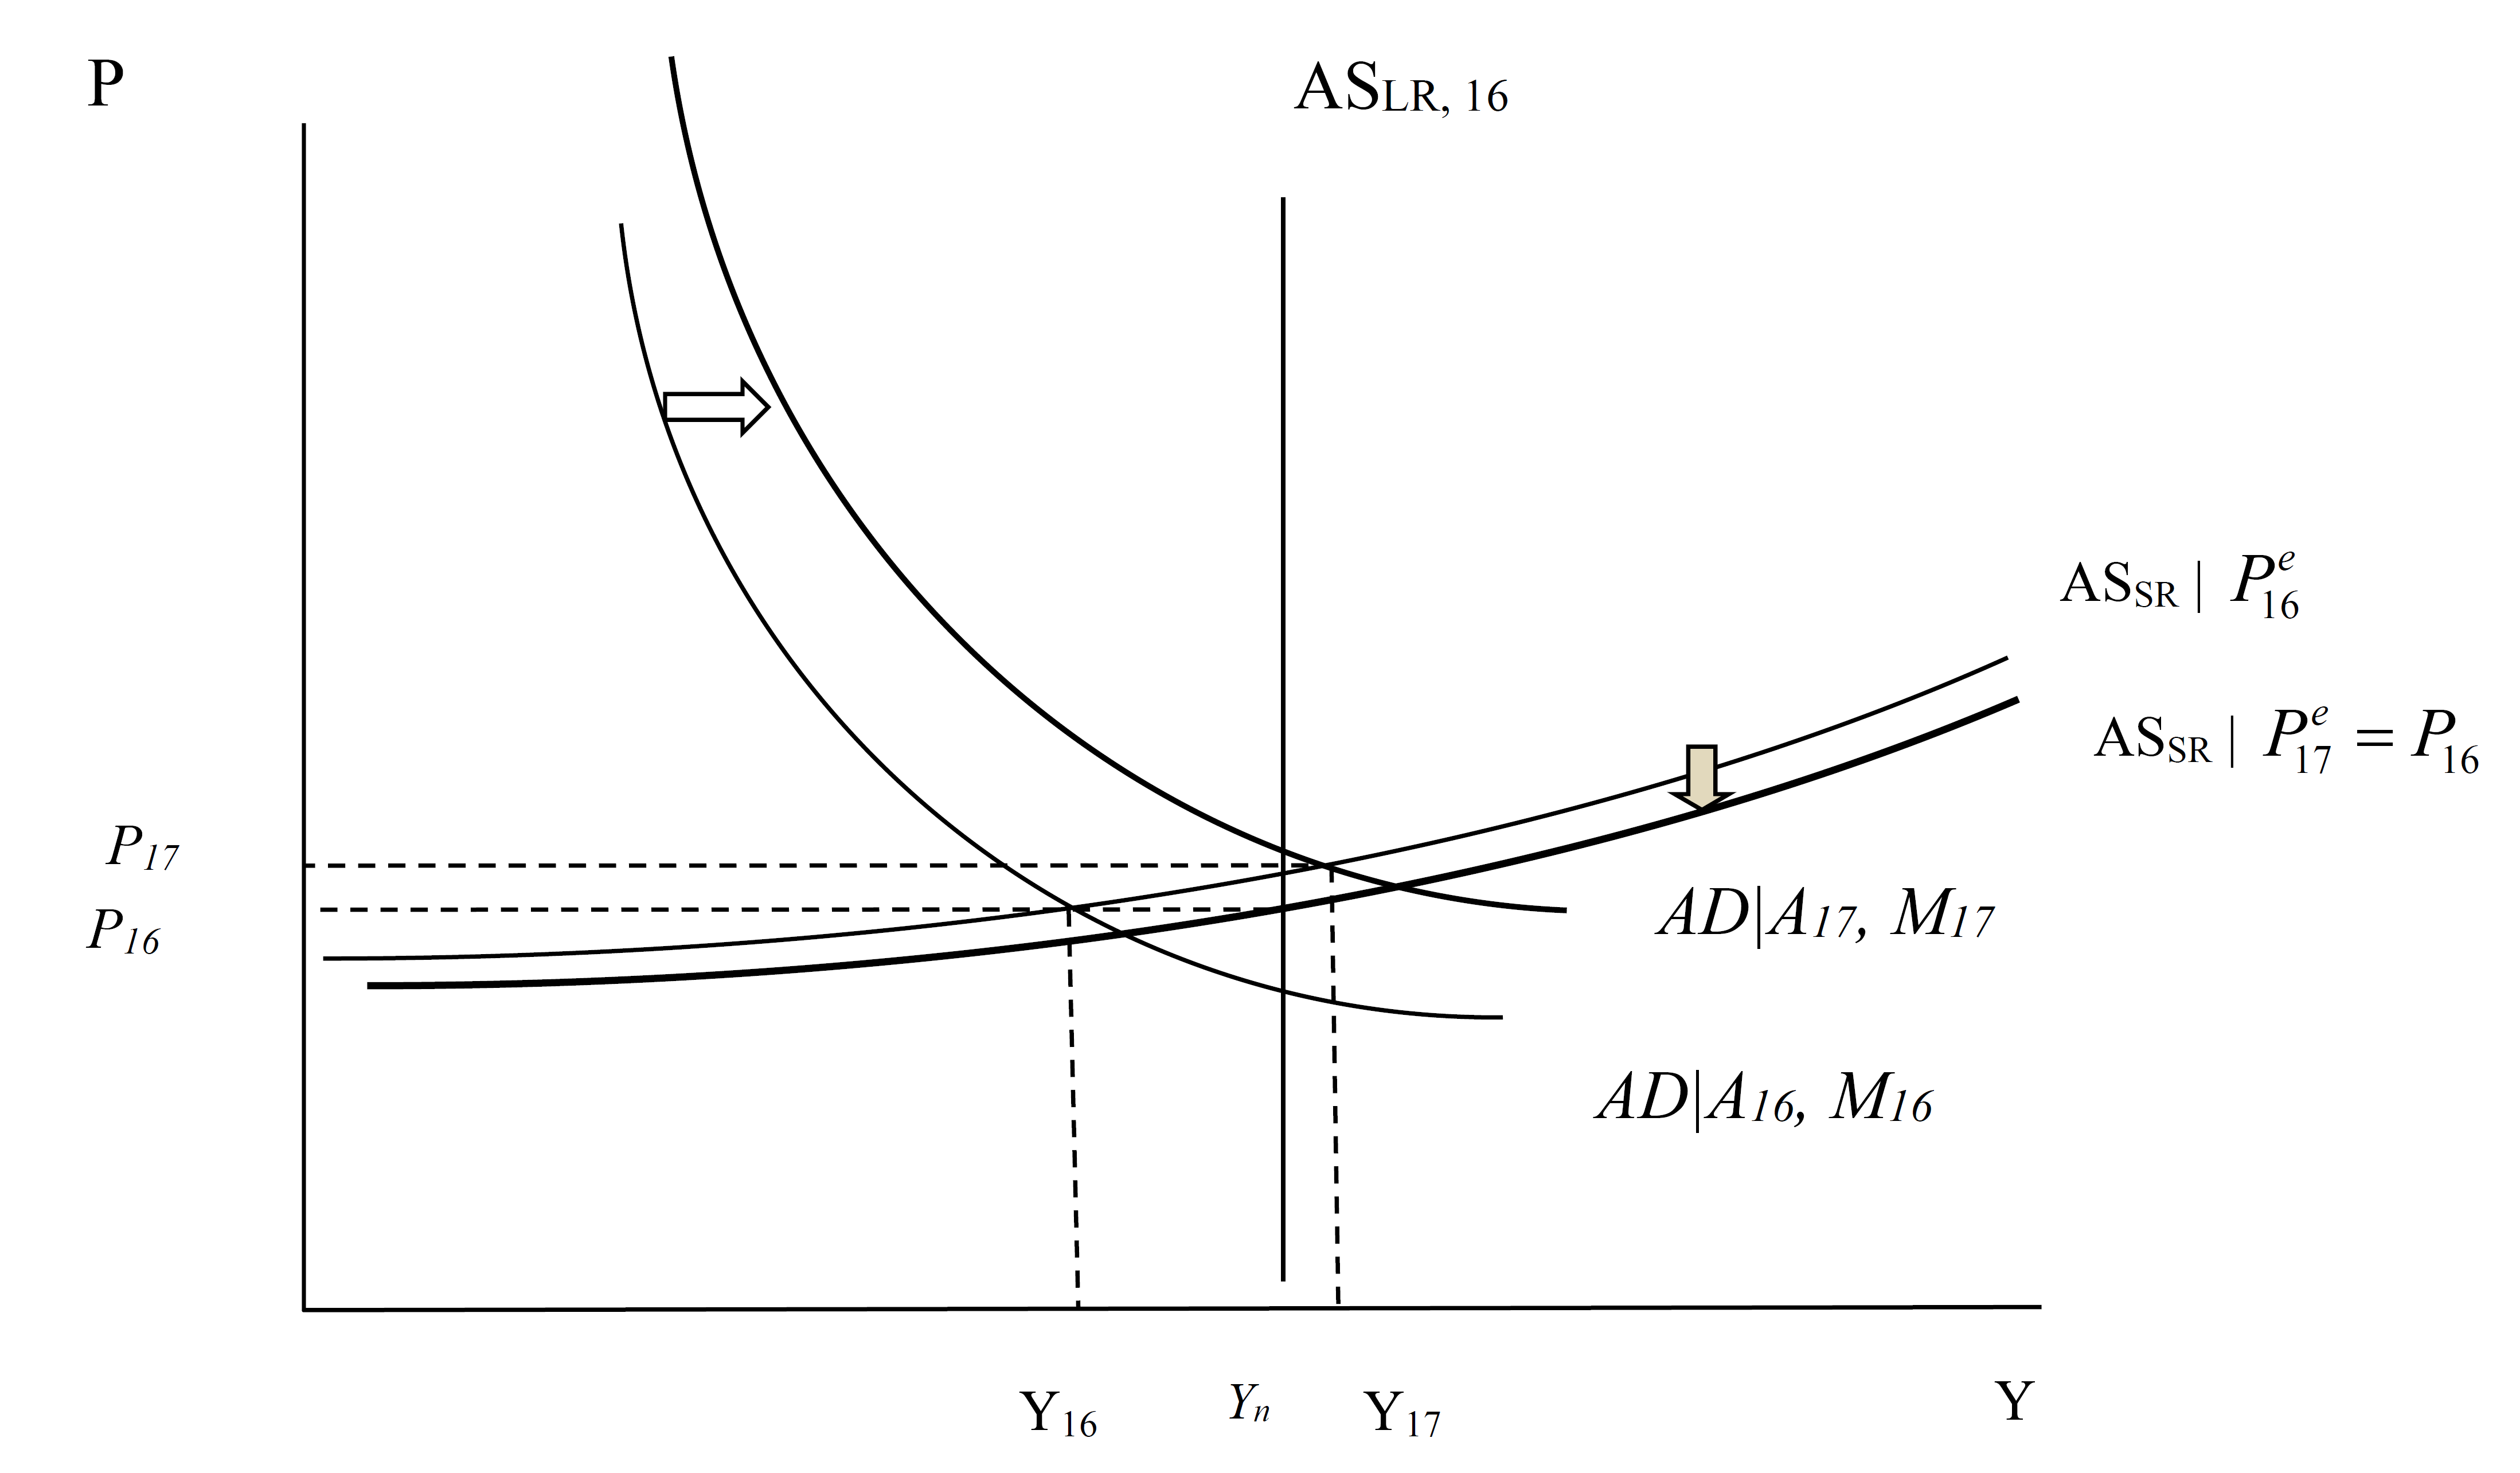
Then the increase in government spending that shifts out the AD curve in FY2017 results in a large increase in output with minimal added inflation. Now, what happens over time? In Figure 4, with the decline in the price level in FY2017 relative to FY2016, the short run AS curve shifts in.
More importantly, and critically, the increase in output in FY2017 (and the concurrent decrease in unemployment) results in a shift outward in the long run AS curve. This is shown in Figure 4.
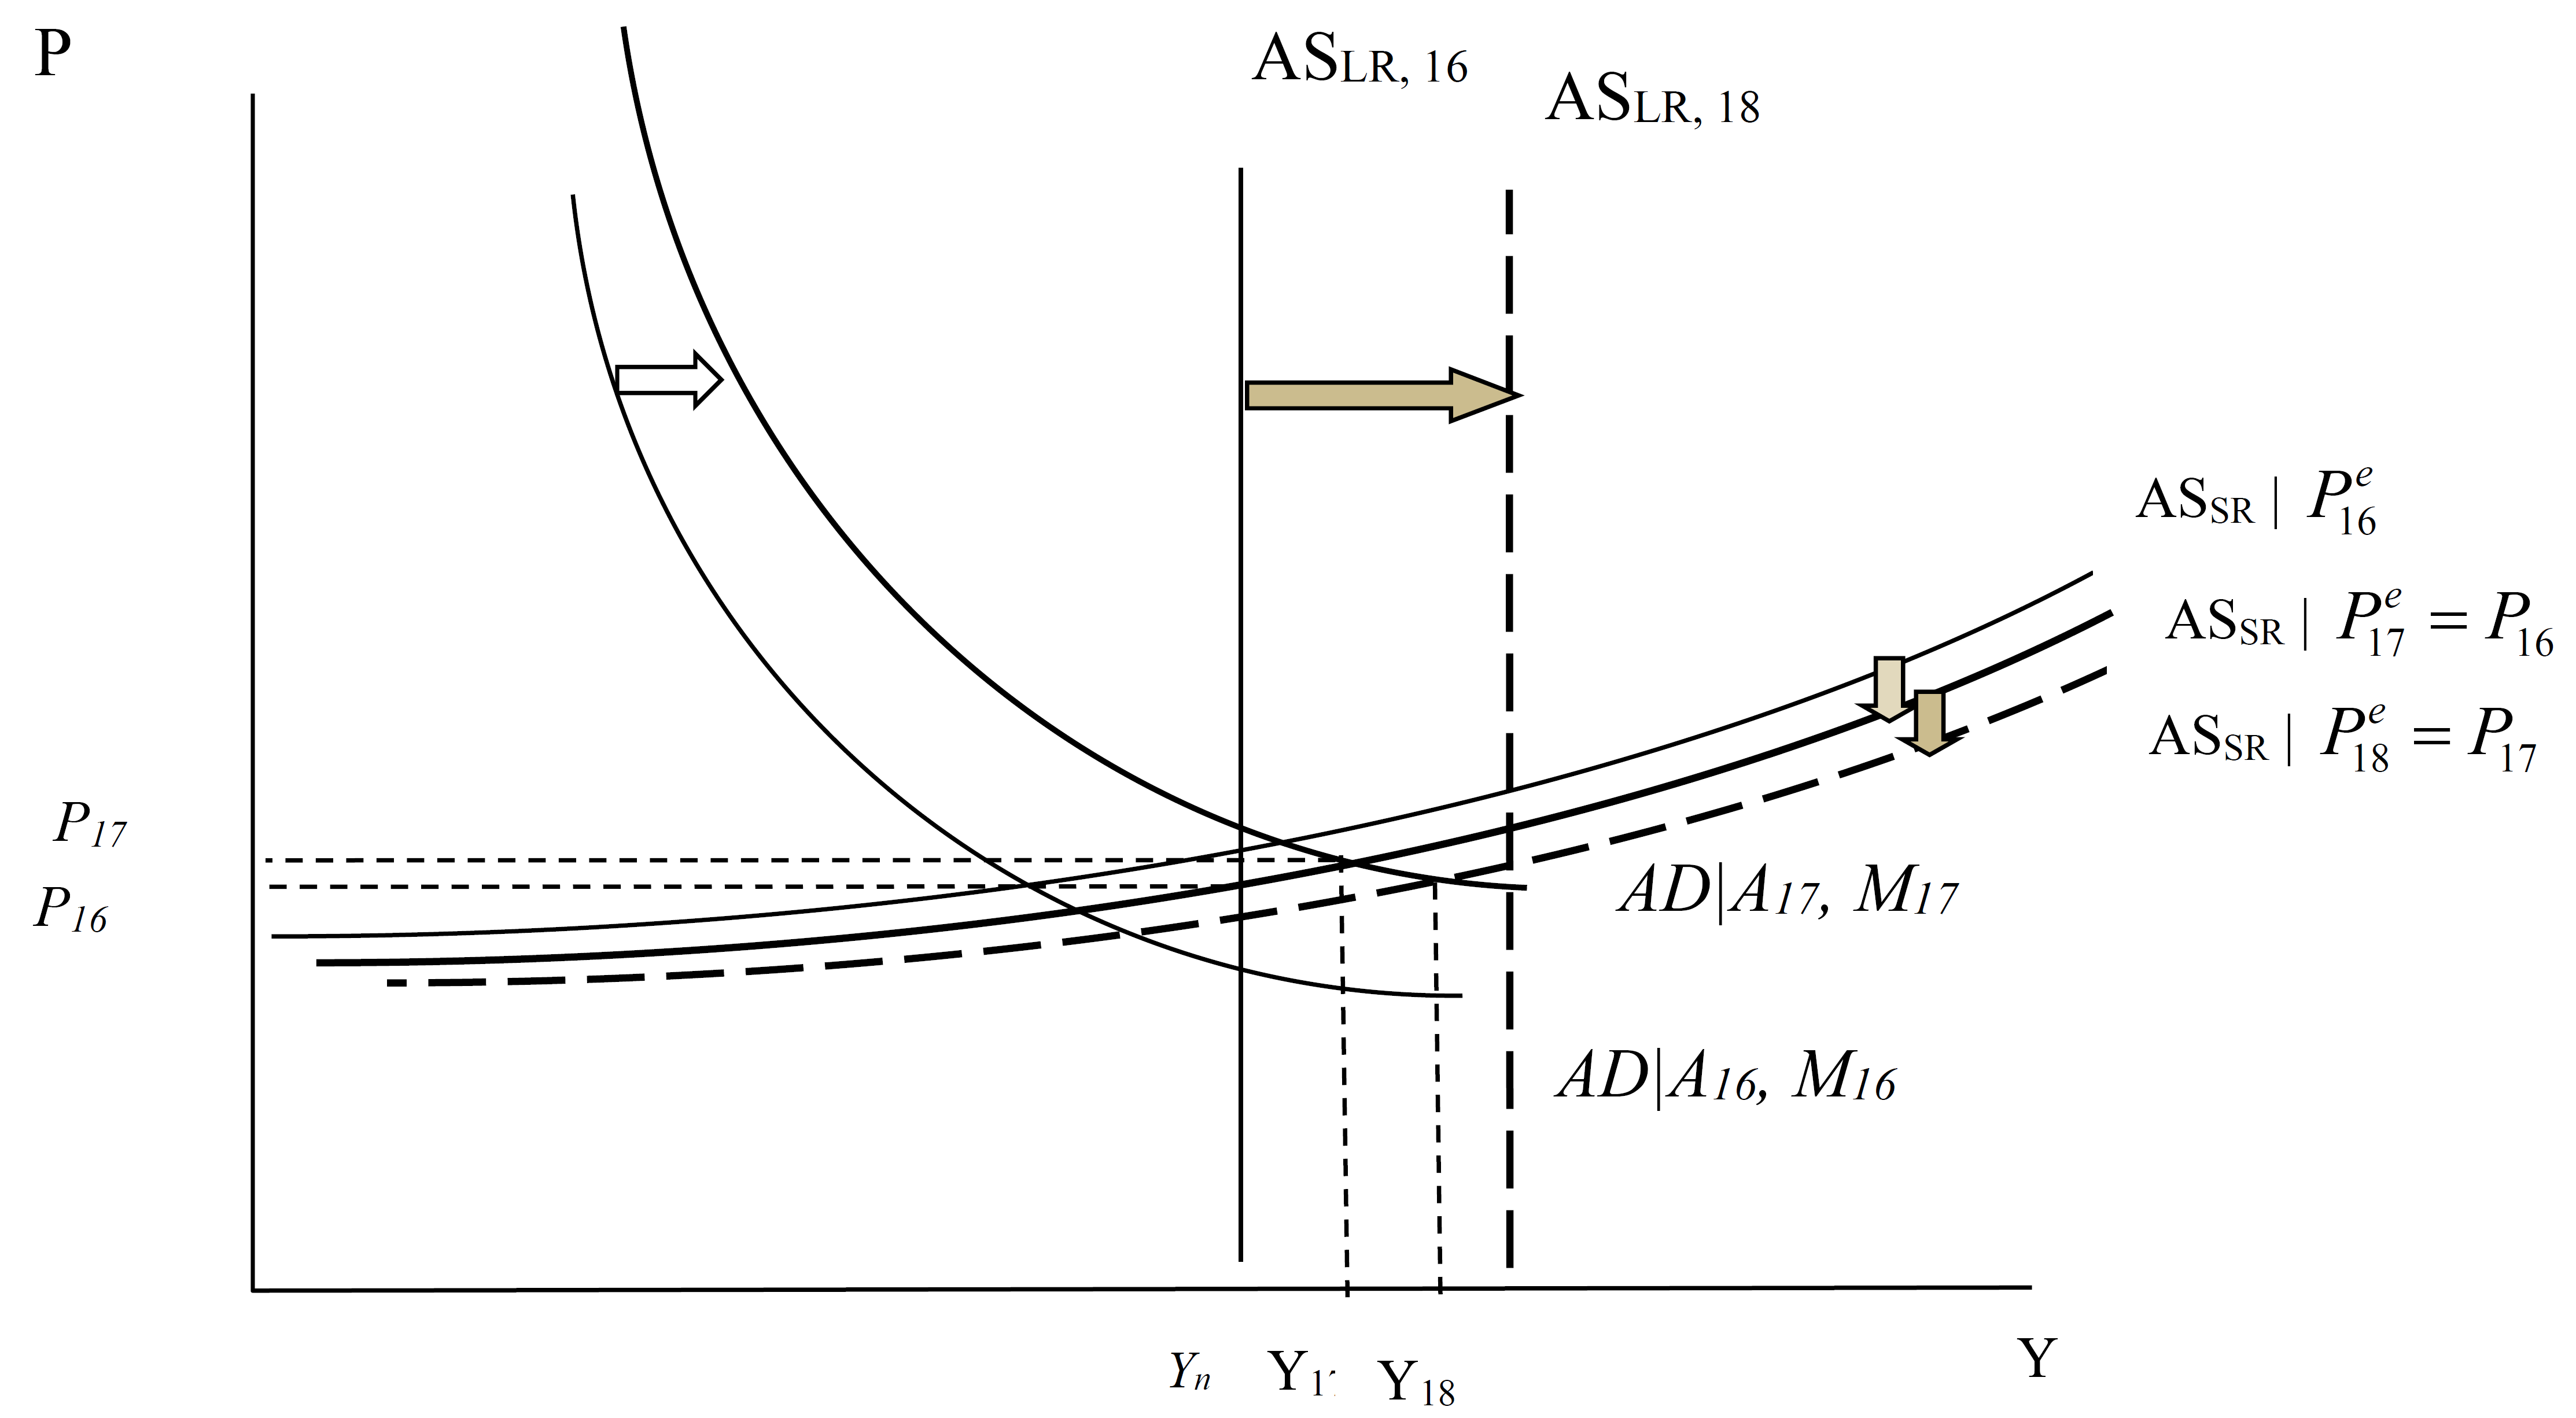
Note the short run AS curve shifts down in FY2017, so the resulting output is Y17. In FY2018, the long run AS curve shifts out so that the short run AS curve shifts out again in FY2018. The level of output again rises in FY2018. The process repeats itself in subsequent periods because higher output in a given period (recursively) results in a higher level of potential GDP.
This argument rationalizes the otherwise odd treatment of multipliers in the Friedman tabulation. To be fair, Friedman argues that potential GDP will also rise because of universal health care; however, the defense of the Friedman treatment of multipliers has hinged on hysteresis effects, as so I’ve taken that literally.
Parting Thoughts
Obviously, each of these views grossly simplifies. In the textbook version, potential GDP is unaffected by recessions and slow growth. But it’s easily conceivable that the capital stock is lower than it would have been had economic conditions been buoyant and investment been higher (after all, net investment is the first derivative of the net capital stock…). Human capital too. The question is, how much.
So, in the Friedman worldview, how much does potential GDP respond to higher output due to a running a “high pressure” economy; how much institutional changes like universal health care, or infrastructure spending? And over what time frame do such effects take place?
Brad DeLong ponders some of these questions and provides some thoughts. I would like to think the AS curve is really, really flat, even past the level of potential GDP (i.e., no kinks in the AS curve), and I do believe to a certain extent (see this post). I believe that the payoff to infrastructure investment is quite high, and a no-brainer given current financing costs. But whether one could increase government consumption by nearly 8 percentage points of GDP and achieve highly persistent output increases, with only a one percentage point acceleration in inflation seems to me a question with an answer that is likely to be “no”. (For more on the plausibility of some of the implied elasticities, see Romer and Romer (2016).)
March 3, 2016
Mass Shooting Statistics, 3/3/16
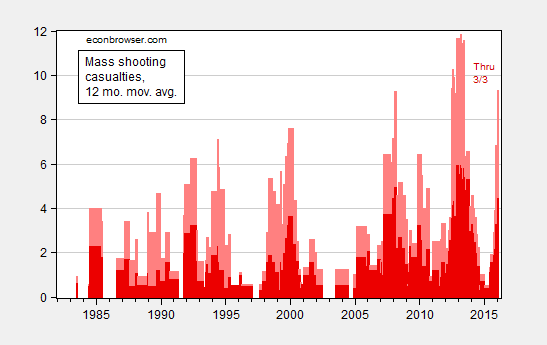
Figure 1: 12 month moving average of mass shooting casualties; deaths (dark red), wounded (pink). Source: Mother Jones, GunViolenceArchive.org. for 2/26/2016 data, and authorâs calculations.
For a per capita depiction, see this post. The upward trend is obvious there as well.
March 2, 2016
“Is Currency Devaluation Overrated?”
That’s the title of a symposium in the current issue of The International Economy. Martin Feldstein, Ted Truman, Joe Gagnon, Bill Cline, Mohamed El-Erian, Cathy Mann, and José de Gregorio (among many others) contribute.
Here’s my take:
There’s a long history of skepticism regarding the effectiveness of currency depreciation as a means of spurring net exports and GDP growth. In the post-War period, elasticity pessimism was often invoked as a rationale for foregoing devaluation. In the 1980’s, a more sophisticated argument based on hysteresis effects – big exchange rate appreciations could not be undone be a sequence of small exchange rate depreciations — was forwarded. The most recent incarnation is based upon plausible arguments, but I’ll argue they are only quantitatively relevant in specific cases.
The most recent manifestation of elasticity pessimism is based on the observation that for some countries, the large imported component in some countries’ exports means that depreciation enhances competitiveness only marginally. That’s because a depreciation increases the cost of imported inputs even as it increases the price at which exports can be sold. But, while East Asia – and China in particular – looms large in popular imagination, this region represents an extreme manifestation of global supply chains and vertical specialization (i.e., imports used in exports). In fact, in quantitative analyses of how much vertical specialization alters our perceptions of competitiveness, China is an outlier, rather than the norm.
More closed economies, such as the US, are much less subject to this effect. And even for China, that effect is likely to decrease over time as that country’s producers incorporate more and more domestically sourced labor and inputs in export goods.
For commodity exporters, it’s true that currency depreciation has little effect on export prices, since commodities are mostly priced in dollars. Nonetheless, currency depreciation still serves to reduce imports. Consequently, currency depreciation remains an important part of the policymaker’s toolkit. That doesn’t mean that capital controls are off the table – for some countries, devaluation will be of limited or insufficient effectiveness. For others, financial stability concerns will motivate the use of capital controls. In fact, over the past few years, emerging market economies have already tightened their grasp over financial flows, as measured by the Chinn-Ito index of financial openness.
Perhaps the most important factor mitigating exchange rate depreciation in recent times is not due to reduce trade flow sensitivities, but rather to balance sheet effects. When external debt – both public and private sector – is denominated in foreign currency, the depreciation can, and will, exert a large negative effect on output. For those countries, however, that have built up asset positions in foreign currency, depreciation can have a big positive effect.
A final observation is in order. There is a tendency for observers to view competitive rounds of depreciations – where one country’s depreciation is matched by another country’s – as a necessarily bad outcome. However, in a world where monetary policy is overall too tight (as measured by overly high real interest rates), competitive devaluations and the associated monetary loosening might move the world economy to an arguably better, higher inflation, regime.
âIs Currency Devaluation Overrated?â
That’s the title of a symposium in the current issue of The International Economy. Martin Feldstein, Ted Truman, Joe Gagnon, Bill Cline, Mohamed El-Erian, Cathy Mann, and José de Gregorio (among many others) contribute.
Here’s my take:
Thereâs a long history of skepticism regarding the effectiveness of currency depreciation as a means of spurring net exports and GDP growth. In the post-War period, elasticity pessimism was often invoked as a rationale for foregoing devaluation. In the 1980âs, a more sophisticated argument based on hysteresis effects â big exchange rate appreciations could not be undone be a sequence of small exchange rate depreciations — was forwarded. The most recent incarnation is based upon plausible arguments, but Iâll argue they are only quantitatively relevant in specific cases.
The most recent manifestation of elasticity pessimism is based on the observation that for some countries, the large imported component in some countriesâ exports means that depreciation enhances competitiveness only marginally. Thatâs because a depreciation increases the cost of imported inputs even as it increases the price at which exports can be sold. But, while East Asia â and China in particular â looms large in popular imagination, this region represents an extreme manifestation of global supply chains and vertical specialization (i.e., imports used in exports). In fact, in quantitative analyses of how much vertical specialization alters our perceptions of competitiveness, China is an outlier, rather than the norm.
More closed economies, such as the US, are much less subject to this effect. And even for China, that effect is likely to decrease over time as that countryâs producers incorporate more and more domestically sourced labor and inputs in export goods.
For commodity exporters, itâs true that currency depreciation has little effect on export prices, since commodities are mostly priced in dollars. Nonetheless, currency depreciation still serves to reduce imports. Consequently, currency depreciation remains an important part of the policymakerâs toolkit. That doesnât mean that capital controls are off the table â for some countries, devaluation will be of limited or insufficient effectiveness. For others, financial stability concerns will motivate the use of capital controls. In fact, over the past few years, emerging market economies have already tightened their grasp over financial flows, as measured by the Chinn-Ito index of financial openness.
Perhaps the most important factor mitigating exchange rate depreciation in recent times is not due to reduce trade flow sensitivities, but rather to balance sheet effects. When external debt â both public and private sector â is denominated in foreign currency, the depreciation can, and will, exert a large negative effect on output. For those countries, however, that have built up asset positions in foreign currency, depreciation can have a big positive effect.
A final observation is in order. There is a tendency for observers to view competitive rounds of depreciations â where one countryâs depreciation is matched by another countryâs â as a necessarily bad outcome. However, in a world where monetary policy is overall too tight (as measured by overly high real interest rates), competitive devaluations and the associated monetary loosening might move the world economy to an arguably better, higher inflation, regime.
March 1, 2016
Economic Slack, Again
I keep on seeing comparisons between the Great Depression and the Great Recession (e.g., [1]), and how a big fiscal stimulus could result in a big and sustained jump in output. I think it useful to visually compare the extent of downturn in both cases.
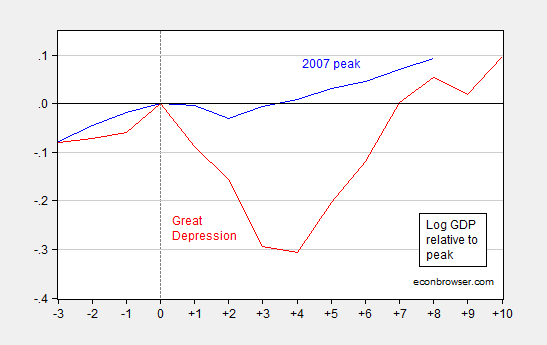
Figure 1: Log real GDP relative to 2007 peak (blue), relative to 1929 peak (red). Source: BEA and author’s calculations.
In other words, while the deep output drop during the Great Depression was followed by rapid growth, the drop by 2009 of 3% (relative to peak) was dwarfed by the 1933 drop of 31%.
In any case, the proposition that a deep recession necessarily implies subsequent fast growth, as forwarded in the 2009 Economic Report of the President (the last one produced under the Bush Administration), is a dubious one.
The foregoing, in conjunction with stable core CPI inflation (3.5% m/m AR, 2.2% y/y), suggests to me an output gap that is smaller (in absolute value) than 18% implied by a 1984-2007 linear deterministic trend and 11% as Gerald Friedman suggests.
February 28, 2016
Forward guidance
According to economic theory, one of the most promising ways in which monetary policy might be able to stimulate an economy in which the nominal interest rate has reached zero is to promise to follow a different policy rule once interest rates are again positive. A commitment to more stimulus and inflation in the future regime could in principle influence expectations and actions of people in the economy today, and thereby offer a means by which the central bank could help an economy recover from the zero lower bound. But as a practical matter, how does the Fed communicate to the public at date t something it intends to do at some future date t+h?
What the Fed actually did was to issue the following statement on August 9, 2011:
The Committee currently anticipates that economic conditions–including low rates of resource utilization and a subdued outlook for inflation over the medium run–are likely to warrant exceptionally low levels for the federal funds rate at least through mid-2013.
The key departure from previous statements was the link to a calendar date one year and three quarters ahead. What did market participants make of this announcement? Federal Reserve Bank of San Francisco President John Williams last week described the August 2011 statement as a “sledgehammer” that very effectively delivered the Fed’s message. Williams noted for example that the Blue Chip consensus estimate of how long it would be before the Fed started raising interest rates jumped from 1 year before the statement to 1-3/4 years after the statement.
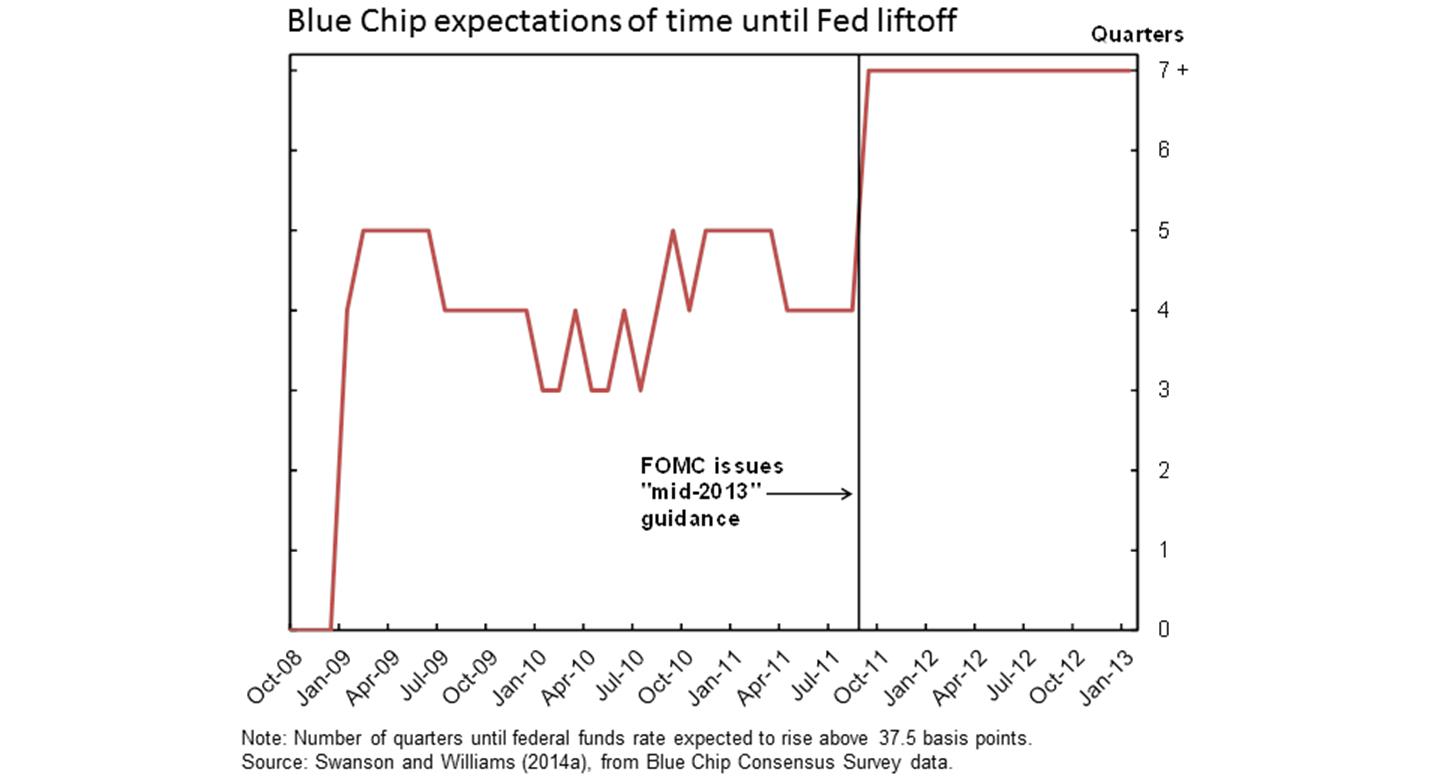
Figure 1. Source: Williams (2016).
Such “forward guidance” had the potential to start influencing economic activity the minute that the statement was issued in August of 2011. If markets were persuaded that the Fed was going to keep rates low for a longer period, longer term interest rates should fall on the news. And indeed, the yield on a 5-year U.S. Treasury bond fell by 20 basis points on the day the Fed released the statement. Lower interest rates on longer term borrowing could help to increase spending right away.
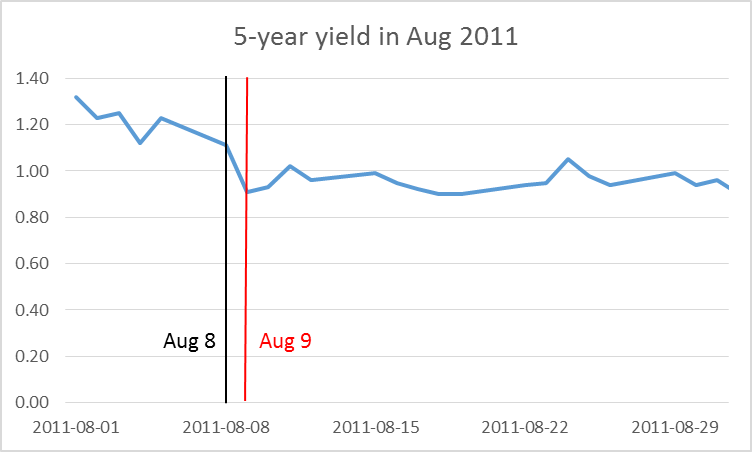
Figure 2. Yield on 5-year Treasury bond as of close of business each day, with values before and after the August FOMC statement highlighted with black and red lines, respectively.
But committing today to a future decision is problematic in both theory and practice. The Fed may say at time t that it is going to take a certain action at some future date t+h, but when the date t+h finally arrives, what prevents the Fed from embarking on a new plan rather than the one it announced at date t? If the Fed had wanted to raise rates at the end of 2012, would the August 2011 statement somehow have prevented it from doing so? A 2012 paper by Campbell, Evans, Fisher, and Justiniano drew an analogy to the account of the legendary Greek King Odysseus, who instructed his crew to bind him to the mast of his ship so that he would be denied the temptation of steering the ship toward the enticing songs of the Sirens. By announcing in August 2011 that it did not intend to raise rates over the next 7 quarters, the Fed was intentionally making it more difficult for it to deviate from that announced course.
But there is another possible interpretation of how the Fed’s announcement could be interpreted, which Campbell, Evans, Fisher, and Justiniano likened to a different story from Greek mythology based on the Oracle of Delphi, who had the power to predict the future. Perhaps what the Fed was doing with the statement was simply passing along the insights from the Fed’s unique crystal ball– the Fed was simply issuing a prediction in August 2011 of how it would behave through 2013. The Fed might have a better prediction than the rest of us about this for two reasons. One is that the Fed knows its own mind better than we do. Perhaps they were saying, “y’all may think we’re hawks, but we’re really doves, doves, doves.” Rather than bind itself like Odysseus, the Fed was merely predicting that it would want to keep rates low through mid-2013, and the market snapped in line on receiving this news, as revealed in Figure 1 above, perhaps because they had not understood just how dovish policy-makers were.
But another reason that the Fed might have issued such a prediction is that they simply anticipated that the recovery was going to continue to be disappointingly weak: “We’re the same Fed we always have been and always will be. But we anticipate that the economy’s going to stink, so we anticipate that we won’t be raising rates any time soon.” Why should markets respond at all to such an announcement? If I think that the Fed may have better information about economic fundamentals than I do, when I learn that the Fed is concerned about where the economy is heading, I become more concerned as well. Under this interpretation, the drop in longer term rates on August 9 may have reflected news of a weaker economy than people had been aware of prior to the Fed announcement. If “forward guidance” operates through this second kind of “Delphic” channel, the statement could end up having the opposite of the intended stimulus effect.
Can we find anything in the data to help distinguish between Odyssean and Delphic forward guidance? We could look at how other prices changed on August 9, to see if they are more consistent with news of more stimulus or news of deteriorating economic conditions. Unfortunately, it’s hard to draw any firm conclusions from that exercise. The stock market scored an impressive gain on August 9, but it was entirely wiped out the next.
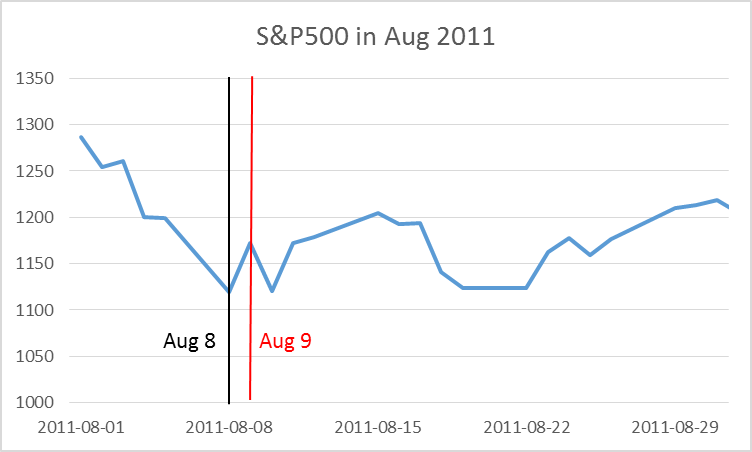
Figure 3.
The change in the yield on 5-year Treasury Inflation Protected Securities on August 9 was exactly the same as that on regular 5-year Treasuries, suggesting that the announcement had no major implications for future expected inflation.
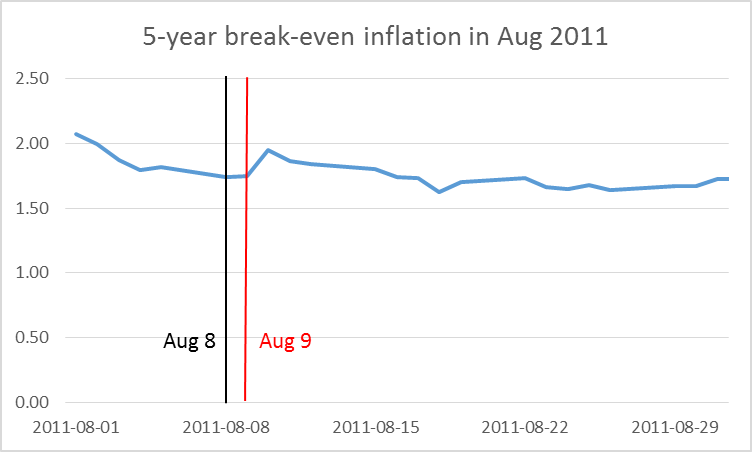
Figure 4. Yield on 5-year nominal Treasury bond minus yield on 5-year TIPS.
Or we could look at how the people whose assessments of time to liftoff were plotted in Figure 1 above also changed their assessments of future output and inflation. At the beginning of August 2011, the Blue Chip 3-quarter-ahead consensus forecast was 8.8% for the unemployment rate and 1.8% for inflation. By the beginning of September the unemployment forecast had been revised up to 9.0% and the inflation forecast was down to 1.7%, more consistent with Delphic pessimism than Williams’s sledgehammer.
Campbell, Evans, Fisher, and Justiniano looked systematically at these relations using data from 1990-2007. They isolated the change in current and expected future interest rates on days of FOMC announcements over this period, and looked at their correlation with changes in future Blue Chip forecasts of inflation and unemployment. They found that if the Fed announcement led to higher expected future interest rates, we would usually see that month accompanied by an upward revision of inflation forecasts and a downward revision of unemployment forecasts, consistent with the conclusion that there is often a strong Delphic component to the news value of Fed statements of future policy intentions. Although we have a much shorter sample of data from the zero-lower bound episode after 2007, these authors concluded that the relationship over 2008-2011 was consistent with what they found in the earlier data.
Although it may have been useful for the Fed to commit itself to a future course of action in 2011, it is a separate question whether it is helpful for the Fed in March of 2016 to try to tie its hands for this year and next by giving the market clearer guidance of its intentions. An interesting paper presented by Feroli, Greenlaw, Hooper, Mishkin, and Sufi at the U.S. Monetary Policy Forum on Friday distinguished between forward guidance that specifies particular dates when actions are likely to be taken and guidance that tries to better communicate the way in which the Fed will respond to future incoming data. The authors developed a characterization of the forward content of FOMC statements, with a value of +4 indicating a clear communication of the kind of data on which future decisions would be based and -4 a clear communication linking future decisions to passage of calendar time. The August 2011 statement discussed above was an example of the strongest form of time-based forward guidance.
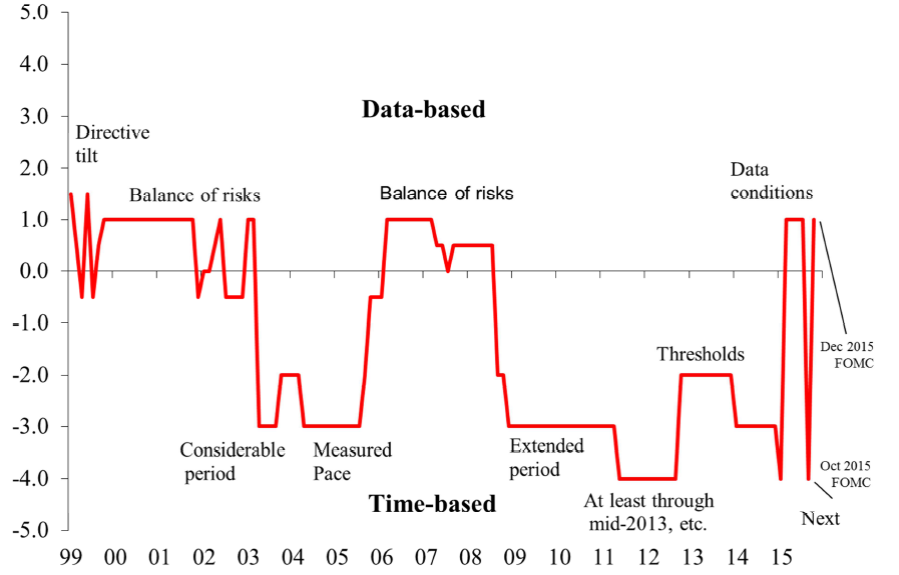
Figure 5. Chart shows a judgmentally computed index of the relative strength of net time-based or data-based content of FOMC forward guidance at any given point in time. Numbers closer to zero denote weaker guidance. Labels indicate key terms used in guidance. Source: Feroli, Greenlaw, Hooper, Mishkin, and Sufi (2016).
In addition to episodes during the zero-lower-bound regime, another period that stands out in their index is the “measured pace” of the Greenspan tightening of 2004-2005, in which the Fed telegraphed that it was planning to implement a 25-basis-point hike in the fed funds rate at every FOMC meeting. Although this approach was intended to reassure markets with the predictability of Fed actions, with hindsight it is clear to many of us that it was a mistake not to adapt monetary policy more quickly to the developing house price bubble.
Feroli, Greenlaw, Hooper, Mishkin, and Sufi conclude that although there may be occasions when it could be helpful for the Fed to commit itself to a particular calendar-based policy path, the tightening cycle of 2016 is not likely to be one of them.
February 27, 2016
Guest Contribution: “Who is right on US financial reform? Sanders, Clinton, or the Republicans?”
Today we are pleased to present a guest contribution written by Jeffrey Frankel, Harpel Professor of Capital Formation and Growth at Harvard University, and former Member of the Council of Economic Advisers, 1997-99. This post is an extended version of a column that appeared in Project Syndicate.
Eight years after the financial crisis broke out in the United States, there is as much confusion as ever regarding what reforms are appropriate in order to minimize the recurrence of such crises in the future.
There continue to be some good Hollywood movies concerning the crisis, including one nominated for multiple Oscars at the February 28 Academy Awards. The Big Short has been justly praised for making such concepts as derivatives easy for anyone to understand. As has been true since the first of the movies about the crisis, they are good at reflecting and crystalizing the audience’s anger. But they are not as good at giving clues to those walking out of the theater as to the implications. What policy changes would help? Who are the politicians that support the desirable reforms? Who opposes them?
If an American citizen is “mad as hell” at banks, should he or she respond by voting for the far left? By voting for the far right? (Or by refusing to vote at all?) Each of these paths has been chosen by many voters. But each is misguided.
There is a place in political campaigns for short slogans that fit on cars’ bumper stickers. (“Wall Street regulates Congress.”) And there is a place for ambitious goals. (“Shrink the financial sector.”) But the danger is that those who are attracted to inspirational rallying cries and sweeping proposals will lack the patience required to identify which is the right side to support in the numerous smaller battles over financial regulation that take place every year and that ultimately determine whether our financial system is becoming structurally safer or weaker.
Breaking up banks
Senator Bernie Sanders has proposed breaking up the banks into little pieces. It is the centerpiece of his campaign for the Democratic presidential nomination. The goal is to make sure that no bank is too big to fail without endangering the rest of the financial system. That would require quite a sledge hammer. The American banking system historically featured thousands of small banks. But having thousands of small banks did not prevent runs on depositary institutions in the United States 1930s.
Continental Illinois was the original case of a bank that was deemed “too big to fail” in 1984, when it was bailed out by the Reagan Administration. So banks would have to be broken into smaller pieces than that. Merely turning the deregulatory clock back 30 years would not be enough to do it.
I am not sure whether or not, if one were designing a system from scratch, it would be useful to make sure that no bank was above a particular cap in size chosen so that any of them could later be allowed to fail with no further government involvement. I do know that having a financial system dominated by just five large banks did not prevent Canada from sailing through the Global Financial Crisis of 2008-09 in better shape than almost any other country.
Attacking banks is emotionally satisfying, for understandable reasons. But it won’t prevent financial crises.
Reforms proposed by Hillary Clinton
Hillary Clinton is correct in pointing out that the most worrisome problems lie elsewhere: hedge funds, investment banks, and the other so-called non-banks or shadow banks. These are financial institutions that are not commercial banks and that therefore have not been subject to the same regulatory oversight and the same restrictions on capital standards, leverage, and so on. Recall that Lehman Brothers was not a commercial bank and AIG was an insurance company.
Secretary Clinton has done her homework and proposes specific measures to address specific problems with the non-banks. Four examples:
She puts priority on closing the “carried interest” loophole that currently allows hedge fund managers to pay lower tax rates on their incomes than the rest of us pay. This is a more practical step than most proposals to address the very high compensation levels in the financial sector that cause so much resentment. It would help moderate inequality, reduce distortion, and raise some tax revenue to help reduce the budget deficit.
She proposes a small tax targeting certain high-frequency trading prone to abuse. (Sanders proposes a tax on all financial transactions.)
She also supports higher capital requirements on financial institutions, including non-banks, if necessary, beyond those increases already enacted.
She proposes a “risk fee” on big financial institutions that would rise as they get bigger. This is reminiscent of a fee on the largest banks that the Obama Administration proposed in 2010, to discourage risky activity while at the same time helping recoup some revenue from bailouts. It was going to be part of the Dodd-Frank Wall Street Reform and Consumer Protection Act, but in the end three Republican senators demanded that it be dropped as their price for supporting it.
The Dodd-Frank reforms
The Dodd-Frank law was a big step in the direction of needed financial reform. It included such desirable features as increasing transparency for derivatives, requiring financial institutions to hold more capital, imposing further regulation on those designated “systemically important,” and adopting Elizabeth Warren’s idea of establishing the CFPB, the Consumer Financial Protection Bureau.
It goes without saying that Dodd-Frank did not do everything we need to do. But the law would have moved us a lot further in the right direction if many in Congress had not spent the last six years chipping away at it. Those who worked to undermine the financial regulatory reform legislation – mostly Republicans – appear to have paid no political price for it, since most of these issues are below the radar for most voters. [I have given my subjective evaluation of various specific legislative proposals, some passed and some not, on a 1-page slide.]
Here are a few examples of how Dodd-Frank has been undermined, in addition to the abandonment of the fee to discourage risk-taking by large banks or an earlier proposed global bank levy.
Auto-dealers, amazingly, lobbied successfully to get themselves exempted from regulation by the CFPB, allowing the resumption of some abusive lending practices that resemble the sub-prime mortgages which played such a big role in the 2008 financial crisis.
The Dodd-Frank law was supposed to require banks and other mortgage originators to retain at least 5% of the housing loans they made, rather than repackaging every last mortgage and reselling it to others. The reason is that the originators need to have “skin in the game” in order to have an incentive to take care that the borrowers would reasonably be able to repay the loans. Under heavy pressure from Congress, that requirement was gutted in 2014.
This one is not especially the fault of the Republicans. Virtually every American politician in both parties still acts as though the goal should be to get as many people into as much housing debt as possible, even if many will not be able to repay the loans and even after such practices caused the worst financial crisis and recession since the 1930s. Other countries manage to do this better.
The Congress has refused to give regulatory authorities such as the SEC (Securities and Exchange Commission) and CFTC (Commodities Futures Trading Commission) budgets commensurate with their expanded regulatory responsibilities, in a deliberate effort to hamper enforcement. Many Republicans appear still to believe that these agencies represent excessively aggressive regulation. This is remarkable in light of the financial crisis. Remember that Bernie Madoff — who is himself now the subject of new Hollywood portrayals — was able to run his Ponzi scheme right up until 2008 despite repeated tip-offs to the SEC, because it systematically refrained from pursuing investment management cases during this period.
Who can get the job done?
Sanders has indicated that if he were president, nobody with past experience on Wall Street would be allowed to serve in his administration. A blanket rule like this would be a mistake. Judging people by such superficial criteria as whether they have ever worked for Goldman Sachs, for example, would have deprived us of the services of Gary Gensler. As CFTC chairman from 2009-2014 Gensler worked tirelessly to implement Dodd-Frank. To the consternation of many former Wall Street colleagues, he aggressively pursued regulation of derivatives and, for example, prosecution of a case against five financial institutions who had colluded to manipulate the LIBOR interest rate (London Interbank Offered Rate]. Yet Sanders tried to block his appointment in 2009.
Financial issues are complicated. Getting the details of regulation right is hard. (The examples mentioned here are just the tip of the iceberg.) We need leaders and officials who have the wisdom, experience, patience, and perseverance to figure out the right measures, push for their enactment and then implement them. If such people are not the ones who receive political support for their efforts, we should not be surprised if the financial sector again escapes effective regulation and crises recur in the future.
This post written by Jeffrey Frankel.
Guest Contribution: âWho is right on US financial reform? Sanders, Clinton, or the Republicans?â
Today we are pleased to present a guest contribution written by Jeffrey Frankel, Harpel Professor of Capital Formation and Growth at Harvard University, and former Member of the Council of Economic Advisers, 1997-99. This post is an extended version of a column that appeared in Project Syndicate.
Eight years after the financial crisis broke out in the United States, there is as much confusion as ever regarding what reforms are appropriate in order to minimize the recurrence of such crises in the future.
There continue to be some good Hollywood movies concerning the crisis, including one nominated for multiple Oscars at the February 28 Academy Awards. The Big Short has been justly praised for making such concepts as derivatives easy for anyone to understand. As has been true since the first of the movies about the crisis, they are good at reflecting and crystalizing the audienceâs anger. But they are not as good at giving clues to those walking out of the theater as to the implications. What policy changes would help? Who are the politicians that support the desirable reforms? Who opposes them?
If an American citizen is âmad as hellâ at banks, should he or she respond by voting for the far left? By voting for the far right? (Or by refusing to vote at all?) Each of these paths has been chosen by many voters. But each is misguided.
There is a place in political campaigns for short slogans that fit on carsâ bumper stickers. (âWall Street regulates Congress.â) And there is a place for ambitious goals. (âShrink the financial sector.â) But the danger is that those who are attracted to inspirational rallying cries and sweeping proposals will lack the patience required to identify which is the right side to support in the numerous smaller battles over financial regulation that take place every year and that ultimately determine whether our financial system is becoming structurally safer or weaker.
Breaking up banks
Senator Bernie Sanders has proposed breaking up the banks into little pieces. It is the centerpiece of his campaign for the Democratic presidential nomination. The goal is to make sure that no bank is too big to fail without endangering the rest of the financial system. That would require quite a sledge hammer. The American banking system historically featured thousands of small banks. But having thousands of small banks did not prevent runs on depositary institutions in the United States 1930s.
Continental Illinois was the original case of a bank that was deemed âtoo big to failâ in 1984, when it was bailed out by the Reagan Administration. So banks would have to be broken into smaller pieces than that. Merely turning the deregulatory clock back 30 years would not be enough to do it.
I am not sure whether or not, if one were designing a system from scratch, it would be useful to make sure that no bank was above a particular cap in size chosen so that any of them could later be allowed to fail with no further government involvement. I do know that having a financial system dominated by just five large banks did not prevent Canada from sailing through the Global Financial Crisis of 2008-09 in better shape than almost any other country.
Attacking banks is emotionally satisfying, for understandable reasons. But it wonât prevent financial crises.
Reforms proposed by Hillary Clinton
Hillary Clinton is correct in pointing out that the most worrisome problems lie elsewhere: hedge funds, investment banks, and the other so-called non-banks or shadow banks. These are financial institutions that are not commercial banks and that therefore have not been subject to the same regulatory oversight and the same restrictions on capital standards, leverage, and so on. Recall that Lehman Brothers was not a commercial bank and AIG was an insurance company.
Secretary Clinton has done her homework and proposes specific measures to address specific problems with the non-banks. Four examples:
She puts priority on closing the âcarried interestâ loophole that currently allows hedge fund managers to pay lower tax rates on their incomes than the rest of us pay. This is a more practical step than most proposals to address the very high compensation levels in the financial sector that cause so much resentment. It would help moderate inequality, reduce distortion, and raise some tax revenue to help reduce the budget deficit.
She proposes a small tax targeting certain high-frequency trading prone to abuse. (Sanders proposes a tax on all financial transactions.)
She also supports higher capital requirements on financial institutions, including non-banks, if necessary, beyond those increases already enacted.
She proposes a ârisk feeâ on big financial institutions that would rise as they get bigger. This is reminiscent of a fee on the largest banks that the Obama Administration proposed in 2010, to discourage risky activity while at the same time helping recoup some revenue from bailouts. It was going to be part of the Dodd-Frank Wall Street Reform and Consumer Protection Act, but in the end three Republican senators demanded that it be dropped as their price for supporting it.
The Dodd-Frank reforms
The Dodd-Frank law was a big step in the direction of needed financial reform. It included such desirable features as increasing transparency for derivatives, requiring financial institutions to hold more capital, imposing further regulation on those designated âsystemically important,â and adopting Elizabeth Warrenâs idea of establishing the CFPB, the Consumer Financial Protection Bureau.
It goes without saying that Dodd-Frank did not do everything we need to do. But the law would have moved us a lot further in the right direction if many in Congress had not spent the last six years chipping away at it. Those who worked to undermine the financial regulatory reform legislation â mostly Republicans â appear to have paid no political price for it, since most of these issues are below the radar for most voters. [I have given my subjective evaluation of various specific legislative proposals, some passed and some not, on a 1-page slide.]
Here are a few examples of how Dodd-Frank has been undermined, in addition to the abandonment of the fee to discourage risk-taking by large banks or an earlier proposed global bank levy.
Auto-dealers, amazingly, lobbied successfully to get themselves exempted from regulation by the CFPB, allowing the resumption of some abusive lending practices that resemble the sub-prime mortgages which played such a big role in the 2008 financial crisis.
The Dodd-Frank law was supposed to require banks and other mortgage originators to retain at least 5% of the housing loans they made, rather than repackaging every last mortgage and reselling it to others. The reason is that the originators need to have âskin in the gameâ in order to have an incentive to take care that the borrowers would reasonably be able to repay the loans. Under heavy pressure from Congress, that requirement was gutted in 2014.
This one is not especially the fault of the Republicans. Virtually every American politician in both parties still acts as though the goal should be to get as many people into as much housing debt as possible, even if many will not be able to repay the loans and even after such practices caused the worst financial crisis and recession since the 1930s. Other countries manage to do this better.
The Congress has refused to give regulatory authorities such as the SEC (Securities and Exchange Commission) and CFTC (Commodities Futures Trading Commission) budgets commensurate with their expanded regulatory responsibilities, in a deliberate effort to hamper enforcement. Many Republicans appear still to believe that these agencies represent excessively aggressive regulation. This is remarkable in light of the financial crisis. Remember that Bernie Madoff — who is himself now the subject of new Hollywood portrayals — was able to run his Ponzi scheme right up until 2008 despite repeated tip-offs to the SEC, because it systematically refrained from pursuing investment management cases during this period.
Who can get the job done?
Sanders has indicated that if he were president, nobody with past experience on Wall Street would be allowed to serve in his administration. A blanket rule like this would be a mistake. Judging people by such superficial criteria as whether they have ever worked for Goldman Sachs, for example, would have deprived us of the services of Gary Gensler. As CFTC chairman from 2009-2014 Gensler worked tirelessly to implement Dodd-Frank. To the consternation of many former Wall Street colleagues, he aggressively pursued regulation of derivatives and, for example, prosecution of a case against five financial institutions who had colluded to manipulate the LIBOR interest rate (London Interbank Offered Rate]. Yet Sanders tried to block his appointment in 2009.
Financial issues are complicated. Getting the details of regulation right is hard. (The examples mentioned here are just the tip of the iceberg.) We need leaders and officials who have the wisdom, experience, patience, and perseverance to figure out the right measures, push for their enactment and then implement them. If such people are not the ones who receive political support for their efforts, we should not be surprised if the financial sector again escapes effective regulation and crises recur in the future.
This post written by Jeffrey Frankel.
Menzie David Chinn's Blog


