
Menzie David Chinn's Blog, page 11
April 5, 2016
2016 Econbrowser NCAA tournament challenge winner
Congratulations to Jackiegee, winner of the . None of our entrants correctly picked the tournament winner to be Villanova, but Jackie (like a number of others of you) thought it would be UNC, and came within half a second of being right! For fans of Michigan State, West Virginia, and others, better luck next year!


April 4, 2016
Wisconsin’s Dependence on Exports
On the eve of the primary votes in Wisconsin, where protectionists are set to make some inroads, it’s of interest to consider the state’s reliance on exports — including those to China (a target of both Senator Sanders and Mr. Trump) and Mexico [1].
Figure 1 depicts the goods exports expressed as a ratio to Wisconsin state Gross State Product (nominal).
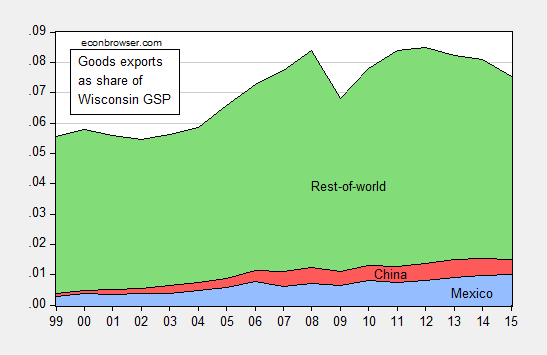
Figure 1: Goods export share of GSP to Mexico (blue), China (red), and rest-of-world (green). 2015 WI GSP assumes 3% growth y/y. Source: For GSP, BEA via FRED, and for exports, Census.
Exports of goods to China accounts for 7% of total Wisconsin goods exports; that’s about the same proportion as for US goods exports to China.
If the US were to impose large tariffs on imports from China, it is unlikely there would be zero policy response on imports of US goods into China.
More on the trade and macro implications of imposing tariffs on China in this post.
April 3, 2016
Productivity gains in U.S. shale oil
Horizontal fracturing of tight hydrocarbon-bearing formations was responsible for a phenomenal resurgence in U.S. oil production, which rose more than 4 million barrels per day from 2010 levels before peaking in April of last year.

Monthly U.S. field production of crude oil in thousands of barrels per day, Jan 1973 to Dec 2015. Data source: Monthly Energy Review.
Only 1/4 of the drilling rigs that were active in the U.S. shale oil producing counties in November 2014 were still on the job this February. Despite this massive cutback in capital spending, total U.S. crude oil production had fallen only 400,000 barrels a day (a 4.5% drop) as of December.
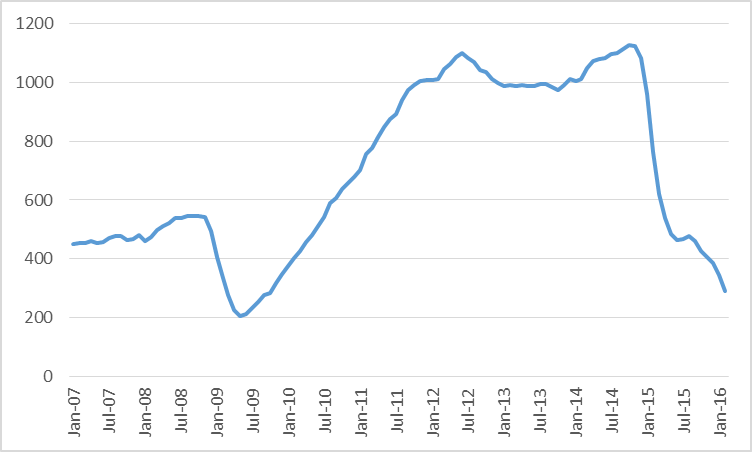
Number of active oil rigs in counties associated with the Permian, Eagle Ford, Bakken, and Niobrara plays, monthly Jan 2007 to Feb 2016. Data source: EIA Drilling Productivity Report.
The reason that U.S. oil production has not fallen more is remarkable efficiency gains. Occidental Petroleum described a series of measures they have taken that have reduced the time it takes to complete a well by up to 50%, which could enable it to drill the same number of wells each month using half the number of rigs. Other innovations are allowing much more oil to be produced from each completed well. Decker, Flaaen, and Tito (2016) note that the average new well in the Bakken produced 200 barrels/day in 2007. Last year the number was 400 b/d. However, it remains true as ever that production from an average new well will have fallen off by half within a year of operation.
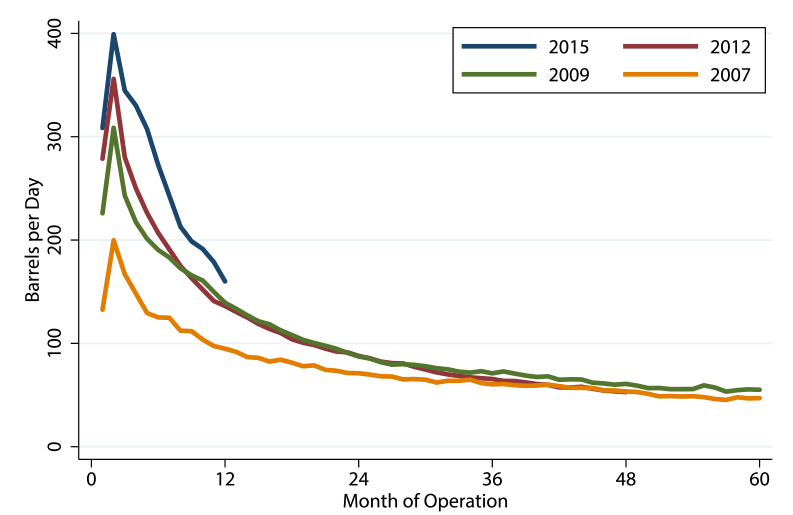
Average Bakken well decline rates by year (production from the well n months after completion). Source: Decker, Flaaen, and Tito (2016).
Drillers have also been able to get deep cost discounts from the companies that sell to them as a result of the market bust. These along with the productivity gains have significantly lowered the price of oil at which the producers would be able to cover their costs (including capital costs). A survey by the Federal Reserve Bank of Kansas City asked operators (primarily working in the Niobrara Shale) what oil price would be needed in order for drilling to be profitable in their area. The median response was $60 a barrel, down significantly from the $79 estimate of a year earlier, but still far above current prices. Many analysts expect a third to a half of U.S. oil companies to file for bankruptcy in 2016.
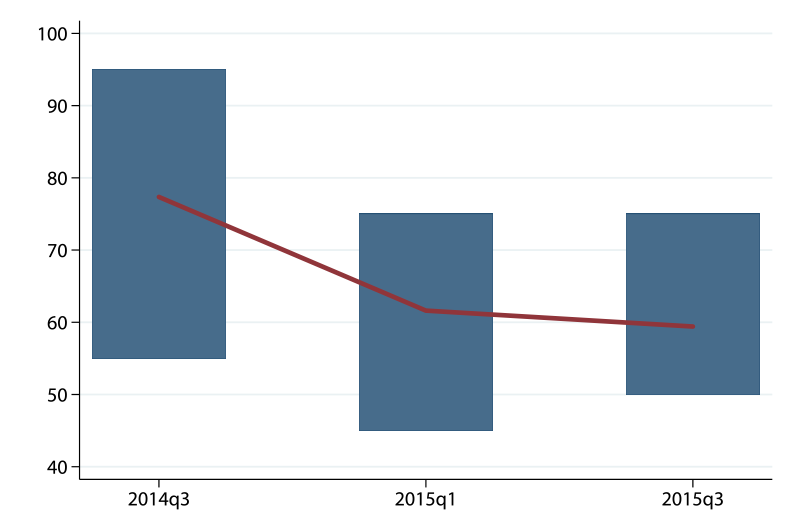
Median response (red line) and range of responses (blue rectangles) to price needed for profitability. Source: Decker, Flaaen, and Tito (2016).
The table below reports operating income for five of the most important companies in the shale oil boom, which between them produced almost a million barrels a day in 2014. Between them they lost $32 billion in 2015, a year when the average price of WTI was $49/barrel. So far in 2016 we’ve averaged $33/barrel.
Company
2014 production (kb/d)
2015 operating income ($M)
EOG
288
-6,686
Pioneer
182
-1,917
Devon
130
-20,727
Whiting
130
-2,836
Continental
127
-224
Sum
857
-32,390
Despite ongoing productivity gains and cost savings, a significant fraction of current world oil production cannot be sustained at current prices.
March 31, 2016
What Is “Solid Economic Reasoning”?
Writing in The Nation, Robert Pollin asserts:
All of [Bernie Sanders’s] major proposals are grounded in solid economic reasoning and evidence.
Reading this statement, I was quite surprised. Despite the fact that many of the proposed policies would, in my opinion, likely prove beneficial — greater infrastructure spending for instance — the key question surrounds the impact of the Sanders plan on growth. Without a sufficiently large and persistent boost to growth, it is not possible to square the circle.
Liberal critics of Sanders, led by Krugman as well as four former Chairs of the Council of Economic Advisers under both Clinton and Obama, became especially incensed over a paper by my colleague Gerald Friedman that estimated the impact of Sanders’s overall program on jobs and economic growth. Friedman concluded that it could raise the average annual US growth rate to 5.3 percent over a 10-year period after Sanders assumed office. This contrasts dramatically with the average growth rate of 3.3 percent between 1950 and 2015, and the much weaker recent average growth performances of 1.4 percent under Obama and 2.1 percent under George W. Bush. In fact, these critics were correct that Friedman’s specific growth estimate was overly optimistic. But here again, the critics have missed the forest for the trees.
Overall, the Sanders program is capable of raising living standards and reducing insecurity for working people and the poor, expanding higher educational opportunities, and reversing the decades-long trend toward rising inequality. It could bring Wall Street’s dominance under control and help prevent a repeat of the financial crisis. It will also strongly support investments in education, clean energy, and public infrastructure, generating millions of good jobs in the process.
None of Sanders’s liberal critics have shown how, overall, these developments would be harmful to economic growth. In fact, there are several channels through which they support growth. A single-payer healthcare system would relieve businesses of having to cover health insurance costs for their employees. Higher average wages and greater overall equality will put more money in the pockets of most US consumers, enabling them to buy more from US businesses. Investments in education and infrastructure will raise US productivity and global competitiveness over the long term, as well as expand job opportunities in the short term. …
I don’t count myself as a dogmatist. I’m willing to entertain all sorts of models. But I do want a model, and equations that can be solved, so that one can see if the effects are of a requisite size. Without the model, one can’t say what is, or is not, a “solid economic analysis”.
Moreover, in my mind, the question revolves around the quantitative magnitudes, and on these counts, the article is silent (with the exception of the revenue implications of the proposed financial transactions tax). In the Friedman tabulation, a higher level of growth results a higher level of tax revenues; but as discussed in depth in this post, the magnitude of the growth effect is only consistent a very special model incorporating big hysteresis effects. Using the multipliers in a conventional macroeconometric model implies a much smaller output effect, and hence a bigger deficit, as shown in this post.
In fact, according to the OECD New Global Model, if output is near potential, the nearly 8 percentage point of GDP boost in Federal spending is likely to result in a nearly 5 percentage points of GDP increase in the budget deficit three years into the stimulus. Inflation will be nearly 7 percentage points higher than baseline, and interest rates 12 percentage points (see Table 3 of this handout). I don’t think we are at potential right now, but even with a couple of percentage points of slack, these hardly seem like trivial concerns.
Professor Pollin concludes:
In short, if something like a Sanders program is enacted in the United States, the critical point will not be whether GDP grows, on average, at 3 percent, 4 percent or 5.3 percent. A Sanders economy will be fully capable of growing at healthy rates. But more than just growing, a Sanders economy will also deliver standards of well-being for the overwhelming majority of Americans, as well as the environment, in ways that we have not experienced for generations.
You’ll excuse me if I think trees are as important as the forest, in the sense that the trees have to add up to the forest. If real policy analysts require a quantitative assessment of the Ryan plan, or the Romney plan (as I have [1], [2]), then they should also demand the same of the Sanders plan. Hence, it is incumbent upon the proponents of such plans to show us the model. Otherwise, this is an exercise in faith, not economic analysis.
March 30, 2016
US-China Trade Policies: the Nuclear — and Near-nuclear — Options
Substantial attention has been devoted to the disasterous effects of implementing a Donald Trump agenda of imposing 45% tariffs on imports of goods from China. To gain some perspective, consider the implications for prices of goods imported from China if such a tariff were imposed (and a large country assumption used, so that only half of the tariff increase manifested in increased prices).
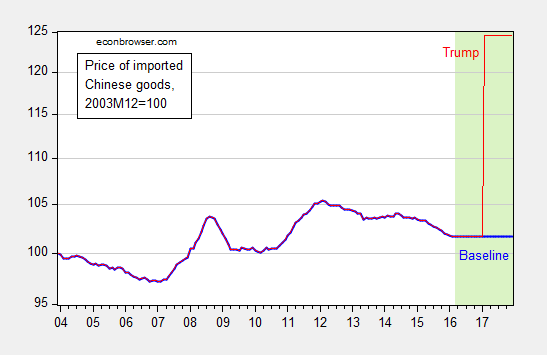
Figure 1: Price of Chinese commodity imports, 2003M12=100, with 2016M03 values at 2016M02 values (bold blue), and a 22.5% higher price level as of 2017M02 assuming the half of incidence falls on the US (red). Light green shaded area denotes projection period. Vertical axis is logarithmic. Source: BLS, and author’s calculations.
Obviously, drop the large country assumption, and the resulting price increase can be up to 45%.
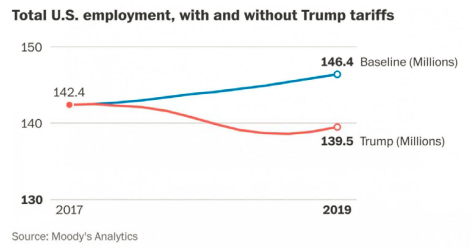
From WaPo yesterday:
An economic model of Trump’s proposals, prepared by Moody’s Analytics at the request of The Washington Post, suggests Trump is half-right about his plans. They would, in fact, sock it to China and Mexico. Both would fall into recession, the model suggests, if Trump levied his proposed tariffs and those countries retaliated with tariffs of their own.
Unfortunately, the United States would fall into recession, too. Up to 4 million American workers would lose their jobs. Another 3 million jobs would not be created that otherwise would have been, had the country not fallen into a trade-induced downturn.
The job losses would be halved if China and Mexico chose not to retaliate to the tariffs of 45 percent and 35 percent, respectively. In which case U.S. growth would flatline, but the country would not fall into recession.
Here is the key graph from the article, depicting the baseline, and the alternative under Trump:
I don’t know all the assumptions built into the simulation, and in particular I don’t know if the assumptions regarding imported goods price increases match those I’ve shown in Figure 1. But the trade flow impacts in the Moody’s simulation apparently match those in Peter Petri’s calculations, as recounted in this WSJ article.
Suffice to say, even the “no-retaliation” scenario (which in my personal, but limited, knowledge of Chinese characteristics, seems unlikely) is pretty unappealing.
That’s the Thermonuclear option. What is interesting is to consider what I call the Nuclear option, which is implicit in the position statement on Senator Sanders' website (Agenda Item 7).
We must end our disastrous trade policies (NAFTA, CAFTA, PNTR with China, etc.) which enable corporate America to shut down plants in this country and move to China and other low-wage countries.
Ending PNTR (I interpret the statement thus, as does Vox) with China sounds rather arcane, and even innocuous. After all, the acronym stands for “Permanent Normal Trading Relations”. It’s not clear what part of PNTR Senator Sanders wishes to do away with; if it’s the “P” in PNTR, then NTR will have to be renewed by Congress year after year, as it was from 1980 until 2000. How easy will that be in these times?
If NTR is not renewed, then what happens? Et voila, tariffs revert to levels applied before Most Favored Nation status was granted to China: to 44%. This figure is suspiciously close to the 45% value Donald Trump has cited.
So, what’s the difference between a Trump strike and a Sanders strike? Apparently, the only difference is that Donald Trump has promised to raise tariffs “on day one”, while Senator Sanders has not laid out a timeline. (An alternative interpretation is that Senator Sanders will only move to revoke PNTR if currency manipulation is proved, while Donald Trump won’t wait for a determination.)
More on the trade positions of both candidates here, and the likelihood each one can make a case that the Chinese currency is undervalued, here.
March 27, 2016
Uber efficiency
Ride-sharing services like Uber and Lyft are using a vastly more efficient technology for matching people who want a ride with people who want to drive them than was available when the taxi radio dispatch systems were set up in the 1940s.
One measure of that efficiency is how much time drivers spend searching for somebody who wants a ride or driving to pick them up. A new study by Judd Cramer and Alan Krueger at Princeton found that only 40% of the miles that taxis drive in Los Angeles and Seattle are spent carrying a passenger someplace the person wants to go. By contrast, for UberX the numbers are 64% and 55% for the two cities, respectively. In terms of hours worked, taxi drivers in San Francisco spend only 38% of their work hours with a passenger on board. For UberX, that number is 55%.
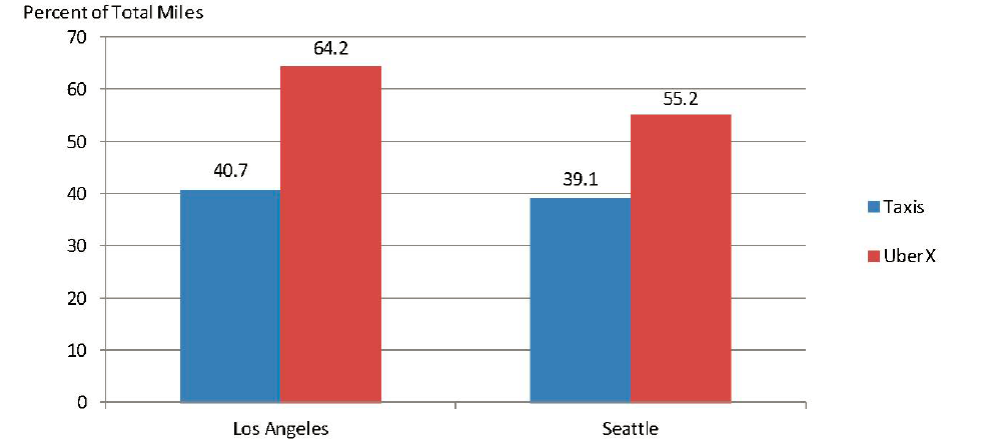
Percent of miles driven with a passenger for taxi and UberX drivers. Source: Cramer and Krueger (2016).
Another plus for the drivers is the added flexibility. Uber and Lyft drivers can work when they want, and enjoy extra pay when rides are particularly needed during peak demand.
The efficiency of the ride-share technology also directly benefits the riders. An earlier study by Berkeley transportation researchers found that 93% of San Francisco riders using Uber, Lyft, or Sidecar spent less than 10 minutes waiting for their ride and no one spent more than 20 minutes. For people trying to get a taxi come to their home, only 35% got a ride within 10 minutes, and 23% were still waiting after 20 minutes.
Who regulates Uber and Lyft? The users themselves do. After each ride, the rider rates the driver and the driver rates the rider. If the vehicle is dirty or the driver is rude or drives recklessly, that driver will very soon be out of the business.
A host of conventional regulations drive up the cost of the traditional taxi business. For example, in Chicago:
Cabdrivers have to have a chauffeur’s license, which includes training, drug testing, a physical exam and criminal background and credit checks. They pay a $600 annual fee and a $78 monthly ground transportation fee.
That all gives Uber and Lyft a pretty unfair advantage, doesn’t it? Rather than find ways to help taxis become more efficient, Chicago Alderman Anthony Beale thinks a better plan is to make Uber and Lyft less efficient. The Chicago Sun Times reports that Beale’s proposed ordinance
would require Uber and Lyft drivers to get the same city chauffeur’s licenses required for cabdrivers. In addition, Uber and Lyft drivers would be required to be fingerprinted by a city-approved vendor and get their vehicles inspected by the city.
A minimum of 5 percent of the total fleet of both companies would have to be accessible to customers with disabilities. And no ride-hailing vehicle could remain on the streets of Chicago that is more than 6 years old. Salvage, rebuilt and junk vehicles would be expressly prohibited. Lyft and Uber, whose drivers owe the city $15 million in unpaid parking tickets, red-light and speed camera fines and water bills, would also be required to immediately settle those debts to renew their operating licenses.
Lyft claims the ordinance would “make it nearly impossible for ridesharing to operate in the city”. Uber says “this would put an end to uberX in Chicago and the affordable ride Chicagoans have come to expect.”
If you agree, Uber has a petition you can use to register your views.
March 25, 2016
Wisconsin Employment Still Lags (Quelle Surprise!)
BLS just released state level data. Wisconsin employment nonfarm payroll employment is up, but remains below what is expected given the historical relationship between US and Wisconsin employment — by 63.2 thousand…
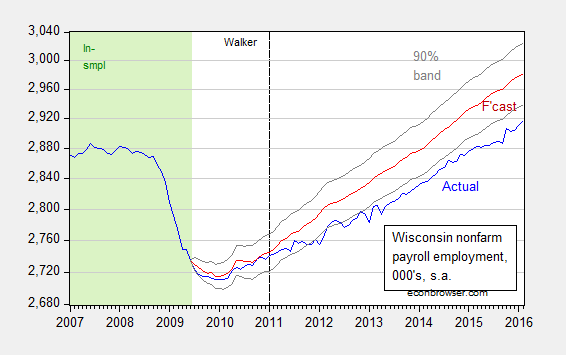
Figure 1: Wisconsin nonfarm payroll employment (blue), forecast from error correction model estimated over 1990M03-2009M06 (red), and 90% confidence band (gray lines), all on log scale. Dashed line at 2011M01 when Walker takes office, and light green denotes sample period. Source: BLS, author’s estimates (as described here).
Some have argued that Wisconsin’s lackluster performance is due to the strength of the dollar. This may be true, but it is not validated by the regression analysis. The dollar’s real value (as measured by the Fed) does not exhibit statistical significance in the error correction model. The gap between the counterfactual and actual is not cointegrated with the (log) real dollar.
March 24, 2016
Guest Contribution: “Inequality: Diagnoses and Prescriptions”
Today we are pleased to present a guest contribution written by Jeffrey Frankel, Harpel Professor of Capital Formation and Growth at Harvard University, and former Member of the Council of Economic Advisers, 1997-99. This is an extended version of one published in Project Syndicate.
Three things are striking about the rise in economic inequality since the 1970s in the United States. (1) It doesn’t really matter which measure of income distribution we choose; they all show a rise in inequality. (2) There are many different competing possible explanations and interpretations. (3) We do not need to agree on the explanation to agree on what are sensible policies to lessen inequality.
(1) Measures of inequality
There are many different measures of inequality. Even when just measuring inequality of income, one might look at the Gini coefficient, the poverty rate, income going to the upper 1% or ¼ %, the high-low range, the wage share, or median income. Also of interest are measures of the distribution of wealth and measures of inter-generational mobility. They can give different answers. If the topic is global inequality, for example, the historic economic success of many Asian countries has generated a reduction of inequality by some measures (e.g., a big fall in the poverty rate) but not by others (an increase in the high-low range).
In the United States, however, all measures have pointed the same direction since the turn of the century. They all reflect that the benefits of economic growth have gone to those at the top. The share of income going to the top 1/2 of 1 percent, for example, is up to 14%, where it was in the 1920s.
(2) Diagnoses
Normally one would think that diagnosing the cause for such a fundamental shift would be a necessary step in prescribing a cure. In that case one might be discouraged by the over-abundance of plausible explanations that have been offered and the difficulty in choosing among them.
Thomas Piketty’s Capital in the Twenty-first Century emphasized what he saw as a very long term trend arising from a high return to capital which causes inherited wealth to accumulate at a faster rate than earned income grows. The 2013 book did much to restore priority to the subject of inequality on the agenda of American economists. But most researchers see the sources of widening US inequality coming primarily from within earned income, rather than arising from the difference between earned income (wages and salaries) and unearned income (return on capital).
The first of the explanations for inequality of earned income is technological change (such as information technology) that raises the demand for skilled workers faster than the supply. It can explain an observed widening gap in wages or incomes between skilled and “unskilled” workers, defined according to whether they are college-educated. But this has little to do with the gap between the upper 1% and the rest.
The second explanation is “assortative mating,” according to which highly accomplished professional men no longer marry their secretaries but instead marry highly accomplished professional women.
The third is the “winner take all” aspects of many professions, from dentists to university professors to movie stars. Because modern media tell us who is the best dentist in town or the best movie actor in the world, relatively small differences in abilities win far bigger differences in income than they used to.
According to the fourth explanation the very high compensation of corporate executives, especially in the financial sector, is not a return to services that are in demand because they are socially valuable (like having gone to medical school or having been born with acting talent). Rather, managers essentially get to set the terms of their own pay, through compensation packages that reflect failures of corporate governance, tax law, and financial engineering. Options, for example, have failed in their original goal of relating pay to performance.
A political economy explanation is especially popular: the rich have captured the levers of power, through campaign donations, and so are able to get policies adopted that are favorable to them.
(3) Must the diagnosis determine the treatment?
It sounds reasonable that to address a problem one first has to figure out what caused it and then undo that cause. But this is not always the right approach. One does not necessarily have to figure out why a particular physical injury occurred to determine the best medical procedure for treating it.
Consider, for example, another explanation for inequality that is particularly popular in this election year: trade. To avoid the contentious question of whether trade has helped or hurt lower-income American workers generally, let’s focus on one sector where the claim that trade has hurt the employees is almost certainly true: the auto industry. 50 years ago workers who lacked a college education but were lucky enough to get a job in the auto industry could earn high wages — much higher than other US workers, let alone those abroad. But Detroit back then had a near-monopoly, which allowed it to produce cars that by modern standards cost a lot, got poor gas mileage, and broke down often. A subsequent flood of auto imports from Japan and elsewhere ended all that. One result was that the US auto industry adjusted and today is globally competitive. Another result was that the wages of auto workers were badly hit. (Notice that these were the effects of trade, not of regional trade deals like NAFTA.)
Even if one cares only about the auto workers’ wage losses and believes that trade is the sole reason for it, what remedy does one arrive at? To protect Detroit fully against foreign competition, the government would have had to raise tariffs on auto imports astronomically, so that domestically produced cars today would cost several times more than foreign produced cars. Does anyone seriously think that is a practical policy solution?
(4) Policy prescriptions
Many of the same policy prescriptions to ameliorate inequality apply regardless what is the cause. Most of them are ways to make the tax system more progressive. This includes lowering the effective marginal tax rate for low-income workers – what President Obama called “Making Work pay” (in 2009, when he passed a refundable tax credit for low income workers, until Republicans took back the Congress and eliminated it]. Enhancing the earned-income tax credit is a live option today. Obama also proposed in January’s State of the Union message expanding wage insurance, which currently helps workers who lose their jobs because of trade but could be made to help as well those who lose their jobs due to technological change. Another possible proposal would eliminate the payroll tax for low-income workers.
In light of looming deficits in social security and Medicare, it would probably be good to make such changes in the tax code revenue-neutral. (Ten years ago, reducing the deficit should have been a clear priority; five years ago, stimulating the economy should have been the short-term priority. Today there is not so strong a presumption either way.) The Republican candidates for president this year, as usual, propose massive tax cuts, focused on the rich, without a plan how to pay for them.
The lost revenue could be balanced with some measures from the following list:
End the tax break for “carried interest” — by taxing it at regular income tax rates, rather than at low capital gains tax rates (which is a pure a gift to hedge fund managers) — as Hillary Clinton wants to do.
Reduce the estate tax exemption (originally expanded by George W. Bush].
Raise the cap on payroll taxes for upper-income workers.
Remove oil subsidies and use the gas tax to fund the federal highway trust fund.
Tighten some distorting tax deductions like mortgage interest for upper income households.
A lot should be done on the spending side too. Examples include universal high-quality pre-school, health care insurance for all, and infrastructure spending. Many of these measures have been pursued by President Obama.
It is striking how little this list of policy prescriptions depends on the precise diagnosis of the problem.
Many of those who are upset about inequality — perhaps lacking patience for the minutiae of fiscal policy — are attracted to the banner of Bernie Sanders (or the banner of Donald Trump). They like the argument that one must break up banks in order to address the root cause of the problem, which is thought to be that the rich use campaign contributions to influence politicians.
Money in politics is indeed a big problem. But what do politicians use all that money for? It doesn’t go into their pockets (at least not in the US). Rather the money goes to running for office: campaign advertisements and getting out the vote. In my view, voting for the right candidates (by which I mean those who will enact the right policies) is a far more direct strategy than the convoluted Rube-Goldberg chain of causality which says one should vote for the people who want to break up the banks in order to reduce the amount of money in politics so that there will be fewer ads trying to dissuade one from voting for the right candidates.
This post written by Jeffrey Frankel.
March 22, 2016
Text of Executive Order 9066
From The Hill:
Republican presidential front-runner Donald Trump echoed rival Ted Cruz on Tuesday in calling for patrols of Muslim neighborhoods in the U.S., and said the country must begin torturing terror suspects to get information out of them.
I think this document is of some relevance to the debate regarding this proposed public policy.
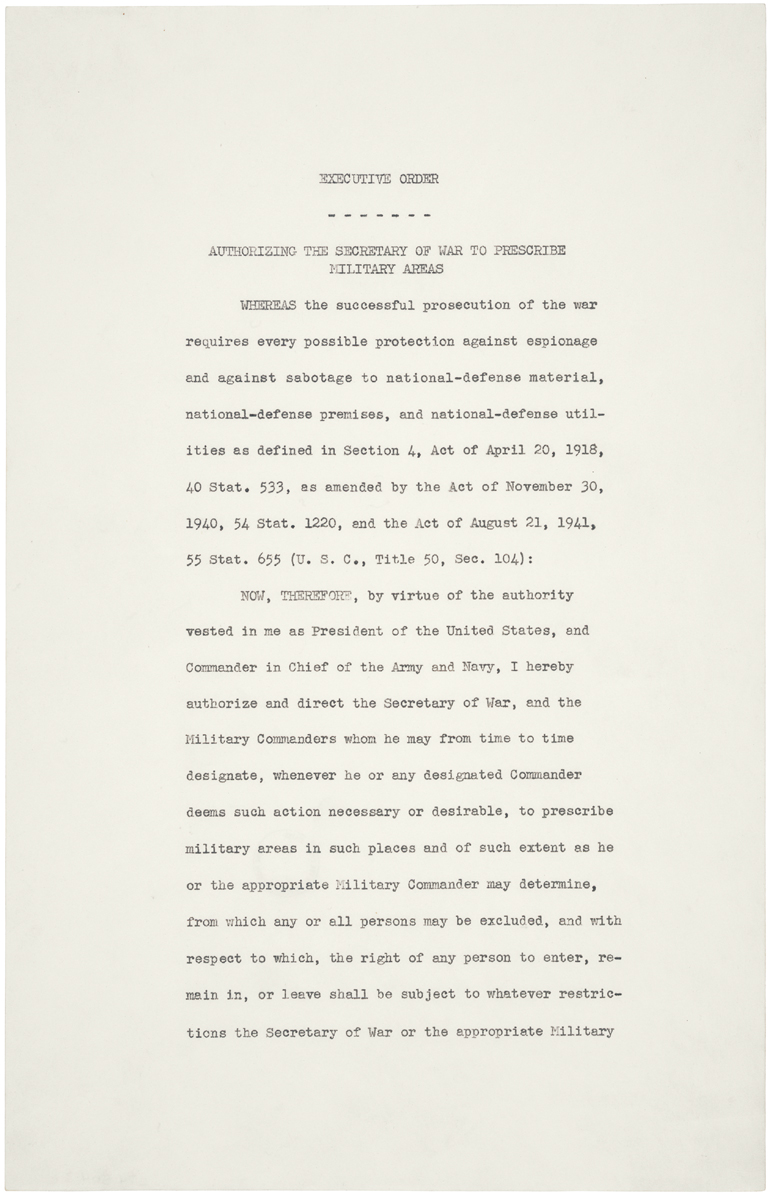
02496_2003_001.tif
Source: National Archives.
Here is some implementing language that either Mr. Trump or Senator Cruz can use.

“The End of Research in Wisconsin”
That’s the title of a Slate article documenting the implications of recent policy actions implemented in the state of Wisconsin.
What’s at stake here is the total loss of the public research university. Anyone with functioning eyes and a pulse knows that most U.S. states barely fund their universities anymore, relying instead on ballooning tuition and big donors, both private and corporate. …
But the situation in Wisconsin is worse than your garden-variety corporatization. You might assume it’s no big deal for superstar researchers to be competed for, hired, and fired like executives—and for everyone else to “just get a better job” if they don’t like what they’ve got. That might be how it works at your job, if you are lucky enough to have one. I understand this impulse to look around at your own likely weak labor protections, and wonder why those obnoxious hoity-toity professors think they deserve better than you.
But academics don’t want tenure because they think they’re better or smarter than you. Academics, whether they have it or not, want some form of tenure to exist to protect the integrity of the knowledge that is produced, preserved, and disseminated.
Wisconsin professors simply do not want research limited by the whims of 18 people appointed by a governor with an openly stated anti-education agenda. And you shouldn’t, either. Think university research doesn’t affect you? You’re wrong. Hundreds of technological and social advances that you depend upon have been made thanks to the research of some brainiac at some university somewhere: what kind of cities to plan; how (and where) to alleviate poverty and hunger; what kind of diseases to treat; what kind of drugs to invent (or make obsolete); what kind of bridges and roads to build (and where). If professors are not protected from disagreeing with the agenda of their “bosses”—whether that be Dow Chemical, Gov. Walker, or President Trump—the consequences will go far beyond one person’s paycheck.
Perhaps it’s not too late for me to start writing on how, despite slower than expected employment growth (and recent negative growth), the Wisconsin economy is actually doing just great.
What do tech leaders think? From the Wisconsin State Journal:
A $250 million cut in state funding to the University of Wisconsin System over the next two years could do great harm to Wisconsin’s economy, Madison area tech leaders said.
…
“The (technology) ecosystem just gets richer and stronger as time goes by,” said entrepreneur Sikes, who has started several art-related businesses. But $58.9 million worth of “severe” cuts to the UW-Madison budget, authorized by the Legislature and Gov. Scott Walker, are “a dark cloud,” she added. “Everybody in this room is affected.”
“To me, that is the biggest thing that happened in the last year,” said Neis, whose firm focuses on early-stage companies. “I have tremendous concerns about the future of the university and the impact of the depth of the cuts.”
Recruiting and retaining the best faculty members are important for innovation to continue, said Neis. “It is such a powerful force in this ecosystem,” he said.
“The changes won’t be felt right away,” he said. Rather, the impact on research projects might be felt over the course of a decade. “And I’m worried, two years out, that some could argue that, ‘See, the sky didn’t fall, everything’s OK,’ when, in fact, it is falling and we just don’t notice it, yet.”
More concretely, we have evidence that faster growth is associated with a larger stock of human capital.
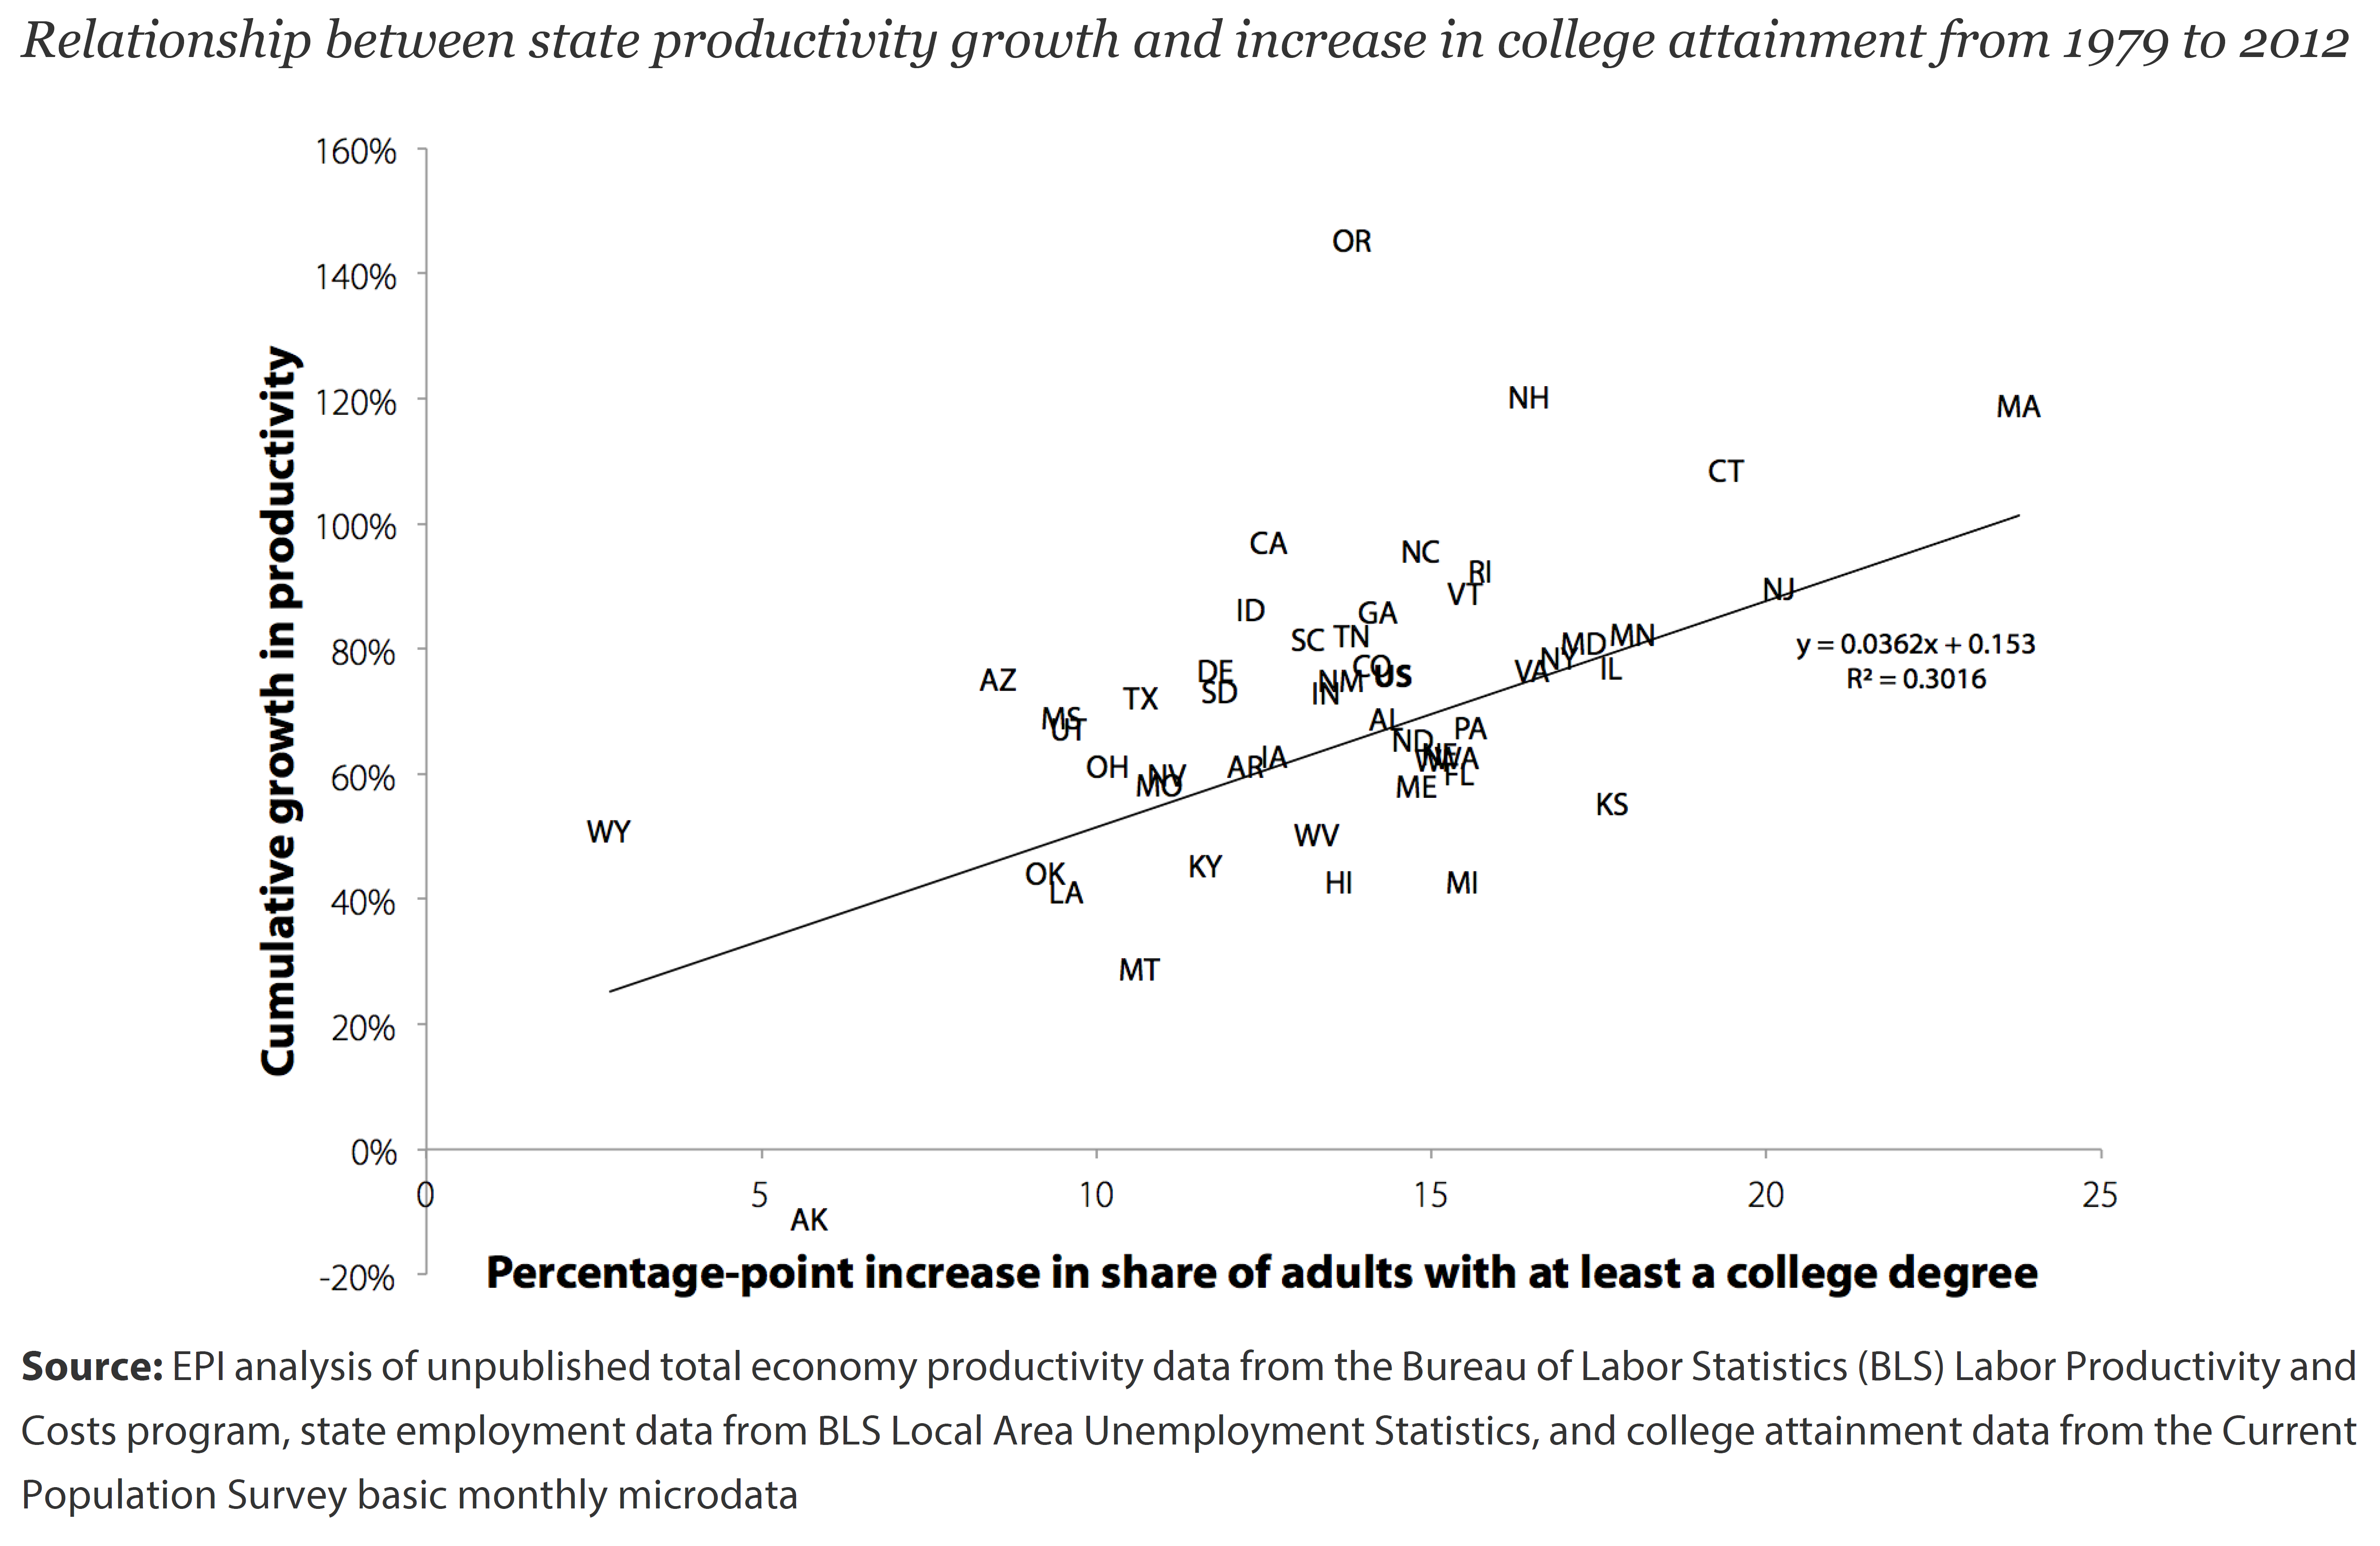
Source: Berger-Fisher (2013).
In this regard, I find it interesting that in the drive to defund the University of Wisconsin system, the state seems to be moving in the exact opposite direction of re-orienting the Wisconsin economy away from manufacturing industries that are experiencing increasing competition from abroad, and slowing demand growth from at home.
Menzie David Chinn's Blog


