
Menzie David Chinn's Blog, page 14
February 25, 2016
Guest Contribution: “How to Mitigate Adverse Spillovers from BRICS? Role of Policies”
Today we are pleased to present a guest contribution written by Raju Huidrom, M. Ayhan Kose, Franziska Ohnsorge, and Lei Sandy Ye, all of the World Bank. The findings, interpretations, and conclusions expressed in this article are entirely those of the authors. They do not necessarily represent the views of the World Bank, its Executive Directors, or the countries they represent.
Since 2010, emerging market economies, especially the majority of the largest ones, have been undergoing a synchronous growth slowdown (Didier et al. 2015). Such a synchronous slowdown could bring significant adverse spillovers to the rest of the world, given the size and integration with the global economy of the largest emerging markets—the BRICS (Brazil, Russia, India, China, South Africa). The slowdown could transmit to other economies through trade and financial channels, through commodity prices, and through confidence effects. Against this background, this blog addresses two questions: (a) how large are the adverse spillovers from BRICS? (b) what policies could help mitigate their impact?
Magnitude of spillovers
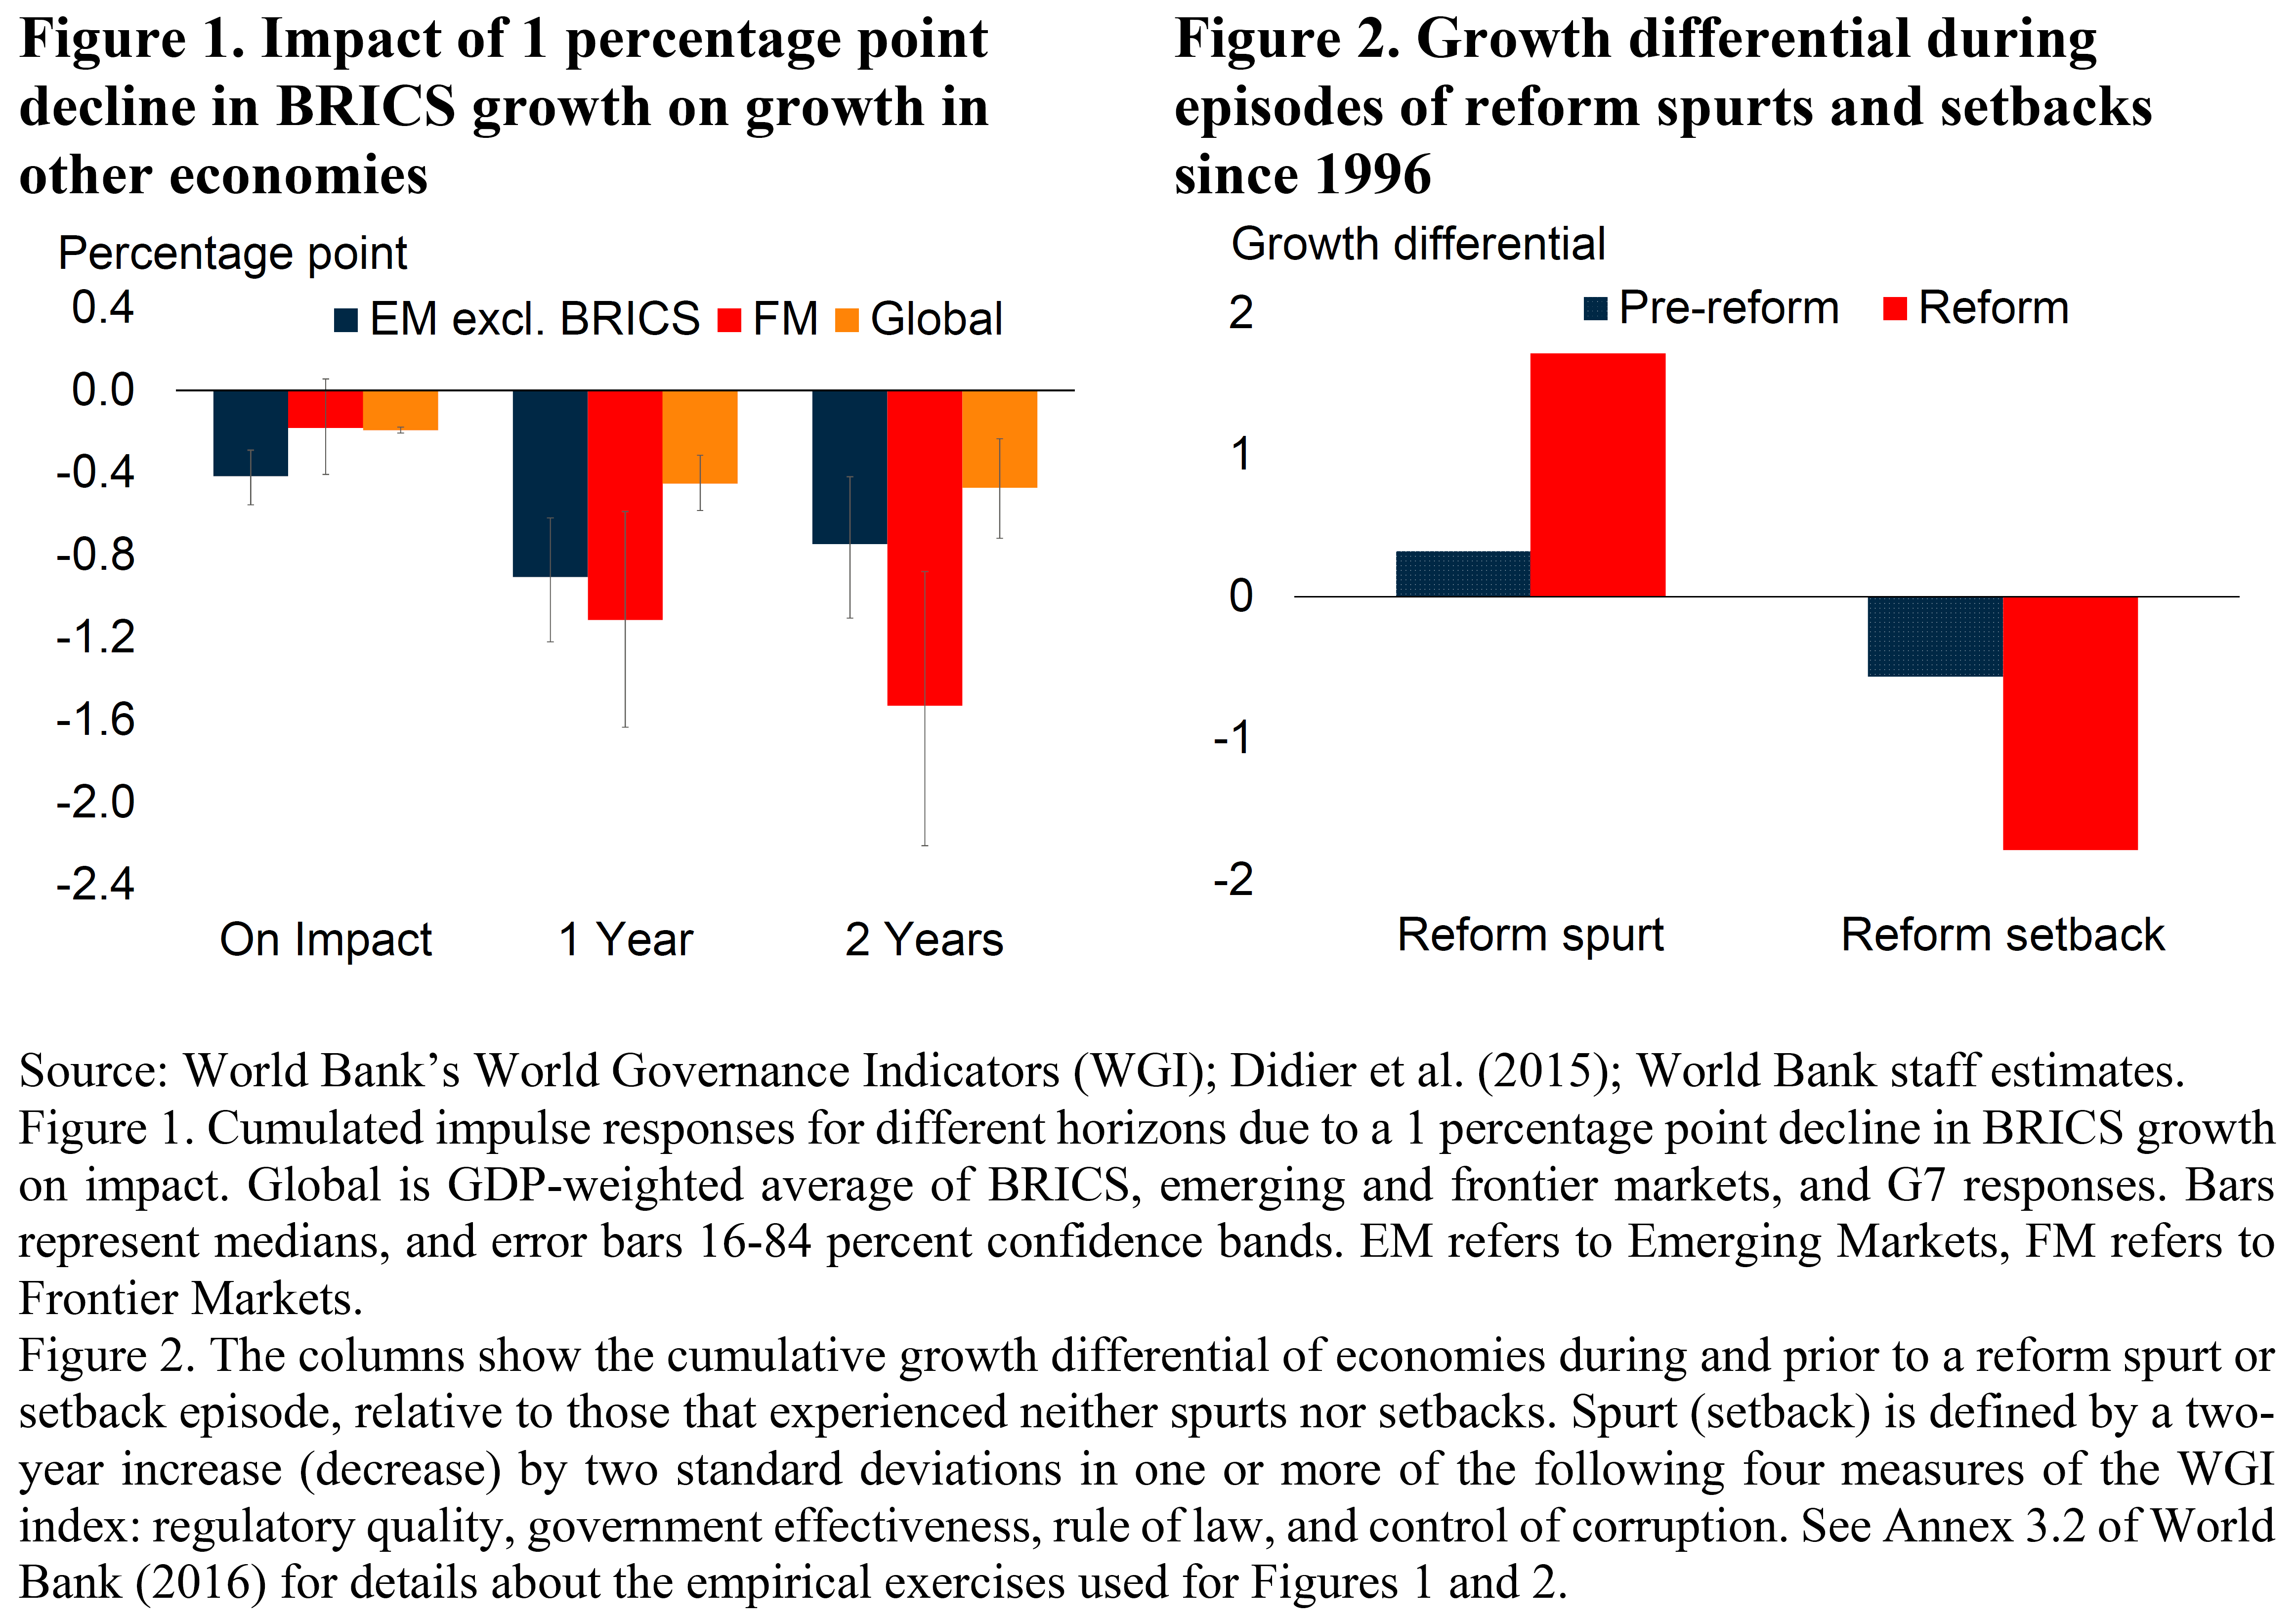
A growth slowdown in BRICS could reduce global growth and, especially, growth in other emerging markets and in frontier markets (World Bank 2016). On average, a 1 percentage point decline in BRICS growth could, over the following one to two years, reduce global growth by 0.4 percentage point, growth in other emerging markets by 0.8 percentage point and growth in frontier markets by 1.5 percentage points (Figure 1). Spillovers could also be considerably larger if the BRICS growth slowdown were combined with financial market stress.
Among the BRICS, spillovers from China are the largest while those from others tend to be either small or confined to neighboring economies. Commodity markets are a key transmission channel of spillovers from China to other emerging markets, as China is a major source of demand for key commodities. Thus, growth in commodity exporters could slow by more than that in importers in response to a decline in growth in China.
Policy responses
Policies can play an important role in mitigating the adverse impact of spillovers from slowing growth in the BRICS. The appropriate policy response depends on the nature of the shock and the spillovers: a cyclical downturn in BRICS would generate temporary adverse spillovers that could be mitigated by counter-cyclical fiscal and monetary policies; a structural downturn in potential growth in BRICS would require the implementation of structural reforms. The growth slowdown in BRICS has been partly a cyclical decline from the immediate post-crisis rebound in 2010, and partly a structural slowdown (Didier et al. 2015). Hence, a mix of counter-cyclical fiscal or monetary policy stimulus and structural reforms could be used to support activity.
Fiscal policy. Fiscal stimulus could help stabilize a cyclical slowdown in activity. Fiscal multipliers—the change in real GDP generated by a 1 dollar increase in fiscal spending—tend to be larger during recessions than expansions, in countries with ample fiscal space, in less open economies, and for stimulus conducted through expenditure increases, especially public investment, rather than tax cuts (World Bank 2015). A spillover-induced, cyclical slowdown in activity may be an opportunity to address sizeable infrastructure needs in emerging markets, since infrastructure investment can be a particularly effective form of fiscal stimulus. Fiscal stimulus, however, is only fully effective if sufficient fiscal space is available (World Bank 2015). Many emerging markets have used much of their policy space during the global stimulus of 2009 and have yet to rebuild it. Many of them may therefore not be in a position to implement effective counter-cyclical stimulus.
Monetary policy. Like fiscal policy, monetary policy could boost growth amidst a temporary slowdown in activity. However, room for monetary policy stimulus has narrowed in many emerging markets, especially commodity-exporting emerging economies. Some commodity-importing emerging markets with low inflation, in contrast, may have some room to dampen external shocks with further interest rate cuts. However, once oil prices stabilize and inflation begins to rise, this room may diminish.
Structural policies. A sustained, structural decline in BRICS growth potential rather than a temporary cyclical downturn would generate spillovers that likely result in an era of lower growth in other emerging market economies. While at times politically challenging to implement, structural reform measures can help emerging markets adjust to this new era of weak growth. Structural reforms are associated with long-term benefits such as growth spurts triggered by reforms (Figure 2), amplification of the growth dividends from public investment, greater job creation and formal sector activity. A renewed structural reform push could therefore help lift growth prospects and, to the extent it encourages investment, support domestic demand as well as help improve investor sentiment and capital flows.
Conclusion
The growth slowdown in BRICS could adversely affect global growth, in particular growth in other emerging markets and frontier markets. Spillovers from BRICS would be more pronounced if the slowdown were accompanied by financial market stress. Policy makers may need to support activity with fiscal and monetary stimulus, at least where policy buffers are available. They could derive substantial gains from well-designed, credible structural reforms that retain investor confidence and capital flows in the short-run, and that help lift growth prospects for the long-run. This would be especially appropriate for countries with limited room for expansionary fiscal and monetary policies.
References
This post written by Raju Huidrom, M. Ayhan Kose, Franziska Ohnsorge, Marc Stocker, and Lei Sandy Ye.


Guest Contribution: âHow to Mitigate Adverse Spillovers from BRICS? Role of Policiesâ
Today we are pleased to present a guest contribution written by Raju Huidrom, M. Ayhan Kose, Franziska Ohnsorge, and Lei Sandy Ye, all of the World Bank. The findings, interpretations, and conclusions expressed in this article are entirely those of the authors. They do not necessarily represent the views of the World Bank, its Executive Directors, or the countries they represent.
Since 2010, emerging market economies, especially the majority of the largest ones, have been undergoing a synchronous growth slowdown (Didier et al. 2015). Such a synchronous slowdown could bring significant adverse spillovers to the rest of the world, given the size and integration with the global economy of the largest emerging marketsâthe BRICS (Brazil, Russia, India, China, South Africa). The slowdown could transmit to other economies through trade and financial channels, through commodity prices, and through confidence effects. Against this background, this blog addresses two questions: (a) how large are the adverse spillovers from BRICS? (b) what policies could help mitigate their impact?
Magnitude of spillovers
A growth slowdown in BRICS could reduce global growth and, especially, growth in other emerging markets and in frontier markets (World Bank 2016). On average, a 1 percentage point decline in BRICS growth could, over the following one to two years, reduce global growth by 0.4 percentage point, growth in other emerging markets by 0.8 percentage point and growth in frontier markets by 1.5 percentage points (Figure 1). Spillovers could also be considerably larger if the BRICS growth slowdown were combined with financial market stress.
Among the BRICS, spillovers from China are the largest while those from others tend to be either small or confined to neighboring economies. Commodity markets are a key transmission channel of spillovers from China to other emerging markets, as China is a major source of demand for key commodities. Thus, growth in commodity exporters could slow by more than that in importers in response to a decline in growth in China.
Policy responses
Policies can play an important role in mitigating the adverse impact of spillovers from slowing growth in the BRICS. The appropriate policy response depends on the nature of the shock and the spillovers: a cyclical downturn in BRICS would generate temporary adverse spillovers that could be mitigated by counter-cyclical fiscal and monetary policies; a structural downturn in potential growth in BRICS would require the implementation of structural reforms. The growth slowdown in BRICS has been partly a cyclical decline from the immediate post-crisis rebound in 2010, and partly a structural slowdown (Didier et al. 2015). Hence, a mix of counter-cyclical fiscal or monetary policy stimulus and structural reforms could be used to support activity.
Fiscal policy. Fiscal stimulus could help stabilize a cyclical slowdown in activity. Fiscal multipliersâthe change in real GDP generated by a 1 dollar increase in fiscal spendingâtend to be larger during recessions than expansions, in countries with ample fiscal space, in less open economies, and for stimulus conducted through expenditure increases, especially public investment, rather than tax cuts (World Bank 2015). A spillover-induced, cyclical slowdown in activity may be an opportunity to address sizeable infrastructure needs in emerging markets, since infrastructure investment can be a particularly effective form of fiscal stimulus. Fiscal stimulus, however, is only fully effective if sufficient fiscal space is available (World Bank 2015). Many emerging markets have used much of their policy space during the global stimulus of 2009 and have yet to rebuild it. Many of them may therefore not be in a position to implement effective counter-cyclical stimulus.
Monetary policy. Like fiscal policy, monetary policy could boost growth amidst a temporary slowdown in activity. However, room for monetary policy stimulus has narrowed in many emerging markets, especially commodity-exporting emerging economies. Some commodity-importing emerging markets with low inflation, in contrast, may have some room to dampen external shocks with further interest rate cuts. However, once oil prices stabilize and inflation begins to rise, this room may diminish.
Structural policies. A sustained, structural decline in BRICS growth potential rather than a temporary cyclical downturn would generate spillovers that likely result in an era of lower growth in other emerging market economies. While at times politically challenging to implement, structural reform measures can help emerging markets adjust to this new era of weak growth. Structural reforms are associated with long-term benefits such as growth spurts triggered by reforms (Figure 2), amplification of the growth dividends from public investment, greater job creation and formal sector activity. A renewed structural reform push could therefore help lift growth prospects and, to the extent it encourages investment, support domestic demand as well as help improve investor sentiment and capital flows.
Conclusion
The growth slowdown in BRICS could adversely affect global growth, in particular growth in other emerging markets and frontier markets. Spillovers from BRICS would be more pronounced if the slowdown were accompanied by financial market stress. Policy makers may need to support activity with fiscal and monetary stimulus, at least where policy buffers are available. They could derive substantial gains from well-designed, credible structural reforms that retain investor confidence and capital flows in the short-run, and that help lift growth prospects for the long-run. This would be especially appropriate for countries with limited room for expansionary fiscal and monetary policies.
References
This post written by Raju Huidrom, M. Ayhan Kose, Franziska Ohnsorge, Marc Stocker, and Lei Sandy Ye.
February 24, 2016
Implied Output Response to Demand Side Shifts in the Friedman Scenario under Local to Potential Assumptions
What does a conventional (estimated) macroeconometric model imply for a sustained 7.7% increase in government consumption and investment as a share of GDP in terms of output.
Table 19 in Friedman (2016) provides a tabulation of annual expenditures implied by his understanding of the Sanders economic plan. Not all of the spending is government consumption and investment — some is government transfers. However, if I assume that the marginal propensity to consume out of these transfers is unit, then the calculation is simplified (in any case, the big expenditures are health care).
Figure 1 depicts the deviation from CBO (January 2016) baseline, as a share of baseline GDP.
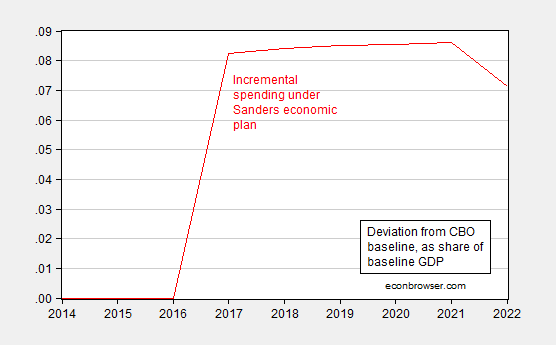
Figure 1: Deviation from CBO baseline in government consumption and investment, as a share of CBO baseline GDP, in Ch.09$, by fiscal year. Source: CBO, Budget and Economic Outlook, 2016-2022 (January 2016); Friedman (2016), Table 19, and author’s calculations.
On average, government spending (will be higher by 7.7 percentage points of baseline GDP). I can just assume constant spending over the sample period, and use the multipliers from a given study to determine the resulting output. In this case, I use the OECD’s New Global Model, described in this 2010 working paper. Here’s a short description of the macroeconometric model:
…Compared with its predecessors, the new model is more compact and regionally aggregated, but gives more weight to the focus of policy interests in global trade and financial linkages. The country model structures typically combine short-term Keynesian-type dynamics with a consistent long-run neo-classical supply-side. While retaining a conventional treatment of international trade and payments linkages, the model has a greater degree of stock-flow consistency, with explicit modelling of domestic and international assets, liabilities and associated income streams. Account is also taken of the influence of financial and housing market developments on asset valuation and domestic expenditures via house and equity prices, interest rates and exchange rates. As a result, the model gives more prominence to wealth and wealth effects in determining longer-term outcomes and the role of asset prices in the transmission of international shocks both to goods and financial markets.
I don’t take into account any of the supply-side effects Friedman outlined (impact on participation rate, for instance). Also, deficits are endogenous, assumed to be stabilized by way of general tax increases, instead of increases in tax progressivity, and taxes on financial transactions. [Specifically in the model, “…the fiscal rule was set to raise direct taxes by approximately one fifth (per annum) of the deviation in the deficit as a percentage of GDP from its baseline path. In the present case, for the countries undertaking fiscal stimulus, this implies more-or-less linear increases in household taxes, rising to be approximately 1 percentage point higher by the fifth year of the shock.”] Hence, the calculation incorporates only the demand side spending effects. Figure 2 shows the deviation from CBO baseline.
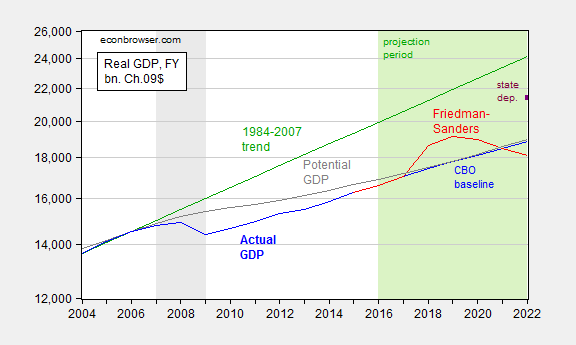
Figure 2: Output, in bn Ch.09$ (blue), output under Friedman scenario using OECD (2010) multipliers (red), output under Friedman scenario using Auerbach and Gorodnichenko (2012) recession multiplier of 1.75 (purple square at 2022), CBO potential GDP (gray) and 1984-2007 trend, all by fiscal year. NBER defined recession dates shaded gray; projection period shaded light green. Source: CBO, Budget and Economic Outlook, 2016-2022 (January 2016); Friedman (2016), Table 19, OECD (2010), Table 3, Auerbach and Gorodnichenko (2012), and author’s calculations.
In this calculation, output reverts fairly quickly toward baseline even with a massive increase in spending. This reflects the neoclassical assumptions built into the model in the long run; implicitly it also reflects the assumption that one is not too far away from potential GDP when the stimulus is undertaken. Hence, as I indicated in this post, in the absence of assuming a flat aggregate supply curve, the assumption regarding the initial extent of economic slack are critical. If indeed the current output gap is -18% or so, then likely the multiplier might be bigger than 1, and perhaps is close to 1.75, as noted in this post. If on the other hand, output is already close to potential in FY2017 (when the spending is assumed to begin), then the multiplier might be closer to 0.5.
So, where you think you will end up depends a lot on where you think you are now…
February 22, 2016
Guest Contribution: âArgentina: A Big Change with Problematic Initial Conditionsâ
Today, we are pleased to present a guest contribution written by Maria Muniagurria, faculty member in Economics at the University of Wisconsin – Madison.
A little over two months ago, Mauricio Macri began his tenure as president after his coalition of center-right parties prevailed over the ruling partyâs candidate by a small margin.
This is the first significant political change in many years, since the left leaning branch of âperonistâ party held the executive office since 2003 (both husband and wife Nestor and Cristina Kichner held the presidency). The following statement by former Finance Minister Kicillof summarizes the previous administrationâs approach to economic policy: âsince 2003, Argentina has been implementing … an economic model of growth with social inclusion, where inclusion and redistribution of income are seen as a precondition for growth and not vice-versa, as stated by the mainstream economic preceptsâ (October 2015 statement to the IMF).
Very favorable primary commodity prices and high export taxes financed large government expenditures (social programs, variety of subsidies) for many years but when the conditions started to reverse the country slipped into a path characterized by government deficits, inflation and foreign exchange controls. The 2001 default and the subsequent one in 2014 resulted in an almost complete exclusion of the country from international financial markets and since 2007 the government engaged in the manipulation of statistical data.
Since it took office last December 10th, the new administration has taken a number of important steps towards the elimination of major distortions, restoration of data transparency and return to international financial markets in the midst of a complicated political and social environment.
The economic team inherited a very difficult situation with an inflation rate reaching about 25-30 % a year, a government deficit of 7.1% of GDP and almost depleted foreign exchange reserves.
The main economic policy measures have been: 1) elimination of the foreign currency controls (âcepoâ or âclampâ) and unification of the foreign exchange market; 2) declaration of an âstatistical emergencyâ; 3) partial elimination of utility subsidies; 4) decrease of export taxes on soy (from 35% to 30%) and elimination of those for beef, wheat and corn, 5) negotiations towards the return of the country international financial markets (negotiations with debt âholdoutsâ ).
Data Transparency Issues and Inflation
Until 2007, Argentina had a high quality and internationally recognized national statistical office: the Instituto Nacional de Estadisticas y Censos (INDEC). At that time, political considerations motivated an âinterventionâ designed first to manipulate the inflation index. Unqualified political appointees replaced skilled statisticians and irregularities were commonplace both in data collection and reporting. Several indicators were no longer reported (poverty data among them), ânew indexesâ replaced long running ones and the unreliability of the economic data reported was documented by many (see for example Cavallo 2012)
In 2012, the IMF issued a warning to Argentine (Reuters) for not taking the necessary steps to improve the quality of its reported data (after earlier complains were not addressed) and proceeded to a motion of censure/official reprimand in 2013 (Bloomberg). The displaced statisticians received support from the American Statistical Association and in 2012 The Economist removed official price data from its tables.
The new government identified as a top priority the âreconstructionâ of INDEC and the return to accurate data reporting. A âstatistical emergencyâ was declared in December with two goals: facilitate the removal of unqualified staff /political appointees and temporarily suspend the report of inaccurate data while revisions are taking place. The task has proven to be quite challenging since there is political urgency to come up with an official inflation indicator (used by the powerful trade unions for salary negotiations and for many indexed contracts) and statisticians differ in their assessment of the time needed to produce quality data (see Buenos Aires Herald 2-16-16 for an account of a recent departure from the team).
After 2007, alternative price indexes gained relevance and new ones were calculated and widely used by economic actors and politicians. Figure 1 shows the large discrepancy between INDEC data (blue lines, two versions of the CPI) and alternative ones. The gray line shows data from the statistical office of the province of San Luis, the red one is from the statistical office of the city of Buenos Aires and the dotted line is from a private group.
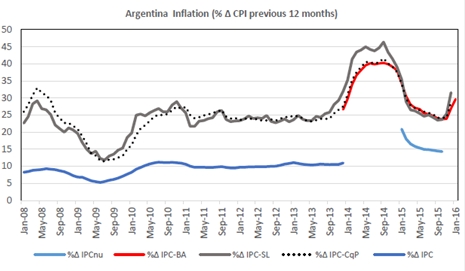
Figure 1: Sources: INDEC, Cosas que Pasan, DPEyC-San Luis, DGEyC-Ciudad de Buenos Aires
Inflation surged in November and December (even before the official change of government) fueled by expectations regarding the future value of the dollar.
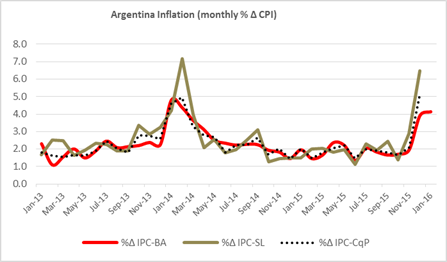
Figure 2: Sources: Cosas que Pasan, DPEyC-San Luis, DGEyC-Ciudad de Buenos Aires
Foreign Exchange / Trade and Finance
In November 2011 the government began to impose strict controls on the foreign exchange markets (trying to stop the decrease of the Central Bankâs foreign reserves) what made almost impossible for ordinary citizens to purchase dollars and severely restricted imports. The âcepoâ (or clamp) resulted in the emergence of a black market for foreign currency, and the âofficialâ value of the dollar was kept artificially low. Exports suffered (producers were hoarding grain), import restrictions severely affected the availability of industrial inputs, and tourists expenses overseas (at an undervalued exchange rate) ballooned.
On December 16, after securing additional dollar reserves (due to a Yuan-dollar swap with China) and later a bridge loan from a group of international banks, the government fulfilled its campaign promise of lifting the âcepoâ. The exchange rate adjusted: there was an immediate devaluation of 35% and a gradual depreciation of the peso afterwards to arrive to a 55% devaluation since the lifting of the âcepoâ. The market has been operating without Central Bank intervention – except for one day last week – what should be considered as an important success. Figure 3 shows the paths of the official and black market rates and Figure 4 that of the international reserves.
Since the 2001 default, Argentina has been unable to borrow internationally and has been involved in a prolonged dispute with âholdoutâ bondholders (the 7% of that did not accept the 2005-7 restructuring). One of the judicial rulings (in New York courts) forced the default on the restructured debt in 2014. The current government has made significant progress in resolving the dispute and has stated its desire to return to the international financial markets (see The Economist 2-6-16).
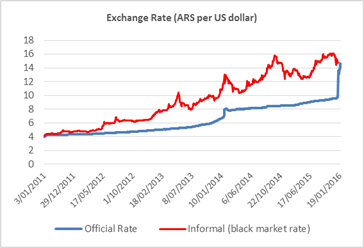
Figure 3: Source: Diario La Nación
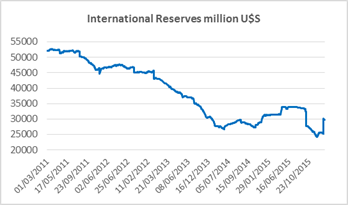
Figure 4: Source: BCRA (Argentine Central Bank) EstadÃsticas.
High primary commodity prices resulted in a favorable Current Account for many years but the decline in those prices and large energy imports moved the balance into negative territory (see Figures 5 and 6). The new economic team reduced export taxes on soy by 5% and eliminated those on wheat, corn and beef. These adjustments together with the devaluation are expected to increase exports and the local supply of dollars.
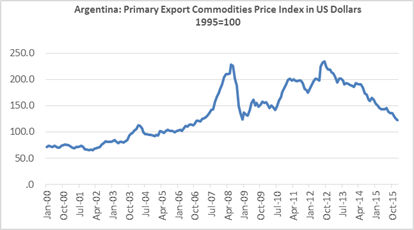
Figure 5: Source: BCRA (Argentine Central Bank) EstadÃsticas. (Weights are based on a commodityâs importance in Argentinaâs exports)
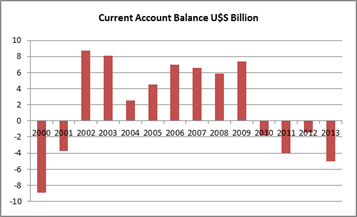
Figure 6: Source: IMF World Economic Outlook database, October 2015
The Fiscal Situation
Argentina has a long history of lack of fiscal discipline but fiscal surpluses during the six years following the 2001 crisis provided a remarkable exception. The situation deteriorated after 2008, the deficits returned and the inability to finance them with debt left monetary emission as the only alternative to finance them (see Figures 7 and 8 and Maselli y Nicolini 2014).
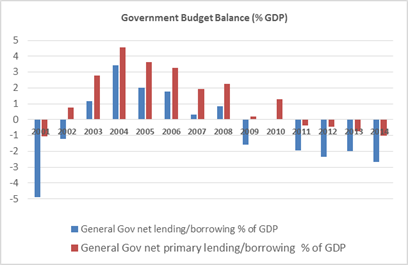
Figure 7: Source: IMF World Economic Outlook database, October 2015
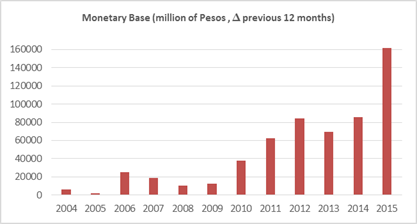
Figure 8: Source: IMF World Economic Outlook database, October 2015
Fiscal Plan and Inflation Targets, Central Bank Priorities
In early January, Finance Minister Alfonso Prat-Gay announced fiscal and inflationary targets stressing that government will stop financing deficits through transfers from the Central Bank to the treasury (monetary emission). The inherited primary fiscal deficit for 2015 was 5.8 % of GDP and increased to 7.1 % when interests and unpaid debts are included. The target is to reduce it by about 1.5 % GDP points per year to maintain governability. The inflation targets are 20-15% for the current year and 14%, 10% and 5% for the next ones.
According to Prat-Gay, President Macri directed him to keep social spending (welfare programs) untouched, increase investment if possible and find ways to reduce waste in every central government agency. The plan also includes removing subsidies to energy purchases in Buenos Aires, reducing the number of public employees that are not engaged in productive work (political appointees unqualified or not needed) while benefiting vulnerable citizens by cutting value added taxes on essential goods and increasing the threshold and brackets at which workers begin paying income taxes (Bloomberg 1-13-16, Enernews 1-13-16). The details of how the deficit will be financed during the first couple of years have not been announced.
Central Bank President Federico Sturzeneger also moved quickly to announce the bank’s policy objectives for 2016 and identified price stability as one of his main his priorities (also one of the missions of the bank according to its funding laws). He pointed out that in the past years, Treasury demands to finance fiscal shortfalls hindered the ability of the bank to fulfill this crucial part of its mission.
There is no doubt that lowering the inflation rate and reducing fiscal unbalances while maintaining governability will require not only sound economic policy but smart political decisions and a big dose of good luck. Macriâs team is very well qualified to take on this difficult task …so we hope for the best.
References
American Statistical Association, AMSTATNews
Banco Central de la Republica Argentina (BCRA)
Maselli, Luis y Nicolini , Juan Pablo. Monitor Fiscal , Marzo 2014, Foro Economico
Ministerio de EconomÃa: Plan Fiscal y Metas de Inflación 2016-19
This post written by Maria Muniagurria.
February 21, 2016
Stock prices and oil prices
Ben Bernanke weighs in on why stock prices and oil prices have been moving together recently.
February 20, 2016
What Is the Assumed Output Gap in the Friedman Projections?
Matt Klein has defended the calculations in the Friedman study of the Sanders plan as “not extreme”. In particular he has used this graph to show that 5.3% sustained growth will only close the output gap toward the end of the projection period. (Note: I do not know what the output gap actually used in the Friedman study, as it is not reported.)
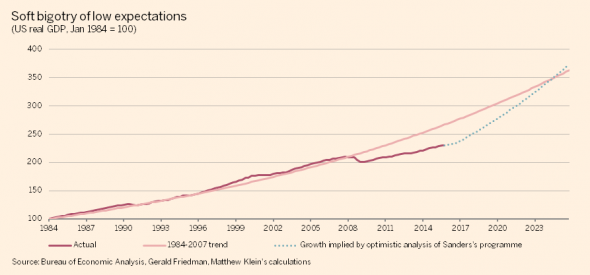
One thing that should be remembered is that the trend line extrapolated from 1984-2007 implies that the output gap as of 2015Q4 is … -18%. A graphical comparison which highlights the implausibility of the -18% output gap is shown below:
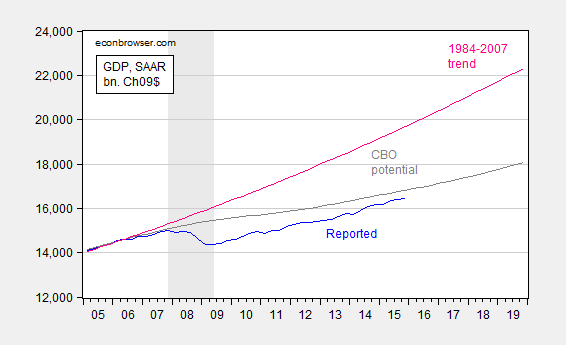
Figure 1: GDP (blue), potential GDP from CBO (gray), and exponential deterministic trend estimated from 1984-2007 (pink). NBER defined recession dates shaded gray. Source: BEA (2015Q4 advance), CBO Budget and Economic Outlook, 2016-26 data appendix, NBER and author’s calculations.
By way of comparison, the CBO’s estimate is -2.2% (both in log terms). OECD estimates 2015Q4 output gap at -1.9%. [1] The IMF in its Article IV consultation with the United States estimated a gap of -1.6 percentage points of potential GDP for 2015, -0.7 percentage points for 2016. [2] If indeed the output gap is 18 percentage points, most mainstream economists would expect to see substantially lower core inflation than what we have observed thus far.
One could argue that low headline price inflation suggests more slack than these estimates indicate. I have two observations: (1) the most recent report of higher core CPI inflation runs counter to the presumption of enormous slack, and (2) using a modified Ball-Mankiw approach and the lower inflation back in 2015Q3, and assuming completely anchored inflation expectations, the implied gap was much smaller in absolute value terms than 18%.
Another way to resurrect the proposition that the assumptions built into the projections are not extreme is to assert that the aggregate supply curve is very flat (see footnote 16 in Friedman (2016)).
Addendum, 2/20 7pm Pacific: I want to stress that estimating potential GDP and the output gap is a difficult task. For those interested in the details, read these posts: [3] [4] [5].
Chinese Foreign Currency External Debt
One constraint on devaluation as a means of stimulating the economy comes from the balance sheet. When there is a big stock of external debt denominated in foreign currency, a devaluation increases the amount of debt evaluated in domestic currency terms, potentially driving some firms into insolvency. How does China look in these terms?
From Goldman Sachs’ Top of Mind publication (February 9, 2016; “China Ripple Effects”) [not online]:
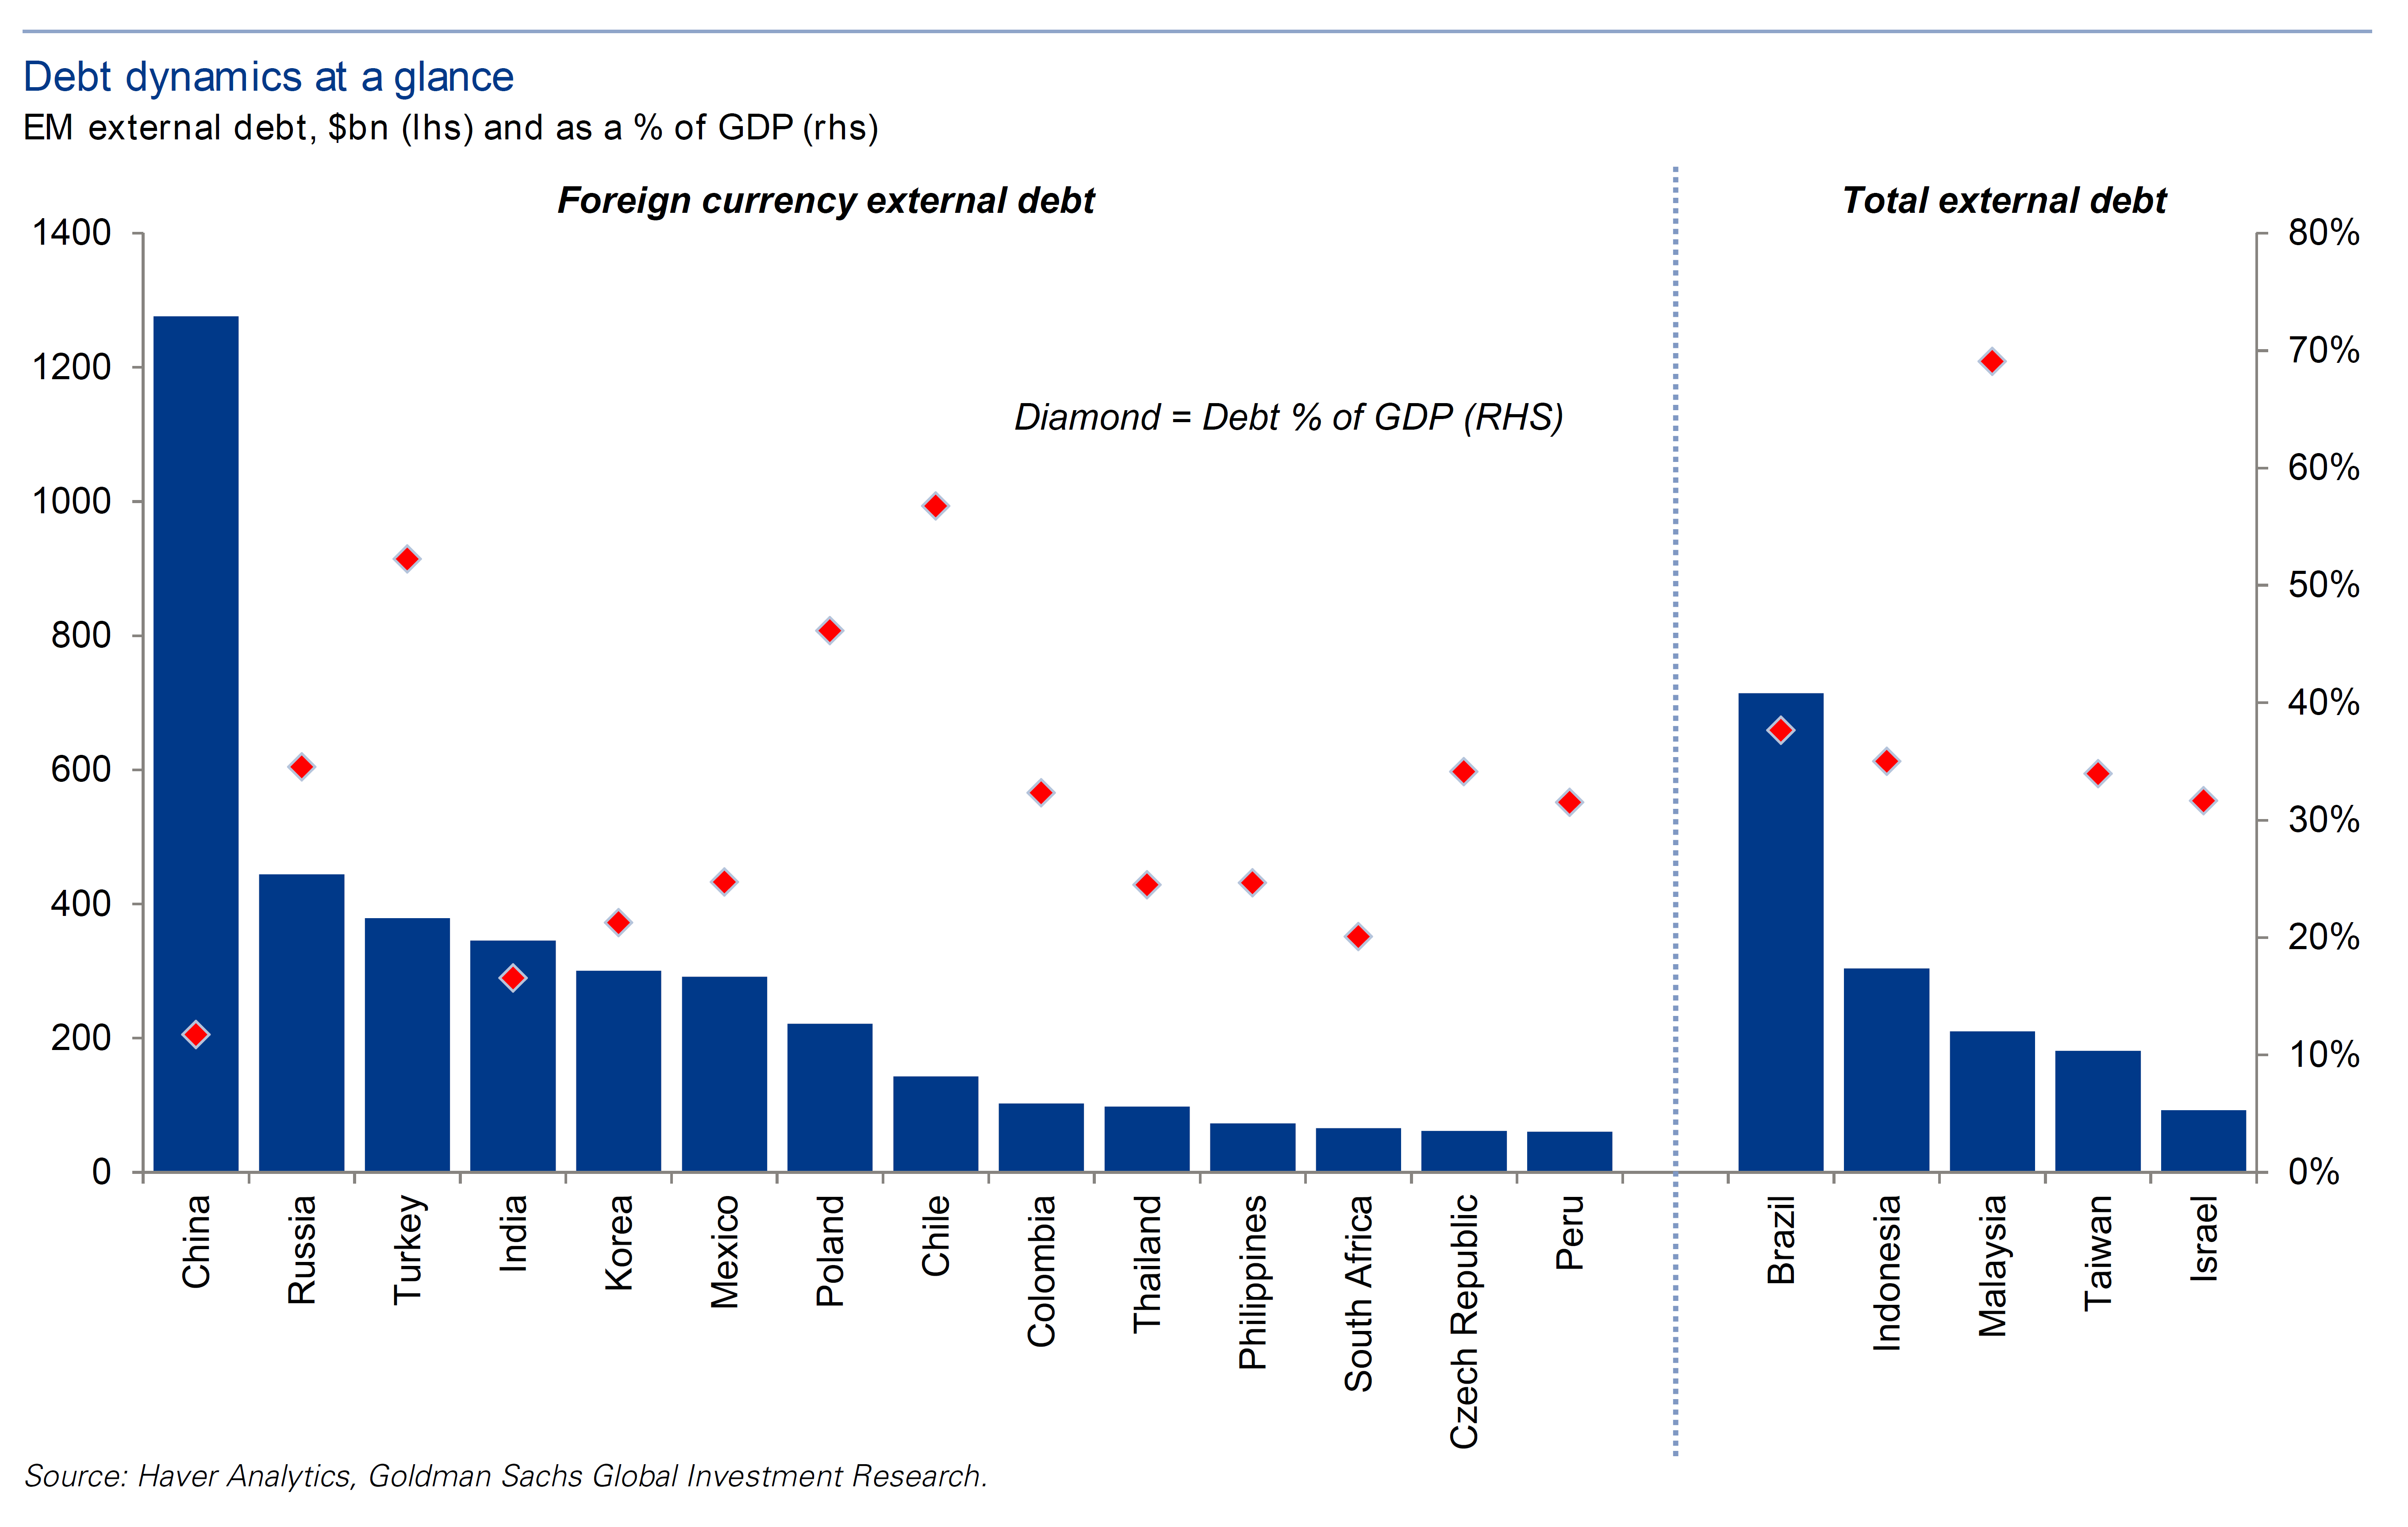
Source: Caesar Maasry, “The $5 Trillion Issue,” Top of Mind, Goldman Sachs, February 9, 2016.
The foreign currency debt expressed as a ratio to GDP does not seem particulary extreme. In addition, Maasry notes:
[W]hen offshore borrowings are included, China’s total external debt totals an estimated $2.1tn as of end-2Q15 (latest figures), or 20% of GDP, with 60% of total external debt ($1.28tn), or 12% of GDP, listed in foreign currency. When including onshore FX loans, the total amount of
FX debt borrowed by China’s corporate sector as of mid-2015 jumps to $1.8tn. Although this figure is sizeable, net FX debt (after deducting the corporate sector’s FX assets) is only $793bn…
February 19, 2016
Trade Policy Parallels
Surely, it’s occurred to others, but I find the following comparison of trade policy stances quite remarkable.
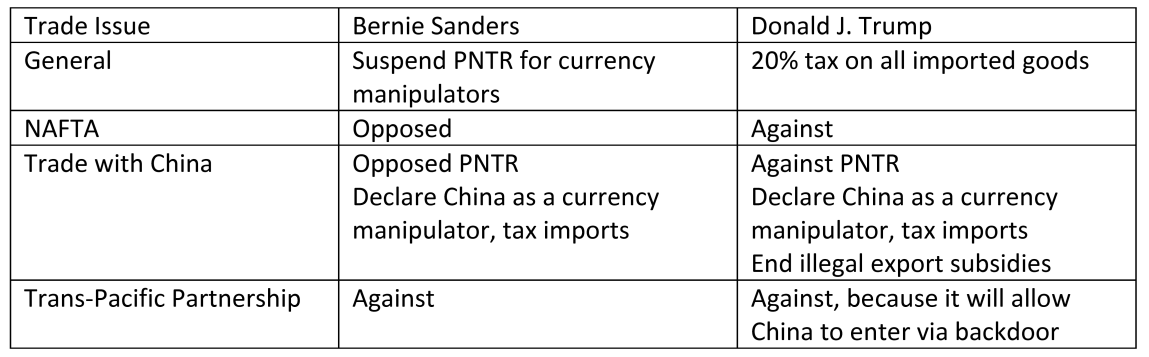
Note: PNTR denotes Permanent Normal Trade Relations, formerly known as “Most Favored Nation” status. Source: Author’s tabulations based on the following sources:
Bernie Sanders on Trade
Congressional Progressive Caucus: Principles for Trade
Trump: Reforming the U.S.-China Trade Relationship to Make America Great Again
On the Issues: Donald Trump on Free Trade
PolitiFact: Trump says China gets and advantage from the Trans-Pacific Partnership
Bold Face URLs denote official campaign websites.
February 18, 2016
The Counter-cyclical Stabilization Policies of the Democratic Presidential Candidates
In this post, I assess how the candidates would implement macroeconomic stabilization policy, given the big reform packages proposed by the candidates, in particular those by Senator Sanders, are highly unlikely to be passed by a fully or partly Republican Congress. On the other hand, a downturn in the next four years is much more plausible; hence, knowing the candidates’ views on macro stabilization policy is arguably more relevant.
As an aside, the growth effects arising from the implementation of single-payer universal health care, free college tuition, and social security reform as advocated by Senator Sanders (see official platform here) have been addressed in this open letter written by four past Chairs of the Council of Economic Advisers under Democratic administrations [0]; Paul Krugman has rightly characterized the economic assumptions underlying the Sanders growth and revenue projections as a left-wing version of voodoo economics (my paraphrasing of his words).
With that prologue, let’s turn to counter-cyclical policy.
Clinton: Secretary Clinton’s official economic platform website is here. One summary of her economic platform is here. A NY Times tabulation of her economic advisers from early 2015 reads like a list from mainstream macro:
Several of Mr. Clinton’s former advisers, including Alan S. Blinder, Robert E. Rubin and Mr. Summers, maintain influence. But Mrs. Clinton has cast a wide net that also includes Joseph E. Stiglitz, a Nobel laureate in economics who has written extensively about inequality; Alan B. Krueger, a professor at Princeton and co-author of “Inequality in America”; and Peter R. Orszag, a former director of the Office of Management and Budget under President Obama. Teresa Ghilarducci, a labor economist who focuses on retirement issues, is also playing a prominent role.
Focusing on professionally trained economists (Blinder, Summers, Stiglitz, Krueger, Orszag, and Ghilarducci), one can be reasonably certain that a conventional approach to macroeconomic management would be adopted. Automatic stabilizers would be retained (not true of all plans — consider Kasich’s balanced budget requirement), and discretionary fiscal policy would be used as second resort. In the background as a theoretical framework is a conventional aggregate demand-aggregate supply model.
Sanders: Bernie Sanders’ official issues page is here.
It’s hard to assess how Senator Sanders views macrostabilization policy. This is partly because Sanders refuses to name his economic advisers [1] (aside from the author of the projections of his health plan). One aspect of his policy worldview that is identifiable is monetary policy. He has been in favor of “Audit the Fed” legislation, sponsored by Rand Paul, and supported by 34 senators (all Republican). This legislation has been discussed by Jim, who makes the following observation:
The main effect of the bill would be to give Congress an additional tool to exert operational control over monetary policy. The political pressures will be very strong not to raise interest rates when the time does come to start to worry again about inflation. And when the Fed does get to raising rates, it will mean extra costs for the Treasury in paying interest on the federal debt– Congress isn’t going to like that. The primary effect of the legislation would be to give Congress one more stick with which to try to beat up on the Fed when the Fed next does need to take steps to keep inflation from rising.
An additional hint on how a Sanders presidency might approach counter-cyclical policy is provided by his previous appointments. One such, as ranking Democrat on the Senate Budget Committee is Stephanie Kelton, Professor at UM-Kansas City, a leading exponent of Modern Monetary Theory (MMT). [2] [3]
I must confess that I’ve read several accounts of MMT (e.g., [4], [5]), with little ability to determine how it all works. From one exposition by Professor Kelton, it seems that MMT invokes a rejection of the intertemporal government budget constraint:
dt-dt-1 = [(rt-gt)/(1+gt)]× dt-1 – pt
Where d is the debt to GDP ratio, r is the real (inflation adjusted) interest rate, g is the growth rate of real GDP, and p is the primary (noninterest) surplus to GDP ratio.
In words, this constraint requires change in the debt-to-GDP ratio to equal the real interest rate growth rate gap minus the primary surplus-to-GDP ratio. In her argument, the debt-to-GDP ratio does not have to grow with deficits because the real interest rate does not necessarily rise with elevated government borrowing. Here I think the issue of “sovereignty” as defined by MMT adherents matters — the real rate is not set in the private loanable funds market, but by the monetary authority. I think the conclusion that inflation does not rise with monetary expansion is based upon the absence of observed historical correlations between debt levels and inflation.
The policy implication seems to be clear: Slack in the economy requires aggressive expansionary fiscal policy, backed up by an accommodative monetary policy that prevents interest rate increases. Output above potential GDP might suggest some fiscal restraint, but not in a manner that is symmetric (although other interpreters differ, e.g. Wray).
The underlying theoretical framework seems to be one where monetary policy is passively accommodative and the aggregate supply curve is flat. An independent monetary authority is inconsistent with this view.
More background on the advisers to the various candidates, here.
Addendum regarding a President Sanders international macro/exchange rate policy. From Ten Fair Ways to Reduce the Deficit and Create Jobs:
Establish a currency manipulation fee on China and other countries. As almost everyone knows, China is manipulating its currency, giving it an unfair trade advantage over the United States and destroying decent paying manufacturing jobs in the process. If we imposed a currency manipulation fee on China and other currency manipulators, the Economic Policy Institute has estimated that we could raise $500 billion over 10 years and create 1 million jobs in the process.
Most current estimates indicate the Chinese currency is either near, or slightly above, equilibrium, defined either using the Penn effect, or some macroeconomic balance approach. For some details, see here.
February 16, 2016
Guest Contribution: âFinancial Regulatory Transparency and Sovereign Borrowing Costsâ
Today we are fortunate to be able to present a guest contribution written by Mark Copelovitch (University of Wisconsin â Madison), Christopher Gandrud (City University of London), and Mark Hallerberg (Hertie School of Governance, Berlin).
Sovereign borrowing costs on the Eurozoneâs southern periphery spiked again last week amidst renewed fears of a âGrexitâ and rising concerns about non-performing loans on the books of European banks. This past week, Portuguese bond spreads over German Bunds hit their widest level since March 2014, while Italian and Spanish yield spreads reached their widest levels since last summer. At the same time, Germanyâs largest bank, Deutsche Bank, has seen its stock fall more than 40% in 2016, while its CDS rates have more than doubled, forcing CEO John Cryan to state that the bank âremains absolutely rock solidâ (link) and prompting German Finance Minister, Wolfgang Schäuble, to publicly state âNo, I have no concerns about Deutsche Bank.â
At the heart of these market concerns are the content and consequences of new rules to resolve failing Eurozone banks, which came into force on January 1, 2016, as part of the Single Resolution Mechanism (SRM), or the second pillar of European banking union. The rules, which are codified under the Bank Recovery and Resolution Directive (BRRD), are designed to limit further taxpayer-funded bank bailouts within the Eurozone by imposing losses directly on a failing bankâs creditors and requiring âliving willsâ for all 129 banks directly under European supervision. The Directive mandates that 8 per cent of a bankâs total liabilities must be wiped out before any taxpayer support can be provided. This âbail-inâ mechanism creates the possibility that bondholders and some depositors will be forced to take losses if a Eurozone bank is deemed insolvent. Such losses occurred previously in Portugal, where the Portuguese central bank applied the BRRD already in December 2015, and wrote down â¬2 billion in bonds at Novo Banco, and in Cyprus during the 2013 bailout, where large depositors took direct losses. While the SRM is designed to limit uncertainty in the case of Eurozone bank failures, investors remain concerned that â in the absence of fully-funded and operational European deposit insurance â national governments (and taxpayers) in individual member-states remain ultimately liable for covering the cost of bank failures in the Eurozone. These concerns have risen since October, when the ECB released the results of its Comprehensive Assessment, which estimated â¬826 billion in non-performing loans on the balance sheets of banks under the mandate of the first pillar of banking union, namely the Single Supervisory Mechanism (SSM).
Thus, six years after the onset of the Euro crisis, fears persist among policymakers and investors of a sovereign âdoom loopâ linking problems in the European banking sector to sovereign debt. The central concern is that weak or failing banks will require national or subnational governments to step in and provide bailouts â as occurred in Ireland in 2010, and in Germany in 2007-9 â that will, ultimately, lead to greater fiscal deficits, higher levels of sovereign debt, and potentially a greater risk of sovereign default.
As highlighted in new IMF research by Bova et. al, such contingent sovereign liabilities can have significant economic and fiscal costs. These âhidden deficitsâ frequently impose large fiscal costs on the government, in the form of bank bailouts, backstopping the liabilities of subnational authorities, or financial rescues of state-owned enterprises. As the authors note, taxpayers and investors often only know about the true magnitude of these sovereign liabilities once a crisis hits and hidden liabilities become âactual.â In order to minimize uncertainty and risk, they recommend that governments âput in place more transparent and better arrangements for disclosing and monitoring their hidden liabilities. In particular, fiscal frameworks should be strengthened to enhance discipline and limit the excessive growth of contingent liabilities. This is particularly important because the evidence shows that these hidden liabilities tend to emerge in times of financial distress when public finances are the weakest.â
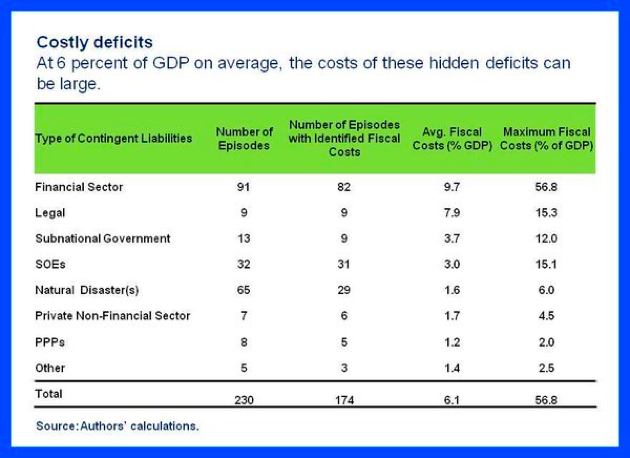
SOURCE: Bova, Ruiz-Arranz, Toscani, and Ture 2016. While the title of their graph concerns âcostly deficits,â it is important to note (as they indicate themselves in their text) that they focus on âfiscal costs,â which may or may not appear as changes in public sector budget deficits. In many cases in accounting terms, the increases in costs count directly against the gross debt burden but do not affect a countryâs public sector budget deficit.
In a new working paper, we explore whether greater financial regulatory transparency actually has the salutatory effects anticipated by Bova et. al on sovereign risk by making governmentsâ contingent liabilities to the private sector more visible and transparent.[1] The first step is to create a way to measure the transparency of the data that the government regulator makes available on the health of its banking sector. Using a Dynamic Hierarchical Bayesian Item Response Theory (IRT) approach, which was originally created for educational testing purposes, we develop a new Financial Regulatory Transparency (FRT) Index. It measures a regulatorâs latent willingness to report minimally credible data about its financial system to international organizations and investors. The FRT Index covers 68 developed and developing countries from 1990 through 2011. It measures these countries’ reporting of financial system information to the World Bank’s Global Financial Development Database. The Index is a unique indicator of countries’ willingness to reveal the structure of their financial system and their regulatory quality, since the data has to pass minimal World Bank and International Monetary Fund quality checks. If a country reports these data, it is easier for international investors and other market participants to scrutinize the banking system and to ascertain whether a government is exposed to large-scale contingent liabilities in the financial sector. To date, no broadly recognized measure of financial regulatory transparency exists. The FRT index fills this data gap.
In our paper, we use this FRT index to consider whether increased financial regulatory transparency is related to changes in sovereign borrowing costs. The expectation is that markets pay attention to the relative stability of the banking sector. They anticipate that financial instability or a crisis will lead to a big increase in the public debt burden. We expect that states with higher FRT scores have lower and more stable borrowing costs. However, we argue that this effect should also be conditional on a country’s fiscal position. Investors facing information gathering and utilization costs try to maximize the net marginal benefit of gathering information and will pay more attention to countries with precarious fiscal situations.
In our empirical analysis, we find that financial transparency â both its level and change â has a significant effect on sovereign bond spreads, but that these effects are highly conditional on a countryâs public debt levels. Higher levels of FRT reduce changes in spreads (Figure 1), but only if a country is already heavily indebted (debt/GDP exceeds approximately 100%). Similarly, increases in FRT are associated with a reduction in spread changes, but only when debt levels are falling rapidly (Figure 2). Conversely, positive changes (increases) in FRT are associated with an increase in spread changes, but only when debt is rapidly increasing.
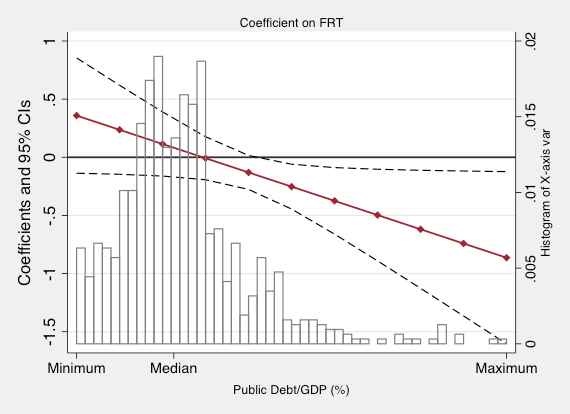
Figure 1: Marginal effect of FRT (level) on Change in Bond Spreads at Different Values of Public debt/GDP (level)
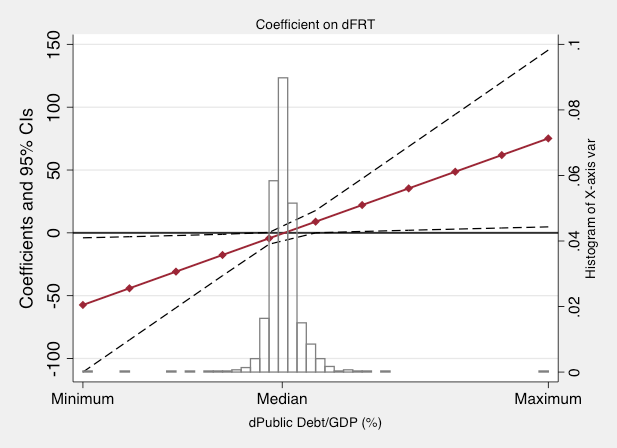
Figure 2: Marginal effect of FRT (change) on Change in Bond Spreads at Different Values of Public debt/GDP (change)
Together, these results imply that increased financial regulatory transparency is beneficial for countries seeking to access international capital markets, but only if such countries are 1) already heavily indebted; and 2) in the process of reducing their debt burdens. For countries that have modest debt-to-GDP ratios, transparency has no significant effect on borrowing costs. And for heavily indebted countries whose debt burdens are still increasing rapidly, transparency appears to exacerbate pressure on borrowing costs.
These findings help us to understand the uneasy market reactions we have observed in Europe over the past month. In the medium-term, greater transparency about the status of European banksâ balance sheets, along with clear and explicit rules about âbail-insâ under the new SRB, may cast light on Eurozone governmentsâ contingent liabilities to the private sector and help to break the sovereign-bank âdoom loop.â In the short-term, however, these increases in transparency have only increased fears about bank insolvency and sovereign debt in the Eurozone, particularly in the Eurozoneâs largest debtor countries. This was most clear last month, when the ECB sent a questionnaire about non-performing loans to a sample of lenders from across the SSM to âinform its work,â which triggered a rapid sell-off of Italian banking stocks amidst uncertainty about which banks were most at risk.
Ultimately, our analysis suggests that greater financial regulatory transparency is a double-edged sword. On the one hand, more transparency may make explicit and visible the contingent liabilities and implicit guarantees that link banks and sovereigns. On the other, heightened transparency â particularly if it is pursued in times of increasing debt and financial stress â may exacerbate investorsâ concerns and trigger the very instability that it intends to address. Consequently, both within Europeâs nascent banking union and beyond, regulators need to proceed cautiously as they seek to gather and disseminate better, and more extensive, data about the health of their financial systems.
[1] For further details on the implications of our data and findings for the future of European banking union and financial regulation, see our related Bruegel policy brief: http://bruegel.org/2015/12/financial-regulatory-transparency-new-data-and-implications-for-eu-policy/.â©
This post written by Mark Copelovitch, Christopher Gandrud, and Mark Hallerberg.
Menzie David Chinn's Blog


