
Harry S. Dent Jr.'s Blog, page 66
January 2, 2018
What Changes in 2018
 It’s the first week of January, which makes it time for football playoffs and New Year predictions.
Since I’m not likely to grace the gridiron anytime soon, I land in the forecast camp. But playing Nostradamus is fraught with its own danger, and reminds me of an old quote by Darrell Royal, the longtime University of Texas football coach, that explained why he favored running the ball. He believed that when you threw the football, three things could happen, and two of them were bad.
You could complete the throw, which was good, watch it fall incomplete, or have it intercepted, both of which were bad.
When predicting future events, I can be right, the results can be inconclusive, or I can be flat out wrong. But we make money by seeing what’s just around the corner, so here’s my top five list of things that should happen in 2018, each with a twist…
U.S. companies will make more money.
OK, so I got an assist from the president and Congress, which recently passed a very favorable tax bill that puts our children another $1.5 trillion in hock while giving the proceeds to corporations.
It’s not much of a prognostication to guess those companies will have more green, but things won’t turn out as rosy as the president wants them to.
Expect first-quarter earnings to pop as companies estimate how much more of their revenue they can keep, but don’t look for higher GDP growth. Companies will spend more only if it looks like they can sell more stuff.
With interest rates near zero for the last decade, it was easy to borrow and expand if it made sense. Firms have already expanded as much as they needed to for the current level of demand. Simply reaping higher profits should give the stock market a boost due to higher earnings, but GDP should slip back to 2.0% in the second half of 2018.
The big winners should be companies that sell most of their stuff in the U.S., and have some connection with infrastructure. After his tax win, I expect President Trump to push infrastructure spending to the top of his list. Companies that benefit from both initiatives should lead the winners this year.
Oil prices will tumble.
Monopolies only work if you control most production and can scare the pants off of the other bit players in the market.
OPEC and its co-conspiring non-members have held the line on limiting production better than I expected, but they didn’t drive up prices on their own. They got a lot of help from supply disruptions in places like Libya and Liberia. Those countries, along with Venezuela and Iran, desperately need to sell more oil to keep the country coffers from going dry.
At the same time, American shale producers were more cautious than expected in ramping up production. But with West Texas touching $60, the time is ripe for the frackers to get back to business. As visible supply ramps up, prices will fall, just in time for the Saudis to price their precious IPO for Saudi Aramco.
Bitcoin will bust.
We had an interesting discussion internally about Bitcoin over the holidays. As Harry ranted about the crypto bubble, he called for the price to drop by 90% or so. Being a geek, I did a little math in my head and told the group that even if Bitcoin fell by 90%, it would still be worth more than $1,000.
It’s hard for me to think of something that’s supposed to be a storehouse of value fluctuating so wildly, but Bitcoin does just that. I think the crazy ride will drive out the late comers, who at this moment are down 25% or so. If the dip gains momentum, more casual buyers will retreat, creating a vicious selling cycle.
The U.S. government and other official entities will only make matters worse as they enforce tax laws that require reporting all buys and sells, and create new regulations for cryptocurrencies that remove anonymity and make it harder to move wealth across borders.
Electric cars will get a boost.
Forecasting for more electric cars to hit the road is like calling for the sun to rise in the East. Luckily, that’s not my point. I’m more about the batteries, as I have been for a couple of years now. I think 2018 is the year we make the next step forward in battery evolution, and my money is on solid-state lithium-ion.
It could be Panasonic, LG Chem, or even Samsung that makes the breakthrough, but it won’t really matter which company claims credit. Once we tackle the science, we get a dramatic bump in stored power, which will make electric cars more comparable with internal combustion engine vehicles, and will significantly enhance home power storage for solar energy as well as hand-held devices of all kinds.
As power demand grows, look beyond the horizon at natural gas demand. We’ll have to power all of those new electric plants, and clean-burning natural gas is the obvious answer.
Pot will be the story of the year, but not so much in the U.S.
Americans, myself included, are prone to navel-gazing, and with good reason. As the largest economic and military power on the planet, we hold a position of outsized importance. But things often happen beyond our shores, or in this case, land borders.
This year, Canada will legalize pot across the country, which should unleash not only pent up demand, but also encourage further research on the drug.
Canadian firms will be at the forefront of medical marijuana and marijuana exports, forcing other countries to re-examine their pot-limiting laws and regulations.
It’s hard to see how the U.S. will change its classification of cannabis as a Schedule 1 drug given our Commander-in-Chief and Attorney General, so pot will remain the domain of states within our borders. This probably explains why Constellation Brands just ponied up $190 million for a stake in Canadian firm Canopy Growth.
So, I’ve included a little something for everyone in this look ahead to the next 12 months, from electric car lovers to those that make their living in fossil fuels and everyone that smokes weed to relax.
No matter where you land on the spectrum, I hope you have a fabulous and prosperous New Year!

Rodney Johnson
Follow me on Twitter @RJHSDent

The post What Changes in 2018 appeared first on Economy and Markets.


December 29, 2017
6 Reasons to Bet on the U.S. Dollar in 2018

I love the gold bugs!
They’re steadfast in warning that you can’t live on perpetually-expanding debt… or money printing… or zero interest policies. Mainstream economists have been lulled into believing such things don’t have serious consequences, while history clearly says otherwise. Gold bugs aren’t fooled.
But that’s where my love for gold bugs ends.
They have two fatal failings.
The first is that they believe gold is always a storehouse of value… and mostly in inflationary times like the 1970s.
It is NOT outside of such strong inflationary periods, as I’ve explained in numerous previous issues of Boom & Bust, The Leading Edge, and Ahead of the Curve Webinars;and practically all of my best-selling books, and even the gold eBook I wrote to explain exactly this point.
The second is their… I can only call it “seeming ignorance”… about the U.S. dollar.
They’re smart people, so I just don’t understand how they can’t better understand the value and power of the world’s reserve currency.
And, quite frankly, it was laughable recently when Peter Schiff, who I have often debated, accused ME of not understanding the dollar. Ha!
That’s why, in the first Boom & Bust issue of 2018, which subscribers received earlier today, I explain why the U.S. dollar is the real ultimate safe haven (and in so doing prove that Peter’s comment was an unqualified pot shot).
The reality is that I’ve been right about both gold and the dollar since the 2008 crisis. He and his fellow gold bugs have maintained that gold prices would soar to the moon, and dollar prices tank, as the greatest money printing scheme in history unfolded.
However, gold collapsed after peaking in late 2011, and has remained stuck in a low range ever since… and is heading much lower in the next few years.
In the meantime, the dollar has mostly appreciated since early 2008, and as I showed paid readers, I have reason to believe that it’s going to have a substantial rally again in 2018 before it finally becomes more fairly valued. After that it could be more up or down, but still could lean towards the upside.
Really, gold bugs get three very important things dead wrong:
They think that because we have been printing money at unprecedented rates, the dollar will crash; likely dropping close to zero. Either they’re smoking some good pot or they don’t understand that currencies trade relative to each other, and therefore cannot drop to zero, unless they fail like in Zimbabwe – which is rare.
They believe money printing at such high rates will cause hyperinflation at some point, especially when central banks continue to escalate their efforts exponentially during the next financial crisis. The trouble with that is, it’s been nine years since QE and unprecedented stimulus efforts began, and countries the world over have barely been able to stave off deflation! That’s because we’re in a deflationary period of declining money velocity from the aftermath of the greatest debt bubble in history. And if we fall into an even deeper crisis (as they and I predict), especially after such massive money printing, it will be a sign that none of it works.
Tell me, how are central banks going to sell their plan to Joe Public to go from printing $12 trillion globally to $100 trillion to stave off the next crisis after the last $12 trillion failed? There’s just no way!
And perhaps the most egregious of all: They think that governments are on a never-ending inflation campaign to devalue the dollar and make their debts cheaper to pay off. I’ll grant you, there is an element of truth to that. After all, who wouldn’t want to make their debts cheaper? But the fact of the matter is that the dollar hasn’t been devalued to the extent they expound.
They’re always throwing around the classic chart that shows that adjusting the dollar for the expansion of dollars since 1900 has resulted in the green back being devalued 97%. It’s all utter tripe!
They don’t understand – and neither do most economists – that the very productive process of rising urbanization and greater specialization of labor requires much more delegation of tasks and hence, much greater financial transactions by consumers – meaning more dollars relative to GDP – through physical currency and credit. Such productivity greatly outweighs the inflation of the money supply. If it didn’t, our standard of living adjusted for inflation wouldn’t have gone up more than eight times adjusted for inflation since 1900!
As I said, I’ve belabored points two and three in numerous places, so for the January issue of Boom & Bust, I focus on the one that’s gotten the least attention. And Charles Sizemore, our Boom & Bust Portfolio Manager, is positioning readers in a very interesting play that will profit from the strong year the dollar will have in 2018.
If you haven’t read your issue yet, do so now.

Harry
P.S. As this is the last working day of 2017, I’d like to take this opportunity to thank you for your time and support throughout this year. Happy New Year to you and your family. I warn that 2018 could be a rough year for the markets, for many reasons that I’ll elaborate on in the next few weeks, but with us by your side, I’ve no doubt it’ll be yet another profitable one for the books.

The post 6 Reasons to Bet on the U.S. Dollar in 2018 appeared first on Economy and Markets.
December 28, 2017
Bitcoin Isn’t the Bubble It’s the Pin!
I wish I could take credit for that perfect description of Bitcoin, but I can’t. That goes to JP Research.
This Bitcoin bubble will be the “pin” that bursts the more widespread bubble, just like the Nasdaq bubble burst the markets back in the early 2000s.
I wrote about this twice last week, showing you how the Bitcoin bubble compares to the internet bubble, and how much Bitcoin could potentially lose when the burst happens.
Then, last Friday, I took to Facebook with this video, elaborating more on the Bitcoin situation.
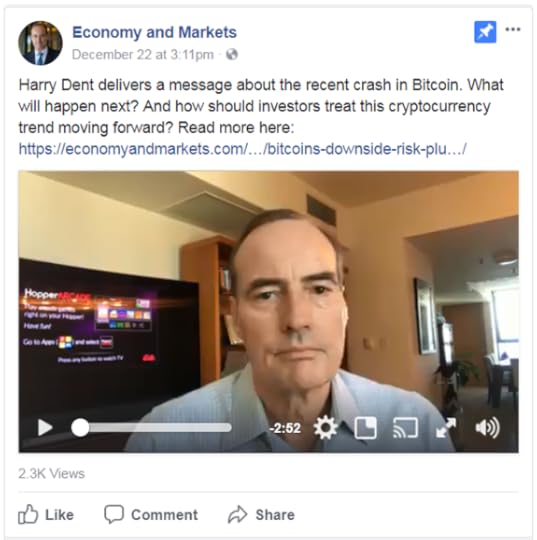
I explain why Bitcoin could make one more new-high at best and then what to expect… not only with Bitcoin, but the future of the cryptocurrency industry in general.
Watch this Facebook video, and comment with your thoughts on this Bitcoin bubble.
Harry

The post Bitcoin Isn’t the Bubble It’s the Pin! appeared first on Economy and Markets.
December 27, 2017
An Epic Year

What an epic 12 months it’s been!
I’m not talking about Trump, natural disasters, or the Bitcoin bubble.
I’m talking about 10X Profits!
We launched this service, originally under the code name Project V (for volatility), in early December 2016.
We set out with a bold mission, seeking a 10-times return on investment… with a simple market-timing model… that trades just two ETFs… which track volatility.
Nuts! Right?!
No doubt, 10X Profits is an unconventional approach to investing.
But as I told my subscribers, as long as you’re willing to “be different” and maintain discipline … I think our unique and simple approach to trading volatility booms and busts is a must-have in your quiver of investment strategies.
Many in the financial world prefer complexity over simplicity because it can hide the truth while simplicity lays it bare – for all to see, know, and judge.
I’ll admit, while I was confident in my strategy’s design and back-test results, I didn’t know exactly how this Project V (aka 10X) thing would go down. But since it’s quite simple, I knew there’d be no hiding from the truth – good, bad, or ugly.
Will the strategy perform “live” as it did historically?
Will real folks find real value in the approach?
Will my “coaching” actually translate into disciplined execution?
Now, with a full year of live trading under our belts, my subscribers have proof that 10X Profits checks all the boxes I had intended it to:
Easy-to-implement market-timing strategy.
Trading high-profit volatility market.
Behavioral coaching to maintain discipline and achieve long-term potential.
Thought-provoking discussions on the craft of investing.
Besides making a compound annual return of 67.4%, a rate that sets us on course to our 10x return goal in just more than four years, I think readers have enjoyed the journey and my sometimes-meandering musing on the craft of investing.
We talked about a survival strategy for eating berries… the difference between football and boxing… my dad’s ego… my mom’s parenting style… hungry judges… dead Fidelity clients… a 60-something-year-old daredevil swimmer… my high school pepperoni roll business… Warren Buffett’s favorite business… the difference between baseball and tennis… what my toothbrush habit taught me about discipline… why doctors and engineers make poor investors… why women may be better investors than men… and the “E*Trade baby indicator.”
Without “stock stories” to tell, we were free to explore some of the universal truths of human behavior and investing – the intersection between “man” and “market” that’s too-often overlooked or misunderstood.
Although, I realize at the end of the day, the proof is in the pudding. Investors want returns, first, and everything else, second.
So, let’s talk results…
Here’s an abbreviated version of the Year 1 performance review I recently shared with 10X Profits subscribers.
Average Daily Return (XIV vs SPY)
I warned readers that, according to historical data, XIV is far more volatile than the S&P 500 (SPY), even though they typically move in the same direction. But I explained, the volatility of a security isn’t necessarily “good” or “bad.”
In Year 1, XIV accrued an average gain of 44 basis points per day in Year 1, while shares of SPY accrued just 7 basis points per day.
Clearly, trading a volatile vehicle, like XIV, can be worth it… giving us around 6-times more profit potential than the broad market.
Frequency of Positive Returns
In Year 1, our model showed a positive gain during 57.5% of trading days… we closed 66.7% of months in positive territory… and we finished the year with a profit.
That tracks quite well with the expectations I set forth, shown clearly in the chart below.
[image error]
Average Total Return by Holding Period
It’s pretty simple… the longer you trade a strategy (assuming it has positive expectancy), the more money you make.
I explained that to readers, and shared this chart, in May. Have a look…
[image error]
These are simply average returns over x-month periods.
Further, I shared in a special report, titled 100 Paths to 10X Profits, how my back-test showed a compound annual growth rate (CAGR) of 77.5%.
In Year 1 of live trading, we earned a CAGR of 67.4% with a maximum drawdown of just 32.1% – a favorable trade-off between risk and return.
Keeping the Faith
I never said it’d be easy.
Simple.
But not easy.
Keeping faith in our 10X model was indeed difficult at times this year. We suffered back-to-back losses in January and February. But I explained to readers how our model typically bounces back strongly from two-month losing streaks.
Indeed, we did, earning a 44.7% return over the next six months… right in line with the expectations I shared with them.
Later in the year, I told readers to keep the faith, saying, “A lucrative winning streaks awaits us… we just need to maintain discipline to the model, so we’re in position when it develops.”
Indeed, my model eventually synced with the market and latched on to a profitable win-streak – a three-month streak between May and July (for +28.2%, +5.9 and +13.1%), and then another three-month streak between September and November (for 16.6%, 14.6%, and 5.4%).
My point is… systematic investing requires faith in the model.
Not blind faith. I shared with 10X subscribers a trove of honest, analytical evidence to support their faith.
Still, keeping the faith during tough times is essential if you want to be an extraordinarily successful investor. That’s easier said than done… but it pays in spades to those able to muster it.
Everyone’s a Winner
Seriously, everyone’s a winner!
Whether my 10X subscribers have been trading the model for a full 12 months… six months… or one month… all disciplined followers should be sitting on positive returns – as high as 105%, for those who joined in March.
And the best part is… I’m confident YOU can position yourself for massive gains like this, too!
As long as you’re resolved to committing to the strategy for the long-run, you can achieve my 10X strategy’s long-term profit potential in the months and years ahead.
Stay disciplined,

Adam

The post An Epic Year appeared first on Economy and Markets.
December 26, 2017
The Most Useless Number in Retirement Planning
 What’s your number?
No, I’m not planning to ask you out on a date. I’m sure you’re a lovely person, but my wife has a South American temper and is definitely the jealous type.
Rather, I’m referring to the single most common question I see in retirement planning:
“What’s your retirement number?” Said another way: What size nest egg do you need to quit working?
It sounds like a reasonable and straightforward question.
The problem is, it’s completely useless.
Like so many things in the financial planning business, the question takes something complex and full of nuance, and effectively dumbs it down to the point where it doesn’t mean anything. And that’s because it misses the bitter truth about retirement: you never know how much you’re going to need.
Think about it. Who wants to spend their golden years slowly depleting their nest egg hoping they don’t outlive it?
Some say that to retire successfully you should multiply your final salary by a factor of 10. So if in your late 60s you expect to be earning $150,000, you’d need $1.5 million to retire.
But does that actually work? Using the standard “4% Rule,” which means you withdraw no more than 4% of your portfolio value per year, that would give you an annual income of $60,000. That might be just fine.
Or it might not.
What if you need more than $60,000 to pay your bills? What if the stock market has a major setback early in your retirement and your $1.5 million gets chopped down to $750,000 or less?
You might roll your eyes now, but that’s exactly what happened to millions of people that retired or were planning to retire just before the last two bear markets.
The bigger, more fundamental problem with the “number” approach is this: it makes no consideration of market valuations or expected returns.
Let’s say stocks are cheap and priced to deliver returns of 10% per year or more. Taking out 4% per year in retirement would be perfectly prudent and reasonable. In a raging bull market like we’ve enjoyed for the past couple of years, it wouldn’t have hardly made a dent in your portfolio.
But today, using common valuation metrics like the cyclically-adjusted price/earnings ratio (CAPE), stocks are priced to lose money over the next 5 to 10 years. That means that even a 4% withdrawal rate risks depleting your nest egg early in retirement.
This is no way to plan for your golden years. It’s income that pays your bills, not a big ol’ fat nest egg full of assets. Focusing on an asset number rather than an income stream is like putting the cart before the horse.
If I was confident that this bull market still had several more good years to run, it wouldn’t make a difference. In that scenario you could reliably sell off assets along the way to meet your income needs. But in today’s market, that’s a risky proposition.
I’m not willing to leave my retirement to the whims of chance. Are you?
This is what I recommend you do…
Step #1: Grab a piece of paper. Write down a yearly income number you think you can live on in retirement. Try to be honest and reasonable and let your current monthly expenses be your guide.
Now, once you have that number… add 20% to it. You know as well as I do that expenses always seem to find a way of turning out to be more than you expected. That’s just life.
Step #2: OK, now that you have your “real” income number, start subtracting any “guaranteed” income sources. This includes things like Social Security or any pensions you have.
So, let’s say you need $100,000 to live every year (after adding in your 20% cushion). And let’s assume you expect to get $40,000 per year from Social Security, and another $20,000 from a private pension.
That just leaves you with $40,000 to come up with every year to meet your $100,000 goal. And that’s Step #3.
Of course, with bond yields scraping along near all-time lows, securing a safe $40,000 (or whatever the figure is for you) may seem easier said than done. But it’s really not difficult if you know where to look.
Some people prefer annuities. I’m really not their biggest fan as a savings vehicle, but as an income vehicle it’s an entirely different story. With an immediate annuity, you give a block of cash to an insurance company, and they in turn promise you a guaranteed monthly income for the rest of your life. Or, if you’re the “do it yourself” type, you can try a rental property or two.
As a better alternative, I’d recommend you give my income newsletter Peak Income a read. The investments in the model portfolio yield between 5% and 10%, and we have strict risk management in place to limit losses. If you’ve been looking for investments to fill an income gap, Peak Income is a solid option for you.
Once you’ve secured a high enough income to secure your basic living expenses, you can afford to have a little fun.
Take a little risk, or try an active trading strategy. Or really swing for the fences and buy Bitcoin or another cryptocurrency. With your basic income needs met, you can use any trading profits for little luxuries like travel or as gifts to your kids and grandkids.
I, for one, am busy planning a ski trip to Colorado. So your next Economy & Markets might be delivered on a postcard!

Charles Sizemore
Editor, Peak Income

The post The Most Useless Number in Retirement Planning appeared first on Economy and Markets.
December 24, 2017
When the Tree Falls Down… or the House Floods
In 1990, my wife and I celebrated our first Christmas together. We were broke.
We had enough to eat, but I balanced our checkbook to the penny and we carried an uncomfortable balance on our credit cards.
We tried to save money wherever possible, including paying $8 to “cut your own” Christmas tree and then making decorations by painting wooden clothes pins.
Some of it worked, some of it didn’t.
Using paint, pens, and paper, my wife turned the clothes pins into horses and cowboys, which was very fitting for our first holiday season in Texas. That was a win.
The tree, however, didn’t turn out so well.
To save money, I nailed two pieces of wood in an X shape into the trunk as a makeshift stand. We had two cats at the time, strays that had wandered up on a co-worker’s porch. In the middle of the night, we heard a loud crash and, upon investigation, found the cats had crawled up the tree, knocking it over and breaking the precarious stand.
As my wife reminds me, I used colorful language to address both the cats and the tree at 2 a.m. as I forcefully tried to get the thing back in place. It didn’t work. The wood broke into pieces and I more or less propped up the tree in the corner for the rest of the season.
I don’t try to make wooden tree stands anymore, but we still have a few of those caballeros and horses in our decorations box.
In subsequent years, we added ornaments, stockings, and decorations that have come to represent different people and times in our lives. The ones that are fleeting remain in the storage box, but those with a strong tie seem to make it onto the shelf or tree, no matter how dated or damaged they’ve become.
It’s the same thing with gifts.
I don’t remember anything my wife and I exchanged that first Christmas. I’m sure it’s all long since disappeared. But over time we’ve given things – jewelry, clothing, sports equipment, etc. – that have become special. Not for value’s sake, but because they were thoughtful and hold memories better than we can just in our minds.
These gifts, along with all the decorations, act as positive memory triggers, and bring back a flood of warmth that is dearly welcome each year. My association with these things allows me to relive and recall some of the best people and times in my life.
The notion of things, particularly Christmas things, holding memories and being dear was brought home recently by Hurricane Harvey. As we mucked out my sister’s house, removing mud, walls, insulation, etc., we also threw away items that were stored at ground level and had been damaged.
Her ornament boxes were 24 inches tall and all filled with water. Items that had been carefully stored year after year were now floating in dirty water.
In the craziness of 15 people trying to cut out walls, tear out insulation, and get ruined furniture to the curb, my first inclination was to simply throw out all the Christmas things.
Thank goodness I didn’t. Things matter.
And at the time, most of her things, along with those of hundreds of thousands of other people in our area, were being thrown away.
My sister and her husband have the wherewithal to rebound. They don’t worry about paying bills, and their home is almost back to normal. Their traditions remain alive, and of course they, like everyone else affected by the storm, recognize that their health and safety is the biggest blessing. But no one wants to lose the treasures of the past, precisely because they link us to our past.
The items she was able to save are now more precious… and I bet they’ll be stored on higher ground in the years to come.
May the rest of your Christmas be merry and bright, and may wonderful memories flow from your decorations and items you’ve shared, even as you create more.

Rodney Johnson
Follow me on Twitter @RJHSDent

The post When the Tree Falls Down… or the House Floods appeared first on Economy and Markets.
December 22, 2017
The Fed’s Win Rate is Still Near Zero
 I’m excited for the new year for many reasons but I’m also thankful for a great 2017. Since this issue of Economy and Markets will be my final one of the year, I thought it fitting to review this year and look ahead to the next.
As my Treasury Profits Accelerator subscribers already know, long-term forecasts aren’t what I usually do. My system identifies overreactions in the long-term Treasury market and when a trade happens, we’re in them for less than two weeks. Trades are triggered by my proprietary algorithm and not subjective analysis.
My track record in those short-term trades in 2017 was 80%. Overall I expect a winning percentage of about 70%. So 2017 was indeed a good year!
Throughout the last 12 months, long-term Treasury rates fluctuated between a high of 3.19% in mid-March to a low of just under 2.68% in September.
As it did in stocks, volatility declined in the Treasury bond market significantly. That’s a problem for options strategies like mine. If prices don’t move, option premium values decline. Even though my winning percentage was excellent, low volatility hurt performance because the “snap-back” overreactions weren’t as significant as they normally would with higher volatility, thus triple-digit gains were nonexistent.
Federal Reserve policymakers say they’re planning on maintaining steadily increasing interest rate policy, or normalizing, based on current projections.
And let’s be realistic, the Fed is usually wrong when it comes to forecasting. I’m not talking policy forecasts, but economic forecasts. Decision-makers will likely be forced to change course at some point in 2018.
Fed members projected a 2% inflation rate since the beginning of the recovery back in 2009 and we’re still not there. They’ve recently admitted that they’re confused about what drives inflation.
Going back five years, median Fed GDP projections were in the 3% range and moving higher after 2013. Of course those forecasts were adjusted lower every year through this year. On an annual basis, the U.S. economy hasn’t grown by 2.5% since before the financial crisis in 2007.
The scary thing about Fed projections are that policymakers truly believe their decisions actually drive our economic growth, inflation, jobs, spending, and borrowing. So for the central bankers who inflate our money away, tinker with quantitative easing, and manipulate interest rates with the expectation of certain outcomes, they have failed.
I’m amazed that the Fed has hundreds of Ph.D.’s researching, analyzing, and forecasting with such a miserable result.
My system has a win rate in the neighborhood of 70%. The Fed’s win rate on its forecasts are near zero.
I can give an opinion on where the economy is going based on my analysis but, for my readers, it really doesn’t matter. I trade on high probability outcomes because of overreactions and position for a short-term reversal.
And unlike my system, my long-term forecast is based on my fundamental analysis which is more of an educated guess.
OK, enough with the disclaimers…
I expect that volatility in the Treasury market will increase in 2018 for a few reasons. But primarily because of one big one.
Global sovereign bond markets have been manipulated by central banks for years and in 2018 we’ll see both the European central bank and the Bank of Japan start to slow down or even reverse stimulation programs. When that happens, investors will be quick to sell and whatever the Fed does won’t matter. U.S. Treasury bond prices will go lower and yields will jump.
I expect long-term Treasury yields to hit 4% in 2018 and the currently flat yield curve, to steepen significantly.
Now, before that happens, we could see the yield curve flatten more or even invert. Usually when the yield curve inverts (meaning that long-term yields are lower than short-term yields), we’re in a recession.
That’ll spook stock investors and likely trigger a major selloff. I believe we’ll see a major selloff in both stocks and bonds, which is unusual because money from stock sales usually move to the safety of Treasurys. Volatility will spike across the board when that happens.
You can prepare and profit from surprises in the financial markets, and specifically in the Treasury bond market, with Treasury Profits Accelerator. Click here to learn more.
Happy Holidays!

Lance Gaitan
Editor, Treasury Profits Accelerator

The post The Fed’s Win Rate is Still Near Zero appeared first on Economy and Markets.
December 21, 2017
Bitcoin’s Downside: Know the Risk Before You Plunge In
On Tuesday, I showed you how the bitcoin bubble looks a lot like the internet bubble that inflated in the final phase – the orgasm – of the great tech bubble of December 1994 into March 2000. It crashed faster and harder than the Nasdaq bubble – down 93% compared to 78%. It was also a leading indicator for the Nasdaq crash as it only retested its January high rather than exceeding it.
The internet bubble went up 7.5 times in just 16 months. At close to $20,000, Bitcoin has gone up 14.8 times in just eight months.
That’s twice as high in half the time!
It’s now the steepest and most extreme bubble of all time. Literally. It’s even surpassed the infamous tulip bubble of the 1630s, which is similar to the Bitcoin bubble because it too had little against which to measure any real value.
At least we could calculate the price-to-earnings ratio on the Nasdaq or AOL. But there’s no measure of valuation on these digital coins. So, like tulips, its price is only a function of what people are willing to pay.
It’s not all totally speculative though. There are two tools we can use to try to get some handle on this extreme bubble.
The first comes from the lost chapter of my Sale of a Lifetime book (a chapter only available here).
The most important calculation for estimating the downside of a bubble, even before it peaks, is the bubble origin. But that’s not the last major low. Instead, it’s the point at which the market starts to diverge from the fundamental trends (and I show you how to find it in that lost chapter).
Look at the bitcoin chart…
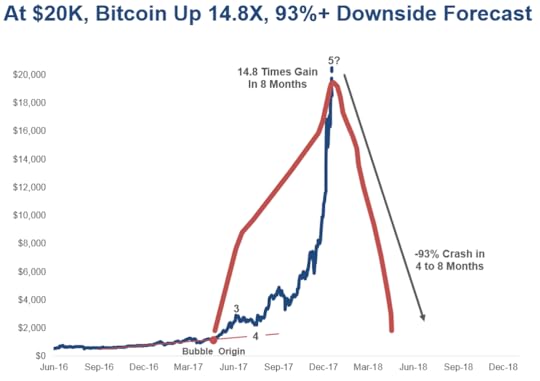 The bubble origin for Bitcoin was at $1,355 on April 24, 2017.
That means that, from the most recent high of $19,395 (at least at time of writing), this bubble could shed 93% to return to that point of origin, which is what bubbles typically do when they burst.
That’s a massacre!
As an aside, Ethereum’s bubble origin was at $51. It has had similar gains to Bitcoin, reaching 14.4 times gain at its recent highs. A crash from $733 would represent the same 93% downside.
And the higher the highs get, in both Bitcoin and Ethereum, the more devastating the collapse will be.
The second tool with which to get a handle on this bubble is Elliott Wave patterns (which I’ve marked up on the chart above as well).
The first surge or Wave 1 peaked on November 30, 2013 at $1,082 (note that is not shown on the chart, but was a clear first peak).
The second wave correction bottomed at $203 on January 14, 2015 (also not shown on the chart).
The middle and steeper surge or Wave 3 peaked at $2,840 on June 9, 2017.
The fourth wave correction, into $2,162 on July 17, 2017, marked the best place to buy into the most powerful fifth wave bubble, which we are currently experiencing. Gains since then have been a whopping nine-fold!
At this point, it’s far too late in this bubble to get in. Don’t worry, there are plenty of other opportunities out there and, once this Bitcoin bubble has burst, you’ll have a second chance to invest (although it’s unlikely we’ll see highs like this as quickly the next go around).
Rodney has written a special report around this subject and we’ll be sharing that with you early in the New Year, so be sure to watch out for it.
We’re also working with the man CNBC calls the “godfather of ICOs”, Michael Terpin, to bring you the most comprehensive and elite course on all things digital currencies.
The most important question now is: When do you get out?
I suggest setting a stop loss level just below the trendline of higher lows, at $16,500. That’s about 20% below that $20,000 mark.
All bubbles burst with mind-numbing swiftness, so if you’re going to stick with your Bitcoin investment to ride along for any potential future gains, at the very least, make sure you have an exit strategy.

Harry
Follow Me on Twitter @harrydentjr

The post Bitcoin’s Downside: Know the Risk Before You Plunge In appeared first on Economy and Markets.
December 20, 2017
Finding Good Buys in a Pricey Market
As we approach the New Year, markets are (mostly) reveling in the festive spirit, following the seasonal trend known as the Santa Claus Rally. However, most people I know find it scary to buy a stock when it’s at its all-time high… which is where many stocks are these days.
Facebook… Amazon… Apple… Netflix… Google… and, yes, Bitcoin…
They’re all trading at or near their all-time highs.
They are, indeed, “scary buys.”
But here’s the thing…
There ARE ways to find good buys, even in this environment. You’ve just got to use the right strategy. That is… Momentum!
Momentum strategies exploit the tendency for new all-time highs to beget even higher new all-time highs.
You don’t have to buy stocks at their all-time highs to exploit the momentum factor.
And you don’t have to pick the market’s “hottest” stocks of the day (i.e. the FAANGs) to make big money on momentum moves.
Look, I get it… psychologically, it’s extremely difficult to enjoy buying a stock or ETF after it’s hit a new high. You feel like you’re late… like the “easy” gains have already been had… like you missed out on “buying low.”
But you don’t get paid to feel comfortable as an investor.
In fact, more often than not, the scariest trades end up being the most profitable ones.
So, don’t avoid buying an investment just because it’s close to its highs, even if doing so feels awkward. You aren’t “shopping” for a new car, so buying near the highs doesn’t mean you’re getting a bad deal.
Let’s take a look at the principles of momentum in action, by way of actual trades I recommended to my Cycle 9 Alert subscribers this year.
I ran my Cycle 9 Alert algorithm on a basket of 50 equity market ETFs, going back 20 years.
I found that Cycle 9 signals were most accurate when the ETF was trading between 0% and 20% from its five-year high. An impressive 70% of these types of trades were profitable, generating an average return of 2.9% in three months. (Note: We use options in Cycle 9 Alert and our average profit since inception is 45% per trade).
That’s proof that buying near the highs is not a loser’s strategy… it’s “classic momentum,” a winner’s strategy.
That said, you do have other options…
Finding “Zone 2” Opportunities
Let’s look at it this way…
According to how far off its five-year high a stock or ETF is, you could aim to make Cycle 9-style momentum trades in any of five “zones,” as outlined here:
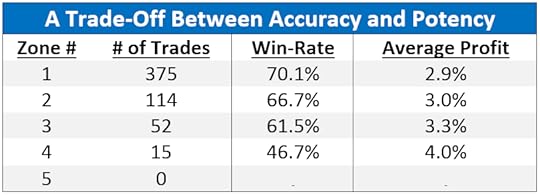 Momentum “works” in each and every one of these zones, but there are trade-offs between accuracy and potency (as the next table shows).
Cycle 9 signals produced on Zone 1 investments are the most accurate (with a 70% win-rate). And the win-rate decreases as you go from Zone 1 to Zone 5.
But when you look at average profit per trade, you’ll see a steady increase in profit potency as you go from Zone 1 to Zone 5.
Take a look…
Note that Zone 5 opportunities – where an ETF is more than 80% below its five-year high – are extremely rare, which is why there is no win-rate or average profit in the table.
What’s all this mean?
Well, it just means you have options.
You don’t have to limit your momentum trades only to stocks and ETFs that are trading near their highs (Zone 1).
You could just as easily apply my sector-rotation momentum strategy to Zone 2 opportunities, or, of course, Zone 3 or Zone 4 (when they occasionally present themselves).
And, in fact, that’s exactly what I’ve done with my Cycle 9’ers this year.
We’ve capitalized on a number of profitable Zone 2 opportunities.
Take a look…
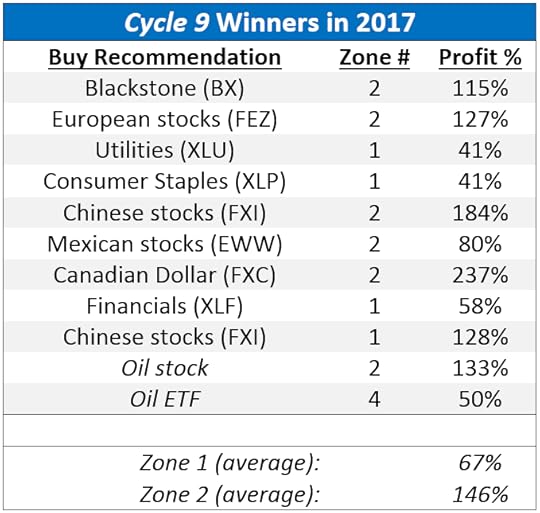 Note: Profit calculations are the average of multiple entries/exits.
As you can see, we’ve earned handsome profits on both Zone 1 and Zone 2 opportunities.
Interestingly, Zone 2 trades have been more than twice as lucrative as Zone 1 trades.
Of course, we’ve also had a few losing trades this year. But the winners have more than made up for the small handful of losers. All told, our average trade has netted us 82% in 2017.
We’ve made good profits this year by finding under-the-radar opportunities – off the all-time highs list and outside the FAANGs herd.
A Final Observation
Lastly, I’ve found it quite interesting that, in a year dominated by fervor over the FAANGs and Bitcoin, we’ve made really good money trading “boring” ETFs.
I think it’s a devastating misconception that you have to find the “next hot stock” if you want to double your money, or better.
Why not trade diversified ETFs… using a proven momentum system… with a reasonable amount of leverage (via options)?
My Cycle 9 approach may not be as sexy as buying the FAANGs.
But it works!
And I guarantee you… my momentum strategy will outlast any passing fad.
Whether you muster the courage to make “scary buys” in Zone 1, or find value in down-but-not-out Zone 2’s, a time-tested momentum strategy like Cycle 9 Alert can help you harvest market-beating gains in any environment.
To good profits,

Adam O’Dell
Editor, Cycle 9 Alert

The post Finding Good Buys in a Pricey Market appeared first on Economy and Markets.
December 19, 2017
Looks Just Like the Late Stage Internet Bubble into 2000
Cycles reoccur throughout history, but they more rhyme than duplicate.
Each bubble tends to get more extreme than the last one because there’s more wealth to chase it. Wealth is concentrated in the top 1% to 0.1% and grows exponentially (income does not).
The greatest bubble of our lifetimes was the tech bubble in the Nasdaq from late 1994 into early 2000. That built over a period of five years – the typical time frame for most stock bubbles.
This current bubble, from 2011 to present day is an anomaly. This Fed and global central bank bubble has been totally artificially driven by unprecedented QE and zero interest rate policies for 8.7 years now.
It has now outstripped the tech bubble in time, total point gains, and percentage gains.
Make no mistake about it: This is the greatest stock market bubble in modern history.
But it’s not THE greatest bubble anymore. That dubious honor goes to Bitcoin!
This morning, safety triggers shut down trading of Bitcoin futures because prices had soared too high too fast!
And there are experts out there still trying to convince investors that this isn’t a bubble! That’s dangerous talk, if you ask me.
Bitcoin and cryptocurrencies are following a similar path to the late and most bubbly internet sector of the last tech bubble, which came largely between late 1998 and early 2000. Look at this chart.

The Bloomberg internet index went up eight times in a little more than a year and then collapsed 93% compared to the 78% decline in the Nasdaq! Talk about an extreme bubble!
And most of the damage occurred within one year of that, as usual, with the first sharp crash in the first few months. Investors lost 50% right off the bat in a few months. That’s why its better to get out a bit early.
Now, look at Bitcoin versus the internet back then… and note that Bitcoin is one of the most extreme and largest leaders here – it’s like one stock versus a broader index – so it may be a little more exaggerated…
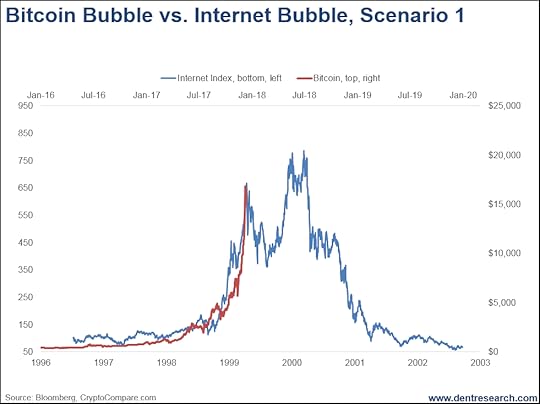
Any closer a correlation to the late stage internet bubble and it might as well be identical!
Now, if Bitcoin follows the internet bubble pattern, it could first see a sharp correction to $7,000 – $8,000, then make a final push to something like $20,000 or a bit higher. Then collapse 90% plus back down to $2,000 or so. That’s scenario #1.
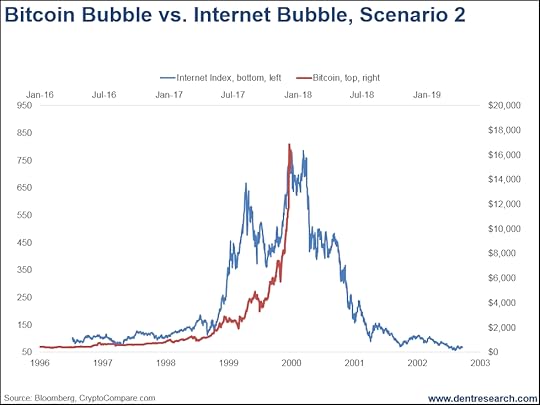
This second scenario is that Bitcoin is already nearing its final peak and will crash dramatically, sooner rather than later.
Either way, this bubble is likely closer to done than not and the risks are growing of a major 90%-plus crash with most of it occurring in the next year.
Everyday investors are no longer piling into the FAANG (Facebook, Amazon, Apple, Netflix, Google) stocks as strongly, the leaders of the last internet revolution that started in the late 1990s. Instead, they’re piling into Bitcoin and other cryptocurrencies, like Ethereum and hundreds of others.
This late-stage bubble could peak just weeks ahead of the broader Nasdaq bubble and give warning signs of the next great crash ahead…
A crash in which we’re likely to see a 40%-plus loss in the first two or three months.
You don’t want to be there for that!
But here’s the most important insight…
This cryptocurrency trend is the second stage of the internet revolution, and deals with security of financial transactions and other things of financial value that are increasingly under threat of being hacked.
It’s not the “big bang” that launches a new 45-year Innovation Cycle like the internet did. Rather it’s the one that first consolidates it and makes it better in the maturing phase of the cycle. That said, it could well morph into the next big bang cycle from 2032 to 2055.
It’s about more secure, faster, and lower cost financial transactions over the internet. That makes this a major trend in the longer term, which is why Michael Terpin, a leading cryptocurrency expert, is developing services to help you invest in the leading-edge companies that survive this bubble collapse and become the next FAANG giants of the future.
These stocks, like the best emerging countries and metals in commodities, will be the leaders to come out of the greatest crash, making them prime sale of a lifetime candidates in the years ahead.

Harry
Follow Me on Twitter @harrydentjr

The post Looks Just Like the Late Stage Internet Bubble into 2000 appeared first on Economy and Markets.


