
Harry S. Dent Jr.'s Blog, page 62
February 16, 2018
Guess Where Crypto Utopia is Being Built
 Some of the wealthiest, smartest people in the cryptocurrency sector have realized that the territory is a very attractive place to create Crypto Utopia… so that’s what they’re doing.
They’ve taken over an old hotel in old San Juan and they’re out hunting for swaths of land. They have plans to build their own city and open their own crypto bank!
I tell you why and what this means to you in my latest video, which you can watch now.

I also give you details of two huge crypto conferences taking place in Puerto Rico in March. One is called Puerto Crypto (www.puertocrypto.com), which runs from March 14 to 16. The other is Coin Agenda Caribbean (www.coinagenda.com), from March 17 to 19, which Michael Terpin is organizing. Michael is working with us to create the cryptocurrency course to surpass all cryptocurrency courses, called Crypto Mastery Series. We’ll share details when it’s ready, so stay on the lookout for that.
In the meantime, watch my latest video now to understand why Crypto Utopia is coming to Puerto Rico.
Harry

The post Guess Where Crypto Utopia is Being Built appeared first on Economy and Markets.


Chart of the Day: When Will Higher Rates Kill Stocks?
Interest rates have to go higher.
Almost everyone knows that.
But the real question on everyone’s mind is: will higher rates kill the bull market in stocks?
There’s a strongly-held belief that higher interest rates always work against stocks.
But that’s only half true.
The direction of interest rates is important. That’s what everyone focuses on.
But the level of interest rates is just as important. And this aspect of the relationship between interest rates and stock prices is overlooked by most.
Consider this chart, published consistently in J.P. Morgan’s Quarterly Guide to the Markets:
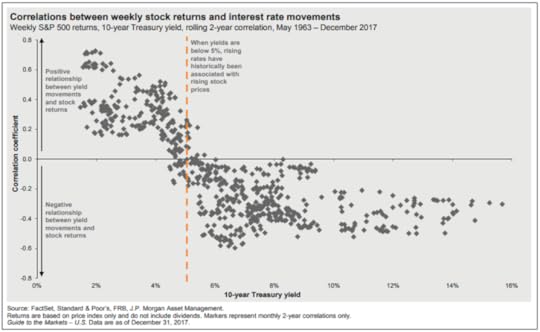 The chart plots the correlation between weekly stock returns and interest rate movements. It answers the simple question, “Do rates and stocks typically move in the same direction (positive correlation) or in opposite directions (negative correlation)?”
The answer is: both.
Specifically, it depends on whether interest rates are above or below 5%.
As I said, the correlation between stocks and rates depends on the level of interest rates, just as much as the directional trend.
When interest rates are above 5%, an upward trend in rates has historically weighed heavily on stock prices. This is the story most investors are told… higher rates make borrowing costlier, cooling the economy and investors’ expectations for stock returns.
But when rates are below 5%… an upward trend in interest rates has acted as a tailwind for stocks. Stock prices have historically moved higher, alongside increasing interest rates, while rates are under the 5% threshold.
Rates are under 5% today.
The trend of rising interest rates will indeed act as a headwind for stocks… eventually. But it could be a while longer before that headwind kicks in.
Until we hit the 5% threshold, we could easily see stocks continue to rise alongside interest rates.
Adam O’Dell

The post Chart of the Day: When Will Higher Rates Kill Stocks? appeared first on Economy and Markets.
When Will Higher Rates Kill Stocks?
Interest rates have to go higher.
Almost everyone knows that.
But the real question on everyone’s mind is: will higher rates kill the bull market in stocks?
There’s a strongly-held belief that higher interest rates always work against stocks.
But that’s only half true.
The direction of interest rates is important. That’s what everyone focuses on.
But the level of interest rates is just as important. And this aspect of the relationship between interest rates and stock prices is overlooked by most.
Consider this chart, published consistently in J.P. Morgan’s Quarterly Guide to the Markets:
The chart plots the correlation between weekly stock returns and interest rate movements. It answers the simple question, “Do rates and stocks typically move in the same direction (positive correlation) or in opposite directions (negative correlation)?”
The answer is: both.
Specifically, it depends on whether interest rates are above or below 5%.
As I said, the correlation between stocks and rates depends on the level of interest rates, just as much as the directional trend.
When interest rates are above 5%, an upward trend in rates has historically weighed heavily on stock prices. This is the story most investors are told… higher rates make borrowing costlier, cooling the economy and investors’ expectations for stock returns.
But when rates are below 5%… an upward trend in interest rates has acted as a tailwind for stocks. Stock prices have historically moved higher, alongside increasing interest rates, while rates are under the 5% threshold.
Rates are under 5% today.
The trend of rising interest rates will indeed act as a headwind for stocks… eventually. But it could be a while longer before that headwind kicks in.
Until we hit the 5% threshold, we could easily see stocks continue to rise alongside interest rates.
Adam O’Dell
The post When Will Higher Rates Kill Stocks? appeared first on Economy and Markets.
February 14, 2018
Could Gold’s Day in the Sun Be Upon Us?
After last week’s market shake up, the questions of “what happened” and “what next” is definitely on all of our minds here at Dent Research. I’ve no doubt it’s on your mind too.
The biggest question everyone’s trying to answer: Is this the end of the bull market?
I still think that January 26 looks like a top, with its parabolic nature, but thanks to one technical indicator in particular, I have some idea of what might come next…
Yesterday, I emailed to say that I believe we’re seeing Rising Bearish Wedge Scenario Type 2 unfolding right now. The markets tested the bottom trend line three times last week on Tuesday, Wednesday, and Friday – yet still managed to rally even after a clearer break on Friday. Now, it’s likely that markets will move up somewhat and then mostly sideways for a while… then they’ll retest and finally break the critical bottom wedge trend-line in the weeks ahead. Then we could be down 40% from the top in a matter of a few months. But we need to convincingly break that down trend line. And Friday was obviously not enough, despite a clear break, which makes me suspect that the Federal Reserve stepped in and bought stocks to support the market as China’s government did in late 2015.
John Del Vecchio, our resident forensic accountant, and Charles Sizemore, our Boom & Bust portfolio manager, both agree.
In his most recent Economy & Markets article, appropriately titled “What the @#$! Just Happened?!”, John explained why he doesn’t think last week’s market action is the start of a bear market just yet.
Understand, John is possibly more bearish than I am right now! Still, he has good reasons for believing that the recent market action related more to the short volatility trade than a market event that could take down stocks to major bear market levels.
Charles expressed a similar view in his latest Economy & Markets article entitled “It’s Not Time to Go Bargain-Shopping Just Yet.” As he says, “Expensive markets can always get a lot more expensive in the short-term, particularly when the economy is strong as it is today.”
It may not be time to go bargain shopping just yet, but there is an opportunity you can take advantage of now. Adam O’Dell, our Chief Investment Strategist, uncovered it recently, and it’s something I have been seeing in an uptrend for a while now. I’ll let him give you the details below.
In short: now’s a good time to buy gold!
But, before I hand you over to Adam, I want to make very clear that I’m still bearish on gold in the medium term.
I still firmly believe that gold prices could slide to as low as $700 an ounce between now and 2020. When the commodity cycle turns around, gold will regain its former glory and then some. But, that’s still years away.
Gold is an inflation hedge. I expect deflation to grip the world in the coming years. That’s the biggest mistake that gold bugs make. They think gold is a crisis hedge. It’s not. I detail this and more – in fact, I lay out my full case for gold $700 – in my eBook, How to Survive and Thrive During the Great Gold Bust Ahead.
However, the key to Adam’s recommendation below is that it’s a short-term play. I have been saying for many months that gold was due for a bear market bounce up to a range of $1,375 minimum to $1,428 maximum. There are clearly inflationary fears in the market now, and Adam intends to take advantage. Here’s what he has to say…
Gold’s Day in the Sun?
 I usually warn against reading too much into the financial media’s (backward-looking) explanation of a market move that just happened.
But it really does seem that everyone’s suddenly worried about interest rates moving too high, too quickly.
We all knew rates had to go higher. The Fed drove them to the floor, kept them pinned there for years and then, in 2013 (remember the “Taper Tantrum?”) began talking about the beginning of the end of their zero-interest rate policy (aka “ZIRP”).
Inflation and a one-way train of higher rates have been brewing concerns for years now. But until February 2, when wage growth came in hotter than expected, these concerns hadn’t been enough to spur a sea change in investor behavior.
Now, though, everyone’s panicked.
Yesterday, the 10-year Treasury rate hit a high of 2.88%. That’s as high as it’s been since, well, the height of the Taper Tantrum in late 2013.
The market has absorbed five solid years of concern over a future with higher interest rates, inflation… and yes, potentially even the hyperinflation that gold bugs are infamously on guard against.
And then on February 2, it’s as if the market just couldn’t absorb an ounce more. Alongside that wage growth report, interest rates leapt higher and bond prices sank sharply lower.
Realize though, inflation concerns aren’t contained to the bond market.
Utilities stocks are more than 15% off their highs and lagging every other U.S. stock sector – a tell-tale sign of concern about inflation ahead.
And the real estate sector is now off more than 20%, entering an official “bear market” during last week’s swoon.
The bottom line is: everything that’s sensitive to higher interest rates is getting dumped.
And gold prices looked primed for a rally.
It’s been a rough road for gold bugs since the mid-2011 peak in precious metals.
Gold prices have steadily trended lower, in the classic pattern of lower highs and lower lows.
But that five-year trend has already turned and gold prices are currently in an uptrend.
The turn began in 2016, when gold (GLD) gained around 30% by July. That move was “too far, too fast” and the excess was slowly worked off into early 2017.
But gold never made lower lows. Instead, it began to establish a new bullish trend – marked by higher highs and higher lows.
This was a newly-budding and still-risky trend until last week’s sharp sell-off in stocks and bonds. Alongside the loss of confidence in paper assets – stocks and bonds alike – gold prices are up.
There’s no way to know just yet if last week’s swoon was the beginning of the end for stocks.
But investors are scared!
Scared of bubbles in overvalued paper assets – from stocks to bitcoin. And scared of higher interest rates, inflation, and maybe even hyperinflation.
If we’re in the midst of a “topping process” for stocks, gold prices should rally through that process and awhile longer.
Shares of the SPDR Gold Trust (NYSE: GLD) gained 18% and 26% in the first three and six months of the 07/08 top that began in October 2007.
In short, gold is almost always a top-performer during the topping process of an aged bull market.
Combine that with the now-palpable concerns over inflation and higher interest rates and it’s clear: it’s a great time to make a bullish play on gold!
Buying shares of GLD is an easy way to add a little exposure.
Or you can click here to see the gold recommendation I gave to Cycle 9 Alert subscribers on Tuesday, February 13.
Adam O’Dell
Editor, Cycle 9 Alert

The post Could Gold’s Day in the Sun Be Upon Us? appeared first on Economy and Markets.
Energy Companies Tank
 When college economics professors want to explain how supply-and-demand affects prices, an easy lesson is to look at the energy markets.
Early this month, West Texas Intermediate (WTI) crude oil prices were hovering just above $66 per barrel, and many energy-producing companies were trading at or near 52-week highs.
Oil prices were up by over 30% since the middle of last year, but when prices rise, so does production. When supplies go up, prices tend to go back down – and that’s Econ 101.
Fast-forward to today, where oil is now trading at just over $59 per barrel, down 10% from the top. Energy stocks fell along with the price of oil and the overall stock market. It’s really no wonder why energy stocks fell as sharply as they did.
It’s an easy correlation: High oil prices mean that producers make more money, and low prices mean they make less.
Since February 1, U.S. crude oil prices have fallen 10%, so it stands to reason that companies selling oil products have fallen by as much.
Until there’s a cheap and clean energy alternative, oil prices will fluctuate on supply and demand factors like they’ve done for the past century or so.
The Organization of Petroleum Exporting Countries (OPEC) was founded in 1960 by the governments of Iran, Iraq, Kuwait, Saudi Arabia, and Venezuela. Since its founding, other oil producing nations have joined OPEC, which advocates for secure fair and stable oil prices for producers. OPEC’s mission is to try and increase profits for members while regulating supply and manipulating prices.
If OPEC sounds like a cartel, it is. The only problem (for it), is that there are major oil-producing nations like the United States and Russia who aren’t members and aren’t subjected to their policies. That means when OPEC decides to implement a cut in production to prop up prices, there are major producers ready to step in when the prices are favorable to produce more.
OPEC still has influence on the world oil markets, but it’s definitely diminished since its start in 1960.
The price of oil fluctuates because demand for oil fluctuates and supply fluctuates. What doesn’t fluctuate much is the cost to produce a barrel of oil. It’s a lot more costly to extract from deepwater wells like in the rough North Sea than from the desert of Saudi Arabia.
According to the Wall Street Journal, the UK had a production cost of nearly $45 per barrel compared to Saudi Arabia’s $8.
Here in the U.S., it costs a little over $23 per barrel to extract oil from shale compared to about $21 for non-shale producers.
It doesn’t take a math whiz to figure out that when prices go up, producers pump more oil to make more money – that is, until supply exceeds demand and prices go back down. Once agin, we’re talking Econ 101.
Many of you are familiar with Treasury Profits Accelerator and how I use call and put options as a means to leverage volatility in the Treasury bond market. Well, very soon, my newest trading service, Energy Profits Accelerator, will be available to the wider public.
Energy stocks are some of the most heavily traded in the market, with both individual AND institutional investors constantly buying in.
They also feature significant volatility – shooting higher and dropping lower on a regular basis.
By applying my new strategy to energy stocks… you can win no matter which way the roller coaster ride is headed – up OR down!
I’ve been beta-testing the underlying strategy for over a year, and that’s on top of the 10-year back-test I ran as well. In April 2017, I opened my first live option position to an internal group, and our VIP Network Members are currently “test driving” it.
Keep your eyes peeled for the chance to sign up!
Good investing,

Lance Gaitan
Editor, Treasury Profits Accelerator

The post Energy Companies Tank appeared first on Economy and Markets.
What the @#$! Just Happened?!
 We’re only about five weeks into the year and one of my 2018 predictions is already coming true.
The thing is, it was an easy one – though it’s always nice to be proven right. I predicted that volatility would rise in 2018 after years of middling action. And rise it did. According to Ned Davis Research, the volatility index just spiked four standard deviations above average.
It’s subsided a bit, but volatility is here to stay.
Investors were reminded that, yes, sometimes stocks actually do go down, and they responded by yanking nearly $46 billion from investment funds last week.
But I don’t think this is the start of a bear market.
Don’t get me wrong, I’m still bearish. Market sentiment is still too bullish, and valuations are way too stretched. Something will have to give.
I think the recent market action is related more to folks going short on volatility rather than a market event that could take down stocks to major bear market levels.
Why do I think that?
Well, some hedge funds have made consistent returns day after day for several years betting against market volatility. It’s worked beautifully.
Those types of trades tend to work beautifully until they don’t.
Then, after years and years of gains, it’s all wiped out in a single day before breakfast gets cold. Most of the trades are done with huge amounts of leverage to amplify the otherwise small returns.
Once the trade goes the other way, margin calls come in, the trade gets unwound, and there’s a huge reversal in whatever instrument the hedge funds are trading. Then the hedge funds experience extreme pain, and I know that some banks have experienced the greatest number of margin calls in years.
This happened in 2008 when funds had been making a lot of money by shorting the Japanese yen with higher-yielding currencies. It worked great… until it didn’t.
But that also coincided with other crises as major financial institutions cratered for reasons unrelated to that trade. The short yen trade simply added fuel to the fire.
The other clue is when I look at the price action of stocks like Johnson & Johnson (NYSE: JNJ), which are defensive in nature. When they go from near 52-week highs to near 52-week lows in a matter of days, there’s something going on besides just fundamental issues. These stocks are in the major indexes, and it’s the futures contracts on those indexes that are linked to the volatility trades.
Unlike 2008, there’s no default or major bankruptcy. Interest rates are low, although they are trending higher.
I think we’ll see the real, nasty, and painful bear market once there’s a major corporate event such as the failure of someone too big to fail, a geopolitical event, or, most likely, that the interest rates used to price loans that people use to borrow against their stock portfolios simply get too expensive. Then everyone will rush for the exits at once.
While this may not be the start of a bear market, let this be a reminder that stocks actually do go down – sometimes and higher volatility can be expected in the months ahead.
Good investing,

John Del Vecchio

The post What the @#$! Just Happened?! appeared first on Economy and Markets.
February 13, 2018
Gold’s Day in the Sun?
I usually warn against reading too much into the financial media’s (backward-looking) explanation of a market move that just happened.
But it really does seem that everyone’s suddenly worried about interest rates moving too high, too quickly.
We all knew rates had to go higher. The Fed drove them to the floor, kept them pinned there for years and then, in 2013 (remember the “Taper Tantrum?”) began talking about the beginning of the end of their zero-interest rate policy (aka “ZIRP”).
Inflation and a one-way train of higher rates have been brewing concerns for years now. But until February 2, when wage growth came in hotter than expected, these concerns hadn’t been enough to spur a sea change in investor behavior.
Now, though, everyone’s panicked.
Yesterday, the 10-year Treasury rate hit a high of 2.88%. That’s as high as it’s been since, well, the height of the Taper Tantrum in late 2013.
The market has absorbed five solid years of concern over a future with higher interest rates, inflation… and yes, potentially even the hyperinflation that gold bugs are infamously on guard against.
And then on February 2, it’s as if the market just couldn’t absorb an ounce more. Alongside that wage growth report, interest rates leapt higher and bond prices sank sharply lower.
Realize though, inflation concerns aren’t contained to the bond market.
Utilities stocks are more than 15% off their highs and lagging every other U.S. stock sector – a tell-tale sign of concern about inflation ahead.
And the real estate sector is now off more than 20%, entering an official “bear market” during last week’s swoon.
The bottom line is: everything that’s sensitive to higher interest rates is getting dumped.
And gold prices looked primed for a rally.
It’s been a rough road for gold bugs since the mid-2011 peak in precious metals.
Gold prices have steadily trended lower, in the classic pattern of lower highs and lower lows.
But that five-year trend has already turned and gold prices are currently in an uptrend.
The turn began in 2016, when gold (GLD) gained around 30% by July. That move was “too far, too fast” and the excess was slowly worked off into early 2017.
But gold never made lower lows. Instead, it began to establish a new bullish trend – marked by higher highs and higher lows.
This was a newly-budding and still-risky trend until last week’s sharp sell-off in stocks and bonds. Alongside the loss of confidence in paper assets – stocks and bonds alike – gold prices are up.
There’s no way to know just yet if last week’s swoon was the beginning of the end for stocks.
But investors are scared!
Scared of bubbles in overvalued paper assets – from stocks to bitcoin. And scared of higher interest rates, inflation, and maybe even hyperinflation.
If we’re in the midst of a “topping process” for stocks, gold prices should rally through that process and awhile longer.
Shares of the SPDR Gold Trust (NYSE: GLD) gained 18% and 26% in the first three and six months of the 07/08 top that began in October 2007.
In short, gold is almost always a top-performer during the topping process of an aged bull market.
Combine that with the now-palpable concerns over inflation and higher interest rates and it’s clear: it’s a great time to make a bullish play on gold!
Buying shares of GLD is an easy way to add a little exposure.
Or you can click here to see the gold recommendation I gave to Cycle 9 Alert subscribers on Tuesday, February 13.

Adam O’Dell
Editor, Cycle 9 Alert
Follow me on Twitter @InvestWithAdam

The post Gold’s Day in the Sun? appeared first on Economy and Markets.
It’s Not Time to Go Bargain-Shopping Just Yet
 Things got interesting last week.
For the first time in history, the S&P 500 went from a new all-time high to a 10% correction in just nine days.
In January, stock mutual funds and ETFs saw their biggest monthly inflows in history, only to see record weekly outflows in the first week of February. Investors couldn’t get enough of the stock market in January and were overcome with the fear of missing out.
Literally days later, it was a stampede to the exits.
Based on points (not percentages), the Dow has its worst ever single-day decline last week, down 1,175. And the rest of the week gave us volatility that we haven’t seen in years.
So, what now?
After a bout of volatility like we saw last week, might there be some bargains out there to be had? Let’s take a look.
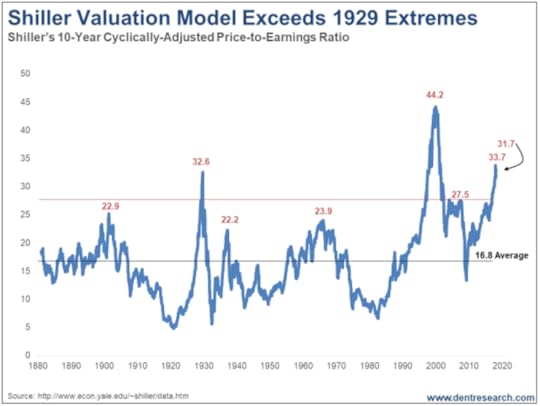 The Shiller P/E – also called the Cyclically Adjusted Price/Earnings Ratio (“CAPE”) – is one of my favorite “quick and dirty” measures of market valuation. In order to round out the ups and downs of the business cycle, it compares current stock prices to a 10-year average of earnings.
The CAPE isn’t perfect, of course. It doesn’t fully take into account changes in inflation rates or bond yields, for example. But, overall, it’s a solid metric that will tell you if the market is broadly expensive or broadly cheap.
The CAPE finished January at 33.7. To put that in context, the only time in history that the CAPE has been higher was during the final year and a half of the 1990s Internet Bubble.
Well, as of Monday morning, the CAPE wasn’t meaningfully lower. At a reading of 31.7, the CAPE is still at levels only seen twice in all of history – during the Internet Bubble and during the Roaring 1920s Bubble.
Starting at levels this high, the market is priced to deliver losses of about 3% per year over the next eight years, according to data analytics firm GuruFocus.
Now, I don’t for a minute believe that the S&P 500 will return exactly minus-3% annually over the next eight years. That’s a forecast based on historical results, and the future never quite looks exactly like the past.
But, suffice it to say, if you were licking your chops waiting for a major buy opportunity… this isn’t it.
February’s volatility has essentially undone January’s manic buying. And assuming the economy remains healthy, I think it’s likely the market goes at least marginally higher from here over the next several months.
Expensive markets can always get a lot more expensive in the short-term, particularly when the economy is strong as it is today. But this is by no means a good opportunity for a new buy-and-hold money in the stock market.
Bonds, however, are a different story. The 10-year Treasury yield is quickly approaching 3%, a level it hasn’t seen since late 2013.
Harry has been looking for these levels and considers the bonds at these yields to be “the fixed income buy opportunity of a lifetime.”
I agree.
Yields continue to creep higher, so you probably don’t need to rush into bonds just yet. But it definitely makes sense to nibble at 3%-yielding bonds when yields are barely a third of that level in most of the developed world.

Charles Sizemore
Editor, Peak Income

The post It’s Not Time to Go Bargain-Shopping Just Yet appeared first on Economy and Markets.
Which of These Two Patterns is Unfolding Now?
Last week, markets fell out of bed. Yesterday, they got up and dusted themselves off.
I’ve been warning for months now that U.S. markets are in a rising bearish wedge. This pattern tends to be the last move in a long bull market.
Stocks go up in a last orgasmic move in a narrowing channel – or wedge – with little volatility. And then, suddenly, the music stops.
It was thanks to me identifying this wedge that I called the May 2013 top in the junk bond market – to the day!
It was also present at many of the great bubbles in our lifetime…
The Nikkei in 1989.
The Nasdaq in 2000.
Gold in 2011.
Each one peaked in rising bearish wedges.
But there’s something even better that this technical pattern enables us to do…
With this pattern, we can see predictable points to exit the market, on the high end… and we get a second chance to get out at the point of break-down, not too far off the top.
But, as with any technical pattern, there’s some art is reading that situation. With rising bearish wedges, there are two scenarios that could unfold…
In Scenario #1, we advance in a rising wedge in a 5-wave up pattern (using Elliott Wave methodology): a-up, b-down, c-up, d-down, and then a final e-wave peak right at or just slightly above the top of the rising wedge.
The infamous 1925-1929 bubble and top occurred this way.
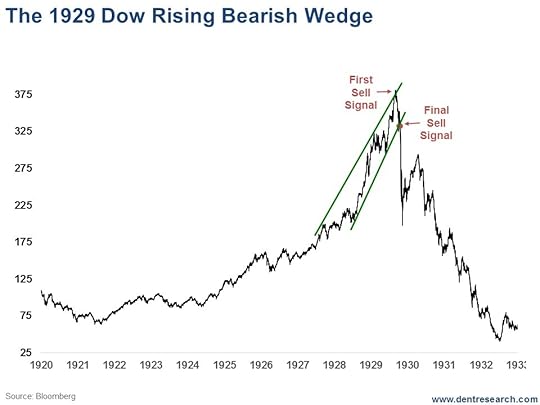 As with junk bonds in 2013, when the market stays within the rising wedge, and when tests the bottom trend-line, it tends to crash right through because the trend is more obvious to traders who drive the markets.
This was also the case with Australia’s ASX 200 bubble into late 2017, and its eventual burst (see you soon Australian readers!).
In Scenario #2, which is unfolding right before our eyes in the Nasdaq, Dow, and S&P 500, we get a “throw-over” rally above the top trend line of the rising wedge, which makes it even more parabolic, and hence, more toppy and bearish.
This is what happened in the Nikkei in 1989, the Nasdaq into 2000, and the Shanghai Composite into late 2007.
Either way, once the crash is confirmed, markets lose more than 40% in the first 2.5 months and 80% two or three years later.
Last week, the Dow, S&P 500, and Nasdaq tested the bottom trend-line of their respective rising bearish wedges three times. Yet each time they rallied back.
On Friday, they broke through that line clearly, but briefly.
Yesterday, they came roaring back.
Based on my study of past rising bearish wedges, and how Scenario #2 typically plays out, it’s likely that markets will move up somewhat and then mostly sideways for a while… then they’ll retest the trend lines… and finally break the critical bottom wedge trend-line in the weeks ahead.
Yesterday, I told Boom & Bust subscribers what to look out for, and what levels on the major indices to take note of. If you’re not already a member, now’s the best time to join.

Harry
Follow Me on Twitter @harrydentjr

The post Which of These Two Patterns is Unfolding Now? appeared first on Economy and Markets.
February 12, 2018
The New Debt Bomb
 Count me among the worriers that thought our debt was a problem at $10 trillion… and then at $15 trillion.
I was wrong.
Or, at least, those levels didn’t seem to phase investors, who kept putting down their cold, hard cash to buy U.S. Treasury bonds.
As I shook my head over the past several years, we continued our profligate ways, and now our national debt stands at a whopping $20.5 trillion, slightly more than our annual GDP.
It’s about to get worse. Much worse.
I’m a fan of the recent tax reform, mostly because I’m a fan of my money. I like to keep as much as I can. The recent legislation gives me, and most working Americans, a few more coins in my pocket. But it comes at a cost.
It’s old news that on its face the new tax law adds $1.5 trillion to the U.S. deficit over the next 10 years. The main goal of the plan is to cut the corporate tax rate, making American corporations more competitive and America itself an enticing location for companies wanting to relocate their businesses.
To sell a tax cut for corporate America, Congress also added tax relief for a broad swath of workers. The end result is less tax revenue, but we’re still spending like crazy. Which results in a bigger deficit. But there’s more to it than that.
Because the tax law was passed through budget reconciliation, at the end of 10 years the law must be revenue neutral. In other words, at some point in the future we have to claw back some of those tax cuts, at least on paper.
The Joint Committee on Taxation (JCT) estimates that we’ll add $200 billion or so to the deficit in the first few years under the new tax regime, but by 2023 something magical happens. The loss narrows.
By 2027, the new tax structure actually captures more revenue and reduces the deficit. If that sounds like sleight of hand, it’s because it is.
To make the numbers work, Congress wrote into law that taxes on certain groups of workers will begin to rise starting in the early 2020s, and by the end of the 10-year window, most Americans will pay more in taxes than they do today. I’m guessing it will never happen.
In five years, I can’t imagine the president and Congress going to the American people and saying, “Hey, we gave you a break on your taxes for a few years, but to make all this work out, we have to take back the money.”
Instead, legislators will cave and provide a series of one-off breaks and other remedies. That’ll be good for my personal pocketbook (assuming I’m in the group!) but it will hurt the nation. Using some numbers from the JCT, if we kept rates low on individuals, it could add another $400 billion to our deficit.
And there’s more.
As the Federal Reserve unwinds quantitative easing, the central bank will own fewer bonds and earn less interest. The Fed nets its earned interest against expenses, and then sends whatever is left to the U.S. Treasury as a gift.
Last year the Fed sent Uncle Sam $80.2 billion. The year before the Fed sent over $90 billion. The Fed has provided the U.S. Treasury with almost $750 billion in free money since the financial crisis, offsetting more debt… but those days are over, and without the extra cash the national debt will climb.
Last, but not least, are student loans.
In the late 2000s, the U.S. government essentially took over the student loan business. On behalf of taxpayers, the government made these loans at very favorable interest rates, with most going out the door at just under 4%.
Essentially, we’re giving a break to students, most of whom could never obtain a personal loan on such favorable terms elsewhere. After all, who would lend money at such a low rate to a group with an 11.3% default rate? Unfortunately, that number is expected to shoot higher in the years ahead as students with much bigger loans work their way through the system.
And then we gave them an even bigger break.
Through income-based repayment programs, the U.S. government allows large swaths of student-loan borrowers to avoid repaying a chunk of their loans.
The goal was to give those who went to work in the non-profit world or the public sector a break, assuming they’d make less money than in the private sector.
In reality, taxpayers are providing six-figure sums to doctors who work at non-profit hospitals and still earn private-sector pay, as well as lawyers who work for regulators to qualify for lower student-loan payments and later flip to the private sector for big bucks.
When the U.S. government squeezed other lenders out of the business at the end of the last decade, officials were quick to point out that this was a profitable business. As time went by, government profit estimates on student loans dwindled, until last year when they finally went negative by $11 billion.
Now the government expects to lose more than $30 billion on student loans over the next 10 years.
That’s a drop in the bucket in terms of the U.S. government budget, or even when compared to the tax reform and falling Fed remittances, but it’s still real money.
Adding this up, we get $1.5 trillion in extra debt from the tax reform bill, plus another $400 billion if we don’t hike taxes on Middle America in a few short years.
Kick in the lost revenue from the Fed at $100 billion and student loan losses of $30 billion, and we can count on the national debt shooting up by at least another $2 trillion.
And that’s if everything else, like GDP growth and interest rates, go as expected. Somehow, I doubt we’ll be so lucky.
As Harry and I have pointed out many times, we’re still in an economic Winter Season, where growth disappoints. Expect the national debt to grow much faster than the government forecasts.

Rodney Johnson
Follow me on Twitter @RJHSDent

The post The New Debt Bomb appeared first on Economy and Markets.


