
Harry S. Dent Jr.'s Blog, page 60
March 6, 2018
What’s Making the Chinese Nervous?
In the late 1970s and early 1980s, the Chinese had a problem. Too many kids.
The government recognized that having so many rug rats running around would sap the country of resources that could be used for economic growth.
So officials did what they had always done: passed a law.
The new regulation, introduced in 1979, allowed only one child per couple with few exceptions. If you broke this law, you were subject to fines and the additional children were not allowed to be registered for school or social benefits.
The one-child policy saved China from an additional 350 million births. But it also created a mismatch between the sexes. Parents preferred boys. And the policy drained the country of a future workforce that could support an aging, bulging population.
So, once again, government officials did what they always do. A new law, passed in 2015, allowed couples to have two children.
Officials expected births to shoot higher and reach 25 million per year. Outside experts were less optimistic and forecast births would jump to 20 million per year.
Both were wrong.
Just under 18 million children were born in China in 2016. That number dropped to 17.2 million last year.
The number of live births per 1,000 people dropped from 23 in 1987 to 12 for most of the 2000s. Over the last two years it has inched up to 13.
It appears that even with the government’s position, young couples aren’t terribly excited about expanding the family.
And why would they be?
By denying families the right to have more than one child for 30 years, the government cemented a generation of only children.
As these little princes and princesses get married, they face the daunting challenge of supporting themselves and their four aging parents, plus any children they might have. Bringing one child into the world might be great for the ego and keeping the family name going, but more than that and they run the risk of financial strain.
Chinese social benefits aren’t exactly generous. To ensure your child’s success, the toddler must be sent to private schools and provided extra tutoring. And then there’s university, as well as making sure he or she is successful enough to attract a mate.
All of this makes Chinese bureaucrats nervous. The nation’s labor force has shrunk since 2012 and is expected to decline by more than 20% over the next 30 years as the aging group retires. That will leave hundreds of millions of old Chinese wondering who will pay the taxes that will support them in the years to come.
To make matters worse, no government has been able to solve this puzzle. From Singapore to South Korea, governments have tried to encourage couples to form families and have children but to no avail. Japan is among the worst cases, but other nations aren’t far behind, including Germany.
All of China’s grandiose plans, including its One Belt, One Road Initiative, won’t mean much if the country can’t find a way to stabilize its population and care for its own people.
This is probably one of the biggest examples of an unintended consequence as a result of government policy. Which brings to mind the old adage: Be careful what you wish for.


The post What’s Making the Chinese Nervous? appeared first on Economy and Markets.


March 5, 2018
It’s Too Late to Build That Wall
And so the immigration debate continues to hold government and the mainstream media hostage. Let’s continue our analysis of the situation that we started last Monday…
In our March 2017 Boom and Bust newsletter on “The Truth About Immigration,” I showed that the total population of illegal Mexican immigrants had peaked in 2007 at 6.9 million and had fallen to 5.6 million by 2015.
That’s a net decrease of 150,000 a year over nine years.
In other words, more illegals were going home than coming in. They were self-deporting!
The thing is, it turns out this trend isn’t isolated to illegal Mexicans. We saw a similar development when we looked at the annual rate of new arrivals since the peak of 2000 in this chart.
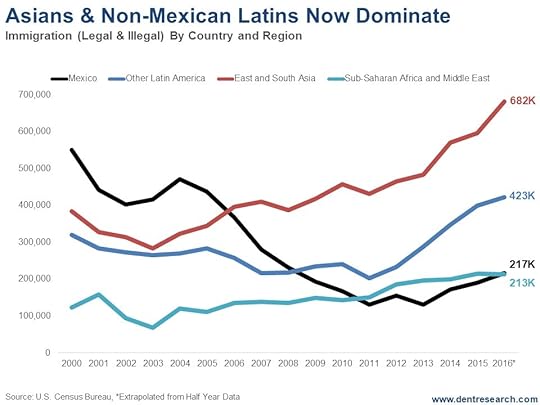
If we look at the annual legal and illegal we see that Mexico was the dominant force into the last peak in 2000. About half of that was illegals.
But then that dropped from about 570,000 to 115,000 in 2011.
Since then the rise has been minimal, moving back to just 124,000 in 2016, about the same as the 122,000 immigrants from all of the Middle East and Africa.
East and South Asia immigration to the U.S. has been accelerating the most since 2003… but I don’t hear many complaints about these people.
Since 2011, immigration from the rest of Latin America has been accelerating and they tend to come in more through Miami and Florida than through the Mexican border states.
The exceptions are El Salvador, Honduras, and Guatemala. Some of those immigrants sneak into Mexico and then into the U.S. But many of the El Salvador immigrants, the largest group, were let in as refugees. No wall would have stopped much of that!
The first major peak for all new immigrants was 2000 at 1.66 million. After a major drop into 2011, 2016 looks to finally be a new high at around 1.80 million.
The total immigrant population is now 43.7 million, or about 13% of the total.
Only 2.8 million are from predominantly Muslim countries.
The top 10 countries from which (legal and illegal) immigrants have poured in are:
Mexico, at 11.6 million
China, at 2.7 million
India, 2.4 million
Philippines, at 1.9 million
El Salvador, at 1.4 million
Vietnam, at 1.4 million
Cuba, at 1.3 million
Dominican Republic, at 1.1
Guatemala, at 0.9 million
And Columbia, at 0.7 million
Numbers are only part of this puzzle though. Quality of immigrant plays a major role in their impact on the U.S.
Guess which immigrants from those top 10 countries has the highest average income?
India!
And the only one barely growing its legal immigration to the U.S. is, of course, Mexico, with its number of net illegal immigrants still shrinking.
There are so many things we could do to stop illegal immigration that would be less costly and more effective than building a big-ass and costly wall which will take forever to build.

Harry
Follow Me on Twitter @harrydentjr

The post It’s Too Late to Build That Wall appeared first on Economy and Markets.
March 2, 2018
The Canada of the Southern Hemisphere
I’ve been in Australia for two weeks now, and man… jet lag’s a killer!
Still, I make a point of visiting the country once every year for several reasons:
It’s my favorite country in the world and if I could live here, I would (unfortunately that’s not practical).
It is the best in the developed world for demographic and immigration trends.
And it has the edge in several key areas.
Unfortunately, right now, it also faces two major problems.
I detail all of this in this week’s video, which you can watch now:
 I’ll be back State side by Sunday. It’ll be good to be back, but I’ll miss Australia.
To all my Australian readers and those who attended one of my Five City Tour appearances, thank you for having me. See you next year.
Harry
Follow Me on Twitter @harrydentjr

The post The Canada of the Southern Hemisphere appeared first on Economy and Markets.
Has Bitcoin Infected Wall Street?
It’s been difficult for me to believe that bitcoin (!) – the wackiest of financial products – could ever infect traditional capital markets.
“It’s so fringe. It has to be a fad,” I’ve thought.
But now, I’m beginning to change my mind.
Harry’s found a quite interesting link between the ups and downs of bitcoin… and the stock market. If you missed it… click here.
And in early-December – as bitcoin prices were tearing through every handle, from 11,000 to 19,000 (!) – I finally put my finger on a suspicious link being the bubbling cryptocurrency market and good old-fashioned Wall Street: the exchanges.
Here’s what I told my Cycle 9 Alert subscribers on December 5:
I’m no expert on crypto currencies. That said, I’m pretty sure 2017 will go down in the history books as the year bitcoin went bubble.
It’s checking all the “classic bubble” boxes…
Massive price gains. Up a hair more than 1,000% year-to-date!
Trending on Google Search. Bitcoin now garners 7-times more Google searches than Kim Kardashian. And it’s an international hot topic, with the U.S. representing just the 8th-largest volume of search queries.
Non-investor interest. My wife is asking me about bitcoin. She has zero interest in investing, finance, or economics.
New financial products. Both the Chicago Board of Options Exchange (CBOE) and the Chicago Mercantile Exchange (CME) will offer a bitcoin futures contract, beginning December 10 and December 18, respectively.
The last point is what ties the fringe of cryptos to the stalwarts of Wall Street.
Consider this…
The S&P 500 gained an impressive 19% in 2017.
But the SPDR Capital Markets ETF (NYSE: KCE) was up 27%!
And sticking out like a sore thumb, if you thought to look, was the traditionally-stodgy Chicago Board of Options Exchange (Nasdaq: CBOE)… up a massive 69%!
That’s better than 485 of the 500 stocks in the S&P 500!
And as I explained to my Cycle 9’ers, I think it all had to do with the bitcoin craze.
The CBOE gained regulatory approval to offer bitcoin futures on its exchange late in the year and trading commenced on December 10.
In true “introductory-offer” fashion, the CBOE announced that you could start trading bitcoin for FREE!
The CBOE’s chairman and CEO, Ed Tilly, made the jubilant announcement, saying:
“Given the unprecedented interest in bitcoin, it’s vital we provide clients the trading tools to help them express their views and hedge their exposure. We are committed to encouraging fairness and liquidity in the bitcoin market. To promote this, we will initially offer bitcoin futures trading for free.”
Free bitcoin trading! What could go wrong? Right!?
Well, it wasn’t long before we found out.
Ironically or not, bitcoin prices topped out about a week later… on December 16.
From there, it tumbled from a high in the 19,000s to a low in the 7,000s – losing around two-thirds of its value.
Shares of CBOE, too, have taken a tumble… from a high of around $138, in January, to a low under $97 just two weeks later.
That’s a bear-market drop, folks!
Realize, bitcoin is an infantile market. I’m no expert on it… so I can’t say where it goes from here. But now I’m beginning to realize – whether deserved or not – just how big of a deal this latest market craze has become.
When you see a fringe market affecting the most traditional components of Wall Street’s machinery… you have to take notice.
I offered my Cycle 9 Alert subscribers an unofficial trade on this idea and it’s been doing quite well. To gain access to current recommendations, which in 2017 averaged more than 80% in three months, click here.

Adam O’Dell
Editor, Cycle 9 Alert
Follow me on Twitter @InvestWithAdam

The post Has Bitcoin Infected Wall Street? appeared first on Economy and Markets.
March 1, 2018
What I Told the Germans (Part 1)
We’re in talks with a publisher in Germany to begin publishing our newsletters there. (We’re also talking to publishers in Australia and South Africa, although its early days). The prospect of expanding our influence beyond U.S. borders in a meaningful way is exciting.
So, not long ago I chatted with our German contact. He had some great questions, and I think you’ll find my answers valuable.
Here’s what he asked and I answered…
Mr. German Publisher: Harry, your book is titled Zero Hour. For me as an investor: is this hour something good or something bad?
Me: I’m anticipating the greatest crash since 1929-1932, so it’s clearly bad news… and Germany has the worst demographic trends ahead so that makes it even more dire news. Your country is just like Japan was in recent decades, demographically speaking!
Mr. German Publisher: Can Germany learn from the 10 to 15 years of Japanese experience?
Me: No one has learned from Japan’s massive bubble burst and it’s 28-year bear market. And no one realizes that its Baby Boom came much earlier than the one in the U.S. and Europe. A generation of this magnitude will always cause bubbles. Unfortunately, most people are blind to bubbles and don’t learn from mistakes others made.
We also have an 80-year four-season economic cycle that sees an explosion of bubbles during the fall season, as evidenced in the Roaring 20s. When investors are in bubbles they’re getting a free lunch. This makes them “high.” They don’t want to hear that it’s a bubble and that it will burst, so they find every argument against it.
I have rarely been able to talk someone who is in a bubble out of it!
Mr. German Publisher: Your analysis is based on cycles. Could you briefly explain what cycles these are and why you think they are relevant?
Me: We had a major demographic cycle peak in late 2007 for the U.S. and late 2011 for Europe. But we also see a lot of longer term cycles peaking between late 2007 and late 2019. There’s the Geopolitical Cycle, the Boom/Bust Cycle, and the Innovation Cycle that are all having a significant impact on our world today. As is the Commodity Cycle, but that is more worrisome for developing countries than for us (although we’re not immune to its effects).
Mr. German Publisher: What do you think about 2018? Is this already the year of “Zero Hour?”
Me: Yes, I think stock markets will peak in the first half of 2018, and the bitcoin crash is one leading indicator of that, as is slowing in global central bank easing since March 2017.
Mr. German Publisher: Is the recent “flash crash” on the NYSE just the beginning?
Me: Yes, but we’ve been following Scenario #2 on the rising bearish wedge indicator so it may be a few more weeks before this will become more evident. Once the markets break convincingly through the bottom trend-line of that indicator, we could see a 40% crash by late April. But we must convincingly break the trend line through stock bottoms back to 2009. An attempt to do that failed between February 6 and 9.
Mr. German Publisher: What is the main reason for the flash crash? The tightening money supply due to higher interest rates?
Me: There are a number or reasons:
Collective central bank QE has been declining since March 2017, on a year-plus lag that should see economic weakening in early to mid-2018, just when everyone is convinced tax cuts are going to take us to heaven and 4% growth again. Those growth rates are not possible given the weak demographic trends and low productivity everywhere.
Sovereign bond yields are rising due to late stage inflation – as I have been predicting; and gold is rising as well. These are not good for stocks.
Bitcoin and cryptos crashed – down 70% at worst for bitcoin, which means the bubble has burst. That puts fear in investors in all markets and will make them question the parabolic rise in stocks in the last two years as well.
Mr. German Publisher: Where do you think that the final reckoning will start? In the stock market? With interest rates? In real estate?
Tune in next Thursday to see how I answered that and the rest of his questions.
Harry
Follow Me on Twitter @harrydentjr

The post What I Told the Germans (Part 1) appeared first on Economy and Markets.
February 28, 2018
The Sea Change That Might Drown Investors
Last week, John Del Vecchio, our resident forensic accountant and seeker of hidden profits, sent an email to his Earnings Insider Alert subscribers. He shared an interesting perspective with them, so I’m sharing it with you now too…
While the market has bounced back strongly from its recent scare, it’s my opinion that we’ve entered a new phase of the stock market cycle.
The short volatility trade worked until it didn’t. Now that it’s imploded, it’s reminded people that volatility does in fact exist in the markets and that sometimes stock prices do in fact go down.
Investor sentiment has come down some, but not enough to call any sort of bottom. In addition, valuations remain way too rich, especially in a period of peak profit margins.
Expect more volatility going forward. Scare after scare will eventually lead to a bear market. Then we’ll finally have a low-risk buying opportunity that could set itself up for strong returns for years to come.
Rodney also believes we’re witnessing a sea change.
Six months ago, he recorded an Ahead of the Curve webinar – something only our lifetime subscribers have access to – on the Federal Reserve. He detailed how the central bank was starting to trim its $4.5 trillion balance sheet – and the impact that could have on the economy and markets in the months and years ahead.
Last week, with markets experiencing volatility not seen in years, bond yields rising, and inflation jitters bubbling, he recorded a new Ahead of the Curve webinar in which he talked about this in more detail.
The Fed has continued to take money off its books at an increasing rate, and by the end of the year, the central bank will be slashing its balance sheet by $50 billion every month. That’s money – created in the years after the financial crisis by the Fed’s monstrous bond buying policies – that will disappear from the marketplace. And that’s a big deal!
By trimming its balance sheet, the Fed is pulling out of the bond buying business, and that may influence other buyers to do the same. All the while, the central bank won’t blink at a 10% or 20% drop in equities – since it’s more concerned with normalizing interest rates at this point, which is one of its big three mandates.
For this, and several other reasons, including growing fears on increasing interest rates and rising inflation, we’re on the threshold of our Fixed Income Trade of the Decade. 10-Year Treasury bonds are toying with the 3% yield level. The 30-year Treasury bond yield topped 3.2%. So, on Monday, Charles Sizemore, our Boom & Bust portfolio manager, instructed subscribers to make our first play on this trend.
Harry
Follow Me on Twitter @harrydentjr

The post The Sea Change That Might Drown Investors appeared first on Economy and Markets.
Why You Can Beat the Pros at their Own Game
In his prime, Julian Robertson was considered to be the godfather of the modern hedge fund industry. He started Tiger Management Corp. in 1980 with $8 million in seed capital and built it into a $22 billion hedge fund empire.
For most of the 1980s and 1990s, Robertson’s fund generated annual returns in excess of 30%, putting him in the pantheon of investing gods like George Soros and Warren Buffett.
Alas, the late 1990s tech bubble was his downfall… but not for the reasons you might think.
Robertson believed that technology stocks were in a massive speculative bubble, and he avoided the sector.
He was right, of course. But it didn’t matter. His investors lost patience after he underperformed the indexes for a couple years and jumped ship. Bleeding assets left and right, Robertson ended up closing his fund in 2000 and returned the money to his investors.
Ironically, Robertson closed up shop right as the bubble was starting to burst. The investors that stuck with him would have likely made really good money in the years that followed.
Another investor whose name you might recognize – a certain gentleman from Omaha named Warren Buffett – also massively underperformed the S&P 500 in the late 1990s. But Buffett, unlike Robertson, lived to trade another day, and went on to have a decade of solid outperformance.
So, why did Buffett’s Berkshire Hathaway survive, while Robertson’s Tiger Management die?
There’s really just one reason: Buffett never had to face redemptions.
Robertson faced the same issue most mutual fund managers face. He was required to give his investors their money back on demand. And when your profit model is based on a growing pool of assets under management, that’s a big problem.
If half of your investors leave, you just lost half your management fee. Yet you still have office rent and analyst salaries to pay, not to mention that house in the Hamptons and a country club lifestyle to maintain.
This is one of the reasons that most mutual fund managers are closet indexers… and chronic underperformers.
It’s too risky for them to make large bets on their high-conviction trading ideas. They can be right on a major market call… but off ever so slightly on the timing… and effectively be out of business.
Their investors are fickle and prone to chase whatever (or whoever) is hot. So most fund managers keep their head down, ape the S&P 500, and keep their fingers crossed that they don’t get fired.
Buffett never had this problem because Berkshire Hathaway isn’t a mutual fund or hedge fund. It’s a holding company.
Investors can – and do – fire Buffett all the time by simply selling their shares of Berkshire Hathaway the way they’d sell any other stock. But Mr. Buffett never has to pull out his checkbook to return capital to those leaving the way a mutual fund or hedge fund manager would.
As Buffett wrote in his 2017 annual letter, which was released last week:
Charlie [Munger] and I never will operate Berkshire in a manner that depends on the kindness of strangers – or even that of friends who may be facing liquidity problems of their own… We have intentionally constructed Berkshire in a manner that will allow it to comfortably withstand economic discontinuities, including such extremes as extended market closures.
Buffett has access to permanent capital via Berkshire Hathaway’s massive insurance and other business operations.
You and I don’t have access to that kind of capital. But we do enjoy Buffett’s freedom to maneuver. The capital in your brokerage account, IRA or 401(k) account is yours, and you can afford to be patient with it.
All investors and all strategies – even those that soundly beat the market over time – will also underperform for stretches. But if you know your model works, you can ride out the rough patches without worrying about going out of business.
The millionaire mutual fund manager in a suit might look like he’s sitting pretty, but his position is a precarious one. In Buffett’s words, he depends on the kindness of strangers. That will generally limit his ability to trade the way he wants… and he’ll end up watering down his performance by essentially copying the S&P 500 or some other benchmark index.
You have no such constraints. Use that to your advantage.


The post Why You Can Beat the Pros at their Own Game appeared first on Economy and Markets.
Is the Economy Overheating?
Let’s face it: Interest rates have been artificially depressed for the last decade. Central banks, including our own Federal Reserve, have manipulated rates and stimulated economies to the point that no one seems to know what a normal rate environment should look like.
Recently, though, interest rates have moved sharply higher.
The Fed stopped buying bonds and ended quantitative easing (QE) back in December 2013, but the long-term Treasury yield didn’t bottom until July 2016.
After President Trump was elected in November 2016, Treasury yields jumped above 3% (a 50% move), topping out at 3.19% a couple times before backing off.
You see, rates bounced with Trump’s promise to cut taxes, roll back regulations, and pump more money into infrastructure. For those same reasons, stocks moved to record highs. Rates seemed to be moving out from under the Fed’s boot.
But, after the initial excitement faded, long-term Treasury rates bounced around between 2.66% and 2.93%. One ingredient was missing to help push rates higher.
Overall, the U.S. economy was improving. Unemployment was low, consumer spending was up, housing was healthy, and the manufacturing sector was on the upturn. Even wages started moving higher.
The odd man out was inflation. Consumer inflation was simply not moving higher, which the Fed admitted was pretty confusing.
That all changed with January’s Consumer Price Index (CPI), released a few weeks ago. Prices jumped 0.5%, which was well above expectations of 0.3%. Core prices (excluding food and energy) moved up 0.3%, which, again, was higher than the expected 0.2% rise.
That’s how we found the missing ingredient. The markets reacted by selling off long-term Treasury bonds, thus moving yields higher.
And, to compound the situation, last week the U.S. Treasury auctioned off a quarter of a trillion dollars of Treasury debt. The huge supply of debt hitting the market, along with weak demand, helped move yields even higher.
Yields on short-term Treasury bills hit levels not seen since 2008, and the seven-year Treasury note auction produced a yield of more than 2.83%, the highest since 2011. The yield on the 30-year Treasury bond moved past the resistance level of 3.19% and all the way up to 3.23%. The next area of resistance looks to be around 3.35%.
According to the minutes from the Fed’s most recent policy meeting, the majority of voters saw the need for more hikes because of stronger economic growth and greater inflation risk. They’re a little worried they might be late in lifting rates before inflation rears up and the economy overheats.
But not all of the participants agreed. Some worried that the flattening yield curve could signal recession if it finally inverted. In other words, if short-term yields go higher than long-term yields, we could be in trouble. They agreed to monitor the situation closely.
The bottom line is the Fed will maintain its current trajectory, with the expectation of three more incremental rate hikes this year, but it could add another if inflation heats up.
As I write, long-term Treasury yields are at about 3.16%, having come back a bit from last week’s thrashing.
We’ll get an update from new Fed Chair Jerome Powell when he presents the semiannual Monetary Policy Report and then testifies to Congress later this week.
January data on the Fed’s preferred inflation measure will also be released Thursday morning. The personal consumption expenditures price index, or PCE price index, is highly anticipated by the markets.
If there’s another surprise to the upside, look out! Yields could jump even higher. You can prepare for and profit from surprises in the financial markets, and specifically in the Treasury bond market, with Treasury Profits Accelerator.


The post Is the Economy Overheating? appeared first on Economy and Markets.
February 27, 2018
Corporations Should Spend Their Tax Savings on You
This month, millions of Americans will get more money. They will open their pay stubs and note their paychecks are bigger, even though they technically didn’t get a raise. You might be one of them.
They can thank Uncle Sam, or rather Uncles Mitch McConnell and Paul Ryan, for the extra bucks – courtesy of lower taxes.
But the Average Joe and Jane are a mere sideshow in this circus. The real action takes place under the corporate tent, where the tax rate fell 40%, from 35% to 21%.
When I get an unexpected windfall, I immediately think of the cool things I want to buy. I’ve threatened to purchase an Airstream for years, or maybe a small, single-handed sailboat. But then I slowly come back to reality.
I have responsibilities, and extra cash can help me cover those items faster than I’d anticipated. So, minus a little that I spend for enjoyment, the money typically goes toward retirement or other boring things.
I think most Americans are in the same frame of mind. Extra cash in the paycheck will feel pretty good, and some will spend it on an extra night out or a better vacation, but most will put the funds toward the mundane but important things.
When it comes to corporations, we can only hope they see things the same way.
Companies stand to save roughly $1.5 trillion in taxes over the next 10 years, and many have outlined what they’ll do with some of the cash.
Apple, Walmart, Home Depot, and others plan to pay bonuses ranging from a few bucks to several thousand dollars, based on seniority. Apple also plans to build infrastructure in the U.S., while others like BNY Mellon plan to raise their minimum wage. Boeing plans to increase corporate giving by $100 million, while enhancing corporate training by the same amount.
All of those initiatives seem well and good, but there’s a looming corporate responsibility that, while not very sexy, must be paid: corporate pensions.
As a group, the top 20 U.S. companies with underfunded pensions owe an extra $382 billion just to make their pensions fully funded.
Chip-maker Intel has the worst funding status among the S&P 500 companies at 46.59% as of 2016. This means that the company holds about 46 cents for every dollar of pension liability. In total, the company pension coffers are short by $1.94 billion.
That’s a big number, but Intel can handle it. The company stands to benefit by $1.5 billion per year on tax savings. If Intel pledged to put less than two years’ worth of savings toward its pension plan, the entire unfunded balance would be wiped out.
Delta Airlines is in a similar position. The company has the second-worst pension funding ratio, at 49.38%, although it owes just a touch more than Intel in dollar terms. Delta would need to cough up $10.5 billion to top off its pension fund.
While the airline’s tax savings won’t completely do the trick, if Delta pledged to put its annual $710 million savings against this liability, it would bring the balance down very quickly over the next 10 years. I’m sure that current and future retirees would feel better about that.
Of course, the tax reform won’t help everyone.
At 67%, General Electric doesn’t have the worst underfunded liability ratio of the group, but it does owe the most money.
The company’s pension is short by $31 billion.
Unfortunately, the new tax regime won’t help much. Instead of enjoying a tax savings, the company will owe an additional $9 billion over the next eight years. GE, along with several other major firms, used loopholes and complex tax planning to avoid paying any taxes from 2008 through 2015, even though the company posted regular profits. Part of the plan included putting money and assets overseas, where they had a much lower tax burden. The new tax laws discourage such moves through tax penalties.
It’s hard to feel sorry for GE, given the company legally gamed the system for years. But there is one group that deserves sympathy in all this: taxpayers.
The cash available for bonuses, higher pay, infrastructure spending and even pension funding (if companies choose to do so) comes from U.S. taxpayers in the form of higher U.S. debt in the years ahead.
Rodney Johnson
Follow me on Twitter @RJHSDent

The post Corporations Should Spend Their Tax Savings on You appeared first on Economy and Markets.
February 26, 2018
Where People Go to Die
The Dems shut down government because of the ongoing immigration impasse.
Only for a couple of days, sure.
But it’s THAT big of an issue across the political spectrum right now.
Trump wants a wall.
Trump wants the Dreamers out.
Trump even wants to put an end to legal family immigration practices, where new U.S. citizens get to sponsor green card applications for their family.
Trump’s an idiot. (Hey, you may not like to hear me say that, but we’re all entitled to our opinions.)
He’s oblivious to the negative impacts his isolationist tactics could have on future growth and prosperity in the U.S.
Of course, he’s the President, and he’s fighting a battle he believes his followers want him to fight. The question is, can the U.S. afford to curb immigration? To answer that question, we first have to look at our own population and migration patterns.
Although the U.S. population grew 2.2 million in 2017, or about 0.7% (a number that will decline ahead), the population growth is very different across the 50 states.
Look at this map. It shows the natural population growth by births over deaths per 1,000 residents to see which states are doing the best.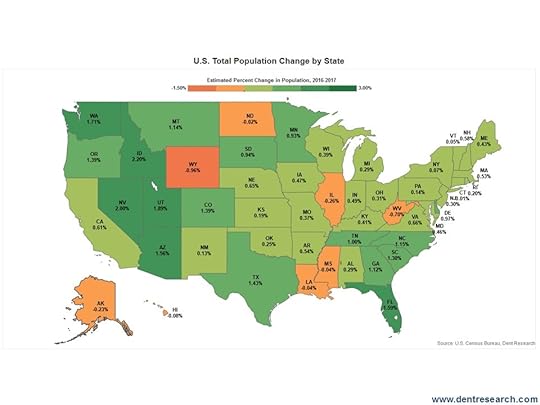
This indicator is the best for showing longer term growth beyond immigration and migration trends, which can change (something I’ll talk about another day).
The shades of green show higher growth while the shades of orange show lower growth or even a decline in a few states.
Guess who comes in first with the highest birth rates?
Utah, with its Mormons! It’s population growth rate is at 11.5%. Utah is the youngest state in the U.S., which bodes well for its future growth demographically.
The large state with the highest long-term growth rates is Texas (7.5%), with its mix of higher births, high immigration, and high migration from other states – it hits on all cylinders!
California is the other large state with high natural growth rates due to foreign immigration.
Then comes Georgia, Washington State, and Virginia.
But Florida is the surprising loser here at a mere 1.1% growth. That’s not surprising. It’s the retirement capital of America and has a lot of older people, despite strong migration and immigration trends.
The northeastern states are losing the most, like Maine (-0.90%), Vermont, Maine, New Hampshire, and Pennsylvania. The worst, of course, is West Virginia (-1.70%).
This table shows the top 10 and bottom 10 stats on natural population growth from births over death rates. 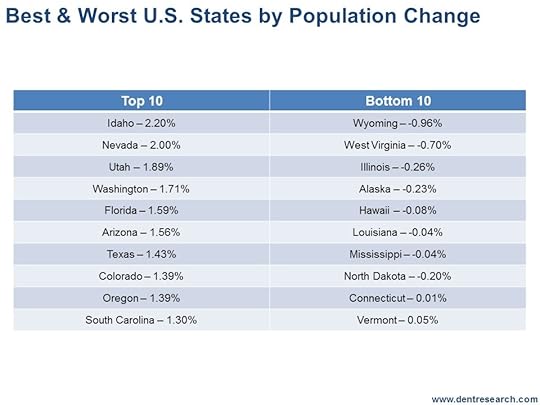
Where do you want to live or do business?
My vote is for Texas, which has four major cities with different lifestyles (my favorite is Austin where our next Irrational Economic Summit will take place in October). It’s has a zero state-income tax to boot!
Harry
Follow Me on Twitter @harrydentjr

The post Where People Go to Die appeared first on Economy and Markets.


