
Harry S. Dent Jr.'s Blog, page 63
February 9, 2018
How Do We Stop the Insanity?
 Nine years of QE…
Near zero interest rates…
When the effects of those started to fizzle out, we got tax cuts…
Now, the new spending bill will add $300 BILLION to the deficit.
This. Is. Insanity!
We’re already running $500 billion deficits each year, and these are good times.
What’s going to happen when times turn bad?
I’ll tell you in my latest Facebook video…

Harry
Follow Me on Twitter @harrydentjr
Chart of the Day
MLPs are a Steal Relative to Bonds

In case you haven’t noticed, it’s gotten ugly out there.
Volatility in the bond market has spilled over into the stock market, and the shares of anything “income oriented” have gotten absolutely slammed.
Real estate investment trusts (REITs) – long popular among income investors for their high yields – are down 7% in 2018, even while the S&P 500 is still up 3%. Mortgage REITs, business development companies, preferred stock, closed-end bond funds… all are sitting on losses year to date.
This is what you might expect in a bond-market correction.
When bond yields rise, bond prices fall… and so do the prices of virtually anything that pays a significant yield.
In the low-interest-rate world we’ve lived in since 2008, investors have been reaching for yield in the pockets of the stock market that most resemble bonds. So, as goes the bond market, so go the high-yield pockets of the stock market.
Harry expects bond yields to go a little higher before reversing again in what he calls the fixed-income trade of the decade. But already, we’re starting to see some pockets of real value.
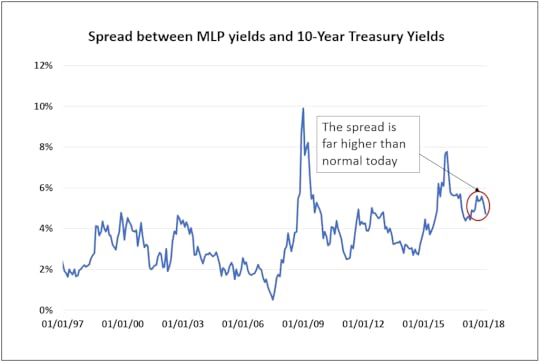
Today, master limited partnerships (MLPs) – which tend to hold oil and gas pipelines with bond-like cash flows – are trading at some of their cheapest prices relative to bonds in history.
Prior to the 2008 meltdown, the MLP sector yielded about 5.5%, which was less than half a percent higher than the 10-year Treasury. That spread briefly shot up to greater than 10% during the meltdown and again briefly shot up to nearly 8% during the 2015 crude-oil rout. But for most of the asset class’s history, MLPs have traded at a spread of 2% to 4% over the 10-Year Treasury.
Well, that spread has now ballooned to over 5% again.
So, come what may in the bond market, MLPs are looking attractive.

Charles Sizemore

The post How Do We Stop the Insanity? appeared first on Economy and Markets.


February 8, 2018
My Legislative Wish List
 My U.S. Congressman, Randy Weber, is on a mission.
He recently introduced legislation that would permanently end tax credits for renewable biofuels made with animal fats. Thank goodness!
When the government introduced such tax credits in 2006, it inadvertently upended a previously harmonious market whereby soap and cleaning supply companies purchased animal fats at what they deemed to be reasonable prices. The tax credits opened a new market for animal fats, which soared in price by more than 100% since 2006. Something had to be done!
But nothing will happen. The bill has a mere 2% chance of passing because it strikes a chord with almost no one.
I’m not a fan of tax credits in general, or any use of the tax code to encourage or discourage behavior.
We already have a system for that, it’s called legislation.
But Rep. Weber’s bill, H.R. 1866: Stop Animal Fat Tax Credits Act of 2017, makes little sense.
There’s almost no reason to go after something that caused a $299 million problem in a $61 billion industry that most Americans don’t care about. Except, of course, that less than 10 miles from me, as a crow flies, are chemical plants, and I’m guessing Weber will beat those constituents over the head with his unpassed bill.
The sad part is that Weber had to know ahead of time it wouldn’t pass, and yet spent his time on it anyway.
There are better things on which a U.S. Congressman should focus. Why not propose legislation on which Americans agree? It’s not that hard to find such items…
Background Checks – 84% of Americans agree that anyone buying a gun, be it from an authorized dealer, at a gun show, or anywhere else, should go through a background check. And 75% of National Rifle Association members agree with such checks. Yet lobbyists have such a stranglehold on Washington, such legislation never makes it to the floor.
Immigration Reform for Minors – This is a hot topic, but the core issue isn’t controversial. 87% of Americans believe illegal immigrants brought to the country as minors should have a path for remaining here. This doesn’t mean people agree on citizenship, or chained migration, it simply means that most Americans think a 4-year-old who grew up in the U.S., brought here illegally by his parents, should get a break.
Medical Marijuana – 86% of Americans support prescribing marijuana for medical purposes. No one has ever overdosed on the drug, and it has widely acclaimed uses for seizures, glaucoma, and muscle pain, although studies are scarce because the U.S. government classifies marijuana as a Schedule 1 drug, just like heroin and LSD, and more restrictive than the classification of opioids that have swept the nation.
Eliminating Mandatory Sentences for Non-Violent Offenses – 77% of Americans want to give judges more leeway when it comes to sentencing non-violent offenders. Mandatory sentences have stuffed our prisons with such inmates, with little sign of reforming them. Instead, we seem to be introducing them to seminars on how to be repeat criminals.
But, no, my representative doesn’t focus on anything where we have broad agreement.
And I think I know why.
Bringing up non-controversial topics doesn’t get you re-elected.
In the days leading up to the government shutdown, as well as during the shutdown itself and the immediate aftermath, I heard politicians and pundits rail continuously about what this means for the 2018 mid-term elections.
Will voters know who to blame? Will they forget who they blamed?
I would think that at some point we have to get on with actually running the country, but recent history has proven me wrong.
Every election is followed by a spate of self-congratulatory speeches by the winning party about their mandate to change the nation, and hand-wringing by the losers who vow to fight to the death. Then they both beat on controversial topics where the nation is split almost evenly, and talk about the next election.
Maybe that’s why there’s one more area on which Americans widely agree that will never make it to the floor of the house or senate – term limits. 74% of Americans want to make sure that no one becomes a career politician, which is clearly at odds with the goal of every politician.
Maybe I can convince my congressman to introduce a new bill fashioned after President Trump’s administrative directive on regulations. The president requires any agency that proposes a new regulation to recommend two regulations that can be eliminated.
For Congress, any bill on a topic with less than 60% approval must include another topic on which more than 75% of us agree.
I have no idea if this would work, but it might move us in the right direction of getting things done.

Rodney Johnson

The post My Legislative Wish List appeared first on Economy and Markets.
February 7, 2018
What the Hell Just Happened?
After what happened the stock and cryptocurrency markets the last few days, it feels like this week should be over.
It’s been a crazy ride!
Talk about whipsaws!
And it’s only Wednesday.
Yesterday, I sent you an email explaining how stocks were at a critical point when markets opened. I followed up with a video note on Facebook.
I also did a telephone interview with Varney & Co, in which I explained that I think this might be the beginning of a much bigger correction (especially because we’ve broken below the resistance level on several of those rising bearish wedges I talked about in the January Leading Edge and this Economy & Markets).
That doesn’t mean I think it’s a straight road to the bottom from here. Listen to what I told Varney. I explain what I think we’ll see next.
I’ve been in close contact with the rest of our team, getting their take of what happened the last few days…
Rodney, editor of Triple Play Strategy and Dent Cornerstone Portfolio, suspects much of the major sell off on Monday was a result of trading algorithms kicking in and stop losses being triggered.
Charles, our Boom & Bust Portfolio Manager and editor of Peak Income and Peak Profits, said this correction has been long overdue. Whatever triggered it, it’s not unexpected. He spent the last few days letting subscribers know to get out of certain plays in the portfolio to avoid or minimize losses. Thanks to his risk management strategies, in his more conservative services, the impact of the correction was limited to lightening the number of stocks in his model portfolios. There have been a few losses, but they’ve been mostly contained to the stop-loss limits in place!
Charles recently wrote about one of the last truly cheap pockets in the market. 2018 is stacking up to be a nasty year for bond investors. The 10-year Treasury yield has jumped from less than 2.5% to just shy of 2.9% in a matter of weeks. It’s bringing us closer to our Trade of the Decade, but if you have any 401K investments, this is likely to impact you to. Read what Charles has to say about this.
And Adam, our Chief Investment Strategist and editor of Cycle 9 Alert and 10X Profits, said that this situation is touch and go. “Most of these dips have historically been worth buying,” he said. “But that says little about THIS particular sell-off. On both Friday and Monday, around 8.5 stocks on the NYSE closed lower for every one higher. That’s an extremely bearish ‘breadth’ ratio, showing the selling is widespread and indiscriminate.”
Adam also wrote a new Economy & Markets article on why this sell-off didn’t come as a surprise. You can find that here.
Harry
Follow Me on Twitter @harrydentjr

The post What the Hell Just Happened? appeared first on Economy and Markets.
February 6, 2018
Two New Leading Indicators
There are two trends that go counter to the go-go forecasts from recent tax cuts in the U.S. – which are obviously positive, at least for the near term.
Stocks have loved this free gift from President Trump, but long-term statistics show that corporations do NOT increase capital investments when taxes fall.
They do so when the economy grows and they need more capacity, which is not the case currently at a low 75% capacity utilization. Or, they reduce such investments during recessions.
Historically, capital investments have trended at around 18% of GDP.
But back to those trends…
The first is that global quantitative easing is “easing.”
It’s been declining since March 2017. On about a 12- to 18-month lag, that would be negative for the U.S. and global economy. Look at this chart…
Note the extreme surge in QE in early 2009 forward and the strong recovery that followed… and the pullback in early 2011 that saw a slowdown in the markets into late 2011.
Also note the slowdown from the Fed in the U.S. in 2014 that saw a slowdown in the economy and stock markets into early 2016 for stocks.
Now that QE is in decline, if this indicator proves accurate, we should start to see a slowdown in the economy sometime in the first half of 2018 or the summer at the latest. Almost no one expects that and a strong expected Q1 GDP forecast will just make the growth story stronger for now.
This could mean a recession, which would mean a market crash… or just back to 2% growth and a substantial correction when 3% to 4% doesn’t materialize, as we’ve been warning it won’t.
The second trend relates to Bitcoin…
For a while now I’ve been warning that Bitcoin could be the pin that could prick this stock bubble, just like internet stocks were the pin in early 2000.
Well, it turns out there’s an approximate nine-week lag between the extreme late-stage Bitcoin bubble and the Dow.
 The recent peak in Bitcoin in mid- December 2017 would suggest a potential top in stocks in mid- to late February or early March, at the latest.
So, we’ll be monitoring these indicators closely and will keep you updated.
In such an artificial bubble, inflated by nothing more than massive QE/money printing and now free-lunch tax cuts, most traditional indicators of a market top aren’t likely to manifest.
These two new indicators could give us the warning we need.
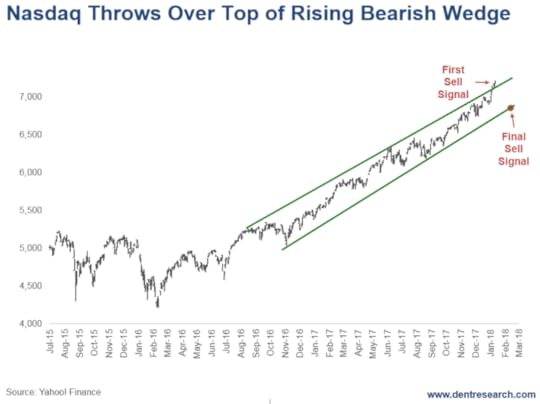
The best confirmation would be a break of the bottom trend-line in the Nasdaq in its bearish wedge that I showed on January 24. That looks to be around 6,500 ahead.
We’ll see over the next month or so, but caution is warranted in this parabolic market.
Harry
P.S. Bitcoin’s bubble is bursting, presenting us with those sale-of-a-lifetime opportunities I talk about so often. My team has found some of those opportunities specifically in the cryptocurrency space. I’ve pulled together the details for you here.

The post Two New Leading Indicators appeared first on Economy and Markets.
How Low Could This Go?
 Just how powerful is recency bias?
Well, the markets finally broke their record streak of days without a 5% or even a 3% pullback. Stocks rallied 40% since the presidential election, and last year the S&P 500 was up every month.
We’ve had a years’ worth of unflinchingly high indexes, which meant we had a year to convince ourselves this was the new normal. And so it’s unsurprising everyone is freaked out with a 3% decline, a fairly common occurrence in normal markets.
It really was easy to get lulled into complacency, and complacency is exactly what we have. Market sentiment indicators are at peak levels, and they have a long way to go to reflect the type of fear that marks market bottoms.
Let’s look at a few of these indictors and see where we’re at today.
First there’s the U.S. Advisors’ Sentiment Report, which has been around for decades. Last week, the level of bulls hit 66%. This represents the 16th consecutive reading where bulls clock in at over 60%, which is considered a danger zone.
That’s a constant level of over-bullishness while the market marched higher.
To put this in perspective, while the level of bulls dropped slightly from a high of 66.7% over the past couple of weeks, that high-water mark represents the highest level since April 1986! Investors are chasing the market higher and plowing their cash into equities as evidenced by record fund flows at the start of 2018.
Bears, on the other hand, are clearly still in hibernation. They sit at only 12.6%, which is also a record since April, 1986. With so many bulls and few bears, everyone is leaning in one direction. It’s the shift back to a more neutral stance that tends to hammer the markets over periods of time.
Next is the Ned Davis Crowd Sentiment Poll. Ned Davis Research is an institutional research firm with clients all over the globe. Its poll is a compilation of sentiment indicators. At 75.6, it’s well into the danger zone. And, while it backed off slightly last week, the prior high had been 75.7. That was 14 years ago!!
Lastly, we have the actions of individual investors.
Collectively, individuals are horrible at allocating capital during market extremes. The recent allocation to equities hit 71.2%. The all-time high is around 77%, right before the dot-com bubble burst and took the stock market with it.
Conversely, individual investors’ cash positions are just 13.3% now. That compares to an all-time low of around 11% in the late 1990s. Thus, for the most part, investors are fully loaded into the stock market and do not have a cash hoard from which to buy more equities if the market decline continues.
Whether this recent scare is “just” a scare or the start of something more, the stock market will eventually experience another bear market.
Given the extreme level of bullishness across advisors and individuals, the declines will probably be greater than normal. Once market sentiment shits too far into the bearish camp as equities get washed out, it could set up the buying opportunity of the decade.
Good investing,

John Del Vecchio
Editor, Hidden Profits

The post How Low Could This Go? appeared first on Economy and Markets.
Or Is It Time to Panic?
 What exactly are investors worried about?
Stocks and Treasury bonds were routed last Friday, with the Dow Jones suffering the biggest one-day drop since the Brexit vote in June of 2016. The long-term Treasury bond suffered its worst drop since the election in November of 2016.
Monday morning, Jay Powell was sworn in as the new Chair of the Federal Reserve. In his statement following the ceremony, he reiterated that “the economy is growing, and inflation is low,” and he and his colleagues at the Fed “will support continued economic growth, a healthy job market, and price stability.”
Powell also assured us that “our financial system is now far stronger and more resilient than it was before the financial crisis that began about a decade ago…”
Remember when, just last June, former Fed Chair Janet Yellen said that another financial crisis like the one that happened in 2008 was not likely in our time? She was referring to Fed actions in regulation and intervention along with current Fed vigilance in preventing a repeat of 2008.
No doubt as comforting to you as it is to me!
Powell’s assessment that the economy is improving is in fact supported by recent data. Take a look:
Employment has been strong, spending and business investment have been solid, and wage growth is starting to tick higher.
Last week’s data supports Powell’s statement. December’s Personal Income and Spending data were strong, and income beat expectations of 0.3% at 0.4%. Spending was expected to grow 0.5% but came in at a healthy 0.4%.
The Fed’s preferred inflation measure, the personal consumption expenditure price index (PCE), came in as expected. The core (ex-food and energy) index fell year over year to 1.5% but is still far below the Fed’s 2% target.
January’s Institute for Supply Management’s (ISM) Manufacturing Index came in better than expected. New orders were the best in 10 years, and backlogs were strong, while input costs are at six-and-a-half-year highs. The overall number was held down by employment, signaling employers can’t find enough workers to keep up with production.
And the January employment situation report was solid, as non-farm payrolls increased by 200,000 and beat the expected rise of 175,000. More important, wages grew 0.3%, as expected, but the year-over-year growth rate surprised the market by jumping to 2.9% versus an expectation of 2.6%.
So, is good news now bad news?
The data is improving, yes, but the stock market has moved way ahead of itself, as Harry has mentioned many times.
Aside from a stock and bond market bubble, gridlock in Washington, and another possible government shutdown, what’s there to worry about?
Apparently, a lot! The stock market tanked another 4%-plus on Monday. Treasury bonds improved a bit, as long-term yields moved above 3.12%. But by the end of the day they were back near 3%, as investors moved out of some of their stocks and into the safety of bonds.
Volatility has spiked over the last couple trading days, as you might have expected. In Friday’s selloff, the CBOE Volatility Index, known as the VIX, closed at 17.1, up about four points from Thursday’s level. On Monday it closed at about 33, up nearly 100%. This morning the VIX is around 50, up another 185%!
Equity markets are again under pressure, so it stands to reason that volatility is elevated. Treasury bonds are also under pressure, and yields are on the rise.
My Treasury Profits Accelerator readers are already positioned for a rise in long-term Treasury rates. Are you?
Good investing,

Lance Gaitan
Editor, Treasury Profits Accelerator

The post Or Is It Time to Panic? appeared first on Economy and Markets.
Stocks at Critical Point: Testing the Bottom of Rising Bearish Wedges
Stock futures projected another big down day today for stocks, as if losing 1,150 yesterday on the Dow wasn’t enough.
This will put us at “a line in the sand” that will show whether this is just a sharp 10% correction or the first wave down of the next major bubble burst, which could see us lose another 40%-plus in the first 2.5 to 3 months – that means by late April!
That makes this an especially important point for protecting your wealth.
In the January Leading Edge and in the January 24 Economy & Markets, I looked at one of the most reliable patterns that indicate the end of major bull markets, especially bubbles. It’s called a rising bearish wedge. Stocks accelerate upward in a narrowing trend with less and less volatility, and then crash when they break through the bottom trendline.
Right now, we’re testing that bottom trend line.
Talking with my friend, Andrew Pancholi, at markettimingreport.com, he had two key turning points for this accelerating pattern to top.
The first was mid-October, which turned out to be an acceleration instead, something that happens about 10% of the time.
His next target was January 18-19 and the 25th. It looks to me like January 26 was “the top.”
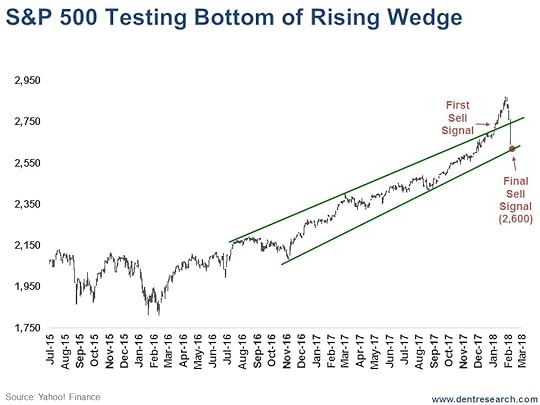
On January 24, I sent you an email looking at the Nasdaq. This morning let’s look at the broader S&P 500. It looks the closest to breaking down from this pattern.
 Futures were very volatile last night and this morning, with the S&P projected to open down anywhere between 39 and 72 points. It’s like a chicken running around with its head cut off.
This chart is as of yesterday’s close. Such an opening will put it right smack on the bottom trend line at 2,600 – down 49 points from yesterday – possibly just below it.
So, this is the do or die point!
For the Dow, that bottom trend line – the breaking point – is 23,600.
For the Nasdaq, it’s 6,850.
Note that all of these charts have had a classic throw-over the top, which is the most aggressive sell signal (as I explained in that January 24 Economy & Markets). The highest probability sell signal comes when it conclusively breaks through the bottom.
All of that said, the odds are the markets will bounce off this support point. If they do, the next question is: will they bounce strongly and potentially go back up to as high as the top trendline, which would be around 2,720 on the S&P 500?
If that happens, that would be the ideal sell signal, especially after such a sharp correction. The odds are now low that we would see a new high anytime time soon (at least not for decades, if that).
There have been 217 5%-plus corrections historically. When losses hit 5%, something starts to happen. Stops start getting triggered. Risk management sets in.
The average stock loss is 12%, the median is 8%. We’re going to be close to that 12% today, and right at that for the Dow.
So, what do you do now?
If you’re following one of our trading masters – Adam, Rodney, Charles, Lance, or John – stick to the system and wait for instructions from them. If you’re going it alone, then, unless we are more than 1% below the bottom trend line numbers above, and or if there is an immediate crash followed by a substantial bounce quickly, then it’s better to hold and wait to see what becomes of the rebound.
Otherwise, it’s better to be safe than sorry in your passively managed accounts.
By the way, Bitcoin has been down as much as 70% from its, pretty much assuring scenario two, which we discussed yesterday. That means Bitcoin is likely to go as low as $800 to $1,000 in the next few to several months.
I will keep you updated.

Harry
Follow Me on Twitter @harrydentjr

The post Stocks at Critical Point: Testing the Bottom of Rising Bearish Wedges appeared first on Economy and Markets.
February 5, 2018
Momentum: Why The Recent Sell Off Didn’t Come as a Surprise
 Two weeks ago, I wrote a note to my Cycle 9 Alert subscribers warning that “short-term momentum [is/was] due for a pause.”
I’d noticed how a popular momentum indicator had red-lined… and stayed there.
You see, the Relative Strength Indicator (RSI) is a tool that traders use when trying to answer the question: Is near-term momentum excessively high (or low)?
This indicator ranges from 0 to 100. Any momentum reading above 70 is considered “excessively high.”
Typically, this momentum indicator will jump briefly above 70… and then fall back into the middle of its range.
But, sometimes, it will stay above 70 for an extended period of time.
That was the case two weeks ago, on January 23rd.
RSI on the S&P 500 had been above 70 ever since the second trading day of the year – for 15 consecutive days.
I ran a quick study on the forward returns of the S&P 500, following historical instances of this scenario. And here’s what I found…
For one, this occurrence is rare – happening just 27 times in nearly 60 years.
Second, these long bouts of excessively high momentum don’t typically kill bull market rallies.
In fact, following this signal, the average two-week return of the S&P 500 tends to be well above average… for at least another year.
The average two-week return after excessively high momentum readings comes in at 0.8%, versus a milder baseline return of just 0.3%.
However, there has typically been a “soft spot” in stock prices in the one to two weeks immediately following this signal. Specifically, the S&P has averaged a loss of 0.1% over this period, with price drops more common than price increases.
So, what does all this mean?
As I explained to my Cycle 9’ers, it simply means that:
Momentum in stocks grew “excessively high” by the end of January.
That’s typically a good thing for stocks (over the following 12 months).
But, prices usually soften for a few weeks first.
So, you should wait patiently before making any new trades. (And it’s a good thing we did as markets hit that soft spot last week.)
As I’ve explained before, just as momentum in market prices waxes and wanes… so too does the number of new buy signals that my Cycle 9 algorithm generates.
For example, the last buy signal we acted on was in late November of last year.
We took advantage of the late-year run-up, taking triple-digit profits on three positions along the way.
We also made two risk management exits early last week, just before stocks sold off sharply.
And now… we’re completely out of the market, simply waiting for the sell-off to resolve and for the next good set of opportunities to rise up.
It’s important to realize that the back and forth nature of momentum in market prices is perfectly normal.
It just means that, in times like these, you should maintain discipline and patience. Wait for the right opportunities. Don’t just jump at any opportunities.
With markets down a few percent in the last two weeks – and markets whipsawing on Monday – I’ll give you the same advice I gave my Cycle 9’ers two weeks ago: For now, sit tight and let the market cool off before making any bold (or fear-motivated) moves.
History shows that January’s excessively high momentum could still lead to a strong year of returns in 2018.
But we’ll have to sit through this sell-off first.

Adam O’Dell
Editor, Cycle 9 Alert
Follow me on Twitter @InvestWithAdam

The post Momentum: Why The Recent Sell Off Didn’t Come as a Surprise appeared first on Economy and Markets.
One of the Last Truly Cheap Pockets of the Market…
2018 is stacking up to be a nasty year for bond investors. The 10-year Treasury yield has jumped from less than 2.5% to just shy of 2.9% in a matter of weeks.
And while that might not sound like a big deal, remember that rising bond yields mean falling bond prices. An investor holding a 10-year Treasury note would have seen the value drop by 3.4% since the start of 2018, which washes out more than a year of bond coupon payments.
Harry has written for months that he expects the 10-year yield to peak at around 3% before rolling over again, and that buying 10- and 30-year Treasurys at these yields represents a safe and profitable “trade of the decade.”
I agree.
But, in the meantime, let’s see what other yields we can find on offer.
 Last week’s hiccup in the stock market didn’t have much of an impact on the S&P 500’s dividend yield. The index has yielded less than 2% for years, and prices haven’t fallen enough to materially change that.
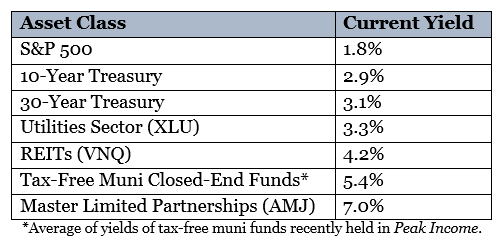
Bonds sport almost respectable yields these days.
The 10- and 30-year Treasurys both now yield around 3%, which is close to five-year highs for both. But, keep in mind, the inflation rate sits near 2%… so “real” yield is hovering around 1%. (We see inflation rates falling over the next few years, but we’ll leave that conversation for another day.)
You’re getting a higher yield these days in the utilities sector, at around 3.3%. But dividend growth has been sluggish for years, and the sector faces an ugly competitive environment going forward as solar and other alternative energies make inroads.
Real estate investment trusts (REITs) are a more attractive option, sporting a current yield of more than 4%. The sector faces long-term challenges from the rise of e-commerce, but it’s also evolving to meet those challenges.
All the same, the spread between REIT yields and bond yields is a little lower than what’d I’d ideally like to see, so I’m not exactly backing up the truck to load up on REITs… at least not yet.
The yield picture gets a lot more interesting when you start looking at municipal closed-end bond funds (CEFs) and master limited partnerships (MLPs). You can put together a diversified basket of muni CEFs yielding over 5% – tax free.
To put that in perspective, if you’re in the 32% tax bracket, a 5.4% tax-free yield is the equivalent of a 7.9% taxable yield. That’s not too shabby.
I’m not allocating to muni CEFs just yet, as my risk management system had me leave the sector during the recent bond-market rout. But you can bet the sector is on my watch list.
I am, however, pushing into MLPs… and their 7% yields.
The MLP sector hit a major rough patch in 2015. The sector had become far too dependent on debt financing, and some of the biggest names in the space were forced to slash their dividends in order to pare back their debt to reasonable levels.
Well, three years later, the sector looks a lot healthier, yet investors are still gun shy about returning to it.
That’s good news for us. Their fear is what makes the 7% yields possible. MLPs are one of the last truly cheap pockets of the market, and we have our pick of the litter.
And in the February issue of Peak Income, I’m recommending one of my very favorite MLPs, one that I believe is priced to massively outperform in 2018 and beyond. Click here to find out more.

Charles Sizemore
Editor, Peak Income

The post One of the Last Truly Cheap Pockets of the Market… appeared first on Economy and Markets.
The Bitcoin Crash Is at a Critical Point: Is This Over?
I sent this update to paid subscribers on Friday. It’s critical, so I’m sharing it here with ALL Economy & Market readers today…
On December 19, I sent an Economy & Markets email about the similarity between the internet bubble and crash and the bitcoin bubble today.
At the time, I saw two possible scenarios. Both are still viable today, but the degree of the 60% crash in Bitcoin tells me that we’re most likely experiencing scenario two, where the cryptocurrency hit its top near $20,000.
That doesn’t take scenario one out of the running. There’s still a remote chance that Bitcoin could surge back and break above $20,000, after which it would be curtains.
Neither scenario is good news for stocks (and next week I’ll reveal the new leading indicator I’ve found that shows an eight-week lag or so between Bitcoin and stock market moves… look out for that in Economy & Markets tomorrow).
For now though, here are some updated charts…
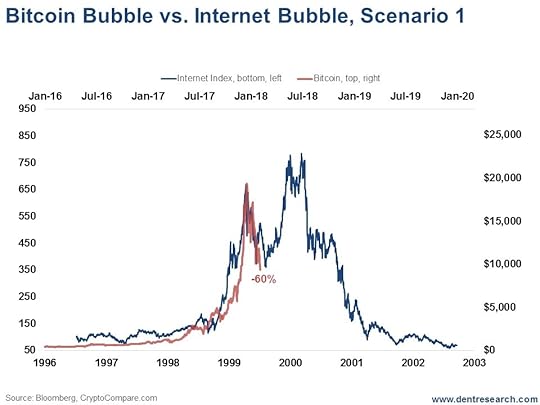 The internet bubble saw a 46% crash in 1999 before rocketing to a new high in early 2000. The Bitcoin bubble has already seen a 60% crash, which makes a new high or scenario one less likely. But it is still possible if we can hold the recent 8,800 lows at 60% down from the top.
That said, this recent crash makes scenario two look more likely, especially if it goes down further.
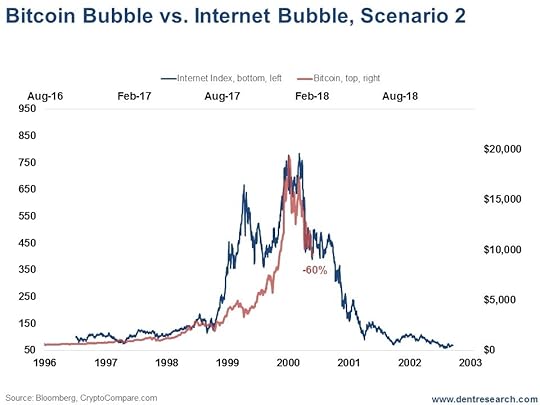 That scenario would see a crash down to as low as $800 to $1,000 on Bitcoin, which would be down more than 95% from the top.
That would be a signal of bubble worry for the stock market, as I will show tomorrow in Economy & Markets.
The coming weeks are critical.
Any new lows in Bitcoin would strengthen the likelihood of scenario two unfolding – that Bitcoin and cryptocurrencies peaked around $20,000 and the stock market will follow on about an eight- to nine-week lag.
Look out for tomorrow’s email on that new leading indicator.

Harry
Follow Me on Twitter @harrydentjr
Publisher’s Note: It’s time for change. We’re shaking things up in Economy & Markets to bring you more of what you want – Harry Dent – in more accessible ways. We’d also like to improve our conversation with you, so please feel free to email us your questions, comments, criticisms, or praise. Send it all to economyandmarkets@dentresearch.com.

The post The Bitcoin Crash Is at a Critical Point: Is This Over? appeared first on Economy and Markets.


