
Harry S. Dent Jr.'s Blog, page 180
September 16, 2014
U.S. Dollar Trash Talk
Given the actions of the Fed and the U.S. government, the U.S. dollar is glorified toilet paper that simply has not made it to the sewer yet… or at least, that’s what I’m commonly told. Other countries are leaving the currency behind, turning their backs on the U.S. and it’s cheatin’ ways (see any article on FATCA).
In fact, the BRICS countries have set up their own organization that mirrors the International Monetary Fund so that they are no longer chained to the U.S. currency and its master. Finally, representatives of China and Russia are busy traveling the globe, making trade agreements in many countries that cut out the need for using U.S. dollars.
All of this means that the days of U.S. dollar supremacy are over. We should start transitioning our wealth to metals and hard assets in preparation for the day of currency judgment.
There’s only one problem. The U.S. dollar is going the other way…
It’s getting stronger. In the last few weeks, the Japanese yen has topped 107, while the euro dropped below $1.30. The Russian ruble is at historic lows against the dollar, while the Chinese renminbi is pegged to the dollar. This doesn’t mean that the actions of the Fed are good for the U.S. or that other countries are suddenly rushing to buy U.S. dollars because they want to patch up their relationships with us.
It simply highlights that the other major currencies have worse problems than we do, which is what we’ve been forecasting for so long.
Over the last five years, we’ve consistently made two forecasts that have caused a lot of anxiety. The U.S. dollar will go up and gold will go down. These are really two sides of the same coin. Our main position is that the dollar will strengthen, not fade away, as so many others claim. The point was never that the U.S. would be so well managed that investors and international parties would flock to our currency, it was always about relativity.
There isn’t one major currency in the world backed by, well… anything. All of them are subject to the whims of the issuing country or economic bloc, or at least to its central bank. So everyday investors, merchants, bankers, and anyone else who deals in currency risk has to evaluate all the moving parts to determine how currency issuers stack up to each other.
What are the prevailing interest rates? What are their growth prospects? Are government policies hindering trade or helping it? Are there any capital restrictions? What will happen to this currency in a time of crisis? How likely am I to get my funds back?
With all of this in mind, it’s not hard to see how the U.S. can, and does, stack up favorably.
While our interest rates are low, they far outstrip what can be had in stable European countries and Japan. In addition, both of these currency issuers have proactively said they intend to weaken their currencies to foment greater trade. How much clearer can a central banker be? “Hold our currency at your own risk, we will devalue it the best we can!”
As for the Chinese renminbi, there aren’t many securities (like government bonds) to be had, so what is an investor to do once he has converted funds? And will the Chinese government continually allow free exchange between its currency and others? Who can be sure?
As I pointed out earlier, Russian rubles are trading near their all-time record lows, so who wants to be holding that currency?
This is one of those times when we’re right, but there’s not much joy in it. We agree with many of the arguments against the U.S. dollar. Eventually it will lose its status as the currency of reserve, and there’s no question in our minds that the Fed and the U.S. government are pursuing policies that hold us back, not lead us forward.
But the outcome of a much weaker U.S. dollar is years away, long after the millennials jump into the driver’s seat of the economy around 2020. During the weak intervening years, those that bet against the U.S. dollar do so at their own peril.
Talk trash about the currency all you want, just make sure it’s stacked up in your bank account.

Rodney
 Follow me on Twitter @RJHSDent


September 15, 2014
Promising Demographic Trends
I’m an entrepreneur at heart, focusing on the demographic trends that impact our economy and markets — not the corporate consultant and manager I was trained to be.
I started my career as a consultant at Bain and Company, helping large Fortune 100 companies reverse market share losses resulting from new technologies and innovations brought on by demographic trends, a key indicator for our economic research.
When I grew tired of the slow pace of change inherent in most large companies, I started consulting with startup ventures in California.
Through this work, I discovered that many new companies were growing exponentially by working with the innovations of the baby boom generation, not just in new computer technologies, but new lifestyle products and services. Young people often drive radical innovations in our economy by questioning the prior generation’s assumptions.
I became fascinated by the baby boom generation. I was transfixed by its massive size and its thirst for innovation. I read all I could on the subject, and found a treasure trove of income and spending data in the U.S. Bureau of Labor Consumer Expenditures Surveys.
My intellectual curiosity led to a discovery of the wonders of demographics — the most predictable and scientific influence in economics — and the best leading indicator ever!
My research in demographics greatly expanded my keen interest in cycles. From my life experience and education, I saw clear evidence of up and down cycles throughout history. I always believed that there must be a way to predict such cycles as they were so consistent and pervasive.
I studied and documented every cycle I could find throughout an exhaustive search of history, which led to an amazing insight in 1988.
On my desk was a long-term chart of births in the U.S., along with the S&P 500 Index adjusted for inflation. I looked at these two charts and saw that they were the same — except for an approximate 45 to 49-year lag. In other words, a large increase in the U.S. birth rate foretold a large increase in the S&P 500 Index about 45 to 49 years later.
To me, this was no random correlation. My demographic research told me otherwise. What I was seeing was the peak in spending of the average family. As we refined our data, this became an approximate 46-year leading indicator for the economy.
I knew I had found something profound. Then, one year later, I found a similar correlation between inflation rates and workforce growth with a 2.5-year lag.
You mean it’s possible to predict inflation rates decades in advance? Yes!
From there, I integrated the S-Curve and the product life cycles for technologies and businesses… and the Dent Method was born.
Through our method, we can tell when the average person will do most things in life, from cradle to grave. Short-term cycles are harder to predict because human nature allows us to get over-optimistic when times are good and too dour when times are bad. Naturally, things only get worse when we factor in the government’s manipulations in its efforts to control a naturally cyclical economy!
At Dent Research, we have continued to refine our analytical method over the years, on both macro and micro levels. Our approach has provided us with unique insights, which often run contrary to popular opinion.
We aren’t afraid to make bold calls. We are here to provide the unvarnished truth with a more realistic view of trends so you can prosper in good times or bad — and over the long haul.
The demographic cycles we study said bad times would continue after the lead indicator peaked in 2007. And we all know that we’re in a particularly rough stretch today. We see lean times stretching into 2020 and possibly into 2022.
But then we’ll hit our stride again and good times will follow. Yes, life goes in cycles!

Harry
Follow me on Twitter @HarryDentjr
September 12, 2014
The 2009 Housing Market Soirée
The goal of then Fed Chair Ben Bernanke was clear: ride the ship of the mortgage market, and therefore the housing market, by vacuuming large chunks of mortgage-backed bonds out of bank portfolios and other institutions while driving down interest rates.
In March of 2009, Bernanke announced the central bank would buy $750 billion of mortgage-backed securities plus $300 billion of U.S. Treasurys.
With the housing market repaired, Americans would once again have the wealth of equity in their homes and the unemployment rate would come back down.
Well, it made a nice story anyway…
According to the New York Federal Reserve report on consumer debt, in the first quarter of 2009 U.S. mortgage debt stood at $9.135 trillion. The Federal Reserve’s plan was to take a full 10% of that out of the market over the course of 15 months. With so much cash flooding into the coffers of banks and other institutions, these entities would be desperate to put the money right back to work, which should’ve driven the demand for more mortgage-backed securities.
At the same time, the purchase of U.S. Treasurys was meant to drive down interest rates, thereby making loans of all stripes, but especially mortgages, cheaper. With cheap borrowed money, consumers would rush out and buy homes and all the stuff to go in them.
It just didn’t turn out that way.
More than five years later we’re financially wiser. We know that borrowers don’t react in the way policymakers want them to (as we’ve said many times, for many years). We know that institutions can sit on cash longer than anyone expects, especially when they’re keeping toxic debt in the closet. And we know that printing trillions of dollars doesn’t always lead to the desired outcome.
While home prices have rebounded some, the market itself is still weak. The number of people purchasing homes remains well off of its highs, with the rate of home ownership falling from a peak of 69.1% to 64.7% in the second quarter of 2014. The rate of home ownership hasn’t been this low in almost 20 years, matching the rate from the second quarter of 1995. And it doesn’t look like things will pick up anytime soon.
Mortgage applications for the purchase of a home are actually falling this year, down 12% from last year. While there’s been a mild rise in the number of homes sold over the past several years, the rate of new homes built and sold remains well off the rates from the late 2000s. This is the crux of the problem. The Fed and so many other policymakers had a goal — creating jobs for middle-class workers through new home construction.
Simply trading existing homes back and forth doesn’t really move the economy forward. We need to see new homes go up so that money is flowing through to carpenters, roofers, plumbers, electricians, etc… This will drive down the unemployment rate and push up the median income of the country. Without new construction, those who used to do such work must find other means of employment.
The chart below shows the number of people employed in residential building from January of 2004 through August 2014, per the Bureau of Labor Statistics.
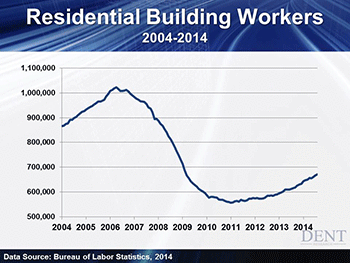
After peaking at just over one million in 2006, the number fell to about 560,000, a drop of 45%. Since then, employment in this sector has slowly climbed back to 670,000, a rebound of 20%, but it remains at over 30% below its previous high.
Keep in mind, this only deals with the first trillion-plus dollars printed by the Fed. QE1 was actually $1.25 trillion, and it was followed by QE2, QELite, and we’re currently winding down QE3. While these programs have indeed kept interest rates of all sorts ridiculously low, they’ve not done much to goose the housing markets. In their efforts to get more people employed, the Fed could have taken a more direct route.
For $1 trillion, they could’ve employed 2 million people at $75,000 per year (well above the median income in the U.S.) for seven years. The money would have gone directly to consumers instead of being parked by banks, and the unemployment rate would have dropped lower. In this regard, the Fed would have gotten a lot more bang for their buck.
Instead, the Fed has continued to follow the same path that’s failed to produce the desired results, which means it has continually failed in its objective of creating maximum employment in the U.S. through monetary policy. More specifically, the Fed has failed to create the kind of jobs it would like to see, which higher-paying, middle-class positions are.
It’s possible the Fed finally realized that simply printing more cash isn’t helping, which is why they’re reducing their bond buying each month. But with only modest gains in high-quality employment over the past few years, it’s hard to see why the Fed would move to raise interest rates anytime soon, particularly if inflation remains tame.
We expect low interest rates — maybe not zero, but exceptionally low — on short-term securities to be part of our economy for years to come.
Rodney
Follow me on Twitter @RJHSDent
More Weddings Means More Spending
The cool thing about people and economics (if there can be anything cool about economics), is the power of averages and human nature. As people age, they move through distinct stages of life. While this progression can be interrupted by circumstances such as war or a huge economic upheaval, people still want to hit the milestones in life.
This makes a lot of things, like the growth and contraction of weddings, very predictable.
During the 2000s, the front end of the next large generation — the millennials — had begun entering the workforce. This stepping stone in life is typically followed by renting apartments and then getting married.
Tying the knot acts is a spending supercharger, because it sets in motion the process of buying a home and having children, both of which are very expensive.
Then we got hit with the financial crisis. While weddings still occurred, hundreds of thousands of people delayed their wedding plans, hoping for better times ahead. Even though six years have gone by, it’s hard to argue that the U.S. economy has enjoyed a sustained recovery, especially for those who are in the younger generations.
Good jobs are difficult to come by and wages have remained flat. But the days and months keep rolling by and to paraphrase an old quote, “time waits for no man.”
Now we have even more young people in the normal age range for marriage as the millennials grow older, plus those who were waiting for better times. There appears to be some pent-up demand for nuptials that is now showing up in the marketplace.
The number of weddings in the U.S. was up 3.7% in 2013… that is 2,156,300 weddings. It’s expected to climb by 4% both this year and next. This is good for our economy both today and in the future.
Whether a marriage is small or a big shindig, there tends to be a boost in spending with the event. It doesn’t matter if the funds used on the wedding are from savings or are borrowed, the dollars still flow into the economy and become someone else’s income.
From a long-term perspective, as mentioned above, marriages are the normal starting point for much greater spending as families grow. The newlyweds become new parents, then new homeowners, and buy all the things that go into supporting those roles.
This trajectory is the underpinning of our work at Dent Research, because we use the number of consumers in each stage of life to estimate demand for the products and services that are common in each stage.
As I’ll explore in the next edition of Boom & Bust, according to our research we are currently in a down period, or economic winter season, but the future looks bright. Starting with weddings, there should be more positive news for the economy in the years ahead.
Of course, the fact that these positive trends begin with weddings isn’t all good news for everyone. Someone has to pay for these things… and it typically falls to parents.
According to the website TheKnot.com, the average cost of a wedding in the U.S. reached $29,858 in 2013. This figure includes all the things associated with the big day, like the rings, venue, catering, and entertainment, but does not include the honeymoon.
That being said, the cost of a wedding varies dramatically by location. In Manhattan the average wedding costs $87,000, while getting hitched in Utah was less than $17,000.
As the parent of two daughters under 20, I’m wondering if it’s too late to move out west.
Rodney
September 10, 2014
Housing Market: Kids Sold Separately
This is what’s not happening in the housing market: young people buying homes — even though there are falling mortgage costs and rising rents.
According to a recent Zillow press release, buying is more affordable than ever in 94 of the 100 largest markets. But renting is now more expensive than ever in 88 of those markets.
Those rising rents make it harder for young families to save for a down payment on a home. Add in high student loan debts for many of them and less certain job prospects for younger people, who are experiencing much higher unemployment rates than the older baby boom generation, and the problem becomes very real.
I haven’t even mentioned the fact that inflation adjusted incomes have been falling since 2000.
This chart shows clear trends in opposite directions. Rents have been rising as a percentage of incomes while mortgage costs have been falling.
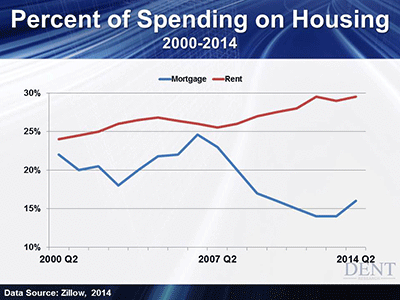
Rents in the pre-bubble years of 1985 — 1999 averaged 24.9% of the renter’s income. That average has now risen to 29.5%.
It makes sense to think that rents would fall after home prices fell, but they didn’t due to rising demand vs. supply. This is why so many individuals and investment funds have been scooping up small homes and renting them out.
The big question here is how long can this go on without creating an oversupply of rental homes? It clearly doesn’t appear that this has occurred yet or rents would be falling. If we’re right about a deeper recession and depression just around the corner, it will lead to downward pressure on both rents and home prices.
The cost of mortgages as a percent of income has fallen from pre-bubble levels of 22.1% to just 15.3%. This is obviously due to the falling mortgage rates, but that’s an artificial and free gift from the Fed.
During the housing bubble’s 6-year run (2000 to 2005), mortgage costs rose from 18% to 25%. That’s why bubbles aren’t sustainable.
If you are wondering how renting could be so much more expensive than mortgage costs, part of the reason is that the average income of renters is much lower: $31,888 vs. $65,514 for homeowners. Rent reduces their already meager income by a higher percentage.
Ordinarily this would have caused a massive increase on home buying. In Chapter 3 of The Demographic Cliff, I explain why the housing market will never be the same in this post-bubble era. We’re approaching the point when there will be more sellers from the aging of the massive baby boom generation than younger buyers from the millennial generation that peak between age 37 and 41.
The numbers are similar to workforce growth where I subtract retirees from new tenants. For housing, I subtract the sellers at age 79 from the peak buyers at age 41 and then I can calculate “net” demand for housing for decades into the future.
Net demand has been falling since 2000, despite a slight bounce up in 2014. That small spike was almost in line with the slight rebound home prices had in 2012.
Once we slide into 2015, it will fall again and hit negative net demand from 2029 to 2039. Once there are literally more sellers than buyers, we won’t need any new homes built!
Housing should slow from 2015 forward — and economists are more confident than ever that we are in a sustainable recovery. The most affluent households also peak this year and will go off the “demographic cliff” like the average household did after 2007.
The truth is that the Fed is tapering at precisely the wrong time and I wrote about it this past July in “Their Economy Will Collapse, Including Ours.”
Once I describe a fall in real estate worse than the one that happened during the years of 1925-1933, I find it quite easy to talk younger households out of buying a home. But it is still proving difficult for me to talk older households out of buying a house.
Principle #5 of bubbles (page 146, The Demographic Cliff) states: “Bubbles tend to go back to where they started or a bit lower.”
Real estate prices will fall at least 40% from where they are now.
Don’t even think about buying a home (or worse an office) until at least early 2017. Let the coming stock crash and depression see its first and likely worst phase.
We’ll advise you further at that point.
Harry
September 9, 2014
U.S. Economy: The Broken Brady Bunch
In the United States, the Department of Agriculture estimates that in our current state of economy, it’ll cost $245,000 to raise a child born this year. For those parents out there wondering what you get for a quarter of a million bucks, keep in mind that this doesn’t include college. That’s extra.
While the number might be mind-boggling, the idea that children are expensive isn’t new, at least not in the Western world. We’ve long since succumbed to the reality that our kids are giant suction machines, intent on removing every last nickel we have in our pockets. The interesting part is, most of the time, we are willing participants.
We sign them up for soccer, SAT tutoring, drama classes, and send them off to adventure/science camps every summer. We make sure that they stay involved with travel sports when their regular sport season is over. Add to this the latest set of gadgets and gizmos, and you have a great recipe for overspending on junior. And that’s once the kid reaches school age.
When a two-income family takes the step into parenthood, they get a terrible reality check…
They find out that one of the biggest costs associated with kids is daycare. The going rate is roughly $200/week, or $10,400 per year.
Americans look at these figures and shake their heads, knowing that many young people simply can’t afford to have more children, not if they want to keep them at a high standard of living.
It appears that a fair number of Asian countries have come to the same conclusion.
According to the CIA Factbook, the estimate of the fertility rate of women in the U.S. this year is 2.01, which means women of child-bearing age are expected to have 2.01 children, on average. This is slightly below the rate of 2.10 that is needed to replace our population (one for each parent, plus a little for mortality and those that don’t have kids).
This might sound low, but we’re ahead of just about every other developed nation on the planet, and light years ahead of some major Asian nations. The same source shows that the five countries with the lowest fertility rates are South Korea (1.25), Hong Kong (1.17), Taiwan (1.11), Macau (0.93), and Singapore (0.80). This is very interesting because the list doesn’t include the poster child of declining populations, Japan (1.42) or the best-known forced family planning country, China (1.55).
The bottom five countries have all experienced incredible growth over the last 50 years and the standard of living in each nation has risen dramatically. Along with it, the pressures of raising children to exacting standards so that they can attend the best schools and have all that life has to offer has increased as well. So parents self-regulate, choosing to have fewer children so that they can focus their spending on one child, or maybe two.
This works for a little while. The standard of living increases because there are more productive workers and fewer mouths to feed. But eventually the tables turn. There are more retirees than new workers, reflecting the falling number of children entering the workforce. At this point, governments are like deer in headlights, not sure which way to go.
How do you fill in the gaps of missing populations? No one knows. This is exactly the situation faced by each of the five bottom countries, which have been running state-sponsored dating services, offering tax incentives and any other program they think will lead to matrimony and parenthood.
This is also what led China to ease its one-child policy last fall, hoping to create a wave of births this year. So far, the program has fallen flat. Of the 11 million families eligible to file for permission to have a second child, less than 3% have done so. This probably has something to do with the fact that raising a child is estimated to cost over 40% of the average income in China.
Not having kids in a small country like South Korea can be a problem. A lack of kids in a medium-sized nation like Japan is cause for concern. The small number of births in China might be devastating.
The normal structure of a society is to have a larger number of children in successive generations or, at worst, to have roughly the same number of kids in the next generation. This way, there will be enough workers and consumers not only to help the country grow, but also to care for the aging members of the population.
Over the last 25 years, the world has watched Japan and witnessed what occurs when there are fewer children. The economy stagnates. Consumers hold tightly to their assets. Property prices fall. Aging citizens begin to determine the direction of the country and there are few opportunities for the young.
In a nation like Japan, which had achieved a high level of wealth before it began to age, many of the ill effects are being mitigated by government spending. What happens when a country the size of China, which has grown dramatically in the last 20 years but is still not rich, starts to grey? Who’ll care for the elderly? Who’ll buy the internal assets of the country to keep their domestic economy not just afloat, but growing?
Having children is certainly expensive, but not having them can be the death of a nation. These trends take years to develop, and can’t be undone quickly. When choosing areas for your investment dollars, consider how a country might grow — or contract — demographically. This could enable you to avoid the next Japan.
Rodney
Follow me on Twitter @RJHSDent
September 8, 2014
An Economy Chained by the ECB
The financial economy and markets of euro-zone countries had been walking around in a daze and then, this past week, it was slapped back into reality by European Central Bank (ECB) President Mario Draghi.
The Italian announced that in addition to a widely anticipated program of bond buying, the ECB would lower interest rates.
What made this such a stunner was that in July, the ECB had already pushed a key interest rate on excess reserves to negative 0.10%, meaning that banks holding more than their required reserves at the ECB would be charged 0.10% for the privilege.
The goal was to motivate banks to withdraw the excess money and lend it to businesses and consumers, thereby sparking economic activity.
Just as we forecast, it didn’t work.
It was unprecedented when the ECB pushed the interest on excess reserves below zero, so it was even more surprising when they skewed it even further below zero…
It was as if the ECB President was telling the world: “We don’t know what to do next, so we’re going to try more of what hasn’t worked.”
We almost agree. It’s not that the very smart people at the ECB and the central banks of euro-zone countries don’t know what to do; they just don’t want to do it.
At this point, there’s no way to avoid the elephant in the room. European countries are hobbled by excess debt that was piled on during the booming 2000s, and then made worse by government borrowing in the years that followed.
Since the financial crisis, we have pointed out that European countries won’t experience meaningful recoveries until they deal with their excess debt, both public and private.
Even when Draghi made his famous statement in 2012 that the ECB would do “whatever it takes” to preserve the euro, we noted that short of printing new euros to buy up bad debt, there wasn’t much the central bank could do. We consistently argued that the ECB would eventually move to cheapen the euro in response to poor economic data, but we were far outnumbered by euro-optimists who saw nothing but good times ahead.
In the months and years that followed, the euro soared, reaching almost $1.40, as the world took Draghi’s comments to mean that the ECB would basically save every country in the bloc… no matter how screwed up they were. We remained skeptics of the euro-zone recovery, and of the euro itself, even as the currency moved higher.
While European stock markets soared along with the euro, the economic releases kept reiterating our point. Growth wasn’t returning to the region as a whole, and the inflation target of 2% remained elusive.
In fact, several countries were falling back into recession, and the economic bloc was moving closer to outright deflation. The euro-optimists kept hoping, and investing, for the best, but now the problems have simply become too big to ignore, and sentiment has turned.
In addition to forcing dollars out of the central bank, the ECB is desperately trying to torpedo the euro in hopes that a cheaper exchange rate will boost European exports so that their economies can grow their way out of their debt morass. The question is: “Export to where?”
Will China, the land of a bursting property bubble, buy enough from Europe to save the economic bloc? Will Russia, the seeming invaders of Ukraine, suddenly have a desire for more Western goods? Will the U.S., with its own mediocre job growth and stumbling economy, want more things from across the pond?
None of it seems very likely, particularly when every other major country is hoping to pursue the exact same strategy.
It might have taken years for many people to wake up to the reality of the situation in the euro zone, but at least it has finally come to pass. Maybe now the central bank leaders from the member countries, as well as the ECB, can develop a plan for identifying and clearing out the overhang of debt that’s weighing so heavily on their economies.
It won’t be easy to do. Losses will be incurred, and unfortunately it’s most likely the responsible taxpayers across the region that will take the hit. But until this problem is tackled, the euro zone will remain stuck in neutral at best, and could even slide into reverse.
Rodney
Follow me on Twitter @RJHSDent
September 5, 2014
Innovation Plus Curves Equals Magic
One of the best-selling books that talks about innovation, “that magic moment,” has been Malcolm Gladwell’s The Tipping Point. I applaud this book for its breakthrough insights and simplicity, and especially for how it addressed a simple insight I’ve had since the early 1980s…
An insight I’ve discussed in many of my books, including Our Power to Predict (1989), The Great Boom Ahead (1993), The Roaring 2000s (1998), The Great Depression Ahead (2008), The Great Crash Ahead (2011), and The Demographic Cliff (2014).
I’m talking about the S-Curve. It represents how real people react to, and ultimately adopt, new technological, social, cultural and political innovations.
Basically, it all starts with “outliers”…
The “outliers,” as Gladwell calls them, represent the very few people who focus on a new body of research or knowledge.
By “few” I mean the 0.01% to 1%. This minority masters their area of expertise over 10,000 hours of concentrated immersion and only then do they come up with breakthrough new insights.
My research shows that this is why that 1% of the population tends to dominate 30% to 50% of the wealth over time. They are the real entrepreneurs and innovators. And they are the ones who start new trends and S-Curves.
Once the innovators have sparked the S-Curve into life by introducing their breakthroughs, the product or technology begins to filter into niche markets where the top 10% are more open to change and quicker to react.
From there, the ones that prove worthy go viral, flooding the market until 90% of the population has adopted the innovation.
An interesting — and important — point to note is that, typically, saturation is reached in about the same amount of time as it took to reach the 10% tipping point.
It looks like this…
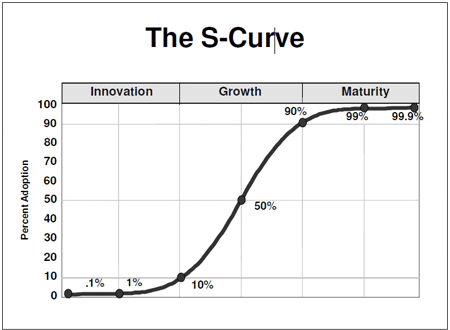
Put a different way, you get nine times the adoption in the same time it took to innovate.
This is an important fact because it means such trends are predictable and that it is critical to see this massive break-out after the tipping point is reached.
Cars, electricity, radios, TVs, mobile phones, the Internet, digital cameras… all are examples of innovations that predictably followed the S-Curve.
Smart phones and high-definition TVs are well past their 50% point and nearing saturation fast.
Global Positioning Systems only recently blew past the tipping point…
All of these technologies and innovations offer investors opportunities to make windfall gains as they go viral or as they continue their exponential march toward saturation.
Yet most businesses and investors miss such trends… and thus the opportunities. They assume that mass adoption is linear, not exponential… that it will take decades for a new innovation or technology to infiltrate the main stream.
Even companies as big as Firestone Tire miss it…
Back in 1979, when I still worked at Bain and Company as a consultant, radial tires had blown through an S-curve thanks to Michelin’s innovations in France. And U.S. companies just didn’t see it. It took seven years for radial tires to penetrate niche markets in the U.S. Once they did, it took just seven more years to hit the 90% saturation point.
If I hadn’t recognized the power of the S-Curve and had been consulting for another company, Firestone would have missed that boat.
It had projected that it would take seven years for radial tires to grab 20% of the market after taking 10% in the previous seven years – a linear projection. That’s 70% less than what actually happened.
That’s 70% market share Firestone would have missed out on because it didn’t see the predictable trend unfolding.
Luckily, we at Bain convinced the company to quickly close bias tire plants and to convert to radials. That conversion may be the only reason Firestone still exists today at all.
So do yourself, your investment portfolio and your business a favor. Don’t make the same mistake.
See your life, technologies and your company’s products and services as progressive and predictable: S-Curve cycles with exponential potential once they move past 10% penetration!
After all, everything in life is exponential, whether it’s moving up or down. Linear growth is an illusion we humans naturally favor, but it kills many businesses, investments and life strategies.
Don’t let that happen to you.

Harry
Follow me on Twitter @HarryDentjr
September 4, 2014
Dear Gold, Nobody Wants You
From 2004 through 2011, gold buyers had a lot to talk about. Their favorite investment shot up by more than 350%, providing fabulous gains while the world suffered from the financial crisis.
Gold did take a hit during the depths of the downturn, but it rebounded smartly when the Federal Reserve began its first quantitative easing program.
As gold markets were bullish, long-time precious metal buyers stopped shouting about their world view of worthless paper money and runaway inflation, and started welcoming new investors to their ranks.
However, since 2011, gold has dropped by about one-third, and looks like it needs a Life Alert button. The precious metal has fallen and it can’t get up.
Given the recent buying patterns of the two biggest markets — India and China — it is most likely that the price of gold will remain on the floor, and could even fall into the basement.
In the second quarter of 2014, gold purchases for jewelry fell 30%, while coins and bars dropped 56%. China and India combined made up half of the drop in coins and bars. In fact, both of these markets are on track to rein in their gold buying this year, but since then by about 1,000 tonnes apiece over 2013.
While some analysts point to lower gold prices as a reason for increased demand, Indian and Chinese buyers look at it from their own points of view.
In India, the election of Narendra Modi as the new Prime Minister led to renewed hope for reviving the stagnant economy. He not only took the top spot, but also put together a majority in parliament.
The combination of control allows Modi to institute economic changes that were not possible under the previous administration, since it faced an impasse between the Prime Minister and parliament.
After suffering with stagflation — low growth coupled with above-average inflation — for years, the people of India finally have a reason to believe in better economic times ahead, with stronger growth and a stronger currency.
Although this is good news for India, it puts a damper on the gold market because Indians have less incentive to hold the metal as a hedge against inflation.
While India looks forward to a better economic tomorrow, Chinese gold buyers are wishing for yesterday.
The solid historical gains in gold that drew in many investors are farther back in the rearview mirror, while the current price action has been on a less-volatile, downward trajectory. Sitting on an investment that doesn’t move much — and when it does, it tends to fall — is not the Chinese method of making money.
Unlike their Indian counterparts, the Chinese don’t have to worry very much about their currency compared to the U.S. dollar. The renminbi is pegged to the U.S. dollar and allowed to change only slightly over time. The Chinese government tightly controls the value and direction of changes in its currency value, which almost guarantees no sudden changes.
If gold is not protecting the Chinese against inflation and its price in U.S. dollars is treading water, there’s not much reason to hang on to it.
With China and India stepping away from the gold market, there is little pressure on the demand side of the equation. Central banks, particularly in Russia and a couple of its former Soviet satellite countries have increased their gold purchases this year, driving a 28% increase in that category over the same period in 2013.
That sounds good, but central banks don’t buy a lot of gold. They only account for about 100 tonnes so far this year, even with the big jump in purchases.
With many developed nations now struggling to stay out of deflation instead of fighting inflation, and the two biggest markets for gold slowing their demand, the price of gold is more likely to sink in the months and years ahead.
No doubt this will lead many of the same people who screamed loudly about fiat currencies and economic upheavals to bring the bullhorns back out, eager to tout their favorite, but falling, investment.
Rodney
Follow me on Twitter @RJHSDent
September 3, 2014
The Global Economy is Watching ISIS
The biggest news topic in our global economy now centers on the growing threat from ISIS. They are well-funded, well-organized and brutal. Their on-the-ground army in Iraq and Syria and their extremely violent actions have the world on edge.
After the beheading of two U.S. journalists, Obama has said that the objective is clear: “That is to degrade and destroy ISIS.”
The world’s Geopolitical cycle is heating up. And it doesn’t bode well.
Currently, the stock market is largely ignoring these risks… and I believe it’s just a matter of time before they get a very rude awakening. There are much worse demographic trends ahead and higher debt than what was experienced during the global financial crisis of 2008.
I added the Geopolitical cycle to my hierarchy of key cycles in early 2006 when the roaring 2000’s bull market did not end up being as bubbly as the 1995 to 2000 tech bubble. Every 18 years or so, stocks and the general economic environment wax and wane, they go bullish and bearish and shift from favorable to unfavorable.
The last cycle with a favorable geopolitical environment with no major wars or inflation shocks was from 1983 to 2000.
Then the world changed on September 11, 2001…
How Wars Affect Our Economy and MarketsSoon after 9/11, we began our ill-conceived retaliation with the Iraq war. Then we entered another, more justified war when it was discovered that Afghanistan was harboring al-Qaeda. But both wars cost us a lot and accomplished little. When we had to pull out, the terror and fringe groups just moved right back in and took over.
Obama recently said at a fundraiser that the world is safer than it was 20 years ago… it sure doesn’t look that way to me.
All we have to do is look at the unrest in so many places. The Arab Spring moved from Libya to Tunisia to Egypt. The Syrian civil war is still raging. The Gaza Strip was pounded during the 50-day war between Israel and Hamas. And let’s not forget North Korea doing one stupid thing after the other, especially with the holding of three U.S. citizens on ridiculous charges.
More recently, we have the invasion of Crimea and Ukraine by Russia.
It’s hard not to see ISIS as the greatest potential threat in the Middle East right now. And its sights blatantly target those of us in the west. Our cities have become potential targets for terrorist attacks considering the concerted recruitment efforts by ISIS in both the U.K. and the U.S.
Minneapolis is now a hot spot for ISIS recruitment of American converts. They hone in on disenfranchised young men and women who are confused and lost between their Muslim and western identities.
Not only is the Middle East boiling over, but Putin is actively thumbing his nose at the entire world. He shows clear intentions of bringing Ukraine and other regions back into a new militaristic Soviet state. And we can’t forget that Russia is still the second-greatest nuclear force after the U.S.
Any alliance that forms to battle ISIS will not only be made up of the U.K. and other western allies but by many Arab states as well. Saudi Arabia, Iran, Egypt and Turkey… they all see ISIS as a major threat. Could we possibly see long-standing warring nations band together against a common enemy?
Time will tell…
All of these events feature prominently in this powerful Geopolitical cycle that is playing out and it will continue to point down into late 2019 or early 2020. These Russian threats, civil wars and Islamic/West conflicts are only going to continue and get worse over the next five years or so before this cycle finally turns positive again around 2020 moving into 2036 to 2037.
When you have a mound of sand and you begin dropping grains on it one by one, you can really never tell which one will cause an avalanche, but it will occur. And when the odds increase, the steeper the mound becomes.
This stock bubble is getting very steep and the possibility of an avalanche is growing.
For those investors with passive 401(k)s, IRAs or retirement brokerage accounts, look into selling stocks on every rally in the weeks and months ahead. It’s better to be a bit early rather than a bit late in getting out.
The first major drop when this bubble finally bursts is likely to be quick and violent. And you don’t want to get buried.
Harry
Follow me on Twitter @HarryDentjr


