
Harry S. Dent Jr.'s Blog, page 172
December 12, 2014
Hackers Hamper Market Strategy

On December 1, FireEye, a cyber-security firm, released a report detailing a year-long coordinated cyber-attack on over 100 health care and biotech firms. These hackers targeted executives who had key clinical trial and regulatory data sitting in their email inboxes.
As you well know, this type of information is essentially gold in the biotech sector, because stocks expand and contract wildly overnight once it’s released. Getting this information before it goes public gives an enormous edge to whoever has it, especially if they’re well-versed on how to make low-key trades with it.
The hacker group was dubbed “Fin4”, because it’s one of a handful of hacker groups that seek only one thing — major financial gain. That is why they target these companies and then head for Wall Street to make their money. Based upon the FireEye report, these hackers appeared to be either from North America or Western Europe and are presumed to have had extensive backgrounds in investment banking due to the lingo they used in communicating with each other during their attacks.
Fin4 practiced excellent “tradecraft” in their attacks, not leaving behind any form of traceable “malware” on the victim’s computers. If the word tradecraft seems familiar, you’re probably a reader of John le Carré or Tom Clancy novels. It refers specifically to the activity of intelligence.
The Simple HookBack to the hackers… their plan was quite simple and actually commonplace. They simply sent out “phishing” emails that were disguised as regular emails with attachments or links that captured the victim’s email logon credentials as soon as their victims clicked on the link or the attachment. All emails appeared to come directly from known customers or associates of each of the companies, making them extra hard to detect.
After gaining logon access to each executive’s email system, Fin4 simply read the emails, collected data and made low-key trades with it. FireEye would not release the names of the companies that were infiltrated but did mention that the group contained companies that were publicly traded on NYSE and Nasdaq.
Simply put, Fin4’s activity boils down to them utilizing information that was not widely known and then quickly make trading decisions to their advantage. Their methods for obtaining this information were highly illegal, but what if I told you there was a legal way to get similar information?
The key to beating the market is obtaining information that is “not widely known” to inform trading decisions and then place winning bets with it. As long as data is pulled from publicly available sources on the Internet, it’s fair game and legal to trade on.
The trick is that you need to take a “systems” approach and roll up millions of blogs, tweets, and chat messages on a daily basis in order to see the high level trends that no one else is seeing because they’re too focused on reading the messages directly at the lower level.
I currently track these trends utilizing my Social Media Collective Intelligence system (SMCI) and provide alerts in my Biotech Intel Trader service. If you’re interested in learning more about obtaining information that not everyone has access to then read up on my trading service here.
As always, I will continue to monitor the market’s social media collective intelligence and keep you updated on the latest trends.

Ben


Economic Kung Fu

In the animated film Kung Fu Panda, a villainous snow leopard named Tai Lung desperately wants to obtain the secret Dragon Scroll that is said to hold the secret to limitless power. The scroll is protected by a group of kung fu masters who are joined by a hapless panda bear named Po.
At the end of the movie (spoiler alert!), Po has mastered kung fu and successfully fends off Tai Lung… sort of. Before getting trounced and sat upon by a fat panda, Tai Lung gets a peak at the contents of the Dragon Scroll and finds nothing but a reflective surface.
Po, who has already looked at the scroll, points out that the secret of limitless power is what lies inside of us.
The theory of Keynesian economics, which for six long years has stolen money from savers, pushed investors to take on ever more risk, and worked desperately to tilt the economy in favor of borrowers, is based on the same premise.
In the early 1930s, the world was in the grips of the Great Depression.
Up until that time most governments had taken a hands-off approach to business, allowing the overall business cycle of growth-boom-bust-recovery to play out on its own schedule.
But the depths of the depression caused leaders to rethink this policy. They went searching for tools that would allow them to tame the business cycle, erasing or at least greatly reducing the effects of its downside.
Enter Keynesian EconomicsThey found their answer in the British economist John Maynard Keynes.
The typical business cycle involves rising demand, which calls for businesses to produce more goods and services. As businesses increase their output, they hire more people and/or increase wages, as well as buy more inputs from other businesses (raw materials, components, etc.).
These moves give workers and other companies even more capital with which to buy stuff, leading to even higher demand. The virtuous circle of growth is born!
Unfortunately, all of this money sloshing around encourages consumers and businesses to take on excessive risk. Counting on ever-rising incomes, consumers take on debt to buy more things.
Businesses, counting on more orders, use credit to expand their operations. Bankers are part of the cycle; they seek to lend out as much as they can.
At first the rising use of credit serves as a supercharger to the business cycle, which simply reinforces the aggressive behavior of consumers and business owners. But as demand for credit increases, money becomes more expensive in the form of higher interest rates.
Eventually the marginal borrowers, both consumers and businesses, fail under the weight of their debt payments. Their income and orders don’t grow sufficiently to cover their mounting debt payments.
The demand for goods and services slows down a bit. As lenders incur losses, they tighten their lending standards and lend less in order to rebuild their reserves. The decrease in available credit slows demand even further, leading to more losses, which aggravates the losses at banks.
So non-payment on debts leads to shrinking credit, which leads to falling demand, causing businesses to fire workers and order less, which causes even more bad debts. This is the vicious cycle.
The old way of dealing with this was to allow the liquidation of over-borrowing and over-spending. Assets would be sold to pay debts. The excessive risk-taking on the part of consumers, businesses, and banks would be “cured” through the pain of retrenchment.
During the 1930s, the magnitude of the economic downturn caused people to demand action from their politicians. Surely there must be something they could do to alleviate the suffering of everyday people. Enter John Maynard Keynes.
In the example above, the vicious cycle plays out as long as there are bad debts to be settled and a general sense of apprehension about the future. To Keynes, this is where governments can be of help.
Instead of allowing the sell-off to continue until an economy reached some base level, which could put millions out of work and idle assets for years, the government could borrow money and spend it on… well, on anything — as long as it employed people and ordered goods and services from business.
In this way, the government would supplant the private sector in demanding goods and services and eventually jump-start the virtuous cycle.
Nice TheoryThe problem is that the business cycle is based on the psychology of consumers and business owners. On the way up, they take on more risk through purchasing and the use of debt, while on the way down; they trim their buying and shed debt as best they can.
Nothing in the Keynes model addresses this psychological state.
In fact, the model itself states that governments should continue with the deficit spending meant to bolster aggregate demand until the “animal spirits” of consumers and entrepreneurs have returned.
In the world of economics, The Economist magazine tells us that: “Animal spirits are the colorful name that Keynes gave to one of the essential ingredients of economic prosperity: confidence.
According to Keynes, animal spirits are a particular sort of confidence — “naive optimism”. He meant this in the sense that, for entrepreneurs in particular, “the thought of ultimate loss which often overtakes pioneers, as experience undoubtedly tells us and them, is put aside as a healthy man puts aside the expectation of death.”
Where these animal spirits come from is something of a mystery. Certainly, attempts by politicians and others to talk up confidence by making optimistic noises about economic prospects have rarely done much good.”
This is the basic building block of the economic theory behind the printing of more than four trillion dollars, and the reason that it doesn’t do much to rebuild our economy. At the end of the day, we’re told to look into the Dragon Scroll and realize that the power to reinvigorate the economy lies within us.
If only we would throw caution to the wind and once again take on debt with abandon, buy stuff we don’t need, and live like there’s no tomorrow… then all would be right with the world.
At this point you might wonder how such an approach could work. Wouldn’t bankers, business owners, and consumers recognize that government borrowing is fueling the demand, and as citizens they are responsible for that debt?
Wouldn’t people know that as soon as the government withdrew from the markets that they would simply be back where they were before, albeit having traveled through a government redistribution program that taxes everyone in order to funnel income to a few?
Maybe.
But if you’re asking these questions, then clearly you’ve not stared into the Dragon Scroll of economics long enough, since you have not regained that economic confidence known as animal spirits.
Excuse me as I go back to staring at the scroll.

Rodney
Ahead of the Curve with Ben Benoy Hackers Attacking Biotech CompaniesDecember 11, 2014
Biotech Grows Fight on Cancer

One of my favorite technologists of all times is Elon Musk. His bio is impressive to say the least. He was one of the co-founders of PayPal. He then leveraged its buyout from Ebay for $1.5 billion and started Tesla Motors and SpaceX. These came to be the first highly successful electric car and private spacecraft and rocket companies.
In my book, Elon Musk’s tenacious goal of using technology to improve humanity marks him as a very intriguing person. His mindset is simply admirable.
Back in 2002, everyone thought he was crazy when he dumped his entire net worth into creating an electric car company and a rocket ship company. All other previous attempts by private commercial entities had failed in these fields; but Elon had something to prove…
On a 60 Minutes interview from this past March, Scott Pelley asked him: “How did you figure you were going to start a car company and be successful at it?”
Elon’s response: “Well, I didn’t really think Tesla would be successful. I thought we would most likely fail. But I thought that we at least could address the false perception that people have that an electric car had to be ugly and slow and boring like a golf cart.”
Pelley: “But you say you didn’t expect the company to be successful? Then why try?”
Musk: “If something’s important enough you should try… even if the probable outcome is failure.”
Since I had recorded the episode, I found myself replaying that last piece over and over again.
I tried to put everything into perspective and ask myself if I knew of any other people who would take their billion dollar fortune and fully invest it in two highly complex industries, where the failures far outweighed any success stories, if only to prove a point to humanity.
For months, I thought Musk was the only true technologist humanitarian, until I recently stumbled across Patrick Soon-Shiong, another billionaire, who is doing for the biotech sector what Elon Musk did for electric cars and commercial rockets.
Like Musk, Patrick Soon-Shiong was born in South Africa. He is a surgeon, medical researcher and a businessman. He is ranked by Forbes as the wealthiest American in the health-care industry with a net worth of $13.3 billion.
Patrick obtained much of his wealth by developing cancer-fighting drugs and blood thinners, with the top products being Abraxane and Heparin. He sold the companies he founded producing each drug for $4.6 billion (Heparin) and $4.5 billion (Abraxane) in 2008 and 2010, respectively.
Not wanting to rest on his laurels, Patrick felt he still had something to prove, so in 2011 he started a company called NantWorks.
Computers Fighting CancerNantWorks is the true culmination of Patrick’s life work in the cancer-fighting field.
The company leverages advanced semi-conductor technology, supercomputing, advanced networks and augmented intelligence to diagnose and begin treatment for cancer patients over a span of hours, not months.
In 2005, Patrick formed NantWorks after realizing that during the approval process for Abraxane, doctors were making bad decisions in diagnosing cancer patients, which ultimately affected treatment options. The main issue was that the doctors weren’t able to keep up with the speed at which each patient’s cancer changed and mutated.
Patrick then bought up various technology companies in order to address each portion of the diagnosis and treatment cycle for cancer patients and roll them under one umbrella company, NantWorks.
The central idea is that as soon as a cancer patient arrives at the hospital for diagnosis, everything from their DNA to the proteins in their blood will be instantly analyzed via a proprietary and incredibly fast computing device. The data is collected in real time — no pens, papers or clipboards.
Within minutes, computers recommend which drugs to try based upon augmented intelligence from medical journals and other medical data. Once the patient is sent home, the same technology travels with them, allowing doctors to continue to monitor them in real time, as hospital administrators evaluate the efficacy and costs of various procedures and medicines and compare notes with hospitals across the country.
Tracking the TechnologyThis quote is like a motto for me: “Technology doesn’t solve problems, people solve problems. Technology automates solutions.”
It’s up to us to analyze a problem, create the solution and then execute it using the best technology available. So, by taking the work of thousands of cancer-fighting doctors and building a system that allows them to collaborate, diagnose and treat patients with supercomputers, Patrick Soon-Shiong is truly super-charging the fight against cancer.
If Elon Musk were in biotech, he would be Patrick Soon-Shiong.
Although no release date has yet been given, Patrick states that one of his companies under the NantHealth umbrella is currently slated for an initial public offering in 2015.
I’m currently tracking the social media chatter for this IPO and other related companies that are ripe for acquisition by NantWorks and will keep you updated as I see opportunities develop in my trading service Biotech Intel Trader.
Stay tuned as I continue to monitor social media opportunities across the markets!
Ben
P.S.
For more information on the companies I’ve been monitoring in the biotech industry, take a few moments to read more on my trading service, Biotech Intel Trader here.
December 10, 2014
Market Strategy’s Fork in the Road

Knowing when to buy, hold or sell is the tricky part of investments. I’m an awful debater.
Not because I don’t like a good back-and-forth battle of wits. I do.
But I’m naturally inclined to see the value in others’ viewpoints, when merited of course, even when they’re diametrically opposed to mine.
This means I have trouble defending a my-way-or-the-highway type of argument. And, instead of debating with others, I usually just hold debates in my own head… until the weight of evidence begins to favor one side or the other.
My wife, at times, thinks I’m “disturbed” because of this. But I think this trait helps me stay open-minded and flexible when it comes to market analysis and investing.
Currently, I’m of two minds about the market’s next move. I could make, in my head, a compelling case for both higher and lower prices over the next couple of months.
And while this lack of clear conviction may seem bothersome, it’s not… because I’ve figured out how to build well-balanced and smartly-hedged portfolios that can weather times of uncertainty. And, I’ve also learned that when the market’s future path is highly unclear, it’s usually best to just sit on your hands… watch it all unfold… and only act when a clearer picture of the market’s trend is revealed.
And that’s essentially where we are today.
Be PatientThis is historically a strong time of the year for stocks and bullish momentum is on the side of higher prices. That said, prices are fairly stretched in the short-term and a number of warning signs are still keeping me cautious.
Here are two charts that I shared with Cycle 9 Alert subscribers this week. They paint somewhat contradictory pictures…although with time, a clearer image should emerge.
First, I won’t be surprised to see continued weakness in stocks in the short-term. That’s because the S&P 500 has yet to retest the psychologically-important 2,000 level. Take a look…
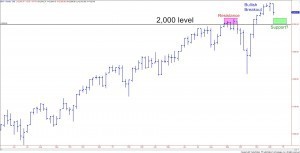
There’s a saying that goes: “Resistance, once broken, becomes support.”
The 2,000 level resisted bullish price advances in September, but then the level was ultimately broken (i.e. a bullish breakout) by the end of October. Now, I’m expecting prices to drift lower as the bears will likely make at least one concerted effort to push prices back below 2,000.
Whether the 2,000 level holds as support or not will be an important tell of the bulls’ resolve.
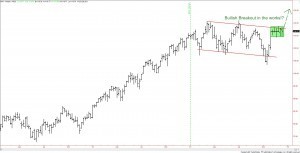
Meanwhile, I’m also watching small-cap stocks like a hawk. The small-cap focused Russell 2000 index (IWM) has lagged the market all year, as investors have shown a preference for large-cap issues instead. And this is a sentiment indicator, suggesting investors are only mildly bullish and a bit afraid to take on the added risk of small-cap stocks.
Simply put: for the broad bull market rally to continue much into next year, I think we’ll need to see a bullish recovery from small-cap stocks.
As this chart of the Russell 2000 (IWM) shows, a bullish breakout may be in the works.
With mixed signals all around, it’s best to stay put and avoid the temptation to make hasty decisions.
I think a clearer picture will emerge in the coming weeks — particularly once the S&P 500 has tested the 2,000 level… and once small-cap stocks show us whether bullish investors have a renewed appetite for risk or not.
Stay tuned… and if you’re interested in learning which positions Cycle 9 Alert subscribers are in, click here.

Adam
Commodities Slump, Is Fracking the Culprit?
 What is fracking? Fracking is the process of injecting liquid at high pressure into subterranean rocks, fissures, etc., in order to force them open and allow more oil and gas to flow out of the formation, allowing it to be extracted at greater volumes.
Are you aware that fracking stocks are down 40% in just over 5 months? If that doesn’t sound like a bubble about to burst, I don’t know what does.
On Monday, December 8, I wrote an article detailing the downside of falling oil and commodity prices for our economy despite obvious benefits to consumers and businesses.
Why?
Because it’ll burst the great fracking bubble and because falling commodity prices just add to the deflationary environment against which central banks are fighting so hard in the first winter season we’ve seen since the Great Depression.
I just read an article by David Stockman that talked about how the Fed has created yet another bubble, and this time it’s the fracking bubble.
Fracking is very interesting technology, but it’s not as new as everyone would lead you to believe. The process has been around since 1949 when the first natural gas fracking field was created in Hugoton, Kansas.
Today, 65% of oil rigs are horizontal (rather than the traditional vertical style) and almost all of them need some degree of fracking stimulation to work.
Fracking began taking off back in 2005 and the debt to finance it began its acceleration in 2009… and what is driving this “boy wonder” industry that seemingly came out of nowhere, began leading us toward energy independence and has now inflated into a bubble about to burst?
It’s simple: cheap money.
Money FloodFree or very cheap money will always cause excess and mal-advised investments… like the overbuilding and speculation in housing from 2000 to 2005, the student loan bubble since 2009 and the current ever-growing subprime auto loan bubble.
This is what happens when you flood free money into the economy. Consider now how Freddie Mac and Fannie Mae are back issuing 3% down mortgages guaranteed by the government and tax payers, of course. Where could that possibly be headed?
Let’s look at the subprime mortgage bubble that peaked in 2005 to 2006. The chart below shows the parallels between that bubble and the high-yield debt bubble that seems to have been peaking on a similar trajectory in 2013 to 2014.
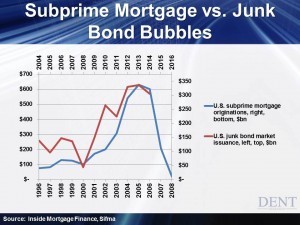
The subprime mortgage originations were between $100 billion and $280 billion from 1996 into 2000. Then from 2000 to 2005 subprime accelerated from $100 billion to $620 billion… that’s an increase of 6.2 times in just 5 years. Similarly, high-yield corporate debt issuances accelerated from $40 billion in 2008 to $340 billion in 2013, growing 8.5 times.
The subprime bubble was a bit larger, but there are other bubbles such as the student loan one which is at $1 trillion. We also have the rising subprime auto loans that make the overall picture even worse this time around.
Like all bubbles, there’s a point where they tend to accelerate for about 5 years before they burst. That’s where we are in the fracking bubble today.
Corporations have been borrowing at very low interest rates with the primary objective being buying back their own stock and artificially inflating their earnings per share. That’s not a productive use of money. In fact, that is a sign that we are in a speculative phase with declining money velocity.
What happened to borrowing to expand your capacity and hire more workers? Instead, we find ourselves in a casino economy where speculation is the primary avenue for investment, driven by near-zero interest rates.
When More Is LessMost don’t realize that these frackers and energy companies are a fast-growing part of the high-yield debt bubble, and now it seems likely that they will be the ones to cause it to burst, just like the mortgage security bubble did.
In 2005, energy companies were 4.4% of high-yield (junk) bonds. Now they’re 15.4% by one estimate, and I’ve seen estimates that claim 18% or even 20%.
Since 2012, fracking companies have seen an average $120 billion a year in total expenditures (including capital expenditures) vs. their operating profits. They’re simply funding that with cheap junk bond debt. It takes a lot of money to fund a rig and then it only has an average production life of just two years.
You can now see how incredibly cheap and easy it is to raise money in this industry — these factors accelerate the making and growth of a bubble… far faster than would otherwise be warranted. That has mal-investment written all over it.
The only fracking ETF started up in early 2012. Its price went from $19.50 in June of 2012 to $35 in late June of 2014 before plummeting 40% to $21 — wiping out nearly all those gains of 79.5% in just two years.
Sound like a bubble?
Continental Resources, the now infamous company in North Dakota owned by Harold Hamm, is down 60%. It had $140 million in debt in 2005, which has skyrocketed to $6 trillion today — an increase of 43 times in 9 years!
This industry has grown primarily from fracking in two states. Since 2005, production in Texas has doubled and North Dakota has tripled. Pumping out close to 2 million extra barrels a day, these fracking companies have become contributing factors in creating the excess capacity problem that’s causing oil prices to tank 40% since August. What that shows us is… bubbles always burst of their own excesses.
This industry alone has $200 billion in high-yield debt and $300 billion in leveraged loans — $500 billion in total. That may not sound exceedingly large when compared to the $40 trillion in total private debt in the U.S., but the reality is that all it takes is a trigger to expose a larger debt bubble.
Think back to the subprime crisis in 2008.
The fracking crisis is already here and it will begin ramping up even more when oil prices drop again. That may be a few months out as oil prices look to be bottoming here between $60 and $63… but it could happen at any time.
I’ve been predicting for years that oil prices will hit $10 to $20 by 2020 to 2023. I think $32 is likely within the next two years, as I commented in my article of December 8.
This is one of many triggers that could potentially burst this unprecedented debt and financial asset bubble… but it may be the most explosive!

Harry
Ahead of the Curve with Adam O’Dell The Fork In the Road
December 9, 2014
Education Overload
When students don’t organize their college years very well, who ends up footing the bill?
My son, a college junior, recently registered for the spring semester. As he described his upcoming classes to me, I had one question. When will you graduate? His answer of, “In 2016, I think,” was uninspiring.
He arrived at college with 26 credits earned through Advanced Placement classes in high school. The idea that he might not get the other 94 credits of required courses to graduate in four years, even though he has been taking 12 to 15 hours per semester, put me on edge. But it’s not entirely his fault.
The university has no vested interest in him graduating on time since it earns hefty fees and tuition as long as he is on campus. Besides, he’s an out-of-state student, so he pays more than locals.
If he’s paying more and staying longer, what’s not to love?
According to a study released by the non-profit Complete College America (CCA), 19% of students at non-flagship public universities complete a bachelor’s degree in four years, whereas at flagship public universities the percentage is still an appalling 36%. CCA sites a number of reasons why this might be so, including too many choices presented to students and the lack of transferability of credits when students switch universities.
These sound like valid points, but from personal experience, I know of another reason — the schools don’t set out programs and paths that ensure students are tracking for a four-year stay.
Bank of Mom & DadI called my son back a few days after we discussed his spring schedule. I told him that his mother and I would feel much better if he met with an advisor and then presented us with a detailed plan of the courses he would take over the next year and a half that would lead to graduation.
He met with an advisor and called back with a plan. While this is fabulous, the question remains of why this exact tracking was not shown to him when he started his college career, or at any point along the way.
I can hear the school’s response in my head. This information was always available, all he had to do was ask. I get that, but I also understand that kids go from the regiment of high school, where everything including lunch is pre-planned, to the freedom of college. Along the way they lose one of the most important assets they have — parents.
Using the Family Educational Rights and Privacy Act as their tool, universities have almost completely shut parents out of the educational process, leaving these newly-freed young adults to make planning decisions that have serious consequences.
I say “almost completely shut parents out” because of course, parents are allowed in one area of student life… paying the bills.
However, if you want to see courses, grades, etc., then the student must share this information because it typically is not available directly from the university. This is ground I’ve covered before, but it is part of the problem that leads to extending the college stay.
Who’s Watching Out for the Student?Arguably parents are a child’s best advocate, and certainly are the best advocates of their money that is sent along to pay for their kid’s education. By diminishing the connection between the college and parents, universities have removed one of the guiding forces in a young adult’s life that is part of what got them to college in the first place.
CCA has partnered with state governors and institutions in an effort to increase the percentage of students that finish their degrees in the traditional time frame. Some schools have taken on the challenge and have improved their on-time graduation rate substantially.
Unfortunately, out of more than 580 public institutions in the U.S., only 50 of them, or less than 10%, have on-time graduation rates at or above 50% for their full-time students.
Staying on campus a little longer is expensive. The CCA estimates an extra year will cost the average student at a four-year university $22,826 in expenses plus $45,327 in lost wages for a total cost of $68,153.
But the analysis should not end there.
How much of the cost is paid by parents who could’ve used those funds for retirement planning? Given that we’re discussing public universities, how much in-state funding is used for students extending their stays?
How much productivity is lost in the economy due to workers delaying their entry into the labor force? And finally, how many slots are not open to incoming freshmen because universities have so many holdovers still working to complete their degrees?
Look at in this way, getting young adults through college in a timely manner is an issue that should concern everyone, not just current parents.

Rodney
December 8, 2014
Market Focus Fixed on Commodity Cycle
Investors are growing increasingly distracted with year-end loose ends and the holiday season — so last week was a bit lackluster.
The U.S. economy still looks to be the world’s bright spot. Friday’s strong jobs report rekindled hope for better-than-stall-speed U.S. growth. Meanwhile, Japan’s economy is still contracting sharply, China is slowing and the euro zone looks set to plunge into recession if the European Central Bank doesn’t act soon.
The crashing oil market continues to dominate headlines, and everyone is still trying to figure out whether the rout is short- or long-term, and what its impact will be on the world’s oil-dependent economies.
Obviously, net exporters who derive a large share of their GDP from oil — like Russia — will suffer greatly. Meanwhile, net-import countries will enjoy the price break to varying degrees. And although the U.S. is a net importer, most calculations show only a minor increase in U.S. GDP attributable to decreased global energy prices — particularly now that U.S. oil production has grown so dramatically in the last decade.
Now, let’s take a closer look at these trends as we go around the market in 10 seconds…
• Global stock markets were mixed last week. Chinese stocks (FXI) rose a sharp 3.4%, while emerging-market shares (EEM) dropped 1.5%. U.S. stocks were mildly higher but, interestingly, led by a 0.9% gain in small-cap stocks (IWM).
The outperformance of small-cap stocks is noteworthy, because they have materially lagged all year. It’s too early to make judgments, but I’m watching closely the small-to-large cap ratio (IWM: DIA) and will be on guard for a bullish turnaround.
• Bond markets fell across the board last week as the strong jobs report painted a robust outlook for U.S. economic growth, causing interest rates to climb higher. We’ve probably seen a near-term low in interest rates after the 10-year has now bounced higher off of 2.2% on two occasions.
• Commodity markets were mostly down. Energy markets suffered through continued negative pressure last week and have yet to find any meaningful support (read: buyers). Any contrarian who tried to buy oil’s perceived steep discount in recent weeks is only sitting on steep losses. Positive seasonality for oil typically doesn’t show up until January, so it’s still best to side-step any oil exposure as this shakeout continues.
Looking Ahead…Spiraling oil prices will continue to draw the market’s focus this week. And while the slide can certainly be viewed as a warning sign of weak global demand, the strong jobs report last week suggests U.S. growth, at least, is robust enough to avoid recession for the next several quarters.
If you’d like to get more in-depth information about what I’ve been recommending to my Cycle 9 Alert subscribers, click here.
Adam
Commodity Breakdown
Three trends have come together and are igniting a deflationary environment. Central banks are fighting them with a fire hose of quantitative easing (inflation).
The first trend and, it’s slow at this point, is deleveraging the greatest debt bubble in history. The second is aging populations in the developed world and the third is falling commodity prices.
If governments and central banks are intent on fighting deflation, as they clearly are, they can’t be happy about commodity prices, especially oil, continuing to fall.
I’ve been arguing for years now that falling commodity prices is one of the least recognized indicators of the next global crash and financial crisis. The falling prices trigger a vicious cycle of slowing exports for emerging countries.
Look at China’s export bubble… falling commodity prices slow its emerging country markets, but China is the biggest importer of commodities to feed its manufacturing export machine (now the largest in the world). Then that in turn slows commodity prices further.
And there’s the perfect picture of the vicious cycle…
Emerging markets (EEM) are 29% below their late 2007/mid-2008 highs and commodity prices (CRB) are 47% below their mid-2008 highs. The first commodity crash hit sharply in 2008. The next one looks like it’s emerging progressively into 2015 to 2016.
The last global financial crisis was triggered by the subprime debt crisis in the U.S. and the next one we face could well be triggered by continuing falls in commodity prices and in the emerging markets that correlate most with such prices.
Commodity BreakdownI have been commenting on how the CRB commodity index – including oil, gold and copper – have been trading in a sideways pattern for the past three years and that at some point they would break down.
The break down just happened. Oil broke below support at $75 to $80, copper broke below $2.90 to $3, gold broke below $1,180 and the CRB broke below $270.
But just when you would normally think they would break down sharply out of such long trading ranges, these commodities are now holding and look like they may have bottomed for now. Gold got extremely oversold, the most in years, and now looks likely to rally back towards $1,300 to $1,380 in the months ahead.
This is what these now trader-dominated bubble markets are doing. Traders take things up higher than anyone would think and then take them below support to scare every one out, then they buy and drive prices up again.
They’re intent on screwing everyone. The central banks are enabling them with zero interest rates which in turn allows them to leverage at unprecedented rates and producing a much high impact on the markets.
This makes these the trickiest markets I’ve ever seen to call short-term.
Oil’s LandscapeOil’s plunge has been the most dramatic, as it was back in the crash of 2008 — $147 to $32 in just over four months. I’ve never seen a market fall that much… that fast.
It was caused by the high leverage of such increasingly dominant traders and hedge funds. And it was steep because they had to sell due to massive margin calls.
Oil has traded between $114 and $75 and finally broke down more sharply than other commodities, hitting $64 on December 1. It’s traded between $63 and $68 since then.
Oil is extremely oversold right now and has minor support from the early 2010 low around $64. After that there’s no obvious support on this chart. The next support is at $32, the late 2008 low… definitely not a pretty picture.
Saudi Arabia thinks oil will settle down around $60. Maybe near term, but that’s not what this chart is suggesting just down the road.
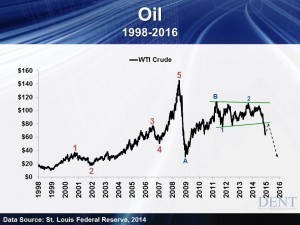
The most likely scenario would be a rally back to $75 to $80, then another crash sometime in 2015 down to as low as $32. I see oil ultimately bottoming around $10 to $20 in the years ahead.
But that could only happen if global growth slows much more and especially in emerging countries. A new China momentum indicator suggests China will slow to 4% to 5% over the next year, lower than its 6% low in 2009.
This can’t be good for the global economy and would strongly suggest another crash in stock prices as well.
Our view is that falling oil and commodity prices are a sign of the slowdown and deflation crisis ahead — not a good sign this time around.
In a deflationary environment, falling commodity and oil prices is not a good thing even though there are obvious benefits to consumers in the U.S., developed countries and China. Likewise, rising oil and commodity prices aren’t good in an inflationary environment (think about the one in the 1970s) even though such prices do benefit emerging countries and commodity exporters.
And what does this do to the fracking industry in the U.S.?
That outcome won’t be good at all, especially as some producers will go under at current prices and many more below $58 a barrel. Energy companies are responsible for 20% of the junk bond debt in the U.S.
That’s the whole purpose of Saudi Arabia not cutting production with the increasing excess oil capacity. It wants to kill off its fracking and less-efficient oil-producing rivals.
If oil does rally in the coming weeks or months and then turns around and starts to collapse again and breaks back below $63 — it’ll be downhill from there.
We should be watching out for a potential global stock crash.
Harry
Ahead of the Curve with Adam O’DellMarket Focus Fixed on CommoditiesDecember 5, 2014
Market Strategy and Biotech Hype
I’m sure you know by now… I LOVE investment systems.
The benefits of a well-defined, data-driven, and rules-based investment strategy are many:
• It removes the emotional component of your decision-making process (and at the same time, capitalizes on the inefficiencies created by other investors’ emotional decisions).
• Its effectiveness can be tested and validated on historical data.
• It allows for a depth and breadth of data processing that would otherwise be impossible, if a human analyst were to do it on a “manual” or “discretionary” basis.
Systems Are ValuableAnd now, I’m happy to say, I’m not the only member of the Dent Research team that sees the value of a systematic approach to investing.
I met Ben Benoy two months ago at our 2nd Annual Irrational Economic Summit. I immediately sensed the overlap in our views of the global financial system…
During one of my talks, I shared with attendees my view of complexity and simplicity, as they relate to the world of investing. The take-home message was this:
Financial markets are complex. Yet, counter to the intuition of many, the most successful investment strategies are very simple.
The complex nature – or at least, the perception of complexity – comes from the plethora of interconnections between markets and market-driving variables… and the unimaginably large number of data points which are nearly impossible to tease apart.
Yet, the simple nature of the best investment strategies comes from their ability to hone in on one specific (and exploitable) phenomenon – one which is ubiquitously present across markets, market participants and throughout time.
What can loosely be called “hype” is one such phenomenon.
Investors are emotional beings. And with that comes all the trappings of wishful thinking and great expectations. Basically, we’re hard-wired to buy into the hype… the hope for pots of gold waiting to be discovered just around the corner.
Reality, of course, tends to unfold a bit differently than our rosiest expectations. Often, it’s the seemingly “sure bet” that goes bust… and the “long shot” that quietly comes to fruition.
And while many market trends are rather steady and predictable (i.e. Coca-Cola’s revenue growth), others are volatile and wildly unpredictable.
The biotechnology sector is the poster child for unpredictability (and massive volatility). Yet, it’s also well known that just one nice payout on a well-played biotech investment can multiply your wealth many times over.
Suckers Are All Around UsNaturally, the lure of 10-bagger returns is what brings many novice investors to the biotech space. And it’s the wildly unpredictable nature of biotech stocks that leaves most of those investors burned.
I knew one such hype-buying sucker.
Years ago, while I was trading foreign currencies for a prop firm, I sat nearby a stock trader that focused exclusively on drug-maker and biotech stocks. His system, if you could even call it that was a desktop calendar chock full of sticky notes keeping track of various drug trial phases and FDA decision dates.
He did his best to find, read and process every bit of information that could possibly be found on whatever biotech stock he was targeting at the time. As he got deeper into stories of the company’s “massive potential” you could literally see the excitement oozing from his pores.
And after enough water cooler chats, you learned he was always just about to hit the “big one!”
But to my knowledge… he never did.
It seemed instead that, for as much information as he collected about his target investments, there was always a bit of information that he missed. Someone always knew a bit more than he did.
And, consequently, he routinely got suckered into overly hyped plays that never quite materialized as he expected.
Don’t get me wrong… he did catch a few winners. But the losses he suffered on the sucker bets seemed to swamp what he brought home on the winners.
Long story short… my buddy didn’t have the sophisticated analytical tools he needed to survive in the information-rich biotech sector.
His sticky-note system was the epitome of bringing a knife to a gun fight.
Today, if he’s still trading, I bet my friend would upgrade his system to something like Ben Benoy’s.
Collective intelligence is the name of the game in biotech investing. While it’s impossible for one analyst, or investor, to know all the opportunities and pitfalls inherent in betting big on the next potential biotech blockbuster, social media puts the collective wisdom (or, if you’re a contrarian, the “unwisdom”) of the masses at your fingertips.
Or course, the work is data-intensive and requires a robust computer program to handle the task of teasing apart thousands of social media-derived opinions. So it’s not a project for the typical home-grown investor who, I suspect, will continue to plod through online communication forums in a bumbling and unscientific fashion.
But that just creates more opportunity for YOU.
So, here’s what I say… instead of buying into the hype of the typical biotech “promise of riches” story… take the time to learn more about Ben’s system and how it might just give you the edge you’re looking for.

Adam
December 4, 2014
Market Research Helps Play the Game
What kind of signs do you look for when investing in the stock market? It can be a game and let me show you how you can perfect it.
One of my favorite movies of all time is Moneyball. It’s the true-life story of the Oakland A’s general manager — Billy Beane — finding wild success by adopting an unconventional “data-driven” method for evaluating and picking baseball players.
Spoiler alert: simple math was utilized to develop key metrics to build an Oakland A’s team that made it to the playoff’s at 80% less player salary than the New York Yankees… who, by the way, won the same number of games as the A’s.
What made the movie so powerful for me was that Billy Beane challenged the conventional institution of baseball, which embraced completely different “traditional” methods and came out on top by simply trusting his data.
Sound familiar? Today, we’re afforded countless traditional metrics from storied financial institutions that would have us believe the only place to find the real valuation of a company’s stock is to sift through data buried in quarterly earnings reports. Or maybe you enjoy technical analysis of charts to gain your edge in the market?
It doesn’t matter what your current techniques are for finding success in the market but I’m here to tell you that it can be turbo-charged by introducing a third indicator… Social Media Collective Intelligence.
What Are People Talking About?Now I’m not saying that you should just follow a couple of analysts on social media but I am saying that you should leverage a system that generates collective intelligence on the entire market by rolling up millions of financial social media messages per day.
When millions of messages are processed each day, my social media collective intelligence system is able to determine inefficiencies in the market that no one else is tracking because they’re so focused on mainstream traditional indicators. And if they are tracking them, they’re not handling the sheer volume that we monitor.
Little indicators such as changes in the average number of messages written on a stock can have a huge impact on forward price movement. As I’ve pointed out before, every day we track the “chatter volume” on more than 7,000 U.S. traded stocks to see if people are creating a ground swell of momentum for a stock before mainstream news outlets pick up the coverage.
That’s a lot of stocks to follow and an enormous amount of chatter to monitor — but it ensures you get the whole picture, not just a thumbnail.
We also track sizeable changes in message sentiment (buy/hold/sell) for a stock and perform backtesting to see if these shifts in the past have caused forward price movement. The bottom line is that we focus on social media metrics that have historically forecasted price movements and have built an automated system to alert us when these shifts occur.
Also, isn’t it nice to know when someone is traditionally right or wrong and if they are on a hot streak of picking winners?
Our system contains a message author “reputation engine”, ranking the top authors who consistently pick winners through their social media messages based on stock price movement after the messages are published.
Ever wonder what makes a stock’s price change dramatically when there’s no mainstream news or company earnings released? Oftentimes, the answer is found in social media… and the social media collective intelligence system is capturing and alerting us to it.
See The Entire FieldAs a U.S. Marine, I was taught to fight my best with the weapons that were afforded to me, which means we had to do more with less. Using social media indicators gives you a way to fight back “asymmetrically” against the big guys who have millions invested in infrastructure to game your every move.
The best part is that we’ve determined that the largest price movements that occur from these social media indicators usually occur over a 60-day period, so you don’t have to be glued to your trading system screen in fear that you’ll miss an opportunity or get caught up in the daily chaos of the market.
Biotech and SCMI’s TeamworkBiotech stocks offer rapid price movements surrounding the release of information on the performance of drug trials. Often times, we can pick up disparate pieces of information ahead of time in social media that allows us to jump the gun on the direction a stock might take in reaction to this information.
That’s what’s interesting about biotech and why I picked this sector as one of the first stocks for this system. The SCMI provides me with 10 to 15 opportunities per day across all sectors based upon the all the social media signals we have setup.
I noticed immediately that I was receiving a higher volume of signals specific to the biotech sector and that these signals were more timely and accurate than most of the others. I decided to take a “gold miners” approach and focus my attention on “mining” the richest ground so I could maximize my returns for all the analysis I was doing.
FireEye recently released a report stating that a group of hackers who appeared to have “investment banking” backgrounds had broken into the email systems of over 100 biotech and healthcare companies to get inside drug trial and regulatory information before it was released to the public.
This group, dubbed “Fin4”, focused on biotech because this kind of information “significantly affects company stock price” in this industry. My social media collective intelligence system is able to generate similar data by pulling and correlating millions of publicly available social media messages per day, which is the legal way to mine this data.
Stay tuned as I continue to monitor social media opportunities across the markets!

Ben
P.S.
I’m very excited to be a member of the Dent Research team and thank you for the great welcome and feedback I‘ve received.


