
Harry S. Dent Jr.'s Blog, page 168
January 21, 2015
Keynesian Economics
Today’s chart is all about you – the American taxpayer… the American consumer.
Because here at Dent Research, we’re unwavering in our assertion that it’s everyday people who drive the economy… not ivory tower policy wonks, armchair economists nor central banksters!
Get this…
This morning, I read an article referring to the Swiss National Bank’s surprise de-pegging move, in which the author asked a most asinine question:
“…what if central banks become as unpredictable and fallible as they are powerful?”
To me, the only errant words in that question are “what if” and “become.”
Because, in my eyes, we’re already there!
Keynesian thought, we’ve long said, seems well-intentioned. It says: “…let the private sector drive, but give central banks and governments an ‘emergency brake’ — and a spare tank of ‘nitrous oxide’ — to buffer out the extreme edges of the business cycle’s ups and downs.”
It’s easy to forget that central banks are supposed to raise interest rates and reduce the money supply when the economy is running hot. Because in most of our recent memories, we can only recall central banks’ bold promises (i.e. Draghi’s “whatever it takes”) to save the economy, accompanied by huge money-where-their-mouth-is stimulus packages (i.e. like the one everyone expects the ECB to announce tomorrow).
True, central banks have been an undeniably significant factor in financial markets since 2008 — employing a heavier hand and even more so when compared to Adam Smith’s invisible hand.
But we still believe there’s a limit to the central banks’ ability to control markets and economies as if they were simple mechanisms, like a thermostat controls a heating and cooling system.
consumer spending still accounts for around 70% of economic output in developed countries. That means when everyday people buy everyday things… this is what drives economic growth through periods of expansion and contraction.
And that brings me to the chart I want to share with you today. It comes from a fellow market analyst, Tom McClellan of McClellan Financial Publications, whose work I greatly respect.
In Tom’s words:
“History proves that when Washington, D.C. takes too big of a bite out of the economy, the stock market suffers and thus so does the economy.”
Take a look…
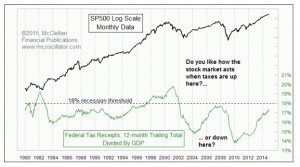
By this indicator — which is simply the U.S. government’s Federal Tax Receipts divided by U.S. GDP — economic recessions loom near once the government’s tax-take amounts to 18% of the economy.
The reason? Simple…
As U.S. citizens fork over a larger share of their wages and capital gains to the government… a smaller share of the pie is left available for private sector investment and consumption.
As we’ve always said: “It’s you — the consumer — who drives the economy.”
And so it’s only natural to be a bit concerned that it’s the consumer that’s funneling more tax dollars to Uncle Sam.
Like any indicator, don’t expect a recession to begin within moments of hitting that 18% threshold. Still, I think this is a great chart to keep in the backs of our minds as we navigate choppy waters in 2015.
Adam


Stimulus Limits
We’ve been saying for years that there should be limits to quantitative easing (QE) (or money printing) and fiscal stimulus after a debt and bubble boom like 1914 to 1929 and 1994 to 2007.
These bubble booms come predictably in the fall season wherein the killer apps from long term technology innovation are finally moving mainstream for the first time. Such productivity creates higher than average economic growth and falling inflation which means falling interest rates.
This is called a positive reinforcement cycle. Add to that the new trend since the 1987 crash, Greenspan would aggressively lower interest rates every time there was a stock crash or recession. One thing that comes of that… the economy never really gets to rebalance.
Such trends could only — as they have in the past, but even more so this time — create a bubble in financial assets and excess capacity. Both trends continue until the reality of slowing demographics and the massive debt burden weighs on growth.
That’s what happened in 2008, just as we forecasted 20 years ago…
But this time central banks decided they would do whatever was necessary to stop the natural and very painful deleveraging that has followed every debt and financial bubble in history. They have taken Keynesian policies to unprecedented heights.
In addition to massive fiscal deficits, central banks have created over $10 trillion in QE, or rather created money out of thin air, to fight deflation, to deleverage the debt and to keep the mighty financial bubbles from bursting.
Markets and Economy on CrackAnd they’ve been there since 2008! Such massive stimulus only encourages more borrowing and even greater bubbles and, of course, more excess capacity – the very problems that led to the last global financial crisis.
There’s only so much an economy can take.
The greatest expanse in the use of zero-interest rate money are the frackers in the U.S. and emerging companies overseas. The expanse in such investment has created excess capacity, especially in oil. But all industrial and energy commodities have collapsed since mid-2008.
We have warned for years that this would be the stealth crisis that no one saw coming. Today, it’s the falling oil and commodity prices that are sure to kill the fracking bubble and high risk debt that has only accelerated since 2008.
Following quickly on the hit list is the $6 trillion plus in U.S. high yield and leveraged debt to emerging countries.
That said, the very stimulus slated to save the economy creates new debt, asset bubbles and excess capacity leading back to deflation and deleveraging all over again – but it’s now even worse as the bubbles are stretched further.
I’ve consistently argued against clueless economists and bubble naysaying analysts that there’s a great reset coming. The dollar will keep rising and will do so even faster after the crisis hits.
Commodities and gold will keep falling…first hitting emerging stocks, followed by high yield bonds crashing (corporate and in emerging countries) and then stocks will be the last to go with the Dow somewhere near 6,000 or lower by late 2016 or early 2017.
Everything has been following this forecast except that stocks are still in denial and after greatly underestimating the trigger that is falling oil and commodity prices and accepting that they are likely to be to the next round of debt collapses, what falling home prices were to the subprime crisis. Leading the pack will be fracking bonds, followed by emerging company bonds, other high-yield bonds and then sovereign bonds.
Does it look like Greece again?
I’ve covered the fracking and emerging market bubbles in-depth in recent articles. And I’ve shown how stocks are much more over-valued than the analysts say when you adjust for the risk in today’s world of geopolitical volatility and rising leverage versus the 1929 or 2000 tops.
I’ve shown that this bubble has now greatly surpassed the 2002 to 2007 bubble and is at least on par with the 1925 to 1929 bubble and is now even rivaling the 1995 to 2000 bubble.
These stock bubbles will burst and with that explosion, we’ll see most of the overvalued real estate markets in the world plummet. That still looks clear and 2015 looks like the time when the stimulus finally just fails.
The U.S. has tapered and will be slow to come back. Germany and Switzerland are fighting the next ECB QE surge, and it may not happen to the substantial degree.
All of this unprecedented stimulus still can’t keep global growth from steadily slowing and demographics trends tell us such slowing will intensify from 2015 forward.
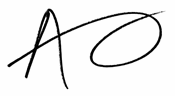
I’ve been expecting U.S. treasury yields to spike at some point when the world starts to fall apart before seeing yields drop in the long-term with deflationary trends finally setting in.
But after testing the bottom of the channel in 10-year Treasurys in the chart above, such bonds could be headed for a retest below 1% rates before spiking again as even the U.S. government looks risky. Imagine the spike we will see in European bonds when their economies tank again with worse demographic trends and greater debt pressures?
Yes, there are limits to the “something for nothing” economy of endless QE and deficits. It finally looks like we are hitting them from many angles. So, prepare for the worst ahead – another financial crisis and crash worse than 2008 – especially from late March on.
This could well be the end of Keynesian economics that I forecasted many years ago…
Good riddance!

Harry
Ahead of the Curve with Adam O’Dell Keynesian EconomyLow Interest Rates Defined
The all-time low yields in the 30-year U.S. Treasury bond have some people scratching their heads. We’re seeing lower interest rates now than we did during the Great Depression!
We thought interest rates were low when long-term rates were under 4%, but think again… U.S. 30-year bond rates are now below 2.5%!
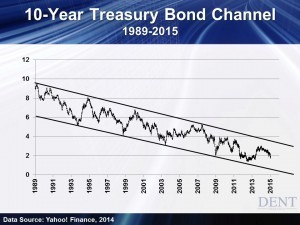
But wait a minute, let’s get some perspective on rates by comparing U.S. 10-year rates and 10-year government rates around the world.
I could go on for a while but to get yields higher than the U.S., you would have to buy Greece, Portugal, Mexico or perhaps Brazilian bonds (the latter could be a little riskier).
My point is this: when investors avoid risk assets like stocks or commodities and are seeking the safety of bonds, where are they going to put their money?
Traders and investors will likely look for the safest and highest yielding bonds. For now, U.S. bonds are the safest, most liquid and highest yielding of the bunch. When there is a true crisis, like in 2008, yields dropped from 4.5% to 2.7% in less than 2 months.
I was speaking with Dr. Lacy Hunt a few months ago and he asked me if I had read an article in The Wall Street Journal from October 20 of last year which highlighted an institutional fund he runs.
He mentioned that his fund, which primarily invests in long-term treasury bonds, is doing quite well. Dr. Hunt and company have been investing in U.S. T-bonds for the past decade, betting yields would fall because of rising debt that inhibits growth and retards inflation.
It’s his view that long-term bonds will likely fall below 2%! Back in October when the article was published, yields had dropped to about 3% and by last week hit an all-time low of 2.4%.
Let me also add that Dr. Hunt is a featured speaker at our upcoming Irrational Economic Summit 2015 and has spoken at our events on more than a few occasions. His presentations are always valuable and much sought-after.
So, it certainly doesn’t look like a stretch to imagine long-term U.S. treasury yields dropping below 2%, especially with the deflationary headwinds we face and comparable global interest rates.
Even if we are likely to see lower rates over the next few months or even years, what does that mean to us? What will the Federal Reserve do?
Will the Fed raise rates in a few months, like they have been hinting at in past meetings? Will the Fed change course and try to create inflation with more quantitative easing (QE)?
How can you profit from all of this chaos?
If you have an interest in profiting from the roller-coaster interest rate market, please take a look at the Dent Digest Trader. I’ll show you how to make healthy profits by trading options that capitalize on relatively small moves in interest rates on U.S. Treasury bonds.

Larry
January 20, 2015
Dropping Interest in the Euro Zone
On January 8, I wrote about the Swiss National Bank (SNB) keeping the exchange rate between the euro and the Swiss franc at 1.20 or higher. This means the euro can purchase at least 1.20 francs. If the exchange rate fell below 1.20, then the SNB would print new francs and use them to buy euros.
As I commented back then, the program kept the franc from getting stronger against the euro, which kept Swiss exports from getting too expensive when priced in euros.
The SNB put the exchange rate floor in place in September of 2011, and as recently as January 12 they reaffirmed their intent to maintain the minimum 1.20 exchange rate. But recent developments have caused problems for the SNB.
Over the past six months, the euro has been falling as investors prepared for a European Central Bank (ECB) quantitative easing (QE) program. Since July 2014, the euro sank from $1.35 to $1.16, a drop of 15%.
The SNB kept its program in place, so the euro/franc exchange rate remained at 1.20 or higher. Unfortunately, as I noted on January 8, this means that as the euro fell in value relative to most other currencies, it dragged the franc down with it…
As the franc devalued, the Swiss had to pay more for imports from China, the U.S., and basically everywhere but the euro zone, which meant a lower standard of living for the everyday citizen.
Too Much for the SNB to BearOn January 15, just two days after they had reaffirmed their intent to hold the line at 1.20, the SNB announced that it would stop supporting the euro/franc exchange rate and would let the currency pair float freely. Market reactions were swift and dramatic.
At first the franc shot much higher in value, trading as high as 0.90 franc per euro, which is a drop of 30 cents in a matter of minutes; however, the exchange rate recovered a bit in the hours that followed and settled in around 1.05 francs per euro.
Since the move by the SNB was a surprise, all of the currency traders that were betting on the SNB supporting the 1.20 level were blindsided. A common trade was to have a standing order to go short the Swiss franc in euros when the price dropped below 1.20.
This made sense because the SNB was going to step in and make the franc cheaper, as it had every time the exchange rate fell below that level since September 2011. This was a guaranteed moneymaker for more than three years!
But this time the SNB did not step in, so traders ended up short the Swiss franc and long euros, only to watch the Swiss franc shoot higher in value as the exchange rate continued to fall.
There’s no estimate yet on how much money was lost, but it was probably in the billions of dollars.
It might seem like the Swiss capitulated, and did so at exactly the wrong time — just ahead of the ECB’s announcement on a QE program. Given that the euro has dropped so far already and interest rates are exceptionally low across the euro zone (two-year government bonds in eight European countries have yields below zero), it’s easy to see how the ECB could disappoint the markets with too modest of a plan, leading to the euro moving back up a bit.
But the Swiss might win this war after all by using negative interest rates.
When the SNB cut the cord of support for the euro/franc exchange rate, it also tripled the interest rate it charges on sight deposits (immediately available deposits from banks) from 0.25% to 0.75%. This means that depositors who are using the Swiss franc as a safe haven will have to pay a hefty penalty to keep their funds on hand.
The huge charge on deposits could also have the beneficial effect of stimulating the Swiss economy, which has stalled in recent months along with the rest of Europe.
No matter what happens, one thing is certain — we’re living through a time of extraordinarily low interest rates, where depositors in many countries are charged for the privilege of holding their funds in banks.
As Lance Gaitan discusses below in Ahead of the Curve, low interest rates are prevalent in developed nations around the world, which makes our paltry rates on U.S. government debt look like high-yield offerings!
Rodney
Ahead of the Curve with Lance Gaitan Defining Low Interest Rates
Swiss Say No to QE
Note from Harry: I misstated a few points in yesterday’s Economy & Markets, which I wanted to correct. More importantly, this topic is a particularly important one for you so I want to make sure you read it. If you haven’t read it yet, you can do so now. And if you have read it, please glance at the correct article below.
The markets have had an array of abrupt reactions to the Swiss National Bank’s (SNB) move to stop supporting the Swiss franc against the euro from buying Swiss bonds.
The euro has crashed further, stocks have taken minor hits and gold has broken to the upside (as we expected near term).
But the biggest impact is likely to be on Mario Draghi’s up-and-coming decision to ignite another heavily telegraphed round of quantitative easing (QE) to the tune of $1.2 trillion plus.
But I’ll get back to that.
Few people realize that Switzerland, even more so than Japan, has been the most aggressive at QE and at expanding their central bank’s balance sheet by five times since January 2008.
Why would the normally conservative Swiss bank be so aggressive in stimulating and then reverse so sharply?
The Swiss like most European nations are big exporters, at 50% to 54% of GDP since 2006. Switzerland’s largest trading partner is the euro zone economic bloc at 40%. A falling euro versus the Swiss franc hurts Swiss export industries from watches to chocolates. As the euro weakened against the franc from late 2007 through August 2011, Swiss exports were getting crushed because euro zone clients couldn’t afford them.
The pain became too much for the Swiss in September of 2011, at which point the SNB announced it wouldn’t let the franc appreciate any further against the euro, they would hold the line at 1.20 francs per euro.
To do this, the Swiss had to continually print francs to buy euros whenever the exchange rate tried to go below that level. Switzerland was David fighting Goliath. The chart below shows the euro versus both the Swiss franc and the U.S. dollar since 2007.
The flat section of the red line from 2011 until last week is where the Swiss held the franc/euro exchange rate at 1.20.
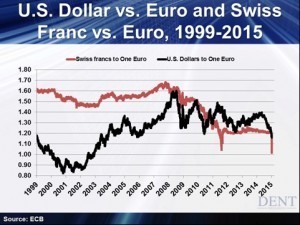
The euro peaked against the dollar in March of 2008 at 1.60. I remember that painfully as I was in Italy at the time paying top prices for everything. The euro has devalued 28% against the dollar since then.
But there is one big difference for the Swiss. Their largest industry is global banking and a falling currency means affluent depositors lose value… they don’t like that!
By pegging it to the euro, foreign depositors, whose home currency is the euro, are neutral — but as the euro lost value compared to other currencies, the franc fell against other currencies as well.
This meant that foreign depositors outside the euro zone lost value.
So, the Swiss couldn’t afford to single-handedly keep fighting the euro since it meant they were fighting almost every other currency at the same time… and its banking sector needs to return to the safe-haven status it’s always offered, especially now that it has had to give up much of its secrecy advantage.
The euro zone is heavily split over Draghi’s intention of strong QE. Germany and the other healthier northern countries — Austria, the Netherlands and Finland — are against another desperate round of QE.
Yes, that would benefit their exports, but they’re doing well enough to value the long-term over the short-term benefits of desperately taking more financial drugs.
The Mediterranean countries are all flagging — France, Italy, Spain, Greece and Portugal. They desperately need escalating QE to keep their bond rates low (with the strongest rising deficits) and to continue to stimulate their exports and trade imbalances.
Here’s what’s so important about the sudden Swiss move: the SNB just preempted Draghi.
The euro is falling without further QE as a Swiss withdrawal of that move is like an increase in stimulus for the euro. If Draghi adds insult to injury with a big jolt, the euro could be at parity in short order to the U.S. dollar.
Given that there is already a big rift over such QE, it makes it harder for Draghi to follow through — at all, or as strongly, as he has telegraphed.
Anyone that doesn’t think that European and global stock markets will tank if Draghi doesn’t follow through is nuts.
The continued fall of the euro only adds to the rising dollar trend that is a wrecking ball for the commodity collapse that keeps hitting emerging countries and their debt exposure, not to mention the fracking bubble collapsing.
The markets know that they can’t keep going up without continued QE. The U.S. is on hold for now, Japan is off the reservation on the excessive side. The ECB is the only major region that can keep upping the ante here.
The U.S. is the only market holding fast to the delusion that we’re at escape velocity and more QE is not needed. That will change in 2015 when our economy unexpectedly slows due to demographic trends, as will Germany’s and many others in Europe.
Germany has been leading the protest against the new surge in QE. A court just approved more QE and defined it as legal up to a point, so Draghi won that round.
Draghi is going to have to announce some QE at the ECB meeting on January 22 or face great disappointment by the markets.
But what if Germany is successful in blocking QE down the road or keeping it more minimal?
That broader decision is due around March, just when we have the strongest potential turning point in this year’s cycles.
A balk on European Central Bank’s QE and continued falling oil prices are likely to be the two triggers for the next global stock crash… and they are, of course, intertwined.
Harry
Ahead of the Curve with Charles SizemoreThe Copper ConnectionJanuary 19, 2015
The Copper Connection
For the first time in months, crude oil is actually showing signs of life. The price of a barrel of crude oil closed Friday up about 10% from its lows earlier in the week. Of course, we have to keep a little perspective here — it’s still trading at less than half its summer highs.
Have we seen the bottom in crude oil? Maybe, maybe not. I’ll leave the forecasting to Harry Dent. (Harry sees the price falling to $32 in the near term, by the way.)
Instead, I want to focus on what the drop in the price of crude oil is telling us about growth prospects.
Let’s start with the notion that the crude collapse is a “supply issue” rather than the result of sagging demand. Yes, the fracking revolution has turned the U.S. into an energy powerhouse again.
In the chart below, you can see that our crude oil production is up 45% since 2000. Russia and Canada have seen even bigger boosts to crude production, up 56% and 78%, respectively.
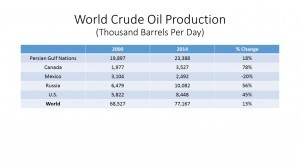 Source: U.S. Energy Information Administration
Yet production has collapsed in several traditional producers, such as Norway, Mexico, the United Kingdom and Venezuela. Overall, world output is only up about 13% since 2000. That’s less than 1% per year.
I don’t know about you, but I wouldn’t call that a supply glut.
And it’s not just crude oil that is flashing warning signs. Retail sales were lower in December…despite the drop in gasoline prices that was supposed to give consumers extra cash to spend.
The 30-year Treasury bond yield hit new all-time lows last week — yes, as in the lowest yields in history — and finished the week yielding 2.44%. And core Consumer Price Index (CPI) inflation, which excludes energy and food, came in lower than expected at 1.6% for the year.
Does any of this sound like a healthy economy to you? I say no, it doesn’t.
In Boom & Bust we’ve been mostly out of the oil trade. But we have been actively shorting copper, which is one of the most economically-sensitive commodities due to its use in construction. New construction accounts for about 44% of copper use. And given China’s place as the center of construction activity, about 45% of the total is used by China.
China is the copper market. And guess what? Even if China avoids a hard landing, Chinese demand for copper is about to fall off the cliff.
About one out of every five new homes in China is currently sitting unoccupied, and Chinese construction is slowing. But we actually don’t need Chinese construction to completely grind to a halt in order to have a bear market in copper.
Supply of new copper has outpaced demand for several years running, with much of the excess sitting in Chinese warehouses. Figures here are a little shadowy, but China’s Strategic Reserves Bureau is believed to have purchased as much as 700,000 tons in the first nine months of 2014.
China is practically swimming in copper.
Meanwhile, copper prices continue to slide. Copper started 2015 at $2.84 per pound before sliding to as low as $2.55 last week. In the January issue of Boom & Bust, Adam wrote that copper prices could eventually fall to $1.00-$1.50… that’s where they sat a decade ago.
If China ends up having a real slowdown, that might prove to be a conservative estimate!
Is Dr. Copper predicting a recession in 2015? Probably not. I expect the economy to grow this year. But I also expect it to fall short of the 3% growth currently being forecast by economists.
We’ll keep an eye on it.
January 16, 2015
Biotech Erasers
On Wednesday our $13 billion dollar man, Dr. Patrick Soon-Shiong, announced the creation of another new company under the NantWorks umbrella. It’s called NantCell.
Dr. Soon-Shiong has been unstoppable recently, purchasing, merging, and creating cutting-edge technology companies that are changing.
NantCell is taking a smarter approach to cancer fighting by focusing on molecular-based screening factors to better match up cancer patients with treatments. Patients will go through a comprehensive “omic” analysis on their DNA, RNA and protein.
These patients will be treated on the resulting molecular profile to maximize clinical outcome and minimize side-effects. The company’s mission is to leverage advanced computing technology in order to replace the standard method of clinical trial design of “trial and error” with a level of quantitative predictability.
NantCell has entered into a licensing agreement with Amgen (Nasdaq:AMGN) for the exclusive rights to develop and commercialize AMG 479, a fully human monoclonal antibody that targets Type 1 insulin-like growth factor receptors that kill tumors.
AMG 479 actually failed in a Phase III trial for treating advanced pancreatic cancer in 2012, but NantCell believes that with its molecular profiling technology, it’ll be able to find the ideal patients for the therapy to make it a success.
NantCell is also a joint venture with Sorrento Therapeutics (Nasdaq:SRNE). As you may recall from my previous article, Dr. Soon-Shiong took a sizable stake in Sorrento in December, almost doubling the share price to $8. After another deal between Soon-Shiong, Sorrento and Conkwest was announced in late December, this rocketed Sorrento share price above $10.
Now with the third announcement between Soon-Shiong and Sorrento hitting the streets on Wednesday this week, Sorrento share price has benefited greatly, rising another 12% on Wednesday. Overall, Sorrento share price has risen 254% in the last 3 months.
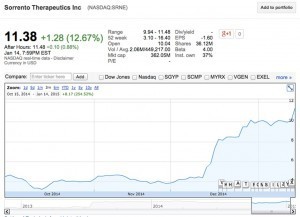
See larger image
Investors know that Patrick Soon-Shiong is continuing to methodically add truly disruptive technology companies to the cancer fighting space under his NantWorks conglomerate. Since NantWorks and NantCell are not publicly traded, the next best option is investing in the publicly traded companies they are partnering with.
I currently track trends surrounding healthcare and biotech utilizing my Social Media Collective Intelligence system and provide alerts in my Biotech Intel Trader service. If you’re interested in learning more, check out my trading service here.
As always, I will continue to monitor the market’s social media collective intelligence and keep you updated on the latest trends.
Happy Hunting,
The Debt Dilemma
Consumers are taking on more credit, so the good times must be back! Or not.
The Federal Reserve reported that in November consumer credit (excluding loans backed by real estate) increased by $14.1 billion, which is an annualized rate of 5.0%. It’s not enough to stop there.
The type of credit consumers are using is much more informative than the overall number. And when we look through the details, the story is not positive.
While the headline gain of $14.1 billion is correct, this includes a $15.1 billion jump in non-revolving credit, which means that revolving credit fell by $1 billion. And that’s where the trouble starts.
Revolving credit represents credit card debt. In 2009, Americans had $916.8 billion outstanding on credit cards. This amount fell and bottomed out at $817 billion in the first quarter of 2014.
Since that time, credit card debt has rebounded to $849 billion, and as of November it’s 3.4% higher than at the same point in 2014…
Interestingly, Federal Reserve reports on debt are not inflation-adjusted. If these figures reflected inflation, then the 11% drop in revolving credit from 2009 to 2014, and the fact that it is still 7% lower than in 2009, would be even deeper.
The fact that revolving credit continued to decline for years after the end of the financial crisis illustrates both the difficult financial position of consumers and their general view of debt. Real median income (adjusted for inflation) in the U.S. sat at $51,939 in 2013, which is 8% lower than it was in 2007, and is a level last seen in the late 1990s.
With incomes down, it’s no wonder that consumers resisted the urge to splurge over the last several years.
At the same time, members of the largest generation in our economy, the boomers, have all passed their peak spending age of 47 and are now either retirees or empty nesters. These stages of life are marked by saving, investing, and careful spending, not borrowing more.
This doesn’t mean that boomers are paring back their standard of living, just that they will spend accumulated funds instead of taking on more debt.
Non-revolving credit, the category that actually grew in November, consists of auto loans and student loans. In 2009, $719 billion of auto loans were outstanding. By November 2014, this figure had grown to $943 billion, an increase of $224 billion.
That time frame includes the cash for clunkers program, as well as the incredible run-up in auto sales over the past two years. It appears that consumers of all stripes are taking advantage of near-record low interest rates to get a new ride.
This leaves the category of student loans, which increased from $831 billion in 2009 to $1.311 trillion November of 2014, an increase of $480 billion in just four short years!
Unlike purchasing a car with borrowed funds, when you take out a student loan there is no guarantee of the outcome, and there’s no return policy in case you get a “lemon.” This is not the kind of consumer credit that helps an economy grow. In fact, over the long-term it could even work against the economy.
More than 70% of recent college graduates have some level of student debt. These obligations are very difficult to repudiate. Bankruptcy will remove many burdens, but student loans are not one of them.
So the young generation in our economy, the much-hyped group of millennials that are supposed to start walking up their own spending wave, are trying to make their way carrying a load of debt long before they get married or buy a home.
That’s no way to grow an economy.
As young people get married and have kids they climb aboard the train of spending that doesn’t stop for two decades. Who among us wouldn’t do everything we can to keep our children’s standard of living steady, if not growing?
The predictable spending that comes with these life events drives our economy. Buying homes, decorating them, paying for vacations and braces — they all add to our GDP.
While student loans clearly have a benefit — education — the cost has risen so high that young adults are putting off other choices such as marriage or even living alone that are the typical stepping stones leading to more spending.
The dramatic increase in student loans, which appears in official reports simply as “consumer credit,” is nothing to cheer. Along with flat income, student loan debt is probably one of the biggest reasons our economy cannot reach escape velocity.
When you hear that consumers must feel better about the future since they’re taking on more debt, make sure to ask the question: “What kind of debt?”
Because all borrowing is not the same.

Rodney
January 15, 2015
China’s Economic Spiral
We have shown many times in the past how the U.S. debt bubble mushroomed in the boom that started in 1983. U.S. debt grew 839% in 25 years into the bubble peak of the first quarter of 2009.
That was 2.68 times GDP growth.
How can you have debt grow 2.68 times GDP and not have a debt crisis?
Any economist that didn’t and doesn’t see that as a problem (think Paul Krugman) should be driving a limo instead. At least they could keep the suit that way.
But as you would suspect, China makes that look like nothing. Just since 2000, or 14.5 years, China’s total debt grew from $1 trillion to $27.35 trillion or 2,635% while GDP grew from $1 trillion to $9 trillion.
Look at this chart…
China’s debt grew 3.43 times GDP for 14.5 years. That has got to be the fastest growth rate of any major country ever.
Yet many economists praise China’s new state-driven capitalist model. Yes, now governments can take debt and leverage to extremes that the free market system could never dream of… That’s a good thing?
The U.S. and most developed countries have now taken over the economy and are setting short- and long-term interest rates at zero or less when you adjust for inflation and target growth and inflation rates.
The central bankers want to run our economies like a machine as if it were an inorganic process when it is actually a very dynamic organic process that plays on opposing forces: boom and bust, innovation and creative destruction, inflation and deflation, and success and failure. That’s the secret to the golden goose of free market capitalism.
Many investments will always fail, that is how we learn and evolve. But governments in a top-down and less accountable process will almost always make worse investments than the bottoms-up free market system.
China now has 27% of urban homes vacant, excess capacity of 30% to 40% in major industries from cement to aluminum, and hordes of empty malls, offices, roads, bridges and rail systems. Real estate has gone up more than seven times since 2000 — does that sound like a bubble to you? The U.S. real estate bubble was a mere 2.2 times.
The government has suddenly pushed 220 million unskilled people from rural areas into urban areas where they’re not even registered citizens. What happens to these people when the bubble bursts?
China is going to finally prove once and for all that top-down, centrally planned economies are far inferior to bottoms-up free market ones. Russia wasn’t enough proof for clueless economists. They’re going to have to eat their words on this.
You could look at China’s debt to GDP ratio of 2.64 times versus that of the U.S. and say that’s not as high as us at 3.54 times. But emerging countries have much lower debt ratios than developed ones as their consumers have much lower incomes and are much less credit worthy.
China’s debt ratios are more than twice that of similar countries like Brazil or India.
China’s capital investment from the government has been far higher and has lasted far longer than any other emerging country. This investment and debt binge is truly unprecedented!
The best comparison with the U.S. would be to compare China’s debt growth for a similar time frame into the peak of the U.S. bubble, or 14.5 years from the third quarter of 1994 into the first quarter of 2009 as the chart below shows.
China’s total debt grew 8.74 times as fast as U.S. debt in 14.5 years. Holy crap, we have no idea what a debt bubble is!
China will NOT have a soft landing. It will fall like an elephant.
Those 220 million people that they forced into urban areas are screwed. They will be jobless and likely not even have the option to go back to their rural farms for self-subsistence as those areas have now been paved over with empty condos.
At least they’ll have those empty condos for squatter rights.
We’ve also been warning that the Chinese government will start restricting the growing exodus of the most affluent Chinese (the smart money getting the hell out of Dodge). They just announced a crackdown on taxes owed for foreign income.
The next step could be restrictions on leaving the country without a major exit tax.
We are about to witness the greatest economic and social disaster in modern history.
Harry
January 14, 2015
The Oil-Fueled Economic Cycle
I’ve been focusing on this fracking and high-yield debt bubble precisely because it’s most likely to become the new trigger that the housing and subprime bubble was to the last global financial crisis in 2008/2009.
Bubbles just go on and on until they either get so extremely high that they burst of their own weight — as with the tech bubble — or more often when something triggers defaults that then cascade through the very debt markets that helped create the bubble.
We have even greater U.S. and global debt levels than in 2008, with unprecedented stimulus and money printing, as if you could cure excessive debt with more debt.
Looking BackThe last crisis was triggered by a subprime crisis that focused in just four states: California, Florida, Arizona and Nevada. The high foreclosure rates are still in these states (along with Detroit and narrow parts of the Midwest that have seen massive job losses and demographic implosion).
Such a global crisis couldn’t occur without everything we’re seeing right now…
Extreme fundamental trends are rapidly affecting demographic spending, the highest public and private debt ratios in the developed countries and the emerging market debt bubble… these are all coming together to bring on the next global debt crisis that will only be greater.
Falling commodity prices, especially oil, will continue to trigger more debt crises, like falling home prices did in the last one. The commodity plunge is already killing countries like Venezuela, Russia, Iran and Iraq.
The first to go will be the U.S. frackers increasingly defaulting on high-yield or junk bond debt. The second will be emerging country companies defaulting on U.S. high-yield bonds and bank loans.
Then the house of cards will fall as it did in 2008 when high-yield or junk bond rates spiked from 7.5% to 23.5%.
Such yields have already spiked from 5% to 7% and higher risk energy bonds from 5.5% to 10%. This time around the junk bond yields overall could spike from 5% to 25% or more!
Just as falling home prices, which no one expected, triggered the subprime crisis; falling oil prices will trigger the fracking and high-yield debt bubble. The high-yield bond market already sank 10% recently with energy-based bonds falling 20%.
And of course, the raging stock markets are largely ignoring this crystal clear peril.
The chart below shows how dominant horizontal drilling (fracking) in red has become in recent years in the U.S.
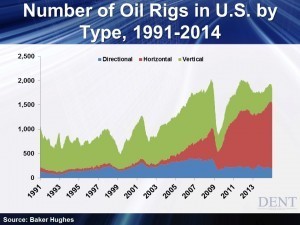
Note that fracking started to accelerate in 2003, and like traditional vertical oil wells, took a dive in 2008/early 2009 as oil crashed from $147 to $32. All types of rigs boomed simply due to rapidly rising oil prices into late 2007 as you would expect. But vertical wells still dominated at about 75% at the top of the last boom in late 2007. Now it has flopped to the opposite, near 75% from horizontal and fracking. How did that happen?
What changed after 2007 was the quantitative easing (QE) money printing that drove junk bond yields to unprecedented low rates of 5% and this was a huge advantage for fracking. Horizontal wells have high upfront discovery costs and then low pumping costs — but unlike traditional wells, they only last two years on average.
So, you have to keep borrowing and drilling.
This approach depends even more on financing and such cheap borrowing rates made it more profitable and competitive, along with the next rally in oil back to $115. The QE bubble created the fracking bubble and now it’s nearly 75% of oil production and concentrated in two states, Texas and North Dakota.
Now with oil prices plunging again, the entire fracking industry is not competitive unless oil prices get back toward $100 and that ain’t going to happen — mark my words!
Many drillers will not be able to pay back these high-yield bonds and leveraged loans — just like the subprime mortgage borrowers with no down payments when home prices collapsed.
So what am I watching over the coming months? Not Fed policy, I’ll be keeping a close eye on oil prices!
As I have forecast recently, the most likely scenario is a near-term rally back to the $64 to $76 range and then another crash down to as low as $32 where they bottom…
One way or the other, the next oil crash is very likely to trigger the next debt crisis and the stock crash.
Harry
P.S.
We have more than a few months to go before our 2015 Irrational Economic Summit (IES). And we’ll be tackling quite a few subjects in our newsletters in that time. But there’s one thing that will be changing in the weeks to come and that is availability to join us in Vancouver this year. Read up on what we presented in 2014… and make sure to reserve your seating for this year. We look forward to seeing you.


