
Harry S. Dent Jr.'s Blog, page 170
January 5, 2015
Economic Recap: The Good, the Bad and the Ugly
As we move into 2015, most of our forecasts from recent years and from the beginning of 2014 have come true:
1. Oil has crashed again.
2. Gold keeps weakening after its second crash in early 2013.
3. Commodities continue to weaken.
4. Emerging markets keep under performing from the commodity collapse and debt pressures, especially U.S. dominated debts that hurt more with a rising dollar.
5. China keeps slowing even as it continues to over-report growth and its real estate bubble keeps showing more fissures.
6. Germany keeps under performing forecasts as its underlying demographics are the weakest ahead despite its admirable fiscal responsibility.
7. Greece is looking at defaulting again after getting the most bail-outs… surprise, surprise, surprise…
But in early 2014, I expected the U.S. and global bubble in stocks to start to peak in the first half… and it obviously didn’t…
But it wasn’t until the latter part of 2014 with stocks bumping up against the massive megaphone pattern that goes back to 1994 when we started to warn investors that 17,200 plus was a good time to start to sell.
And that looked good at first, especially with the sharp and near 10% crash into October 15 where I finally gave a sell signal on one of our key trend indicators that was violated below 1,850 on the S&P 500.
But the markets rallied stronger for five weeks than at any time in U.S. stock market history… That was both a sign of short-term strength and greater evidence that we’re in an irrational bubble!
Bubbles just will not take no for an answer. They are as remarkable as Creation itself… but just as destructive at times.
That rebound forced me to reconsider the scenarios ahead. Now it looks more like the markets will go even higher to 19,000+ on the Dow into the early part of 2015, most likely around mid- to late March on our best cycles.
But I’ve been looking for at least a minor setback is likely in January after the Santa Claus rally in late 2014 which is beginning, much like occurred in late 2013 into early 2014.
Late March to late September now looks like the greatest danger period for 2015; it will likely extend into late 2015 and even on into late 2016. I still see a Dow as low as 5,500 to 6,500 on this next and larger crash.
Fed and central bank suppression of interest rates has made the U.S. stock market the last resort for investing. That’s why it’s the last bubble; it’s ignoring the risks that the junk bond sector is starting to see as the fracking bubble is clearly bursting.
Since early 2011, commodities have been underperforming; along with that trend emerging market stocks continue to underperform. Since late 2012, you have bonds gyrating sideways and now high-yield corporate and emerging markets are starting to tank faster after my sell signal of May 2013.
Well… it looks like it’s getting ready to snow.
The winter season is about to come back with a vengeance… But it may take a few more months for the “market on crack” to get back to reality and start to crash into detox.
I’m forecasting that this next stock peak will be the end of the greatest and most extended bubble scenario in modern history — and it will end very badly with an avalanche of predictable consequences — even as most economists continue to promise “something for nothing” from endless free money.
This will make a great fairy tale for the future!
The key now, as I’ve covered in many past articles, is the continued crash in oil prices which in turn triggers rises in junk bond yields which in turn triggers higher yields in broader bond sectors, then crashes in stocks and finally a deeper crash in real estate again.
My most likely initial scenario for a few sectors in 2015 and beyond is:
1. Oil bounces from near $49 or so near term back to $64 plus by mid-March at the latest, then crash again toward $32 by September of 2015, if not earlier.
2. High yield bonds see rates bounce from 5% in 2014 to as high as 10% plus in 2015 and as high as 25% plus into 2016 led by increasing defaults in the fracking and energy sectors and others to follow.
3. Emerging market debt from the U.S. is the next and larger default wave to hit along with falling commodity prices.
4. Stocks go as high as 19,000 plus on the Dow by mid-March and then start to crash between late March and late September; then again well into 2016 and possibly early 2017.
5. U.S., and increasingly global real estate, starts to crash again from mid-2015 forward and could take several years to bottom (into 2021 or so). Much like the last 6-year crash in the U.S., this one will be more severe and much more global and pervasive.
6. The global real estate crash will trigger the worst debt defaults and financial crises to follow well into at least early 2020. It could extend possibly into as late as 2022 before the next more sustainable global rebound begins.
I know this doesn’t sound very appetizing but you can make it more so if you protect your wealth from this increasingly unprecedented bubble. Your strategy should be to get more liquid and be aware of what’s on the horizon.
The world will be on sale in the next five plus years, especially the emerging world that will have the best demographics coming out of this great reset.
Best of success to you in 2015 which could be the most pivotal year since 2008.

Harry
Ahead of the Curve with Adam O’Dell Initial Positive Reaction

January 2, 2015
Biotech Goes Mobile
If you thought BlackBerry (Nasdaq:BBRY) was a dead mobile device provider, think again.
They’re currently forging a partnership with NantHealth, a healthcare focused data provider, which falls underneath Patrick Soon-Shiong’s state of the art cancer fighting conglomerate, NantWorks.
What makes BlackBerry such an attractive partner for the healthcare and biotech business is their unparalleled security. While Apple and Samsung may have the most user-friendly devices on the market, BlackBerry has built their products around protection and security, which is why it’s so heavily embraced by an industry that’s highly regulated for protecting your private health information.
NantHealth and BlackBerry have developed a secure cancer genome browser that gives doctors the ability to access a patient’s genetic data on the BlackBerry Passport smartphone.
The company has stated that this capability enables deep, interactive reporting on genomics data for physicians, gives oncologists a tool to view individual genetic alterations in a disease and allows them to highlight relevant treatment options.
The browser application is fully encrypted which will allow physicians to receive and securely analyze the data wherever they are. This is a large game-changer from the traditional analysis practice that required physicians to physically go to the hospital or a secure data facility to perform their analysis work.
Dr. Patrick Soon-Shiong, the billionaire who founded NantWorks & NantHealth, stated: “Our partnership with BlackBerry has really been able to create a scalable super-computer in the palm of the hands of the doctor.”
The rollout of this capability will occur at the Consumer Electronics Show (CES) in Las Vegas later this month. The professional healthcare community will be able to purchase BlackBerry Passport devices with the secure browser program in early 2015.
BlackBerry does have plans to roll out the secure application on rival devices and operating systems. They plan to accomplish this by making the application continue to connect and operate through the secure BlackBerry network.
Dr. Soon-Shiong continues to push the envelope with his healthcare-based technology conglomerate NantWorks. He’s currently collaborating with BlackBerry on what will revolutionize the transport of big data sets for healthcare.
I currently track trends surrounding health care and biotech utilizing my social media collective intelligence system and provide alerts in my Biotech Intel Trader service.
As always, I will continue to monitor the market’s social media collective intelligence and keep you updated on the latest trends.

Ben
Endless Economic Bubble
“Financial bubbles tend to get more extreme over time as credit availability to fuel them expands as our incomes and wealth expand.”
That is Principle 6 from page 146 in The demographic cliff.
Add in the fact that central banks are fueling those dangerous bubbles with $14 trillion of money printing.
The presses are running…
Principle 7 states: Bubbles become so attractive that they eventually suck in even the skeptics.
This bubble is certainly proving all of these concepts and looking to pull in all the last suckers before the fabled Titanic sinks.
There are many charts we’ve been tracking in an attempt to anticipate when this bubble will finally peak, and make no mistake, it will. Here’s the one that is working the best thus far.
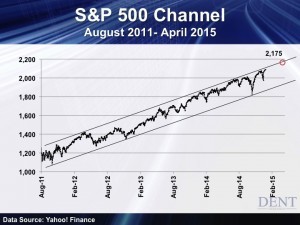
Ever since the 20% correction in this bubble market back in mid- to late 2011, the S&P 500 (and Dow) have been marching up a linear channel and leaning increasingly towards the upper side.
Note that when we have corrections like the one that just bottomed on October 15, the markets tend to rally back very sharply but then just barely edge up for months towards the top of this channel.
If the markets keep edging up and into our most likely turning point ahead, around mid-March, the S&P 500 should peak around 2,175 and the Dow around 19,000. That would imply gains of about 4% from the recent tops.
Such a target would be closely in line with the only resistance left in stocks and that’s at the all-time high and peak of 5,050 (5,133 intraday) on the Nasdaq which is 5% to 6% higher from where we are now.
If stocks break out above this channel then we could see a potential high of 2,300 on the S&P 500 and 20,000 on the Dow in a blow-off top. I see that as possible, but less likely in this increasingly precarious world of geopolitical risks and falling commodity and oil prices.
The next chart seems to be the best leading indicator and that’s an inverse of the high-yield spread above a risk-free rate. In other words, the most sensitive to risk bonds will smell trouble before stocks do because that is their focus.
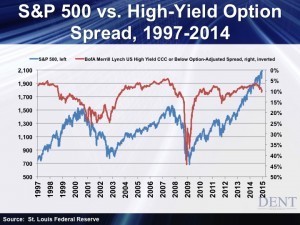
This indicator gave warnings to the early 2000 top and crash by over two years, but it also presented signals much closer to the late 2007 top and crash. Take note that it also fell less sharply just ahead of that serious 20% correction in 2011.
High-yield bonds are starting to spike again (which points down in this inverse version) with falling oil prices and concerns over defaults in the fracking and energy sectors that I’ve covered in recent articles.
If this indicator keeps falling a bit, we could see another minor correction just ahead. If it turns back up that would be bullish and confirm higher prices, which seems more likely.
When it starts to turn down more sharply this bubble should be very close to over. That could occur in January, but more likely around March forward of 2015.
It looks like oil prices are fishing for a short-term bottom around $49 to $50. If it bounces for a few months, which is likely, then this indicator should move back up and stock prices could keep edging up towards 2,175 or higher on that S&P 500 channel above.
Then again, oil looks like it’s heading towards $32 in the coming months, with no support below the present level, there is heavy resistance between $75 and $80 where oil broke down out of a long channel recently.
I’ll be looking for oil to rally back towards $64 to $75 and then start heading down again as the first leading indicator. I’ll also be looking for this inverse high-yield spread to head back down more sharply as the second signal of an impending peak possibly looming on the horizon.
Oil crashes again, high-yield bond rates spike higher and stocks start to crash. That’s the most likely scenario ahead.
We’ll be watching and keep you posted.

Harry
Ahead of the Curve with Ben Benoy Biotech Collaboration Goes Hi-TechJanuary 1, 2015
Commodities and the Economic Cycle
I’ve been forecasting for the past few years that the stealth crisis for the next global debt and financial crisis would be the vicious cycle of commodity prices declining setting off falling stock markets and low economic growth in the more demographically-vibrant emerging world, slowing export growth for China and world trade and then lower commodity prices created by less demand from major manufacturing exporters like China.
Even though it’s a minor commodity and oil importer, in recent articles I’ve argued that the U.S. will see more harm than good from this bursting fracking bubble that will in turn pop the high-yield debt bubble of 2009 to 2014. That scenario will look a lot like the subprime mortgage bubble that brought on the last global financial crisis that began in 2008.
Outside of the unique fracking bubble occurring today in the U.S., the best way to look at who will benefit more or be hurt more by falling commodity and oil prices is to look at which major countries are net exporters or importers of such commodities.
For that purpose I take out the agricultural commodities that are less price-sensitive as food demand is the most primary and more subject to changing climate conditions that tend to restrict supply more than expand it.
Take a look at the net exports of industrial commodities plus oil/energy in major countries around the world.
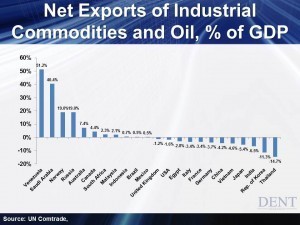
Breakdown of the Numbers
The countries that are the biggest losers are Venezuela at 51.2% net exports and Saudi Arabia at 40.4%. In this case, this is largely from oil and that’s the very reason why it’s so extreme. That would also include Iran and Iraq, most other Middle East countries, most of Africa, much of Latin America and parts of Asia.
Norway’s super-high $100,000 per capita income (almost twice the U.S.) is also very vulnerable at 19.0% net exports (largely oil) and of course, Russia at 19.0% (oil and minerals). Russia and Iran are already suffering from heavy sanctions and now they get hit by collapsing oil prices… ouch!
No wonder the ruble has collapsed over 50% and Iran is finally negotiating with the U.S. to lift sanctions over their nuclear ambitions.
Australia is highly exposed to commodity exports at 7.9% and Canada at 4.4%. That being one of the reasons why Australia’s stock market is 25% off its 2007 highs while the U.S. and Germany attain new highs.
Canada’s stocks are 10% off of their highs.
Australia is the highest in industrial commodity net exports (ex-oil) at 5.7% of GDP, as is South Africa. Iron ore, its largest commodity export is down 65% in recent years, even more than oil.
Canada, Malaysia, Indonesia, Brazil and Mexico are slight losers, while the U.K., the U.S., and Egypt are slight winners.
Italy, France and Germany come next as moderate winners. Then it accelerates with China at 4.2% net importers, then Vietnam and then Japan at 5.4%.
But the biggest winners are countries we have been touting down the road in this long-term commodity decline: India at 6.5% net imports, South Korea at 11.3% and Thailand at 14.7%.
India has the strongest demographics of any major country ahead especially with their new progressive and pro-business leadership and they are also one of the few winners in the emerging world from falling commodity prices (as I covered in the November issue of Boom & Bust).
As commodity prices continue to fall into 2020 to 2023 or so, $5.7 trillion of U.S. dollar loans and bonds to emerging country corporations will begin to fail, especially as we have forecast that the U.S. dollar would rise and will continue to do so in the years to come.
Those loans will be doubly hard to pay back in U.S. dollars of higher value.
In addition to that, more emerging countries depending on high oil prices will see their budgets go to constantly rising deficits. Iran needs $140 oil prices to meet their government spending needs, Venezuela $121, Nigeria $119, Iraq $106, Saudi Arabia $93… good luck with that!
Emerging countries are already paying 1% more for high-grade corporate debt than those in the U.S. companies and will continue to rise even more ahead… hurting their profits and competitiveness.
High-yield debt is starting to spike beginning with a move from 5.4% to 10.3% for energy and fracking companies in the U.S. and 5% to 7% in general.
Can you see a global crisis coming from the very realm that has seen the highest growth since the 2008 crisis as we’ve been warning?
It’s just a matter of how long it’ll take for the crack-delusional stock market to figure out the obvious and that could still take a few months!
Oil just broke down again below the trading range between $54 and $58 and the stock markets are flat. This is death for the frackers. How blind, deaf and dumb can you be?
Harry
P.S.
I did an interview on Varney & Co on Christmas Eve. We discussed falling oil prices, debt and market outlooks. If you’d like to see it, click here .
Happy New Year from all of us here at Dent Research!
December 31, 2014
Biotech Buildup For 2015
This month, we’ve covered the $13 billion dollar man, Patrick Soon-Shiong as he transforms cancer fighting into what only can be described as a mix between Star Wars and Ironman technology.
Dr. Soon-Shiong has been red-hot this month, snapping up companies to partner with and own under his parent company NantWorks which is leveraging technology in the fields of advanced semi-conductors, supercomputing, advanced networks and augmented intelligence to diagnose and treat cancer patients over hours, not months.
This past week Dr. Soon-Shiong partnered with Conkwest, Inc., the “Natural Killer Cell Company of the West,” which develops a proprietary Natural Killer (NK) cell-line platform Neukoplast® (NK-92™) as an immuno-oncology therapeutic.
The DealThe agreement between Dr. Soon-Shiong and Conkwest included a $48 million purchase of Class A common stock and the position of co-Chairman of the Conkwest board of directors. There’s also an additional $2 million of Class A common stock purchase separately by Sorrento Therapeutics (Nasdaq: SRNE).
As you may recall on December 19 , I wrote about Dr. Soon-Shiong’s sizable investment in Sorrento at $41 million for 19.9% equity stake in the company. This caused Sorrento share price to go up 80%, closing at $8.48, the Thursday after the deal was complete.
After leveling off in the mid-$8 range, news of the Soon-Shiong/Sorrento deal with Conkwest, further pushed shares of Sorrento (Nasdaq: SRNE) above $10 on Tuesday of this week.
Investors know that Patrick Soon-Shiong is meticulously adding truly disruptive technology long ball hitters under his NantWorks conglomeration and they want a piece of the action. Unfortunately, Conkwest is not a publicly traded company, so the best plays are still in the publicly traded companies under the NantWorks umbrella, such as Sorrento Therapeutics.
Dr. Soon-Shiong sincerely believes in the powerful collaboration that will come from this new partnership stating in the press conference afterward:
“The collaborations between NantWorks and Sorrento and between Sorrento and Conkwest offer access to state-of-the-art technologies, capabilities and expertise that are synergistic and will enable the accelerated development of many potent and novel cancer immunotherapies.”
He further went on to comment about how the partnership will be revolutionizing cancer fighting utilizing their combined technologies:
“Immunotherapy is one of the most powerful next-generation platforms added to our war against cancer. Integration of Nantomics advanced proteomics platform with the power of Sorrento’s fully human antibody libraries and Conkwest’s natural killer cell-lines is expected to enable an approach to attack tumors and their micro-metastases in a manner never before addressed.”
Across the biotech sector as a whole, the past two years have given us many companies that have decided to go with initial public offerings to raise capital but we’re beginning to see more and more deals from private investors as we head into 2015, such as the NantWorks/Conkwest deal.
To combat this, I’ll continue to monitor via social media the publicly traded companies that are ripe for private acquisition or at least have a piece of a private deal such as Sorrento in the NantWorks/Conkwest collaboration.
I’ll also share strategies that will help you take advantage of these situations via my Biotech Intel Trader service.
As always, I’ll continue to monitor the market’s social media collective intelligence and keep you updated on the latest trends.
Happy New Year!

Ben
P.S.
The New Year is about to ring in and we’ll be welcoming the newest members of our new group here at Dent Research. It’s called the Network. We’re offering lifetime access to all of Harry, Rodney, Adam and Ben’s research. And you’ll get all of it at an unheard of low price. The doors close at the stroke of midnight tonight. Don’t get left out and read more about it.
Bullish Sentiment Breaking Out
It’s important to keep your finger on the pulse of investor sentiment. Knowing the mood du jour helps us know which direction the herd is leaning. And we can make moves accordingly.
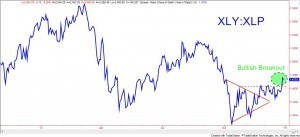
Two sentiment indicators that I regularly monitor are 1) the Consumer Discretionary-to-Staples (XLY: XLP) ratio, and 2) the Small-Cap-to-Large-Cap (IWM: DIA) ratio.
The former shows when investors are bidding up consumer discretionary stocks faster than consumer staples stocks. When this is the current mood among investors, the ratio rises and indicates increased optimism and risk-taking.
Likewise, the latter ratio measures investors’ preference for small-cap stocks relative to large-caps. Typically, when investors are optimistic and willing to assume increased risk, they invest in small-cap stocks, causing the ratio to increase along with the bullish sentiment.
Currently, it appears that both ratios are breaking out to the upside, indicating that bullish sentiment is quickly increasing. Take a look…
Here’s the Consumer Discretionary-to-Staples (XLY: XLP) ratio:
And here’s the Small-Cap-to-Large-Cap (IWM: DIA) ratio:
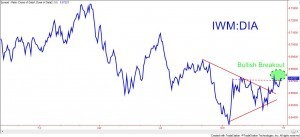
So both ratios are now beginning to indicate that investors are growing increasingly bullish.
This, of course, is a positive sign that the current broad market bull-run may have legs for a while longer into the New Year. But it’s also important to realize that these breakouts are in an early stage and may be prone to pullbacks in the near future.
I’ll continue to keep an eye on these developments.
I have a specific trade in mind that I’ll likely be recommending to Cycle 9 Alert subscribers in the next week or two. Click here to gain access to real-time trade alerts.

Adam
December 30, 2014
More Purchasing Power, Less Taxes
As we close out 2014 and set our sights on an even more prosperous 2015, I think the entire country deserves a raise. I’m not talking about raising hourly pay at McDonald’s or pushing for a higher minimum wage; in fact, I’m not discussing the income side of the ledger at all.
The quickest way to get a raise is to lower your expenses, and I have one particular expense in mind — taxes. In 2015 the U.S. Congress should finally get serious about attacking the idiocy that is the U.S. tax code, streamlining the system and lowering rates across the board.
Retiring Oklahoma Senator Tom Coburn has done Americans a great service by compiling a primer on the tax code called Tax Decoder that can be downloaded from his website, www.coburn.senate.gov.
The report reveals the lunacy that we deal with every day…
Finding the Tax DeductionsCurrently, the U.S. tax code runs more than four million words and fills more than 9,000 pages. This is just the code itself; it does not include the many regulations and rulings that must be referenced to interpret the tax code.
Individuals spend more than six billion hours per year preparing their taxes, roughly the same number of hours that would be necessary to employ three million people full-time. The National Federation of Independent Business estimates that the cost of tax compliance for small firms, at an estimated $18 billion per year, is 67% more than for large companies.
Of course we know why so much time and money is spent on tax compliance — it’s complicated and it favors those who have the money to seek out all of the possible deductions and credits.
For those willing to look, a tax deduction or credit probably is available. Forget the easy stuff like mortgage interest deductions or child-care credits. How about writing off gambling losses?
In 2011 taxpayers wrote off $4.8 billion in gambling losses.
Want to drive a fancy car? Leave behind the Maserati or Porsche and buy a Tesla instead. Not only is the $100,000 car cool, but it also comes with a hefty subsidy from the U.S. government, which totaled $143 million in 2012 for electric vehicles.
Farmers have always had a good deal when it comes to the tax code, and in some respects rightfully so. Their livelihood can fluctuate dramatically from year to year, so providing flexibility in the tax code and additional support like crop insurance can make sense.
But sometimes things get carried away. Currently farmers and other businesses that lose money can count their losses against profits made in previous years. This is called a tax-loss carryback and has the effect of providing the tax filer with a refund for the overpayment of taxes in the previous years, because the profit for those years has been reduced.
For most businesses the carryback period is two years, whereas for farmers it’s five years — but the favoritism doesn’t stop there. Farming losses in the current year can be used to offset profits earned by the farmer from any source of earned income in the previous five years. That’s pretty generous.
Believe It or NotIf you’re a sports fan, you might have noticed the renovation of Fenway Park, the baseball field where the Boston Red Sox play. Because the site is deemed an historic location, taxpayers provided $10 million in tax credits toward the makeover.
If sports aren’t your gig, then you might have seen the renovation of the famous Fontainebleau Resort in Miami Beach, which cost taxpayers $60 million in tax credits. For couch potatoes, the most obvious nonsensical tax break is the deduction provided to Hollywood.
Film and TV productions that pay at least 75% of their compensation in the U.S. qualify for tax deductions of $15 million per production. For television programs, the first 44 episodes of a series are each considered separate productions and therefore qualify for the tax deductions individually.
If all of this makes you shake your head, you’re not alone. It seems the agents for the IRS are just as frustrated by the complexity of it all. Despite employing more than 40,000 people and spending over $10 billion, the IRS estimates that it fails to collect $500 billion of taxes due every year.
To put this in perspective, the U.S. deficit for 2014 was approximately $480 billion. If we just collected what was due, the deficit would be erased.
Which leads me back to getting a raise in 2015…
If the tax code was simplified, then taxpayers could spend less on tax preparation and the IRS could better enforce the code. One would hope that simplification and streamlining would also cut out many of the deductions that favor specific groups (like gamblers and Hollywood) but provide no benefit to the nation. If the code was simpler and contained fewer deductions, then rates could be lowered for all levels of income.
This is a New Year’s wish that should make everyone’s list… unless, of course, you are a Tesla-driving Hollywood producer who owns part of an historic landmark and farms as a hobby but is very bad at gambling.

Rodney
P.S.
The clock is ticking and we’re at less than 36 hours before your chance to join the Network expires at midnight on Wednesday. Join this exclusive group of 500 members and you’ll enjoy it for life. We only have a few spaces left to sign up at unbelievable savings. Please read on for more information.
December 29, 2014
Stock Market High
Enthusiasm for exposure to the U.S.’s apparent economic recovery is far from fading. A record $39 billion flowed into U.S. stock funds last week, while non-U.S. funds suffered $2.5 billion in outflows.
So it’s safe to say that retail investors are now officially in love with, and fully committed to, U.S. stocks.
And that’s both good and bad.
Naturally, increased participation will create a tailwind for stocks in the near-term. Increased buying pressure will add fuel to the market’s rally, particularly as it’s coming at a time of seasonal strength.
But on a longer time scale, the massive upswell in retail participation is a warning sign.
Retail investors are notoriously late to the game. They tend to pile into late-stage bull markets at precisely the wrong time. So, after for years resisting investment in what’s been called the “most-hated bull market,” herd-following investors have caved to the lure of easy bull-run riches.
And that means the bull-run is closer to ending than these investors suspect.
But that doesn’t mean it will end suddenly this week or next.
Let’s take a closer look at these trends as we go around the market in 10 seconds…
• Global stock markets widely climbed, led by notoriously “risk-on” markets — Chinese stocks jumped 2.8%, emerging-market stocks rose 2.2% and small-cap stocks climbed 1.6%.
As I predicted several weeks back, Consumer Discretionary (XLY) stocks have outperformed during the holiday shopping season, beating the broad market’s return by nearly fourfold over the last month.
• Bond markets mostly slid last week, with the exception of junk bonds which, as a risk-on play, tend to trade alongside stocks. Higher interest rates and a surge in junk-bond prices suggest investors are optimistic about the future. This confirms the sentiment revealed by record equity inflows and the outperformance of risk-on sectors.
• Commodity markets were broadly weak. Natural gas prices slid sharply, losing more than 17%. While the energy sector (XLE) closed strongly higher last week, oil prices (USO) continued to edge down. So while the energy complex is trying to find a bottom, there’s no clear indication that the selling is over.
As I did last week, I’m still recommending holding off on any bullish energy investments for now.
Adam
Healthcare Hazards
The first ever renewal of coverage season under the Affordable Care Act has come and gone. This year wasn’t marked by the craziness of the failing website that plagued the initial rollout.
In fact, the first month of open enrollment seemed to go by rather quietly, but that’s misleading.
While it might not be as exciting as the circus coming to town, the fallout from the renewal process should be filled with fireworks, albeit on a delayed basis, because of what most people who bought insurance on an exchange in 2014 will do… which is absolutely nothing.
Everyone who obtained coverage through an exchange in 2014 has a health plan that expires December 31. The time to make any changes was during the open enrollment period from November 15 through December 15.
If no changes were made — like selecting a new plan — then the participant’s plan simply renewed for 2015.
On the face of it, this doesn’t sound very interesting, but as with most things where the government is trying to “help,” the devil is in the details.
Levels of coverage are broken down into five categories: catastrophic, bronze, silver, gold and platinum. Within each category, insurance companies can offer a mix of options with various levels of co-insurance, co-payments and deductibles.
For those who obtained insurance on an exchange and received some level of premium payment assistance, the cost of insurance used to calculate the assistance was based on the second-lowest cost of a silver plan. This would provide the participant with coverage that is considered the low-end of the middle tier.
Almost seven million people got their health insurance through an exchange in 2014, and 87% qualified for some sort of subsidy. The subsidy is typically in the form of a tax credit that is applied to the person’s tax return for the same year.
Participants that qualified for a subsidy in 2014 and used it to pay less for health insurance during the year will see their subsidy calculated and applied to their 2014 taxes due in April of 2015.
So Far, So GoodThe insurance plans offered by different companies aren’t static, and neither are the rates they charge. Some plans have been withdrawn from exchanges while others have been added, and most have had a rate change. Plan participants have to deal with a number of moving parts.
If a person bought health insurance on an exchange and received a subsidy, it’s likely that the insurance premium on their plan will go up next year. That’s the easy part.
If the participant has come to grips with paying a bit more for insurance, this might seem like the end of it, but it’s not.
It’s most likely that not only has the cost of the plan gone up, but also their subsidy for the following year is now based on an entirely different plan.
Since some insurance companies are dropping plans while others are adding new ones, it’s likely that the second-lowest cost silver plan in 2015, the one on which subsidies are based, isn’t the same plan that was the second lowest cost silver plan in 2014.
And that’s where the problems start.
Several polls of consumers who bought insurance through an exchange in 2014 show that most intend to keep their same plan for 2015. This could be because they’ve established relationships with doctors and other providers and don’t want to have to start over.
Once their current provider told them that if they wanted to stick around through next year they simply had to do nothing, and this is definitely the path of least resistance. What is left unsaid is that if the participant doesn’t go back through the application process on the exchange, their subsidy remains unchanged for 2015.
If the subsidy the participant is actually entitled to in 2015 has changed from what it was in 2014, then it’ll all be worked out on the participant’s tax return for 2015, which is due in April of 2016.
Sound confusing? You bet it is, but the upshot is straightforward.
For the 87% of people who obtained health-care coverage on an exchange in 2014 and received subsidized care, if they don’t go through the entire process again and verify their new subsidy level considering all the changes to the plans on the system, they’ll most likely be looking at a nasty surprise on their taxes for 2015.
Of course, by the time most of them figure this out it’ll be the spring of 2016, which means they’ve gone through yet another renewal period, and probably still done nothing… locking in yet another nasty tax surprise for the following year.
Rodney
P.S.
We’ve created a new group here at Dent Research, it’s called the Network. As a member, you get instant access to wealth-building strategies and what’s more… you get access for life. But this will only be available to the first 500 subscribers. Read more about it here .
December 26, 2014
Biotech and Pharmacies
Trying to take advantage of explosive biotech opportunities, most try to map out leading drug pipeline candidates that have the highest likelihood of success during trials.
But here’s a question, what if I asked: Is the creation of a “miracle drug” only half of the equation that leads to the success of a biotech company?
The 800 lb. gorilla in the room (and no one wants to talk about it) is distribution. In big healthcare, distribution comes in the form of the Pharmacy Benefit Management (PBM) organizations that process and pay prescription drug claims. These PBMs also contract with pharmacies and negotiate with drug manufacturers for discounts and rebates.
Every PBM maintains their “formulary” or list of approved drugs they are willing to cover on each drug benefit plan, at a set rate, and as you can imagine, getting on that list is the other half of the success equation for biotech companies.
Breaking Down The NumbersJust looking at the numbers, the power these PBMs wield is startling, more than 210 million Americans (two thirds of our entire population) receive drug benefits administered by PBMs. Most who subscribe to a PBM fall under one of the “big five” listed below. If you have a PBM, these should look very familiar.
• Express Scripts
• CVS Caremark
• Prime Therapeutics (Blue Cross Blue Shield)
• United Health
• Catamaran Corporation
The Express Scripts Holding Company (Nasdaq:ESRX) is the largest pharmacy benefit management organization in the U.S., with revenues of $104.62 billion. This week, we saw a move by Express Scripts that truly showed the power that these companies wield over billion dollar drug manufacturers.
Treatment solutions for Hepatitis C have been big business in 2014 with two main players, AbbVie (NYSE:ABBV) and Gilead Sciences (Nasdaq:GILD). Gilead comes to the market with $84,000 per course Sovaldi and $95,000 per course Harvoni, while AbbVie comes with $83,319 per course Viekira Pak.
When Gilead launched the $1,000 per day Sovaldi in 2013, it quickly became the best pharma product launch in history with 2014 sales expected to hit $12.7 billion. Sovaldi could cure 95% of patients depending on the strain of virus, preventing eventual liver failure. This year Harvoni was launched, which is the first one pill Hep C treatment, combining Sovaldi and a new drug.
However, this week Express Scripts inked a deal with AbbVie (NYSE:ABBV) to be the exclusive provider of Hep C treatments for it’s twenty-five million patients. In return, AbbVie will provide a huge rebate to Express Scripts, which should flow down to its customers… right?
There’s a high likelihood that patients will complain loudly about the decision because taking Viekira instead of Harvoni will mean taking more pills, taking Ribavirin and being on meds for an additional month.
However, whatever the outcome is, this example is a true illustration of the daily power plays occurring on the “distribution” side of the house that will affect your healthcare and your wallet.
I currently track trends surrounding healthcare and biotech utilizing my social media collective Intelligence system and provide alerts in my Biotech Intel Trader service.
As always, I will continue to monitor the market’s social media collective intelligence and keep you updated on the latest trends.
Ben


