
Harry S. Dent Jr.'s Blog, page 174
November 24, 2014
Bullish Market Made Possible By Doves
Foreign central banks have pulled out the big guns over the last three weeks.
First it was the Bank of Japan, which hit the markets with a Halloween surprise. And then China and Europe followed suit…
• At 3:30 a.m. EST on Friday, European Central Bank President Mario Draghi made another bold proclamation — that spurring inflation is “essential” and must be done “without delay.” His language was extremely dovish and reiterated the “I’ll do anything it takes” promise he made a few months back.
• Then, at 5:30 a.m. EST on Friday, the People’s Bank of China announced a surprise rate cut… something they haven’t done in more than two years. The move is clearly a signal that China is worried about its slowing growth and that it’s now committed to stimulating.
The great thing for us is that all three of these moves by foreign central banks are bullish for the U.S. dollar.
And the timing couldn’t be better… we just gave Boom & Bust subscribers a way to potentially profit from this trend in our December issue.
Now, let’s take a closer look at these trends as we go around the market in 10 seconds…
• Global stock markets crept higher throughout the week then enjoyed a nice early-morning boost on Friday, thanks to the central bank announcements. European stocks closed the week with the strongest gains up 3.3% while Chinese stocks lagged, ending the week 1.3% lower. And among U.S. stock indices, the small-cap Russell 2000 is still lagging behind and it suggests that investors’ greed glands haven’t kicked into high gear just yet.
• Bond markets were mildly lower but altogether uninteresting.
• Commodity markets were led higher by a 5.5% gain in natural gas prices. Oil finished the week roughly flat, suggesting some brave, bargain-basement buyers have started stepping in. I still think there’s a bit too much risk in trying to buy oil or energy stocks now. By early next year, the sector will enjoy a seasonal tailwind.
All in all, stocks are enjoying the lift provided by dovish central banks. The S&P 500 is up 6.3% since October 21, when I wrote about the “kickstarter” signal that suggested the bull market should have legs for at least another two to three months.

Adam


Markets Can Be Tricky
This week we saw the markets once again hit unprecedented highs despite Japan officially falling into a recession. When you’re in the driver’s seat, sometimes it feels like those traditional macro-economic indicators are having little effect in forecasting our own markets… so how do we keep our sanity?
The Marine Corps taught me to always stick to my training and heed the guidance of those who had gone before me in order to get through tough situations. A common adage I would hear at least once a week in briefings was: “Don’t reinvent the wheel,” which was great advice when given a monumental task.
However, we all know that every great leader always figures out a way to put their own mark on a plan, which leads to their true success.
I believe when going into unchartered territory and there is no clear map ahead, the best course of action uses what you know at your core. You should utilize the basic tools and tricks that gave you success in the past. And here’s the clincher — what sets apart the good ones from the great ones in those uncertain times, are those truly willing to embrace their core and then, double down when refining the game plan.
Last week, I introduced the concept of looking at what happened during the entire game (quarter), instead of just the final score (earnings). Building upon this same foundation, I want you to embrace your existing strategy. Have confidence in it but seek additional and complementary components to turbo charge it.
The top complementary indicator I’ve utilized over the past several years is social media analytics for short-term forecasting over a period of 60 to 90 days. When we roll up 2.4 million financial chat messages per day, we’re able to see patterns between individual stock price movement and indicators such as changes in chat message volume and message sentiment (buy/hold/sell).
For the market as a whole, we also pick up positive and negative signals based upon sentiment changes in the messages that have been extremely accurate this past year. Between January and September this year we had seven out of eight negative indicators predict the market dipping 2% to 3% in the following four weeks.
In late October we received two more negative indicators and a third on November 17. If you balance out your existing successful strategy with complementary indicators, such as social media analytics, it will greatly enhance your vision into this current market.
As always, I will continue to monitor the market’s social media collective intelligence and keep you updated on the latest trends.

Ben
November 21, 2014
Demographics and Japan
The original Star Trek television series only ran for 33 months, from September 1966 through June 1969. It’s ironic that the short-lived series was canceled a month before man walked on the moon and yet I’d bet that more people can identify Captain Kirk over Neil Armstrong.
Star Trek has lived on through reruns, spin-offs, remakes and movies. Still, there’s one small piece of the original series in particular that sticks with me — the opening sequence. I can hear the music in my head, along with William Shatner starting his lines with: “Space… the final frontier…” and ending with: “… To boldly go where no man has gone before!”
Welcome to the Starship Japan, a country that, economically speaking, is bent on going where no country has gone before!
While Japanese Prime Minister Shinzo Abe doesn’t look a lot like William Shatner or Patrick Stewart, he’s definitely the captain of a ship that’s hurtling toward the unknown…
In 2012, Abe was elected Prime Minister on a platform of economic reform. His plan for bringing the country out of a deflationary funk (called Abenomics) was based on three areas of attack — printing more yen, reforming business and eventually raising taxes.
The hope was to foster inflation by devaluing the currency, which should lead to more consumer and business spending. Increased spending combined with looser regulations about hiring, firing and other structural hurdles should lead to business development and higher wages in growth industries.
With greater spending, economic growth, and rising wages, the country would be in a position to raise taxes so that it could issue less debt.
In terms of success, Abe’s been able to print a lot more yen, creating a just a smidge of inflation… but that’s it. Business reform has been painfully slow in some areas but simply non-existent in most. The government increased the sales tax from 5% to 8% in April and planned to raise it to 10% in October 2015.
Businesses and consumers shifted their spending ahead of the tax increase and have since pulled back, which caused the Japanese economy to fall back into recession, the fourth one since 2008. Based on this recent trend, Abe has decided to push out the next tax increase by at least 18 months.
Since printing yen was the only thing to yield a positive short-term result, Abe and the Bank of Japan (BoJ) have decided to do more of it. In late October, the BoJ announced its plan to print even more yen, bringing its monthly total of bond buying equal to the amount of debt issued by the government.
So the central bank is printing money at the same rate the government is borrowing, the currency is falling, yet inflation is non-existent and bond yields are at historic lows.
This is truly where no economy has gone before.
Typically, printing this much money would devalue a currency so quickly as to cause strong and then hyperinflation. There would be a run on the currency as foreign trading partners did everything they could to liquidate their currency holdings and even domestic businesses would seek to denominate transactions in other currencies, much like what occurred in Argentina.
But this also involves rapidly rising interest rates, shortages of goods and other dislocations in the home market.
Japan has none of that. Instead, the country is exceptionally stable. It’s the third largest economy in the world and enjoys a robust import/export market.
The eventual fate of the Japanese economy is anyone’s guess. Do international markets get spooked by all the printing at some point and leave the yen in one mass exodus? Does the government move to raise taxes to lower its annual deficit and then begin working on its debt?
Or does Japan eventually restructure its debt in a one-time, massive dislocation of the financial markets and then open its doors the next day and conduct business as usual?
My best guess is an eventual restructuring of debt. The BoJ owns more than 20% of all Japanese government debt, while insurers own just under 20%, banks and other financial institutions own almost 30%. Overseas investors own about 8%, while households have about 2%. The rest is held by branches of government and others.
With ownership of Japanese government bonds so concentrated in just a few domestic entities, the fallout from restructuring would be dealt with mostly internally and fall mainly on large institutions. This is probably preferred to other approaches, such as increasing tax rates.
Higher taxes work to bring down deficits and debt in theory but in reality they slow consumption and motivate entities to shelter income. It’s hard to escape a restructuring.
The big question is timing. When would a restructuring, catastrophic loss of confidence or some other event occur? Who knows? The pieces are in place today. The government is issuing debt that the central bank is buying. The government deficit is a whopping 7.6% of GDP and it’s spending 18% of its budget on interest.
But the country keeps marching on.
It’s true the yen has fallen dramatically but that hasn’t slowed trade. The world keeps buying Japanese products… even when the Japanese can’t afford to buy as much from the world. It’s amazing that the Japanese Starship has been able to stay aloft this long.
Even if the timing and structure of the watershed event are hard to guess, the group that will be hurt the most is easy to identify — older Japanese citizens. Those relying on their savings, which will be devalued and their pensions, which will be cut, will experience a dramatic drop in their standard of living.
The shake-up should make life a little cheaper for those earning wages by forcing down the price of assets and could force the business restructuring that for the moment seems stuck in limbo. Both of these things would benefit younger Japanese citizens.
No matter how this unfolds, owners of Japanese property, both real and intangible, will suffer losses. The best way to play in this market is to short the yen, which we’ve done in our Boom & Bust portfolio since the summer of 2012.
No matter where the Starship Japan ends up crashing, this play should work out well for investors.

Rodney
Economic Collapse in China
Why do economists praise a Communist model that has already failed in so many countries?
During the Great Recession, China’s growth dropped by half and slowed from 12% to 6%. That became the portrait of the recession in China that was in direct contrast with its unprecedented steroid-driven growth over the past 15 years.
Throughout the recovery since 2009, China’s growth has been approximately 8% and has continued to fall over the last year. It’s presently at 7% due largely to a dramatic decrease in its exports because of the slowing in global growth.
We’ve been warning for years that China has the greatest infrastructure, real estate and debt bubble in modern history and that when it bursts… it’ll be a major factor in triggering the next deep financial crisis.
Now there is a new indicator that points in that direction in a more quantifiable way…
Fathom Consulting has a China Momentum Indicator predicting that China’s growth will fall to 4% or 5% in 2015. It’s obvious that it would be a major disaster for China as well as for the world economy. But it’ll also affect commodity prices… they’ve been dropping since mid-2008 and then went into freefall in early 2011.
When you look at this chart, you can see that this indicator has tracked well with past GDP trends in China. It peaked in late 2005 and China’s GDP growth peaked just two years later in 2007, showing a two-year lag. The indicator bottomed in early 2009 with GDP beginning its fall just a few months later in the same year.
The indicator peaked at lower levels in mid-2010 falling in line right along with GDP. Now it points down to 5% growth in 2015.
Take note that actual GDP has always overshot this indicator a bit with a one-year lag on average. This would suggest that GDP will fall to as low as 4% by late 2015 or so.
If China does keep slowing as we’ve been expecting, then the global economy will keep slowing as well, especially since China is the second largest economy in the world and the largest exporter and manufacturer.
This will create a negative feedback cycle that will build on slowing growth in Europe, as well as further demographic weakness ahead for the U.S. It’s a classic catch-22 scenario.
At some point, there will be an avalanche once China’s massive real estate bubble bursts. And it will affect real estate markets around the world, especially the English-speaking cities that the affluent Chinese are buying into like crazy: LA, San Francisco, New York, Vancouver, Toronto, Singapore, Sydney, Melbourne and London.
I’ve argued for years on the point that China has a flawed model that’s already been heavily disproven. It’s not China’s centralized planning that’s causing its massive growth; it’s the unprecedented overbuilding and government-driven stimulus. It’s the “poster child” for an economy on steroids.
Communism and centralized planning can’t possibly work as well as free market capitalism balanced by a democratic government. This has already been proven.
The Cold War was lost by the former U.S.S.R. that was the first major country to go all out for the communist and top-down centralized model. It was then trounced by the western and more free-market economies.
David Brooks wrote a recent op-ed in the New York Times on November 11 titled “The Legacy of Fear.” His premise was that 25 years after the fall of the Berlin Wall most of the post-communist nations are still doing very poorly. He takes research from Branko Milanovic, an economist at the City University of New York.
The greatest failures are Ukraine, Georgia, Bosnia, Serbia and others. It’ll take decades for them to get back to the incomes they had when Communism fell. These comprise about 20% of all the former communist countries.
Countries like Russia and Hungary are part of the subsequent 40% that are growing at less than 1.7%. Another 30% are growing less than 2%, like the Czech Republic and Slovenia. Then there are a few successes at around 10%, with only five countries emerging as successful capitalist economies: Poland, Belarus, Armenia and Estonia.
Milanovic observes that many of these successful countries owe it more to their valuable natural resources for exporting rather than to strong productivity.
The difference with China is that the government has massively overbuilt everything in the economy and pushed rural to urban migration at unprecedented… and unsustainable rates. I calculate that China has built enough real estate, infrastructure and industrial capacity for the next 12 to 15 years.
That’s what you get from centralized planning in a corrupt mafia-like political system and crony capitalism.
China’s stock market has been trending down since a feeble bounce it experienced back in February 2010 after a 70% crash from the extreme bubble that peaked in late 2007. The stock market is measuring profits and not growth. It’s telling the truth about China’s economy.
Overbuilding is not profitable as it creates high fixed costs and debt.
I’ve been forecasting for years now that China will not only slow but it will fall over like the behemoth it is. Bubbles do not correct… ever. All they can do is burst and with devastating results.
This will be the greatest bubble burst in modern history. It’ll prove once and for all that bottoms-up, free market democracies outperform top-down centrally-planned communist models.
Since the late 1700s, it’s been the marriage of free market capitalism and democracy that has made certain nations rich. The Cold War centered on the battle between these two models and you know what happened. The free markets won.
Since economists don’t understand the dynamic play of opposites that drives the stellar innovation of capitalism, they tend to mistake outrageous overbuilding for success.
I find this extremely pathetic — and truth be told, it’s the very reason why I don’t listen to people who have never had sex. Or run a business.
November 19, 2014
Investing in the Future
I’ve never claimed to be a psychic!
I don’t have a crystal ball… I don’t read tea leaves… Heck, I even try to avoid using language that suggests such a thing — as in: “I see this and that ahead…”
Some might see my resistance to forecasting the future as a weakness.
“C’mooooon duuuuude! Tell me what you see down the road!?” they heckle.
But I see my humble respect for the future’s unknowns — and unknown unknowns — as a positive.
This viewpoint forces me to dive deeper into the data… to search for valuable information that sheds light on the probabilities that govern future market trends.
I attribute our success with Cycle 9 Alert to how we use a data-driven, probabilities-based methodology
I also wanted to share some special news… Cycle 9 Alert “turns two” this month!
That’s right… for the past 24 months I’ve worked diligently to share with Cycle 9 Alert subscribers my very best research and trade ideas.
I can’t “see” the future. But I can leverage the power of probabilities-based data analysis to at least stack the odds in their favor.
I’m very proud of our overall results over the past two years — something like an average gain of 29% per trade (including losses) and a 70% win rate.
But since I don’t know tomorrow’s prices today… we, like all investment strategies, have had our ups and downs.
During the downswings, I knew there wasn’t anything wrong or broken with our strategy. It was just going through the natural ebb and flow… of being in and out of sync with the market… of creating and giving back profits.
So I knew that the answer to smoothing out the strings of gains and losses in Cycle 9 Alert wasn’t going to be found by tinkering with the Cycle 9 Alert system. We have a good thing going… and you know what they say: “If it ain’t broke, don’t fix it.”
Instead, I dug deeper into the probabilities-based research that originally led me to Cycle 9 Alert.
And after months of research, I developed a new trading strategy that’s designed to take advantage of short-term “overreaction moves” in the stock market. I’m very excited about this — it’s called the Weekly Options Alert.
But the best thing about it is that it’s a perfect complement to the Cycle 9 Alert strategy.
As I told Cycle 9 Alert subscribers earlier today, I see the two strategies as non-correlated and complimentary. And I expect the ebbs and flows from each strategy to balance each other out, like this…

We have plans to offer access to my newest, short-term strategy early next year. For now, only current Cycle 9 Alert subscribers are being invited to test out the strategy.
Cycle 9 Alert is a great place for you to start… I’ll show you everything you need to know about using options to build an easy-to-manage, diversified portfolio of positions that are poised to outperform over a two- to three-month timeframe.
Click here to learn more about Cycle 9 Alert.

Adam
Stock Market Strategy and Social Media
Everyone wants an edge.
The entire reason for what we do is to educate readers so that they have an edge when making decisions about business, investing and life. To bring you the best information available, we’re constantly looking for better ways to understand what’s happening in the economic world around us, as well as forecast where things are headed tomorrow.
Now we’ve just added another volume to our body of knowledge: we brought on Ben Benoy, a U.S. Marine and the developer of a unique and successful investment system.
Those of you who attended our Irrational Economic Summit (IES) last month will recognize him as the writer of the Biotech Intel Trader. What makes Ben unique is that he monitors social media — Facebook, Twitter, etc. — searching for clues as to the direction of individual stocks as well as the general markets.
He’s perfected a system that muffles the distracting noise while giving more weight to those who have been right in the past. Social media is clearly the fastest growing part of the Internet, but until now we weren’t sure of how to incorporate it into our research.
Ben’s work allows us to weave this information into the broader fabric of what we do at Dent Research and to bring you his views on the markets as well as individual sectors and stocks in both Economy & Markets and other publications.
To welcome Ben aboard and bring you up to speed on how he operates, I asked him a few questions about his work. Our exchange follows.
Rodney: We know your initial career was with the military… why did you transition into the finance/stock market world?
Ben: I went into the Marine Corps after graduating college and knew that serving the U.S. was a very honorable profession, but I also knew that it alone would not support my family in a manner that would allow us to live our lives on our own terms. I treasure spending time with my wife and four kids, so I knew that by getting into finance and the stock market, I would be able to fast-track our financial independence.
Rodney: So why the focus on social media in finance as opposed to a more traditional route like technical or fundamental analysis?
Ben: Back in 2009, I made some bad decisions by reading a lot of online message boards and social media sites that supposedly had factual sources providing the intelligence. I realized that retail investors really had no strong and trusted sources of information. That was when I decided to build the social media collective intelligence system that act a lot like the same systems I worked on in the military, but with a different focus. Now we’ve got statistical evidence that shows the direct links between finance and social media.
Rodney: And what tweaks were essential to transform the military’s version of this system to one that would work in the financial world?
Ben: The biggest tweak was relating everything from “threat” significant events to “price movement” significant events. With threats in the military we’re constantly building up an assessment over time, so there’s actually a lot more data that goes into threat prediction. With stocks, things happen really fast. Having an instantaneous “battle damage assessment” by immediately seeing how stock prices move is great. A lot of times in the threat world, it’s very hard to tell if what you launched was effective.
Rodney: Can you give us a glimpse of what’s “under the hood” of your system?
Ben: We take in 2.4 million social media finance messages per day and pick them apart on our data center infrastructure. We only calculate indicators that we’ve found to mathematically predict stock price movement. These indicators are changes in message volume baselines, changes in sentiment (buy/hold/sell) baselines, user reputation and message manipulation.
Rodney: How does that insight translate into the buy/sell mode of most, if not all, investors?
Ben: Great question. So, most investors read content online and they process it as best they can. So, when we roll up millions of messages and process investor sentiment instantaneously, we’re able to see a wave of movement on a particular stock before it’s fully discounted into the market. I’m essentially providing an “intelligence” report of critical information tailored to bolster buy/sell decisions that, of course, allows investors to make better choices.
Rodney: When you refer to your system of analytics, how would you describe it in layman’s terms?
Ben: Analytics or metrics are the way we process and display large amounts of information in a concise and summarized manner. One example is how we capture and track the number of messages on a stock, which can indicate a major upcoming price movement. The average person isn’t going to count the typical number of messages that come out on a stock and then see if that changes. Our system does this through its analytics engine and alerts us when there are major changes.
Rodney: What stock did you first monitor with your system? And what movements did you perceive?
Ben: The first stock I ever tracked closely was StemCells, Inc. This is a very small-cap biotech that was one of our first use cases for relating message volume to price movement. I noticed that when there were increases in just chatter volume, we saw large positive price increases occur.
Rodney: How do you think your system works as opposed to mainstream methodology?
Ben: My system actually provides an overlay to mainstream methodology. Fundamental indicators such as earnings calls only come out every three months. We capture what happens in between each major fundamental market event and play off it in order to maximize returns with traditional fundamental and technical indicators.
Rodney: Based on your system, are there any predictions you have considering the current standing of the market in general and where it might be headed?
Ben: Prior to October we received eight negative indicators on the market as whole. Seven out of the eight indicators predicted a market correction of 2% to 3% over the next two to four weeks, including one before the big correction in October. We received three more negative indicators at the end of October and mid-November, so I believe the market is going to take a slight correction in late November or early December.
Rodney: Tell me about a failure when developing the system that led you to improve it.
Ben: When we initially developed the system we only displayed/tracked stocks that were moving with social media indicators. This ended up being about 750 to 1,500 at any given time, but people still wanted to know what was going on in their portfolio. We now track all 7,000+ U.S. stocks because it gives a much fuller picture.
Rodney: If the system is applicable to many different areas, why focus on biotechs?
Ben: Biotech stocks offer rapid price movements surrounding the release of information on the performance of drug trials. Often times, we can pick up disparate pieces of information ahead of time in social media that allows us to jump the gun on the direction a stock might take in reaction to this information.
Rodney: How far behind, in terms of time, is your competition?
Ben: Since 2012, most of our competition has just offered a raw sentiment score on stocks but no correlation with stock price movement. Our analytics have always maintained an 18- to 24-month gap between where we’re at compared to the rest of industry. By the time our competition catches up to our current system, we’ll have built version 3.0 with even more capability.
Rodney: Can you detail what picks you’ve had and what the gains have been since you started with your system?
Ben: Between October 2013 and September 2014, I had 112 documented trades on 45 positions with a 61.8% return.
Rodney: And what’s been your success rate?
Ben: 82.2% win ratio on 112 trades.
Rodney: Thank you Ben, and welcome aboard!
Rodney
P.S.
You can get more information on Ben’s Biotech Intel Trader here.
Ahead of the Curve with Adam O’Dell The Next Best Thing to a Crystal Ball
November 18, 2014
The Economy’s Ebb and Flow
Paul Krugman recently wrote an op-ed in The New York Times about the exit of Bill Gross from Pimco and why that happened because he didn’t understand that we’re in a deflationary or depression-like economy. He kept betting on interest rates rising on a lag from money printing or quantitative easing (QE) but that never happened and his massive bond fund suffered.
I don’t agree with Paul Krugman about too many things, but I do agree with one of his major points in that article.
He said that people like Gross and the gold bugs have a view of present government deficits that isn’t appropriate. The classic theory is that if the government borrows too much, it both tends to raise interest rates and to crowd out private borrowing.
And that does tend to be the case in most economic periods…
The Ups & Downs of an EconomyIn boom periods, businesses begin to expand, higher rates occur and there is little interest in bonds, especially when stocks are doing well.
This would definitely be the case during an inflationary period similar to the one that occurred during the late 1960s through the 1970s. New investment is a necessity when there are shortages of capacity, goods and high inflation rates. In this scenario, high rates and heavy-handed government borrowing become strong deterrents.
And it’s here where Krugman is right.
After the fall bubble boom of 1983 to 2007, both businesses and consumers over-borrowed and over-invested. Even when central banks reduce short-term interest rates to zero and long-term rates near or below zero real returns, businesses aren’t lining up to borrow, nor are consumers (especially the older baby boomers who still dominate the economy).
Government deficits and increases in borrowing don’t compete with the private sector. The chart below shows how private debt has deleveraged or shrunk slightly since the crisis of 2008, while government debt levels have continued to soar.
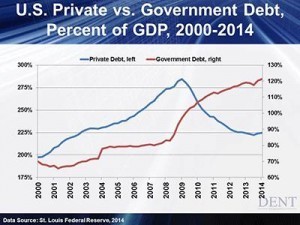
Has inflation gone up with $4 trillion of money printing and $7 trillion and rising in deficits since 2008? No, it has actually fallen.
Has government borrowing crowded out business? Definitely not. They have just used most of what they have borrowed to buy back their own stock and increase earnings per share, as most don’t need more plant and capacity.
Deflationary periods occur once in a lifetime when debt bubbles cause over-expansion and financial asset speculation. When those bubbles deleverage and debt and wealth is rapidly destroyed, you have less money chasing the same goods which is the classic definition of deflation!
But that’s as far as I agree with Krugman.
Stimulus EndsDespite the fact that the Fed brought QE to an end, he still thinks the government should have run deeper deficits and had more money printing to offset the decline and debt deleveraging of the private sectors — classic Keynesian economics. That represents an even greater misunderstanding of the dynamics of the economy than the concept held by the gold bugs.
He, like most economists would like to see an economy that grows at 3% to 4% with 1% to 2% inflation and with no recessions — ever!
He, who has never run a business, doesn’t understand that the innovation that underpins free-market capitalism is driven by the play of the opposites of many factors, like boom and bust, inflation and deflation, innovation and creative destruction, success and failure.
The greatest innovations come in challenging periods of busts and high inflation or deflation — NOT in economists’ dream economy of 3% growth and 2% inflation.
It’s human nature to overdo and over shoot everything. That’s why the economy and markets have natural mechanisms for re-balancing. Inflation stimulates investments that bring inflation down and then benefit the economy for decades to come — the killer apps like the assembly line in 1914 and the PC in the late 1970s.
Deflation is where you see the most radical long-term innovations from autos, electricity and phones in the late 1800s to TVs, automated appliances the computer and jet engines in the 1930s and 1940s. Excessive debt needs to be washed out when it’s no longer useful for the future and was largely built around speculation, not productive capacity.
At least the gold bugs understand that you don’t get something for nothing and that you can’t borrow your way out of a debt crisis. They just don’t get the impacts from much farther back in history (1930s) of what actually happens when a debt and financial asset bubble deleverages.
But Krugman and most economists don’t understand the most fundamental dynamics of the economy… at all!
If Krugman had his way with endless money printing, the economy will never rebalance and we would have gone into a coma economy like the one the Japanese have been in for 25 years now and not yet come out of it.
I have faith and strongly predict that the markets are going to win in the next five or more years and we’ll get a great reset or depression that deleverages the whole system and lays fertile ground for the next spring boom from 2023 into 2036 forward.

Harry
Central Banks and Quantitative Easing
I saw Harry at a planning meeting this week and as we were “talking shop” about the markets, we could only shake our heads in acknowledgement of the Fed’s lingering lift on the market.
We agreed the Bank of Japan’s Halloween day stimulus announcement had the feel of a coordinated “baton passing.” Whether it truly was or not, investors have taken comfort in the fact that some central bank still has its foot on the gas, even if it’s not the Fed.
And the European Central Bank (ECB) has its foot hovering on that same pedal.
Speculation is mounting that its stimulus efforts are long overdue. And we think it’ll be a classic case of “too little, too late” as the euro zone is on the razor’s edge… nearing a dip below the zero line for both economic growth and inflation.
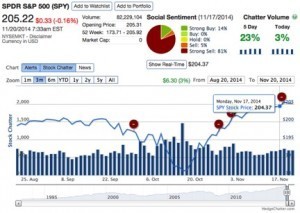
While the S&P 500 is up an astonishing percentage since the middle of October, momentum maxed out during the first week of November and prices stopped pushing higher last week.
As I see it, we could be in for a pullback this week and next.
For now though, let’s take a closer look at these trends as we go around the market in 10 seconds…
• Global stock markets really only eeked out a small gain last week with the exception of Chinese stocks, which gained a solid 3%. Interestingly, the Nasdaq gained a nice 1.6%, while the small-cap Russell 2000 index trailed with a 0.10% gain.
• Bond markets were mostly lower last week, led by a steep decline in junk bonds (JNK), which lost 0.8%.
• And commodity markets were split. Energy markets continued to fall sharply, with oil (USO) down 3.1% and natural gas down 7%. But we did see some movement with gold and silver. More information about that here.
All of this tells me that global markets are still in a state of flux as investors digest the Bank of Japan’s stimulus increase in keeping with the Fed’s backing away. Heavy-handed central bank stimulus seems likely to remain as the trend in force, although investors appear to be a bit more cautious than they were when the Fed was actively buying bonds.
And through year-end, all eyes are sure to be on the ECB – stay tuned.
Adam
Market Strategy for Hi-Tech Cars
Who doesn’t like being acknowledged when they do something nice? A simple nod when you hold the elevator or perhaps a wave when you let someone go in front of you in traffic… these are easy gestures that put positive karma into the world and should be done more often.
Of course, when the gift or courtesy is a bit larger, like helping a friend move or assisting a neighbor with a house repair, then the acknowledgment should also move up a notch. Pizza and beer come to mind.
Following this logic even farther, if the gift is really big then clearly the recipient should be going all out to thank the giver.
Which leads to my question: “Where’s the thank you?!”
Zero Emission VehiclesDuring the third quarter, automaker Tesla sold 7,785 of their very cool and very eco-friendly vehicles. While the cars aren’t completely emission free (it takes some energy to create the electricity that fuels the cars, and then there’s that nasty business of dealing with used batteries), they are far and away more efficient than traditional vehicles that run on petroleum products.
That’s nice, but apparently it’s not nice enough to turn a profit. Tesla lost $74.6 million during the quarter, which works out to roughly $9,600 per car they sold. It might not seem like it, but Tesla has a lot of people to thank for this… not for the loss, but for the fact that the loss wasn’t twice that amount per car!
Any car manufacturer that sells vehicles in California must comply with their emission standards. One of their regulations is that a certain percentage of every carmaker’s sales be zero emission vehicles (ZEV’s).
By selling ZEV’s, carmakers earn emission credits. If they have enough credits compared with their regular car sales, then they’ve met their obligation. If they haven’t, then they could be fined up to $5,000 for each lacking credit. That can become very expensive.
The problem is that many companies that make cars either don’t have true ZEVs or the ones they do have are poor sellers compared to their regular fleet. Other than the Nissan Leaf , most carmakers aren’t having much luck with their electric vehicles, which means they are woefully short in meeting their emission credit goals.
Tesla, however, sells only ZEV’s, so it generates many more credits than it needs… and a market is born! Tesla sells its excess emission credits to other manufacturers. The rate of sales depends on a number of factors, like how many cars Tesla has sold as well as the number of ZEV’s other manufacturers have been able to sell.
Last quarter, Tesla sold $93 million of emission credits to other carmakers. That works out to just under $12,000 per Tesla vehicle sold. Without this bump in revenue, Tesla’s loss would have been $167.6 million, or roughly $21,600 per car.
For everyone in California who bought a car other than a Tesla last quarter, there’s a good chance that Tesla owes you a very, very big thank you! Of course, this trickles down to Tesla owners as well.
Without the bump in revenue from Honda, Toyota, Chevrolet and Ford buyers among others, chances are the cost of a Tesla would be a touch more than it is today.
So if you’re driving a spiffy new version of one of those other brands, the next time you see a Tesla, if the driver doesn’t say thank you, feel free to cut them off in traffic for being ungrateful.
Rodney
Ahead of the Curve with Adam O’Dell The Lingering EffectNovember 14, 2014
Stocks Don’t Like Negativity
This week we saw the winners and losers shake out from many of the earnings reports that were released for the biotech sector. However, it’s funny how a company can beat earning expectations but still have its stock price move in an opposite direction? To sleep better at night, we need to take a look at all the forcing functions on a stock’s price, including its social media footprint.
Looking at a Company’s income statement and balance sheet for earnings is like looking at the final score of a football game after it’s been played. Sure the information is black and white but what really happened during the game/quarter to get there? Did you agree with the coach’s/CEO’s play calling and strategy? Did you develop an opinion or perception before the final whistle blew?
We now live in a very connected world where perception can become reality rather quickly… and it can be good or bad. The good news is that today we can measure perception using the massive amounts of social media data we have. My Social Media Collective Intelligence (SMCI) system ingests 2.4 million financial messages a day to give me a snapshot of the world’s perception at any given time.
Once perception is known, a fuller picture of a company can be gained, which ultimately leads to better trading decisions. If a company does have strong numbers on paper, but the general public has lost trust, faith, and confidence in its leadership or its mission, doubt starts to enter into people’s minds, leading to negative price implications.
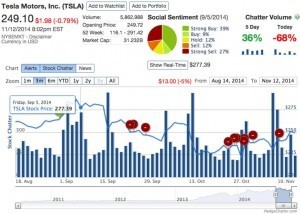
Back on September 5, Elon Musk, the founder and CEO of Tesla Motors made comments after a press conference about how investors often “get carried away” with electric car company’s stock price. He then proceeded to say: “I think our stock price is kind of high right now.” In trading that afternoon Tesla’s stock price went down more than 3%. By the end of September it slid more than 12%.
As you can see from the chart outlining TSLA’s stock price over the number of social media chatter messages, the social media sentiment shifted to a very negative outlook after these comments, (red alert circles) forecasting the downward spiral in price.
I’ve identified numerous other profit opportunities just like in my trading Biotech Intel Trader service. If you’re interested in seeing the full picture, check out my trading service .
As always, I’ll continue to monitor the market’s social media collective intelligence and keep you updated on the latest trends.

Ben


